Abstract
Twelve sherds of blue-and-white Chinese porcelains recovered from archaeological excavations in the Santana Convent (Ming and Qing Dynasties) in Lisbon were studied using several non-invasive spectroscopies, namely micro-Raman, X-ray Fluorescence (XRF), Ground State Diffuse Reflectance (GSDR), and stereomicroscopy. The use of the X-ray diffraction technique (XRD) allowed us to complete the mineralogical characterization of the ceramic bodies and glazes of the porcelains. The sample selection ranges from the 16th to the 18th centuries. The micro-Raman spectra clearly showed two types of glazes, alkaline glaze and calcium-based glaze. The GSDR absorption spectra of the blue glazes point to the use of different cobalt pigments, but a strong dependence on the glaze type does not seem to exist. The kilns where the porcelains were produced also play an important role. Both the GSDR absorption and the micro-Raman spectroscopies allow us to differentiate the Iranian blue pigment from the Chinese pigment. A direct and simple correlation between the use of Iranian blue pigment, mixtures of Iranian and Chinese pigments, or simply Chinese pigments and the stylistic dating of each sample was established. Furthermore, several important spectroscopic characterizations could be achieved in this study.
Keywords:
Chinese porcelains (Ming and Qing Dynasties); Santana Convent; blue and white; micro-Raman; GSDR; XRD; XRF; SM 1. Introduction
In 1498, Vasco da Gama reached the Indian coast, establishing for the first time a maritime route that comprised the south of the African continent to the East, thus connecting Europe to Indian countries. On his return to Lisbon, blue and white porcelains were part of the cargo of his ships and were offered to the Portuguese King D. Manuel I and his wife. At the beginning of the 16th century (1517), Portuguese ships reached Canton and started trading directly with China, namely the blue and white porcelains, among many other goods. A permanent trading position was established in Macau in 1557 and, from then on, a regular commercial route was set up between that port and Lisbon. Spices, porcelains, silk fabrics, ivory, and many other imported products were stored in Lisbon and in many cases re-exported to other countries in Europe, turning Lisbon into a very important trading city in this century [1,2].
However, all this naval trading was greatly affected by the Spanish occupation of Portugal between the years 1580 and 1640. Dutch and English fleets gradually replaced Portugal in this international trade.
Many Portuguese vessels belonging to the “Carreira das Indias” were wrecked off the South African and West African coasts, in most cases either because of the difficulties of the Atlantic navigation faced at that time or due to military action [2,3,4,5].
Many Ming porcelain sherds were recovered off the South African coast, even allowing an approximate dating of each piece whenever the shipwreck dates were known [3,4]. Very interesting studies of Chinese porcelains dated from the 16th and 17th centuries have already been presented using sherds collected off the South African or West African coasts [3,4], although the number of samples and time gates of the porcelains used in those studies was limited.
Naturally, in Lisbon, many more sherds of Chinese porcelains could be recovered in archaeological works conducted in palaces, convents, monasteries, or simply in rich houses, due to the terrible 1755 earthquake that destroyed Lisbon almost entirely. So, in Lisbon and in the period ranging from the 16th to the 18th centuries, it was possible for us to gather samples to perform a detailed archaeometric study of those imported porcelains.
The Santana Convent was a women’s religious house, built in Lisbon under the patronage of King John III and of his wife, Queen D. Catarina, the construction of which occurred between 1561 and 1564. The convent remained operative until 1884, the year the last nun died, i.e., 50 years after the 1834 law, which abolished the religious orders and closed all convents and monasteries in Portugal. The religious women were commonly wealthy people, so, it is not a surprise that in the archaeological campaigns of 2002–2003 and 2009–2010, conducted by archaeologists Rosa and Mário Varela Gomes, a large quantity of imported Chinese porcelain (tableware or for decorative purposes) was recovered, mostly as sherds and in wells or garbage pits [6]. About one thousand five hundred sherds were collected at the archaeological work and were dated from the late 16th to the 18th centuries. Twelve sherds were selected for archaeometric characterization and are presented in Figure 1.

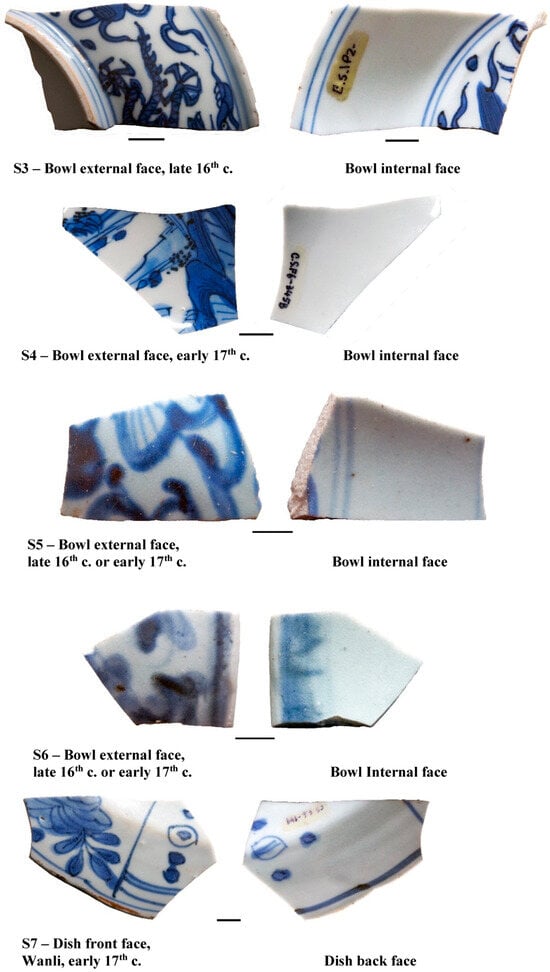
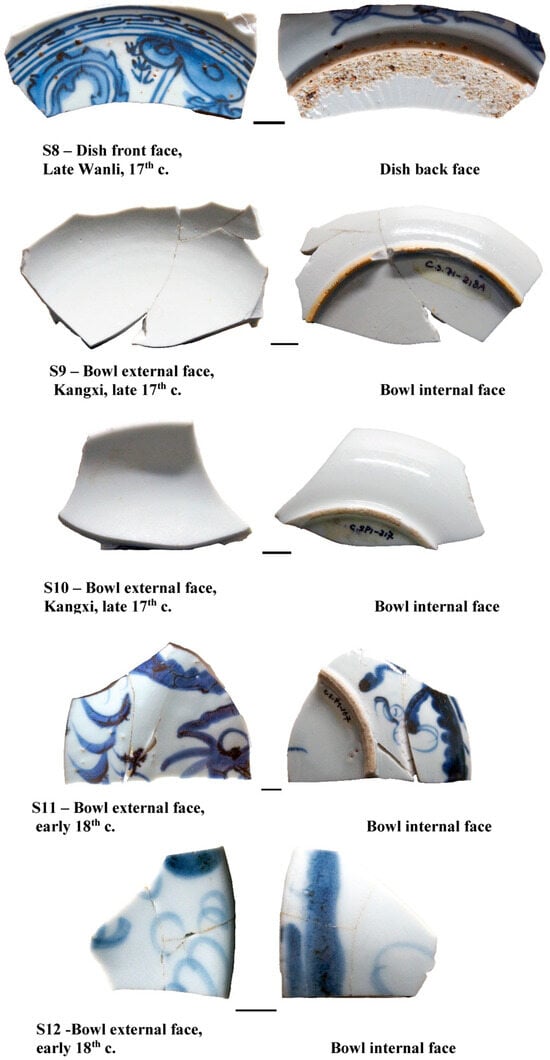
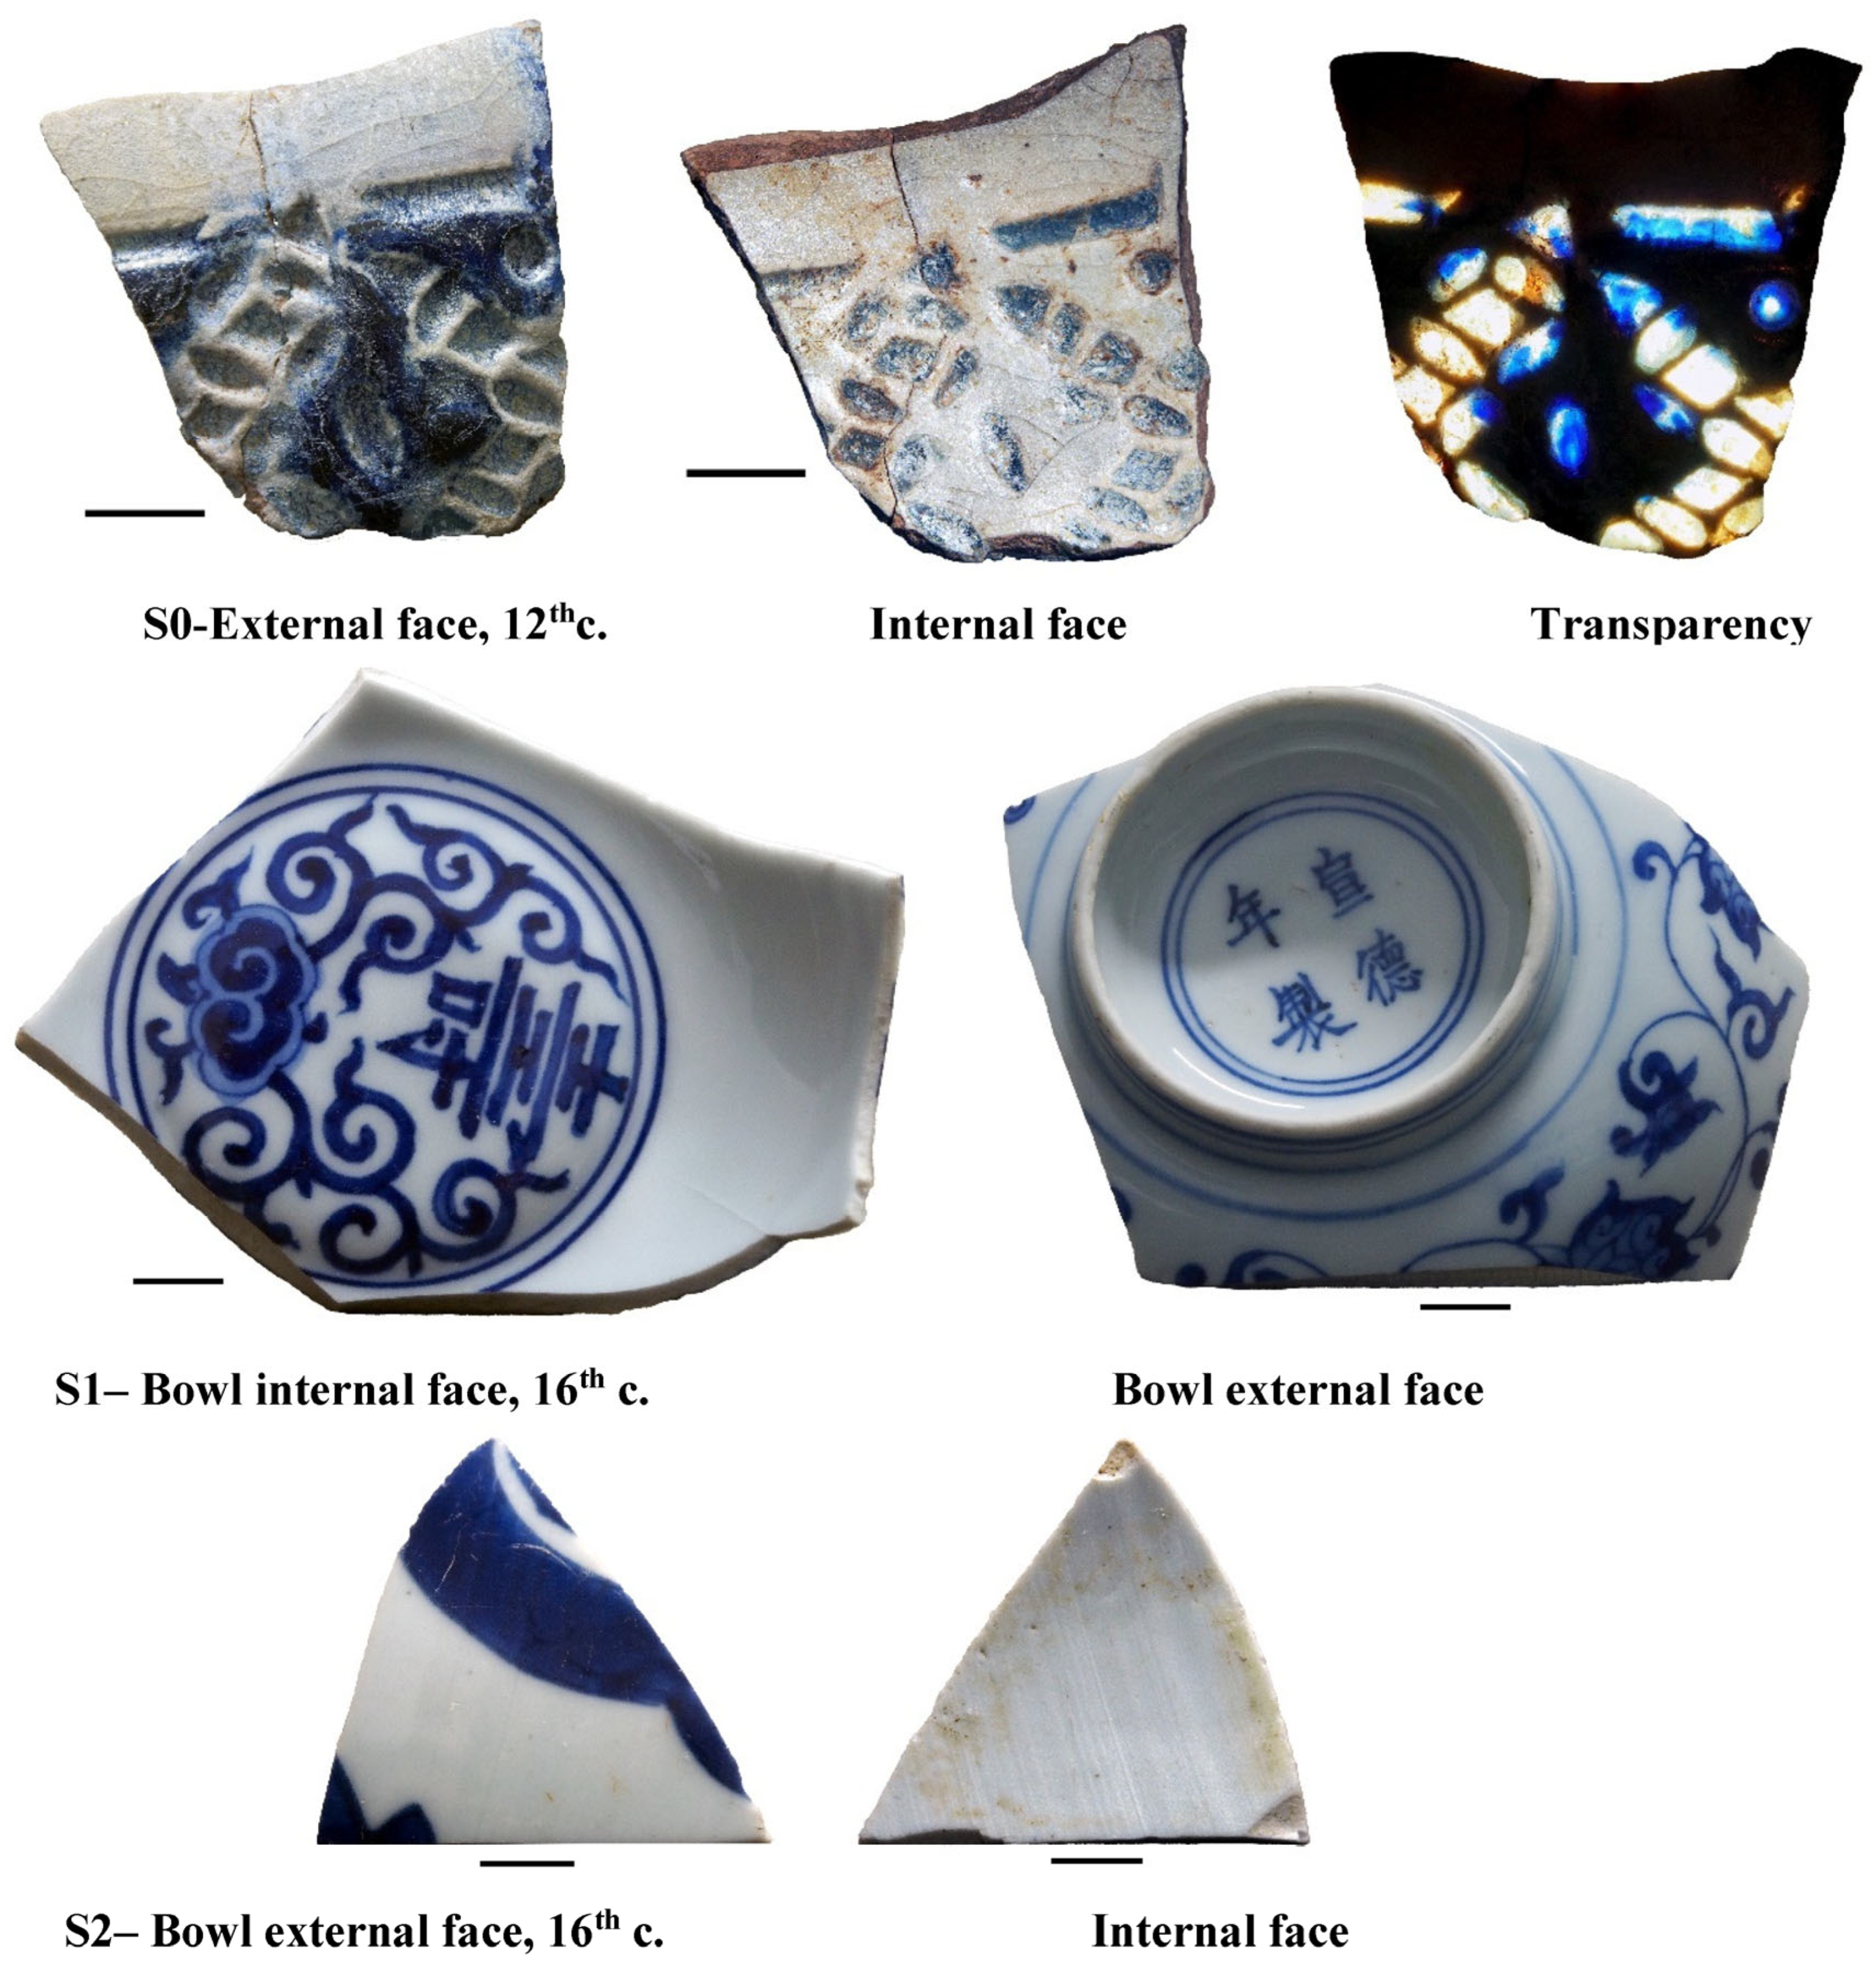
Figure 1.
Samples S1 to S12 are porcelain sherds collected from the Santana Convent, in Lisbon, dated from the 16th to 18th centuries. Sample S0 is a faience from Iran, 12th century, collected from the Silves Castle in the Algarve, south of Portugal. This S0 sherd was used for comparing the dark blue pigments from Iran to those used in the Chinese porcelains S1 to S12. Scale bar—1 cm.
1.1. The Samples Under Study
The samples presented in Figure 1 were collected in two wells (P) and an equal number of garbage pits (F) that offered various remains, which were discarded. The archaeological contexts, as well as the study carried out through iconography and macroscopic analysis of some porcelain, indicates that the examples found (P2-S3; S6; F6-S1; S4; S5; S7) were produced during the Ming Dynasty (including the Jiajing and Wanli reigns), while same other samples corresponded to the Qing Dynasty.
The bowl S1 was made in the Xuande reign (1425–1435) of the Ming Dynasty [6]. The bowl S1 has two marks, one on the inner bottom surface of a character indicating longevity. The mark on the outer surface of the bottom can be read as “Made in Xuande reign (1425–1435)”.
The fragments attributed to the Qing Dynasty may have been produced during the reigns of Qianlong (1735–1796) or his son Jiaqing (1796–1821).
To compare the pigments used to produce the Chinese porcelains, a sample from Iran, 12th century, found in the Castle of Silves (south of Portugal), was also studied. We call it sample S0.
All dates indicated in the legend of Figure 1 are based on a stylistic evaluation. The spectroscopic information that follows is, in some cases, consistent with this evaluation, but in some other cases, it is not, as we will show later.
1.2. Experimental
Micro-Raman spectroscopy is an excellent technique to identify the pigments used to decorate the surface of the glazed ceramic and to characterize both the glaze and, in many cases, the ceramic body itself. Micro-Raman investigations were carried out employing a Renishaw InVia Confocal Raman equipment in a back-scattering micro-configuration. A powerful 300 mW, 532 nm laser excitation (Cobolt, Samba model) and 100×, 50×, 20×, and 10× objectives in a Leica microscope. Most spectral collections were made with the use of a 50× or 10× long working distance objective. The spectral resolution of the Raman spectrometer was ~1 cm−1.
The Renishaw equipment has accurate confocal capabilities, enabling in-depth studies from the surface to about 150 μm. All Raman spectra were recorded at least in 5 different spots for each sample, and all spectra presented in this paper are representative of the samples under study. For the micro-Raman investigations, the analyzed spot had a ca. 10 microns diameter.
Data acquisition was performed with the Renishaw software Wire 4, and data processing, namely the baseline correction, was performed when needed, with the Wire 4 software or with the LabSpec software (v5.25) from Jobin Yvon.
GSDR experiments were conducted employing a home-built diffuse reflectance set-up, using an ICCD as detector and a W-Hal lamp as the excitation source. Three standards: Spectralon white and grey disks, and barium sulphate powder, were used to obtain the reflectance curves, and from them, the remission function was calculated. The analyzed spot had a ~1 mm diameter.
For elemental composition information, XRF analyses were performed using a Niton XL3T GOLDD spectrometer from Thermo Scientific (Munich, Germany). XRF spectroscopy provides elemental compositions of both glazes and ceramic bodies, while GSDR absorption spectra inform us about the color characterization. For the X-ray fluorescence (XRF), the analyzed spot had a 3 mm diameter.
To study the mineralogical and phase composition of the bodies and glazes of the porcelain sherds, XRD experiments of the powder crystalline phases were carried out using an X-ray diffractometer (Panalytical X’PERT PRO model), with CuKα radiation, at Centro de Estudos em Recursos Naturais e Ambiente, CERENA. The used measurement parameters were 2θ (5–70°); step size 2θ = 0.033°, and an equivalent scan step time of 80 s with generator settings of 35 mA and 40 kV. Only about 10 to 15 mg of powder samples were needed to perform an experiment, so this can be considered a micro-destructive technique. The use of powdered samples was mandatory for the equipment in use.
In the stereo microscopy (M) experiments, sherd features were observed using a Nikon SMZ645 stereomicroscope, and representative images were acquired using a Moticam 10.0 MP digital camera. For the stereo microscopy (SM) experiments, a scale bar is included for each sherd.
Further details regarding all these techniques were previously described in [5,7,8].
2. Results
2.1. GSDR Spectra Glazes and Ceramic Bodies
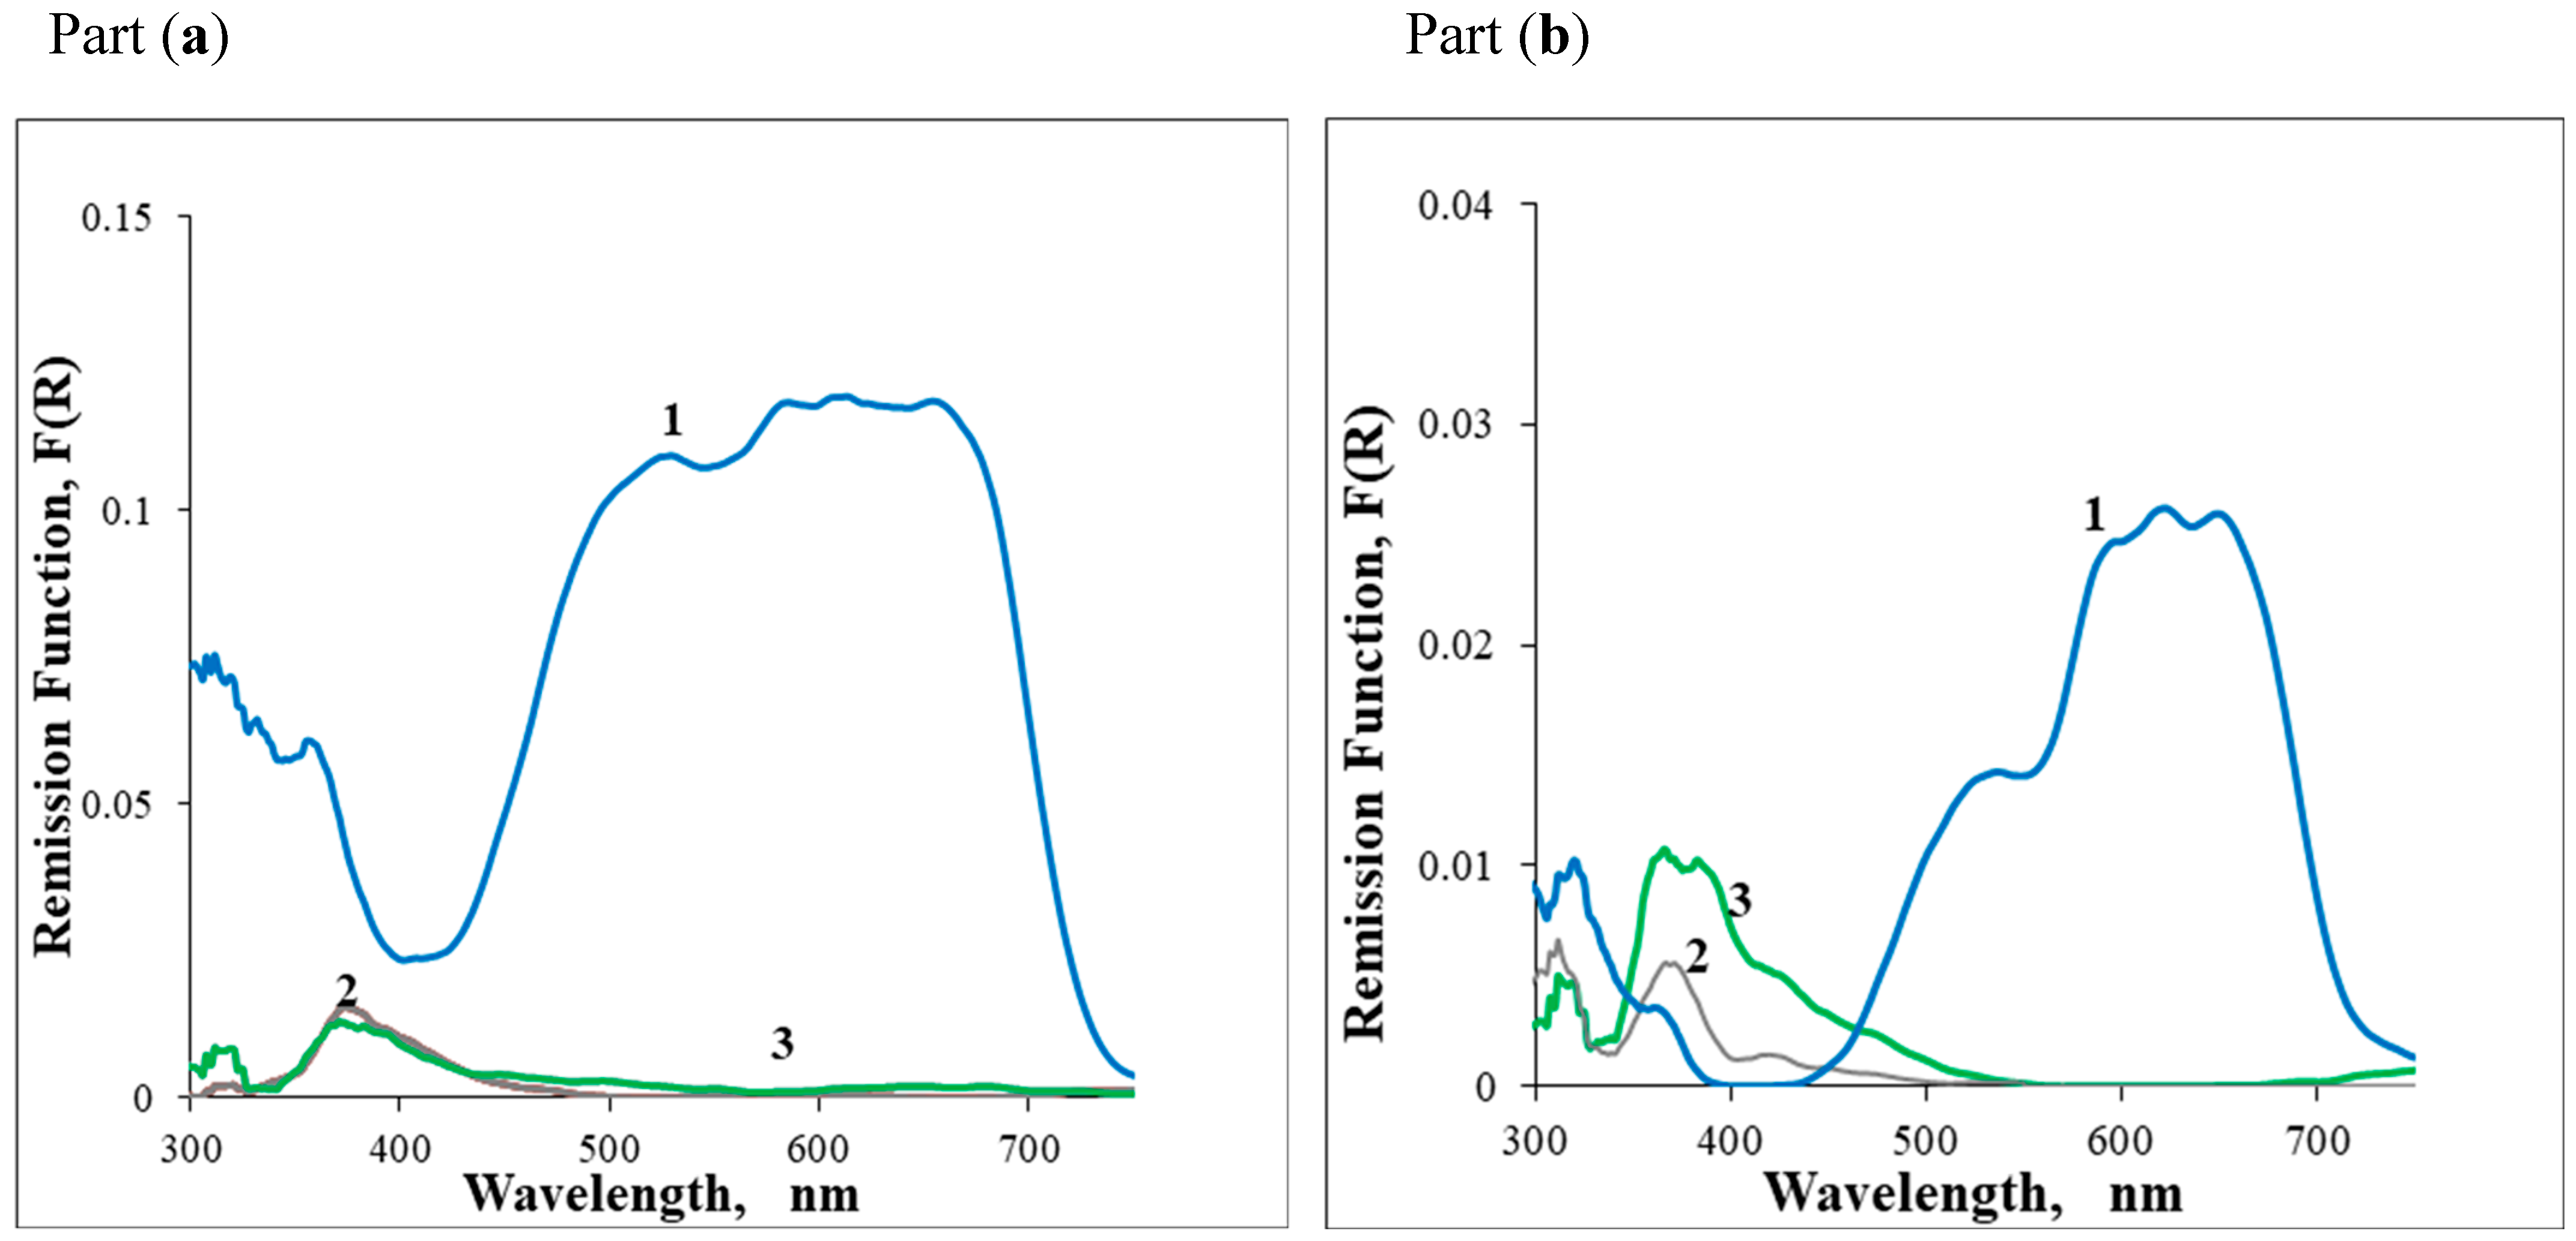
The GSDR spectra obtained for samples S1 and S2, both dated from the 16th century, are presented in Figure 2. From the reflectance curves (R) and using the Kubelka–Munk function F(R) = (1 − R)2/2R, the UV–Vis-NIR absorption spectra of the sherds could be obtained for the two cases. These data are presented in Figure 2a,b for the dark blue glaze and white glaze as well as for the ceramic body (paste).
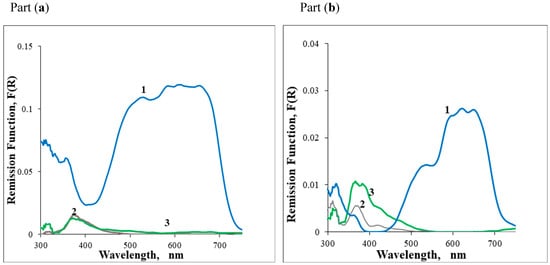
Figure 2.
Part (a)—GSDR absorption spectra of Sample S1, (1) Dark blue glaze, (2) White glaze, (3) Paste: Part (b)—Sample S2, (1) Dark blue glaze, (2) White glaze, (3) Paste.
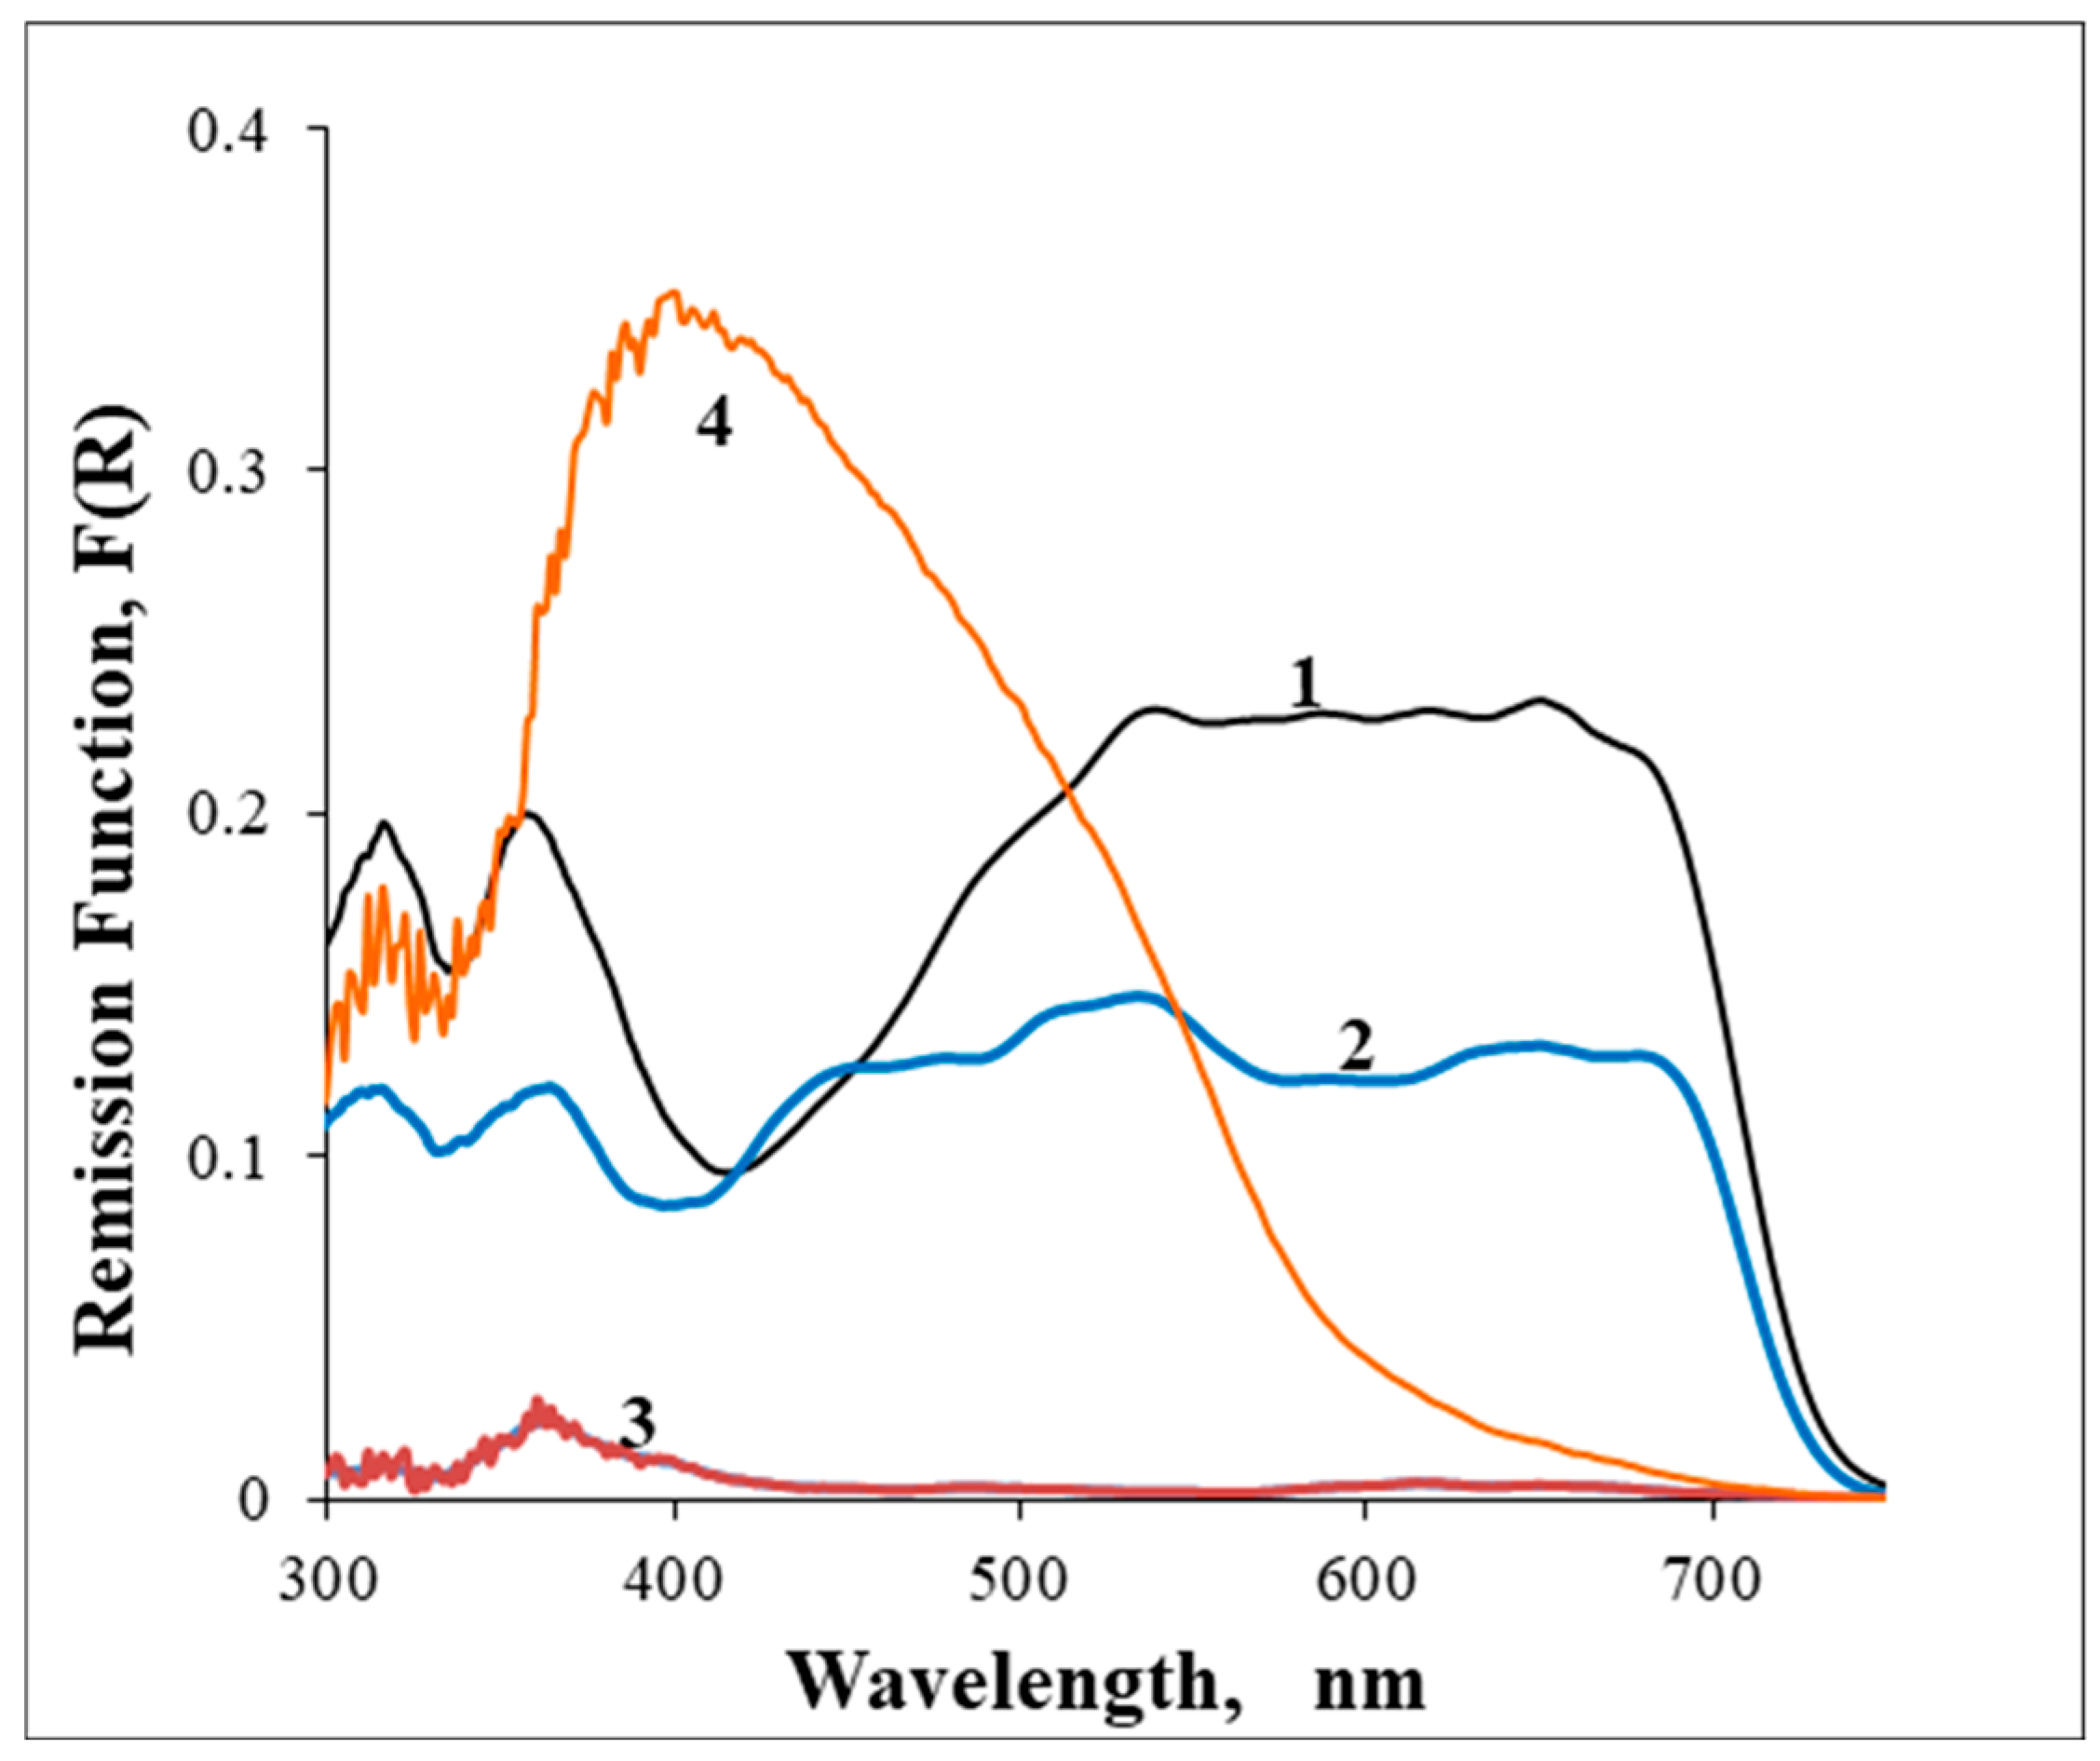
For comparison purposes, Figure 3 presents the GSDR spectra for an Iranian sherd to identify the blue pigment used for the porcelain manufactory.
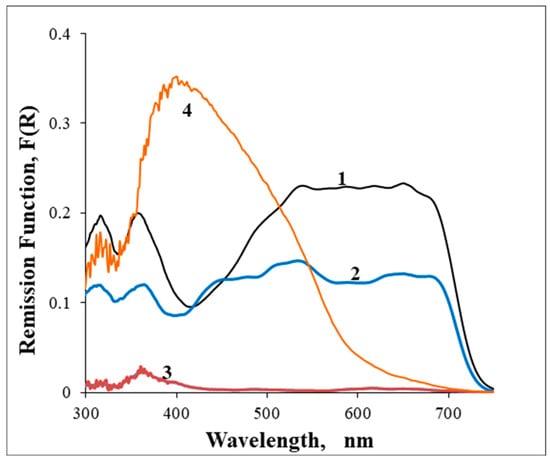
Figure 3.
GSDR absorption spectra of S0 Iran sample (1) Dark blue glaze, (2) Light blue glaze, (3) White glaze, and (4) Ceramic body.
Clearly, in the porcelains S0 and S1, the blue pigments are very similar, in contrast with the blue pigment used in the porcelain S2. The ceramic body absorption spectrum for S0 is quite different from the ones obtained for the porcelains S1 and S2, because that sherd is a faience, and the faience ceramic body is much darker than the porcelains.
The GSDR absorption spectra of the S2 sample are similar to those published for a Ming porcelain piece in a previous paper from our group [5]. The blue glaze has absorption bands at about 524, 596, and 650 nm in all cases, which are characteristic of Co2+ in a tetrahedral environment. These absorption bands derive from allowed electronic d-d transitions of Co2+ (from the 4A2(F) ground state to the 4T1(P) excited states [9]). Differences between the bands’ relative intensities observed on different samples can be ascribed to some variation in the glass matrix composition where the Co2+ ions are embedded [10,11,12]. However, in our study, this does not seem to be the case, because, as we will show later, the GSDR absorption spectra of the Iranian pigment were detected both in calcium-based and in alkaline glazes.
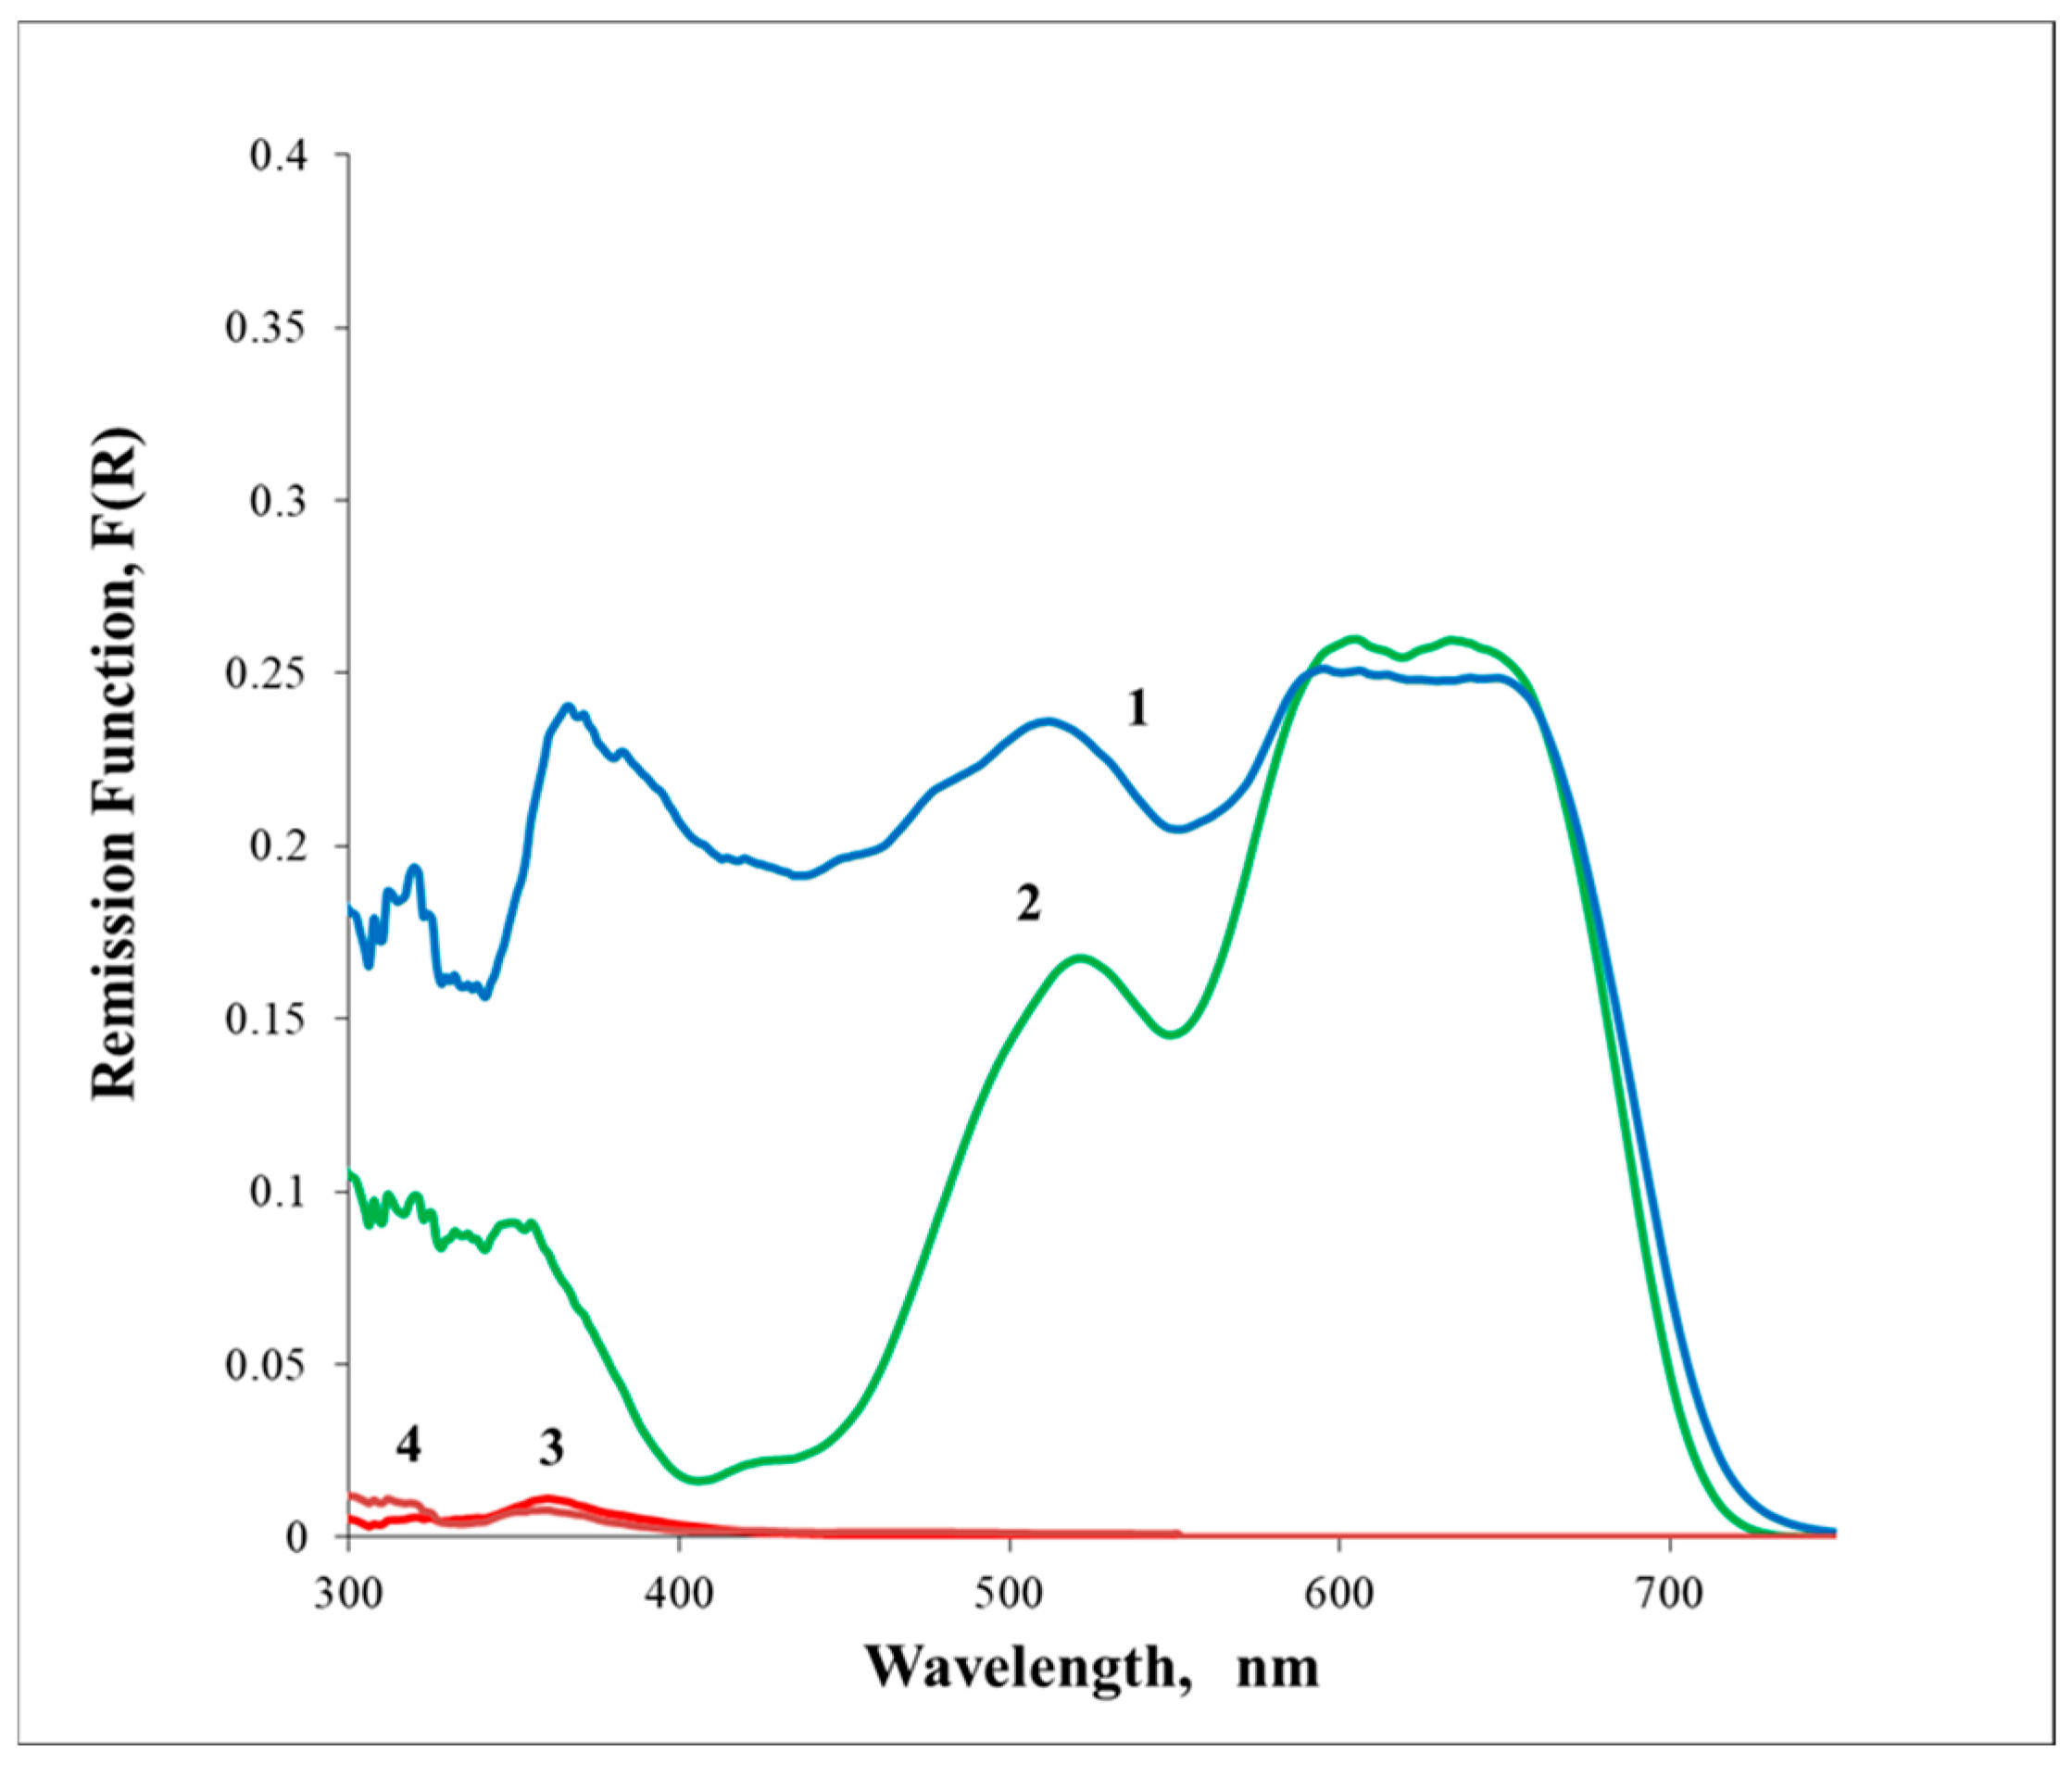
The blue glaze of samples S3 to S10 presents GSDR absorption spectra similar to the S2 sample. A remarkable exception was observed for samples S11 and S12, in which the dark blue absorption is Iranian type and the light blue is S2 type. Figure 4 presents the GSDR absorption spectra for sample S11, and similar data were observed for S12. At this stage, one is tempted to assign the GSDR absorption spectra of sample S2 to the Chinese pigment, and according to this assumption, samples S3 to S10 were made with the use of the Chinese pigment.

Figure 4.
GSDR absorption spectra of Sample S11, (1) Dark blue glaze, (2) Light blue, (3) White glaze, (4) Paste. Sample S12 exhibits a similar pattern.
2.2. Micro Raman Spectra for Glazes and Ceramic Bodies
Raman micro-spectrometry has been extensively used to investigate ancient ceramic art objects [13,14,15,16]. It is probably the most powerful non-destructive method of characterizing archaeological artifacts, namely glazed ceramics and colored glasses. It can be used to obtain information regarding the crystalline or glassy structures, which are built from covalent bonds between the SiO4 tetrahedra in different modes. The Raman parameters ratio of the bending (~500 cm−1) and stretching (i.e., ~1000 cm−1) envelopes, measured as the band area ratio (Ip). Ip being the index of polymerization, proposed by Colomban [17,18,19], can be correlated to the glaze composition and processing temperature of the kiln, namely establishing differences between silica-rich (strong band at ~500 cm−1 and a weak band at ~1000 cm−1) and lead rich glazes with the weak band at ~500 cm−1 and the strong band at ~1000 cm−1.
Between these two extreme situations, one may have calcium-based glazes and alkaline glazes (different flux/network former ratios), providing different Raman signatures [13,14,15].
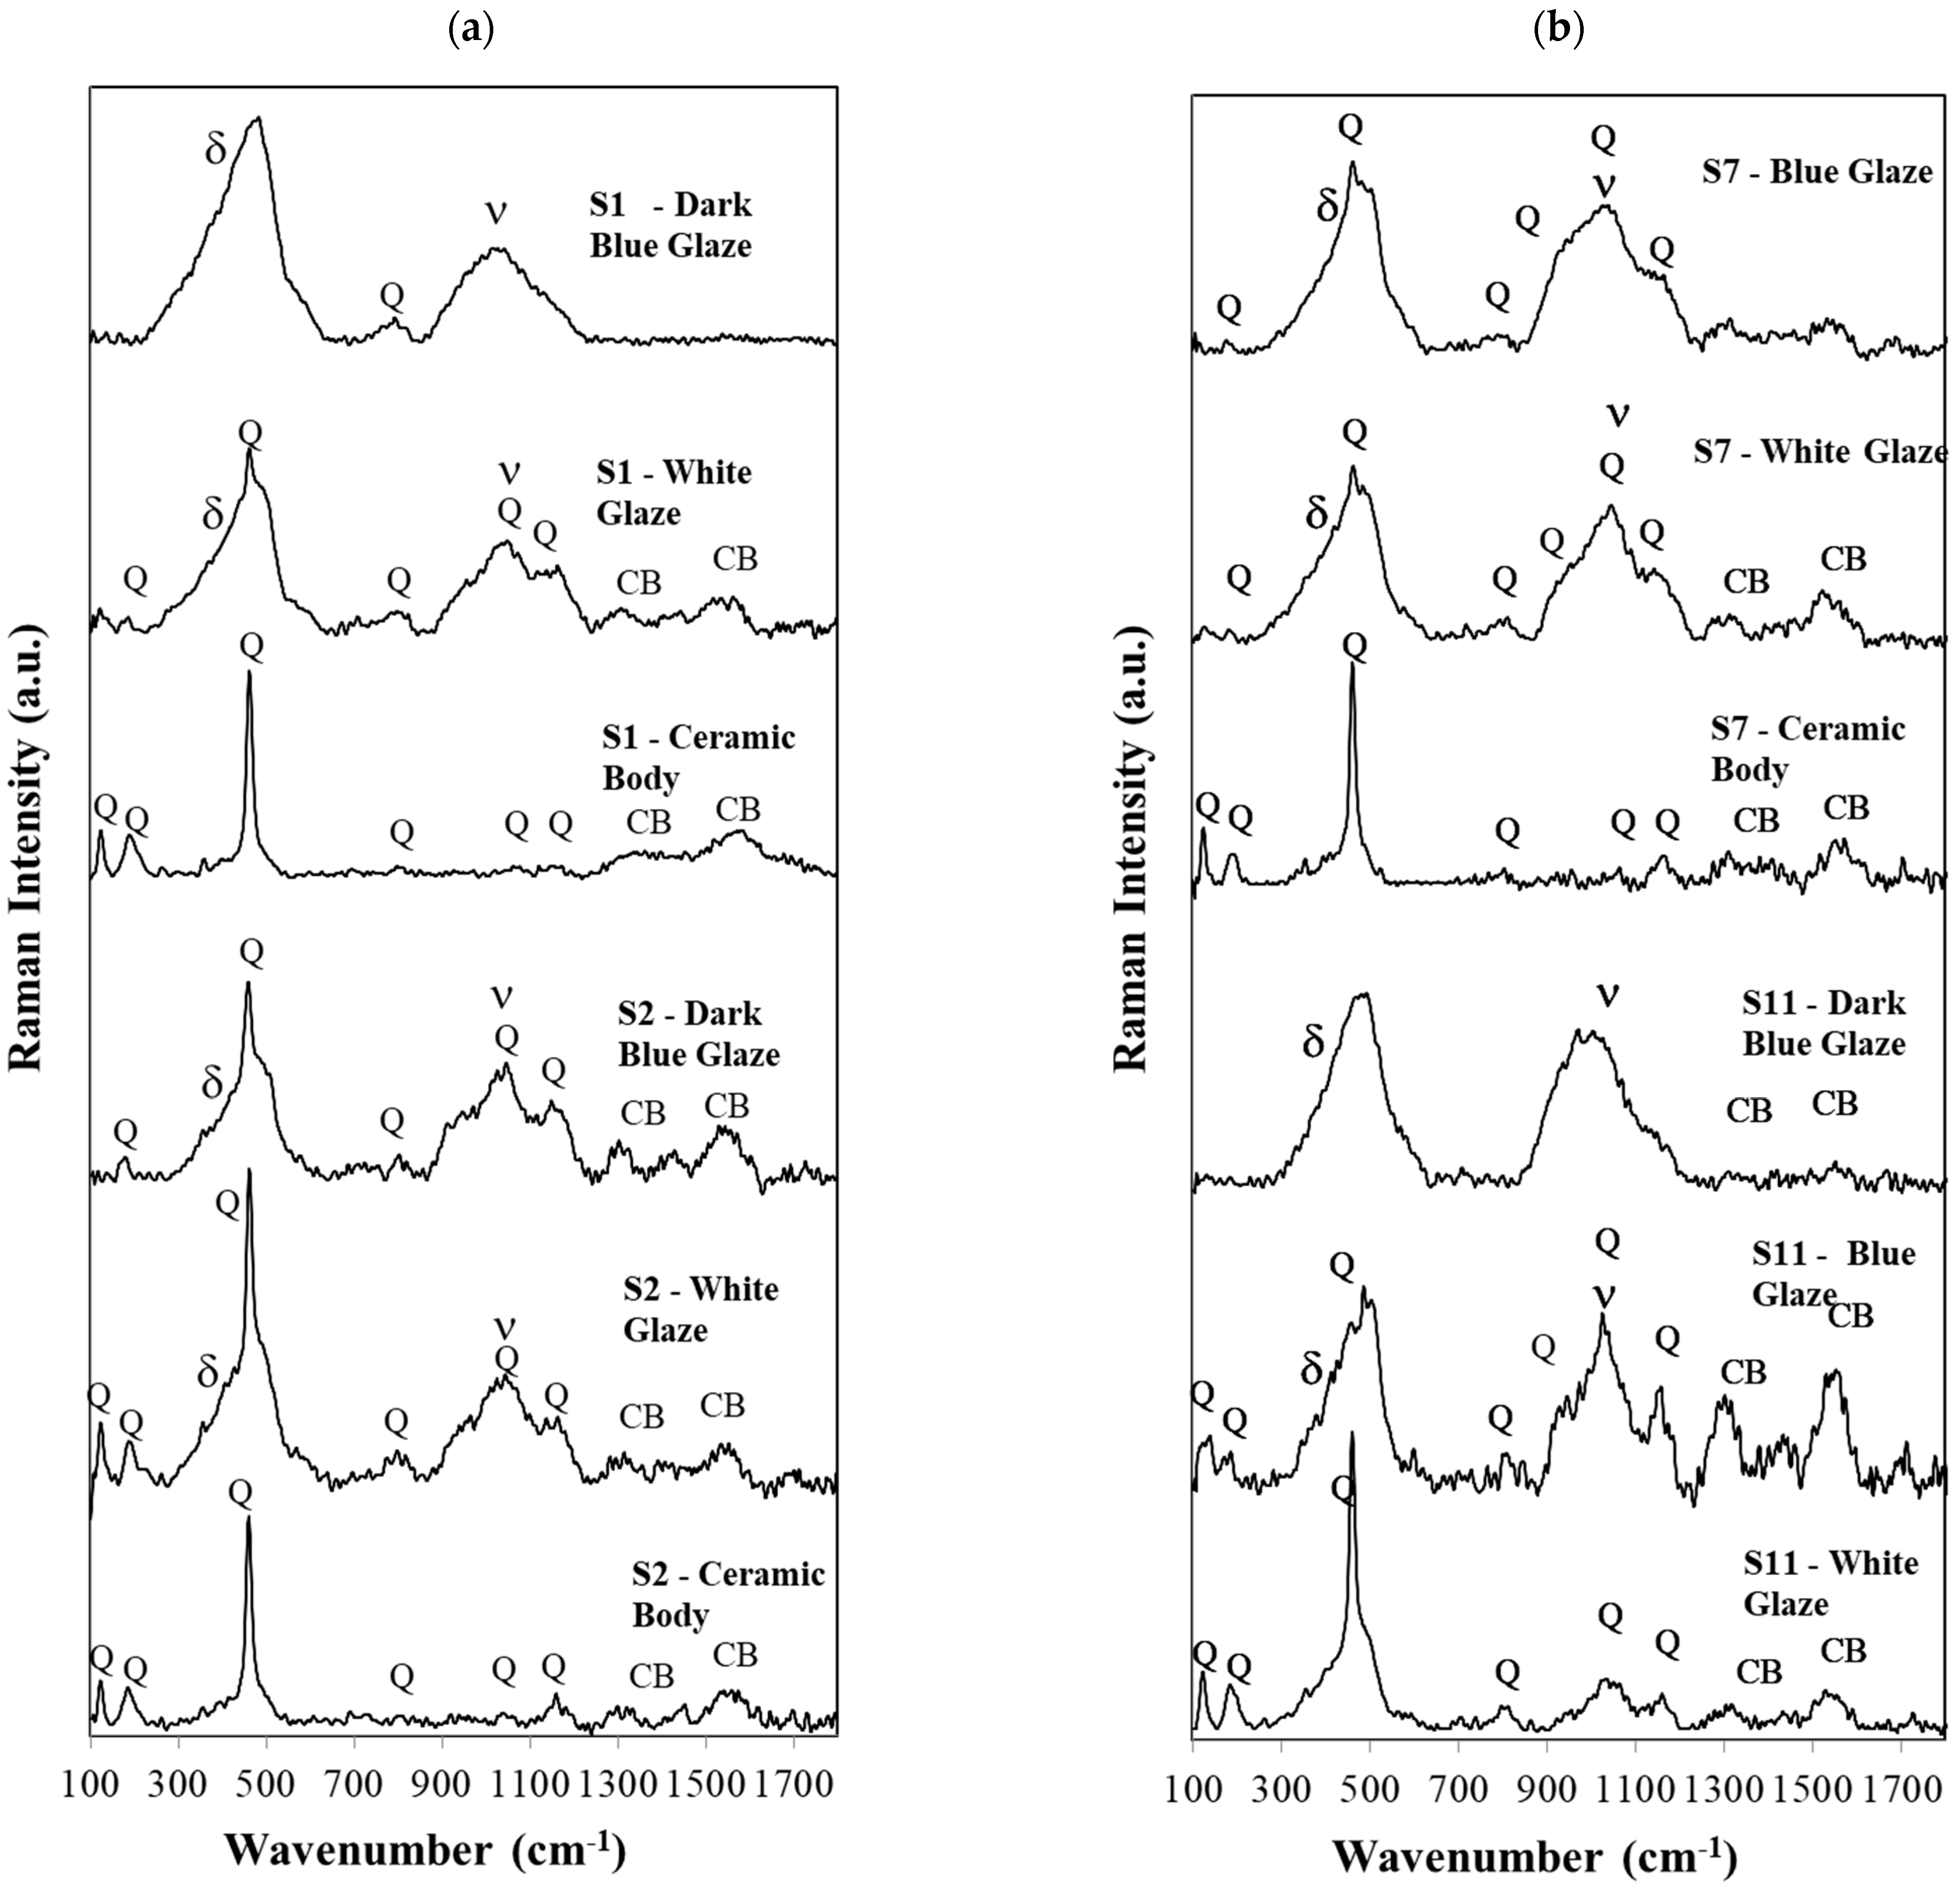
Figure 5a presents the micro-Raman spectra obtained for the S1 sherd for the dark blue glaze, white glaze, and ceramic body. For sherd S2, the sherd equivalent Raman spectra are also presented for comparison.
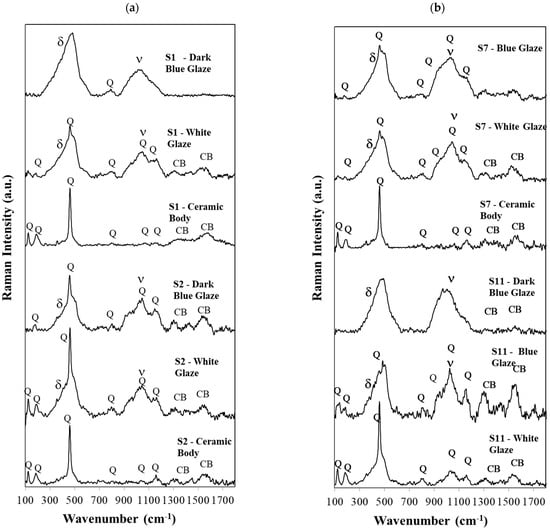
Figure 5.
(a,b)—In (a), the micro-Raman spectra obtained for the S1 sherd for the dark blue glaze, white glaze, and ceramic body are shown. For S2, S7, and S11, sherd equivalent Raman spectra are presented for comparison. S12 spectra are like S11. Q—Quartz, CB—Carbon Black, ν—stretching and δ—bending Raman envelopes of SiO2.
The first observation is that in samples S1 and S2, one cannot detect the Raman signatures of Co2SiO4 or CoAl2O4 as the ones published in references [4,5]. The same happens in all the other samples, S3 to S12 or S0. This means the Co2+ concentration is low in all cases and the Co2+ ions are simply dissolved in the glaze matrix, without the formation of a crystalline Co-based phase, and showing no specific Raman signature as reported in other cases for Chinese porcelains [4].
Surprisingly, the similarities are much more relevant than the differences for the dark blue and white glazes for samples S2 to S10. However, the dark blue glaze from S2 differs significantly from the S1 sherd, although they both are from the 16th century and, in principle, were produced with the cobalt pigment imported from Iran (the use of the Iran-imported cobalt pigment was predominant in the 16th century). Certainly, this is not the case, and the dark blue of porcelain S2 was produced with the use of a Chinese pigment, while for the dark blue of S1, an Iranian pigment was used.
The blue color of the Iranian pigment is so strong that one can only observe the bending and the stretching bands of SiO4, with maxima at about 483 and 1041 cm−1 and a small band at 793 cm−1 from the isolated tetrahedra (Q0) [13,14]. In sample S2, however, the Raman signature of crystalline quartz is superimposed on the bending and stretching envelopes as the dark blue curve of sample S2 or all white glaze curves in this figure clearly show. The same occurs for all S3 to S10 sherds. In these curves, the blue pigment is not as deep and strong as the Iranian pigment. All these cases were assigned to a Chinese pigment. In samples 11 and S12, both Iranian and Chinese pigments were used. In these two samples, even the Q0 band [13,14] is absent.
As referred to in the experimental section, we used a green laser, 532 nm, to obtain the Raman spectra for all our samples, regardless of whether they were the dark blue glaze, light blue glaze, white glaze, or ceramic body. In the case of the ceramic body, the Raman spectrum is dominated by the crystalline signature of quartz, although mullite is also present, as we will show later in the corresponding diffraction patterns (powder XRD technique). In Figure 5a,b, we do not label the small peaks at 505 cm−1 (and very rarely the 513 cm−1 peaks), but they exist and correspond to anorthite and to microcline formations, respectively, as again, the diffraction patterns will show later in the text.
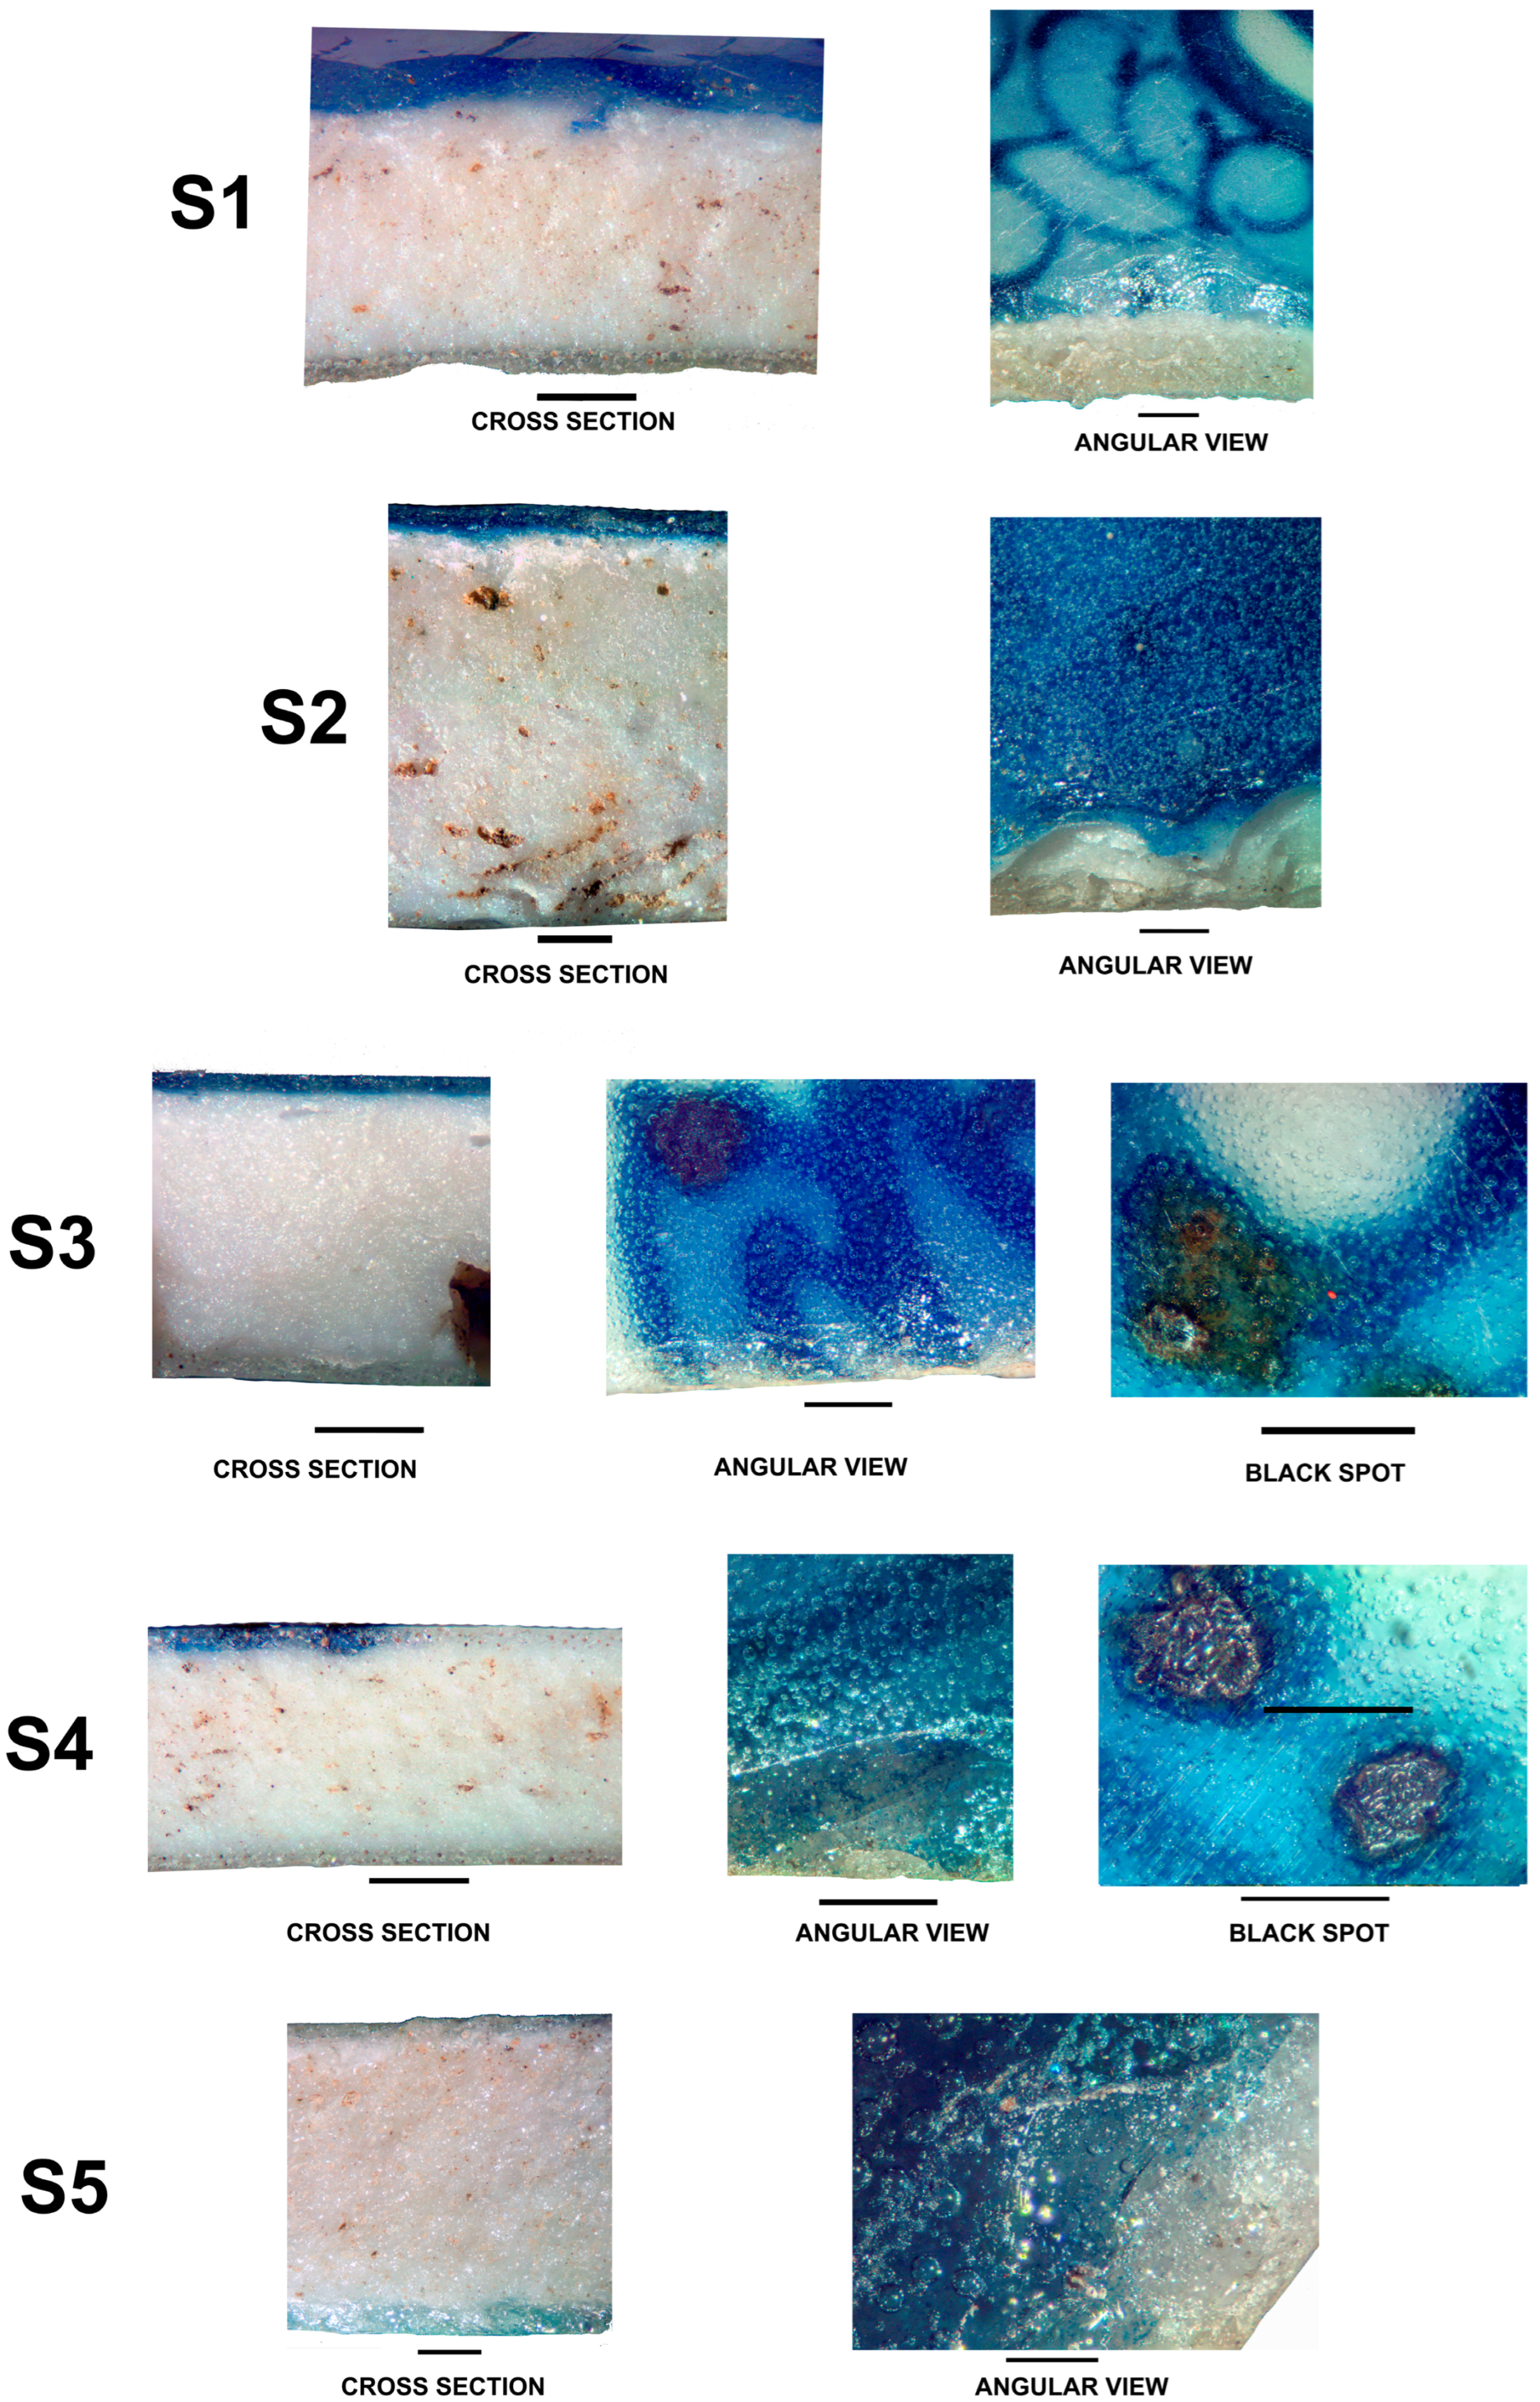
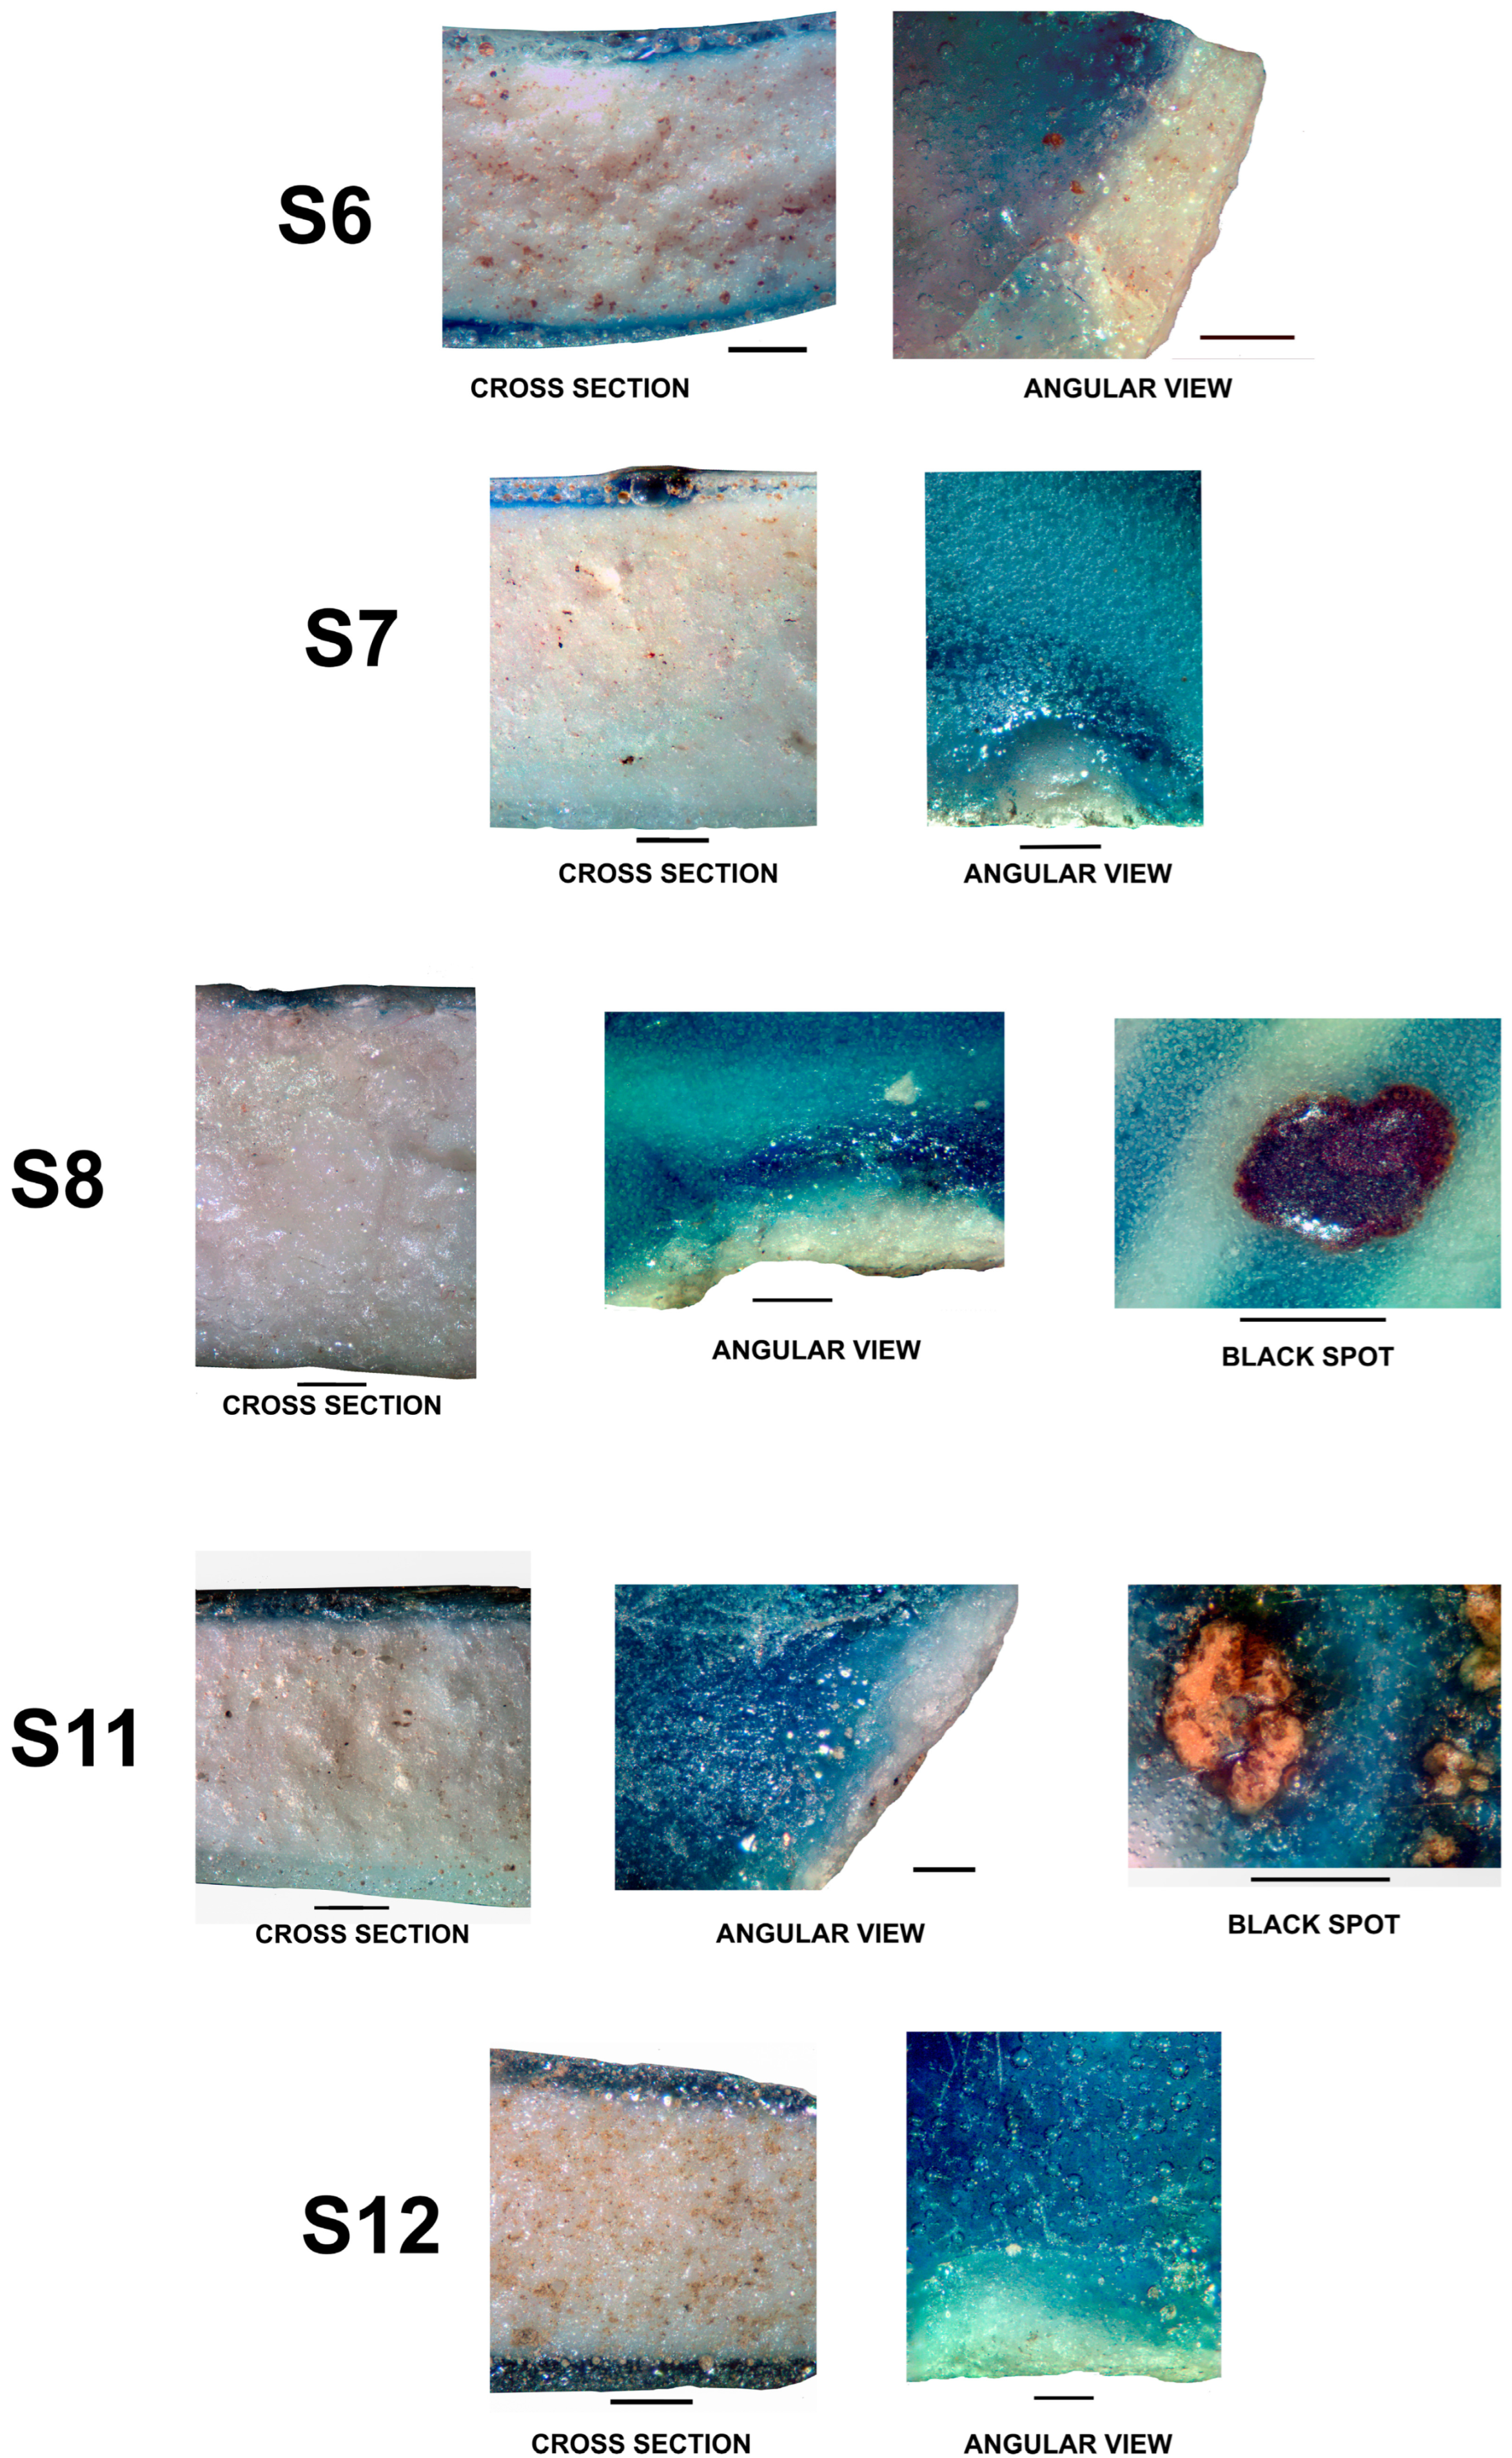
Carbon black is present in most Raman spectra of the 12 porcelain sherds. The carbon doublet is consistent with firing under a reducing atmosphere in the kiln, which helps achieve a brilliant blue decoration [4]. No calcium carbonate, gypsum, or anatase could be detected in our samples. However, an important assignment was achieved in the samples, evidencing the “black spots” shown in Figure 6. The Raman spectra of the “black spots” detected in samples S3, S4, S8, and S11 were identical, and indicate the presence of epsilon-Fe2O3, as assigned by Ph. Colomban in his recent publication reference [4].
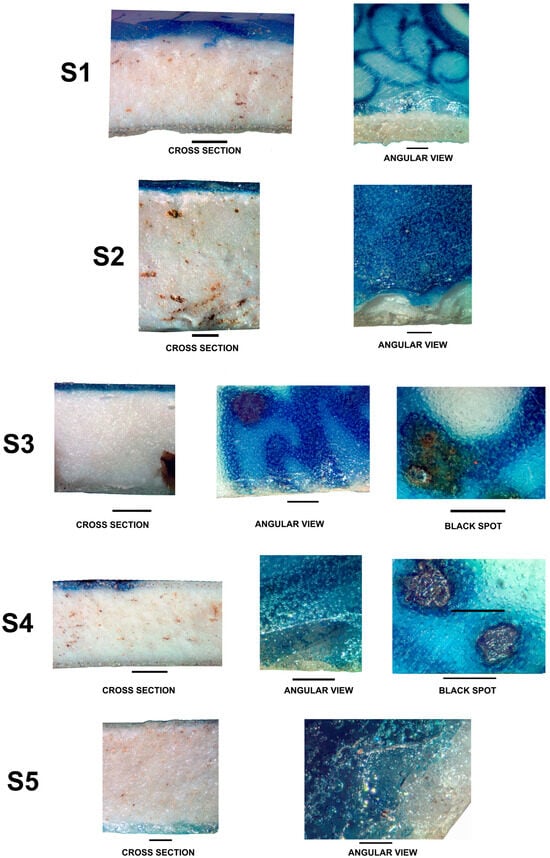

Figure 6.
Cross sections, angular views, and black spots, whenever these exist. Scale bar = 1.0 mm.
A further correlation with the polymerization index of Colomban (Ip) and a ratio of the funding agents/network formers mole ratio will be presented later.
2.3. Glaze and Body Microstructural Observations
A detailed examination of the porcelain sherds was conducted through systematic observations of the glazed surfaces, cross-sections, and fractured edges. Small flakes were extracted to enable angular inspections, providing insights into the technological and microstructural characteristics of the samples.
The analysis focused on several diagnostic parameters, including glaze purity—assessed through the presence of inclusions and exogenous particles—and glaze thickness. Particular attention was paid to the distribution and size of cobalt-blue pigment particles, allowing for the distinction between under-glaze, in-glaze, and over-glaze decorative techniques [16].
Additional features were documented, such as the size and spatial distribution of gas bubbles within the glaze matrix, and the occurrence of black spots and crystalline phase nuclei (neo-formation products) markers.
Cross sections and interfaces of samples S1 and S2, S3 and S4, S5 and S6, S7 and S8, S11 and S12, presented in Figure 6, were obtained with the use of a stereo microscopy device, providing some important information.
Measurements indicate that sherd thickness ranges from approximately 3 to 5 mm at the rims of bowls and dishes, increasing to 7 to 10 mm at the bases. Cross-sectional and interfacial analyses of all blue-and-white porcelain samples (S1, S2, S3, S4, S7, S8, S11, and S12) reveal a colored layer with thicknesses varying between 200 and 300 µm. Angular observations confirm that the blue-colored layer is primarily composed of fine pigment particles dispersed within the glaze matrix, indicative of an in-glaze decorative technique. In all images presented in Figure 6, the blue pigment is dispersed in the surficial glaze layer, and no over-glaze or under-glaze decorations were observed. In the angular views, the white layer is simply the ceramic body of the porcelain.
The conjugation of the cross-sectional images and angular views clearly shows that the blue pigment was applied in-glaze.
Notably, certain samples (S3, S4, S8, and S11) exhibit black spots, which can be categorized into two main types: (1) dendritic metallic-looking structures, and (2) euhedral light-colored crystalline assemblages, as observed in sample S11. The dendrites are epsilon Fe2O3 [17].
Both types often coexist within the same specimen, embedded in a glassy amber to brown matrix [18]. It is also observed that gas bubbles in these regions are consistently larger than those in the surrounding glaze, suggesting that gas release during the firing process plays a role in controlling the distribution and formation of these impurity features. This pattern aligns closely with the experimental results reported by [19], who demonstrated that partial gas entrapment during glaze melting promotes both the development of bubble-rich zones and the nucleation of crystalline inclusions.
2.4. XRD Data for Glazes and Ceramic Bodies
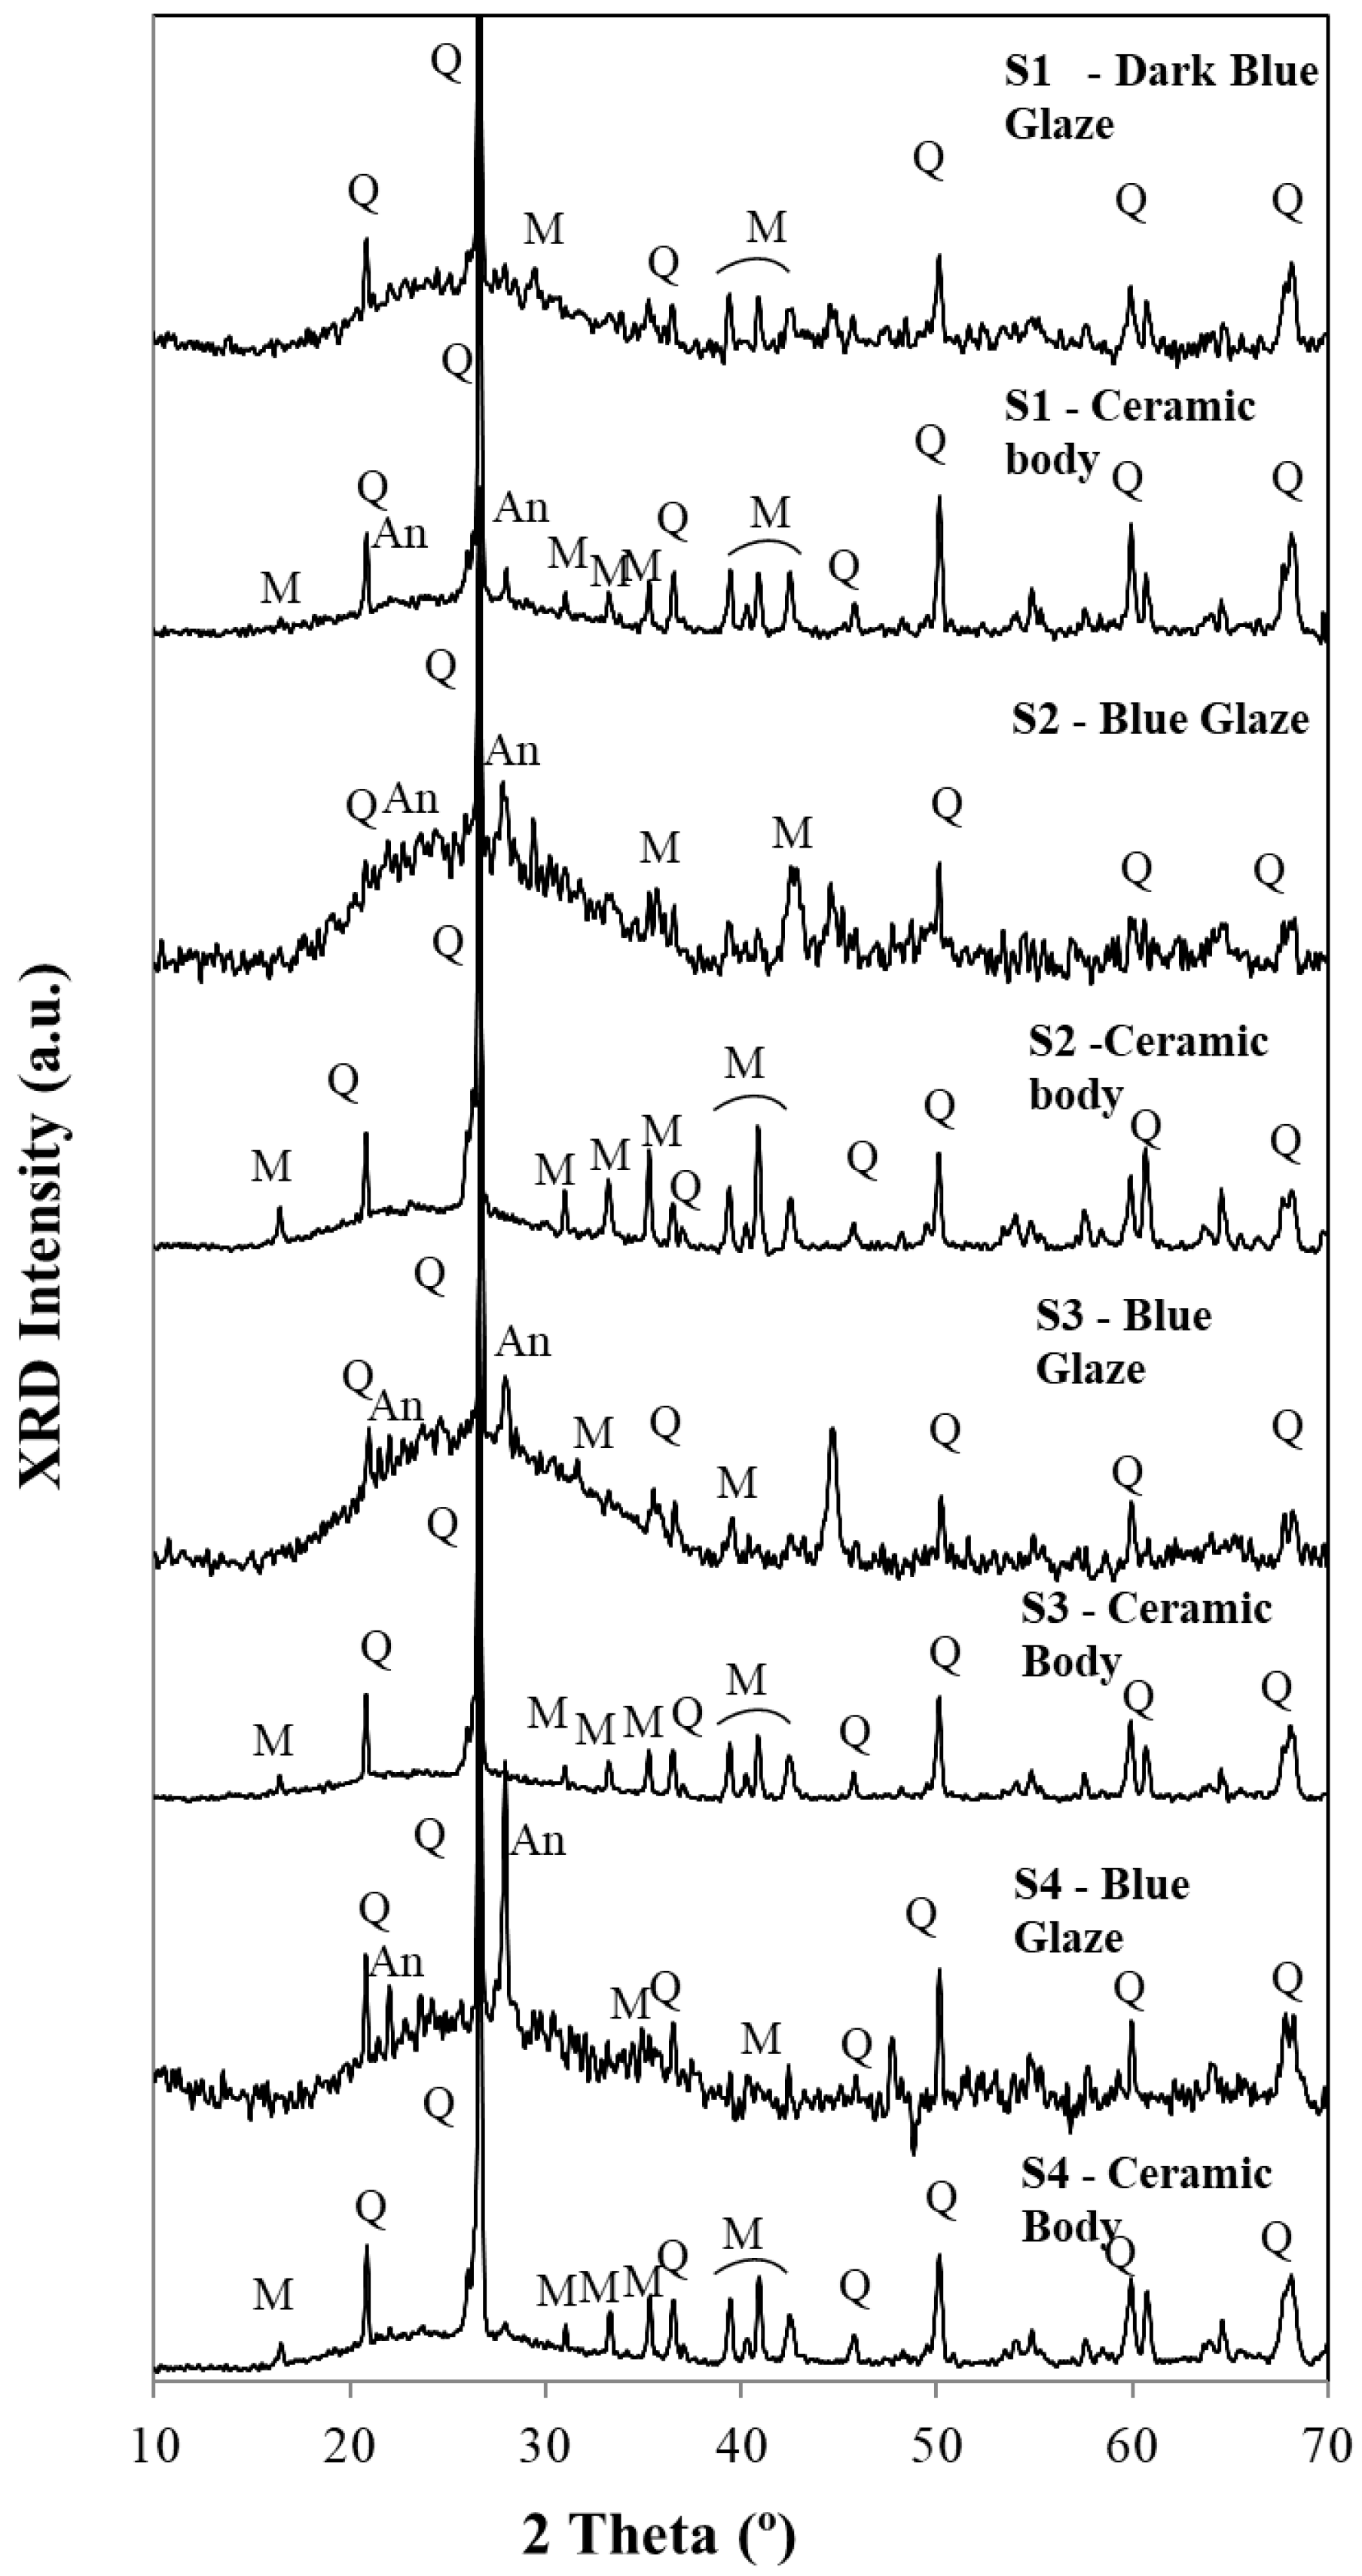
Ceramic bodies and glazes from all 12 samples from the Santana Convent underwent comprehensive analysis using X-ray diffraction (XRD powder method), which provided information on the mineralogical and phase compositions of each sherd. Figure 7 and Figure 8 show a striking resemblance between the two groups, ceramic bodies and glazes.

Figure 7.
Diffractograms for glazes and ceramic bodies for samples S1 to S4. Q—Quartz (SiO2), M—Mullite (Al2O3(SiO2)2), An—Anorthite (CaO. Al2O3 (SiO2)2).
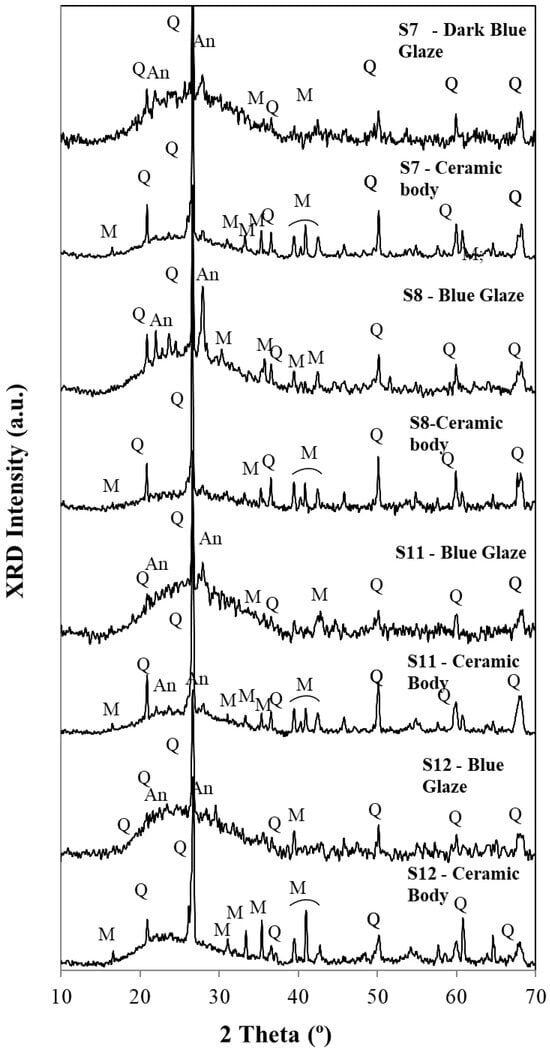
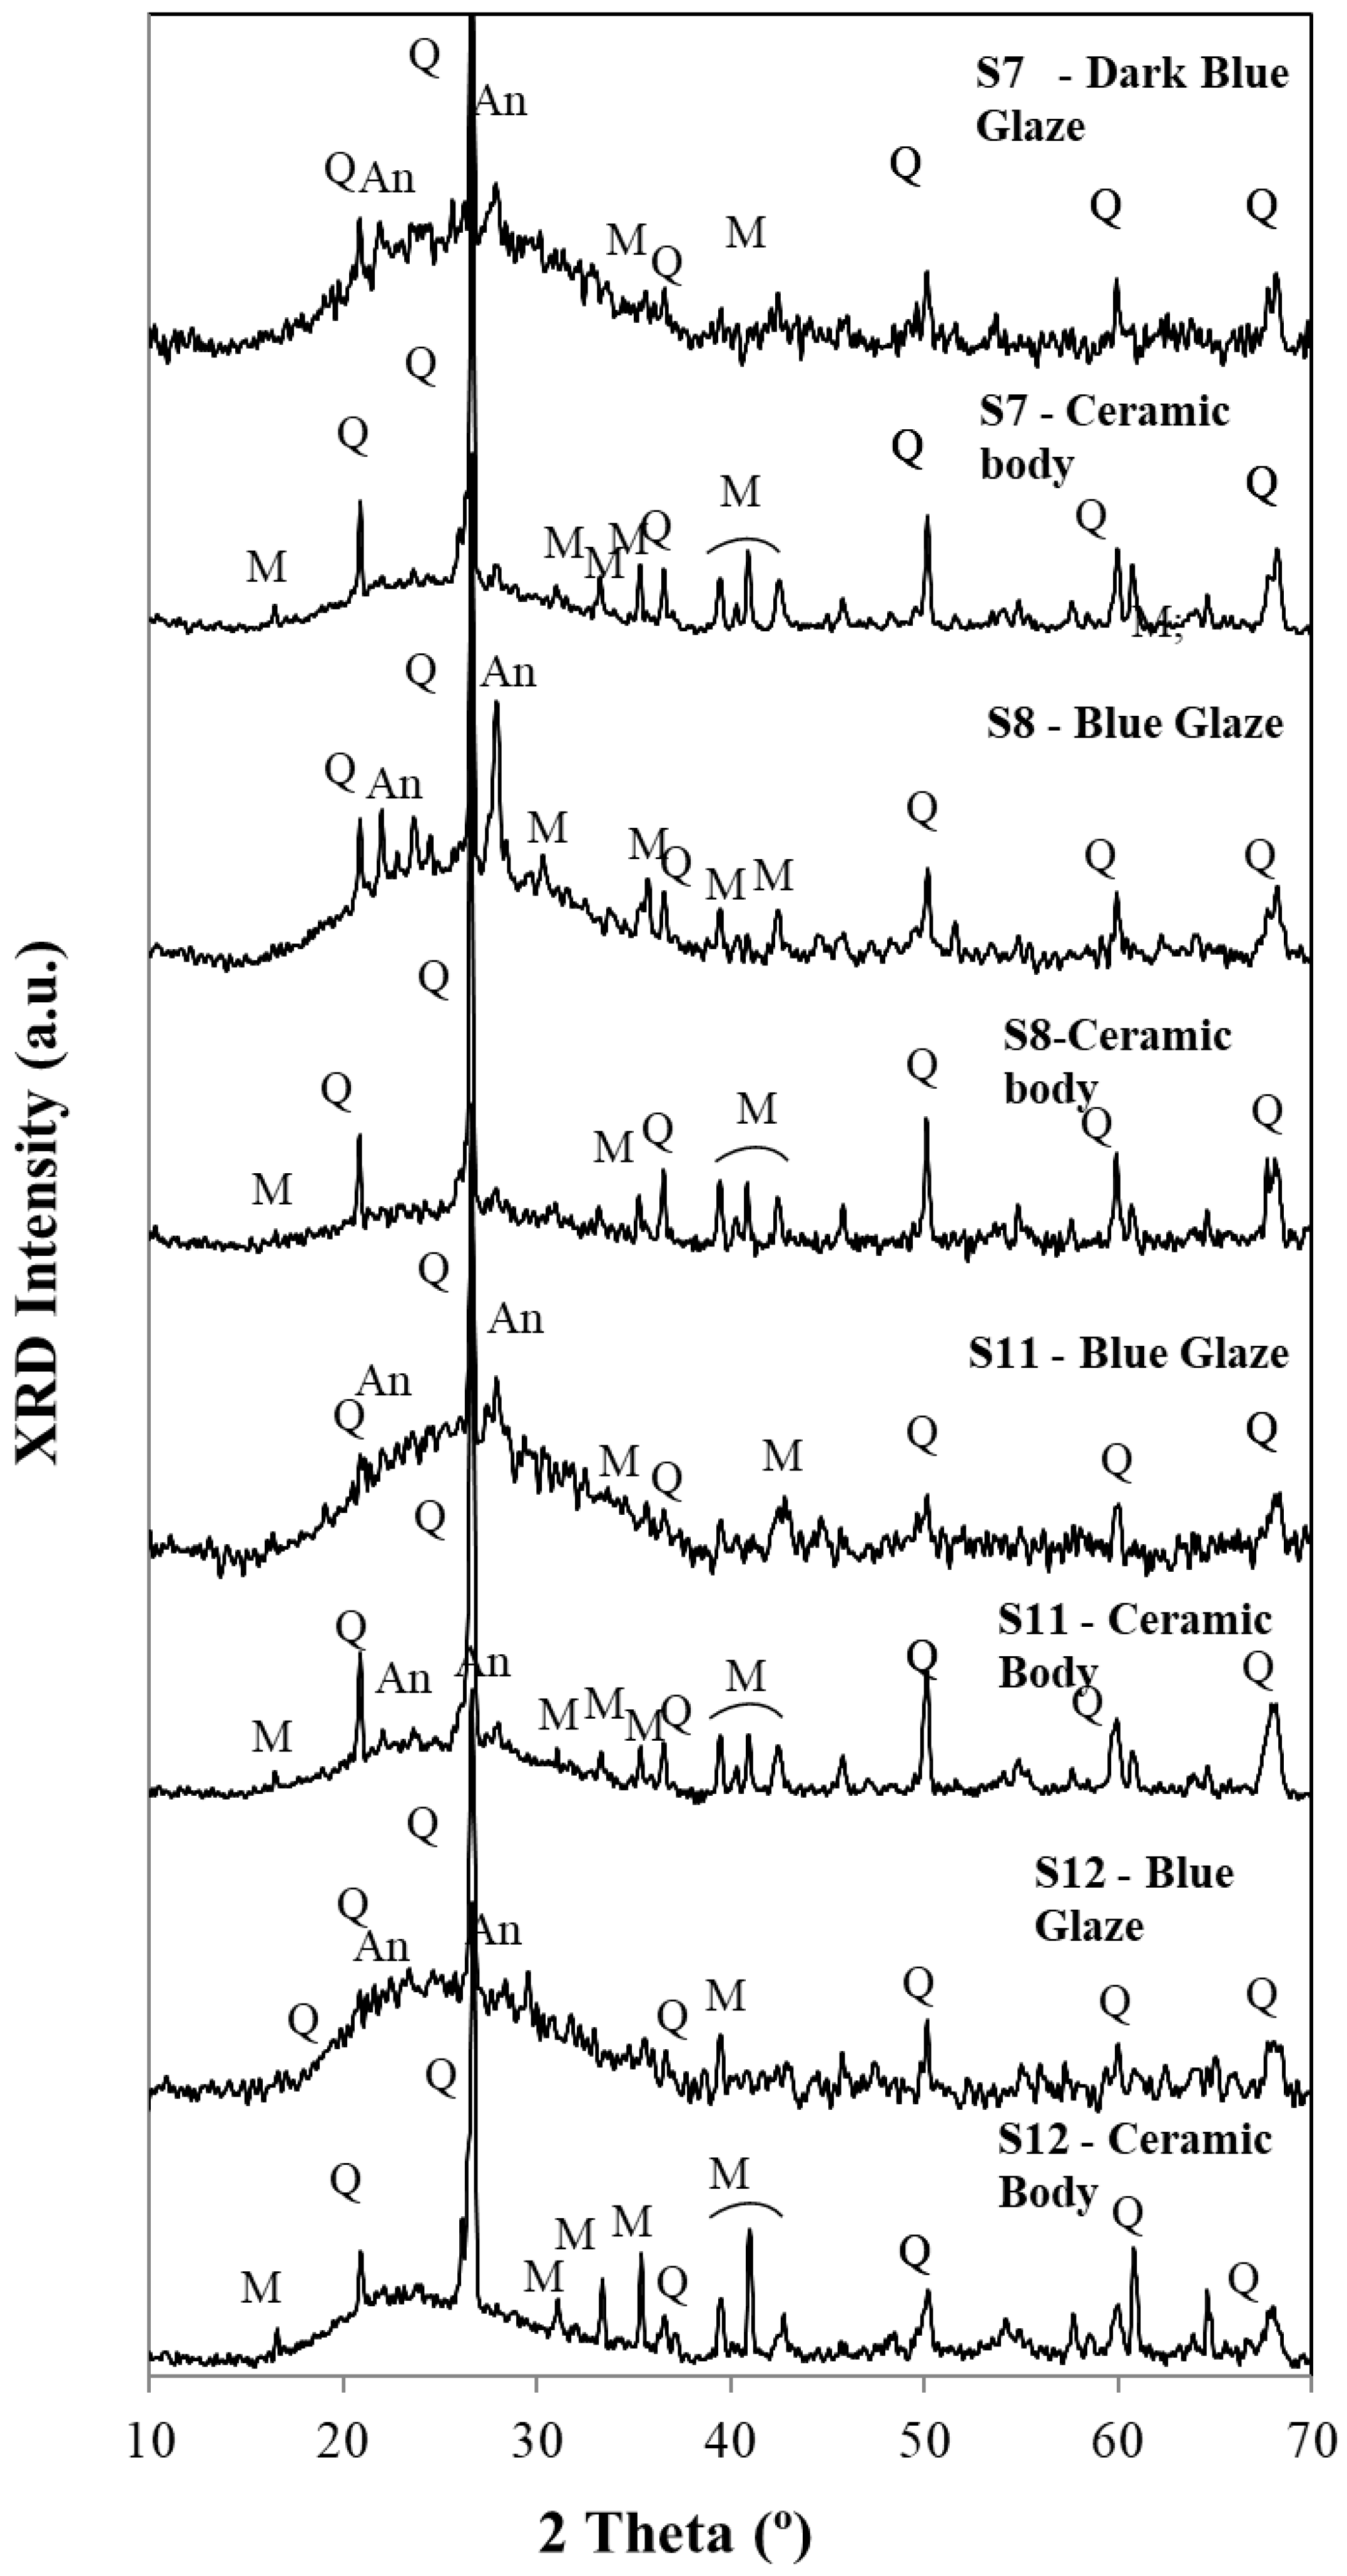
Figure 8.
Diffractograms for glazes and ceramic bodies for samples S7, S8, S11, and S12. Q—Quartz (SiO2), M—Mullite (Al2O3)3(SiO2)2, An—Anorthite, (CaO. Al2O3 (SiO2)2).
In the evaluation of the diffractograms of Figure 7 and Figure 8, one must pay attention to the fact that this technique uses powders (~10 to ~15 mg per essay). Due to the hardness of porcelain, it is very difficult to obtain powders for each sample. So, ceramic bodies include some surficial glaze, and glazes include a significant amount of the ceramic body, which explains, at least partially, the similarity between the two groups. XRD main peaks used to identify the minerals in the diffractograms for ceramic bodies and glazes are listed in Table 1.

Table 1.
XRD main peaks used to identify the minerals in the diffractograms for ceramic bodies and glazes.
In the range of abscissas from ~15 to ~40 2 theta (°), all samples exhibit a broad band assigned to an amorphous vitreous phase. This amorphous vitreous phase is more significant in all glazes when compared with the ceramic body. Superimposed are the peaks assigned to quartz (SiO2), anorthite (CaO.Al2O3(SiO2)2), and mullite ((Al2O3)3(SiO2)2).
Quartz peaks were detected in all diffractograms of Figure 7 and Figure 8. Also, the presence of a calcium feldspar, anorthite, can be observed not only in the pastes but also in glazes. The amount of the formed anorthite in the blue glazes is, in some cases, higher than the one detected in the ceramic body, showing that calcium salts Ca2+ were used as fluxing agents, apart from the most common ones, the potassium K+ or Na+ salts.
Mullite formation could be observed in all ceramic bodies. This mineral was formed due to the alumina content and to the high temperatures used for the porcelain firing: 1250 °C for calcium-rich glazes and 1350 °C for calcium-poor glazes [5].
Microcline peaks are often difficult to distinguish from those of mullite, so this technique is not suitable for providing this mineral identification. Only micro-Raman spectra could show them in very few cases.
2.5. XRF for Glazes and Ceramic Bodies
XRF spectroscopy provided the elemental compositions of both white and blue glazes and of the ceramic bodies. The results obtained are presented in Table 2 and Table 3, respectively, and were obtained by irradiating the glazed surfaces or the ceramic body of each sherd, since this is a non-destructive technique.
Table 2.
Chemical composition of the white and blue glazes, obtained by XRF. Data are presented as wt.% (nd: not detected; nq: not quantified).
Table 3.
Chemical composition of the ceramic bodies of the samples, obtained by XRF. Data are presented as wt.% (nd: not detected; nq: not quantified).
Some comments should be added to the data in Table 2: As regards the blue pigments, sample S0 (Iran, 12th century) exhibits the largest cobalt (Co) content (1.2 wt.%). This is the sample where the Iranian cobalt was used.
In samples S1, S11, and S12, the Co loading is not as large as in S0, but it is still quite significant (~0.34 wt.%). The blue glazes in samples S2 to S8 lie in the range of 0.36 to 0.09 wt.% of cobalt, and this loading is similar to those of the porcelains that exhibit the Iranian cobalt pigment. Samples S9 and S10 only have a white glaze, and no cobalt was detected.
In all blue samples, the nickel (Ni) content is zero or negligible, ranging from 0.02 to 0.08 wt.%
Manganese (Mn) was very rarely detected: in the Ming bowl (sample S1), the Mn content was 0.28 wt.%, and in sample S2, the purple blue had 0.73 wt.%. Finally, in the 18th century samples, S11 and S12 exhibit 2.84 and 1.04 wt.%, respectively. In all other samples studied here, no Mn was detected.
The presence of As in the blue of sherd S7 is more consistent with a Qing attribution, not a Wanli attribution. Therefore, sample S7 may well be Qing Dynasty with a Wanli pattern, as is present both in the blue and in the white glazes of S7. Also, no cobalt silicate Raman spectrum was obtained in the blue glaze; therefore, smalt use should be excluded. Due to these arguments, the assignment of Qing or Wanli origin is not certain.
With regard to the SiO2, Al2O3, or SiO2 + Al2O3 contents for white and blue glazes, no special correlations could be found with the wt.% and the time range for the porcelain production, showing that the recipes for the glaze production did not vary too much for the porcelains studied here.
For ceramic bodies, the SiO2 and Al2O3 contents for samples S1 to S12 vary from about 70 to 80 wt.% and about 15 to 20 wt.%, respectively. The sums of the SiO2 + Al2O3 contents are all around 90 wt.%. Potassium ranges from ~1 to ~5 wt.% of K2O, calcium ranges from ~1 to ~5 wt.% of CaO, and magnesium ranges from 0 to ~3 wt.% of MgO. Iron oxides are located in the range of ~0.5 to ~2.5 wt.% of Fe2O3. The XRF technique used here does not allow the detection of Na2O.
Table 3 provides data for the calculation of the parameter R. R is defined by: R = (SiO2 + Al2O3 + K2O)/CaO and was used in previous papers by our group [9,10,12], to quantify the relative amounts of the structural components of the ceramic pastes, (SiO2 + Al2O3 + K2O), related to calcium fractions (CaO). This makes it possible, in many cases, to establish the origins of the clay sources used to manufacture the porcelains or at least to evaluate which ones were made in the same or in different production centers.
Figure 9 shows a plot of the index of polymerization (Ip) versus the parameter defined by Ph Colomban as the ratio of the moles of glass modifiers by the molar sum of network formers (RColomban)
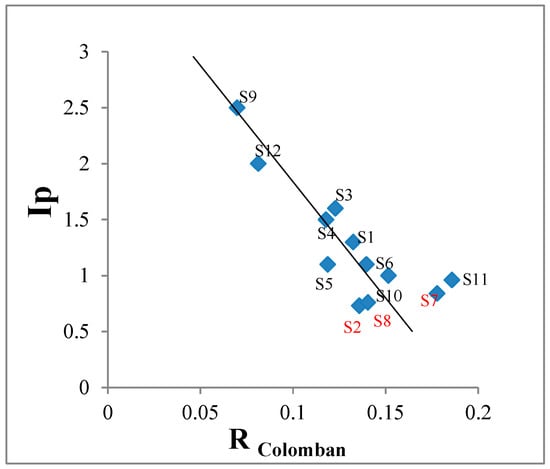
Figure 9.
Ip versus RColomban.
Our XRF set up does not allow us to obtain the number of moles of Na2O, but even in this case, a reasonable linear relation of Ip versus RColomban could be observed as in Colomban’s work [15].
Samples S2, S8, and S7, the ones showing the lowest values for Ip, are well separated from the others. As we have pointed out before, these three points are for alkaline glazes, while all the others are for calcium-based glazes.
3. Discussion
Table 4 summarizes some of the information collected for the 13 samples under study, the correlation with the stylistic information, estimated dating, blue pigment origin, index of polymerization Ip, and the glaze type.
Table 4.
General information and visual characteristics of all studied sherds recovered from the Santana Convent (S1 to S12). S0 is an Iranian sherd used for comparison purposes. Qz—Quartz (SiO2); Mull—Mullite (Al6Si2O13); An—Anorthite (CaAl2Si2O8).
Samples S5 and S6 were certainly produced in the same kiln, based on the index of polymerization Ip (micro-Raman), the GSDR absorption spectra, and the R parameter of Table 3.
In the two white samples (S9 and S10), the observed glazes were different, but the micro-Raman spectra for the ceramic bodies were identical. The R parameter is quite different for these two samples. This probably indicates different recipes for the glaze production and different kilns for the porcelain manufacturing.
The two Wanli samples (S7 and S8) present different glazes and also different R values. Therefore, we may conclude they were certainly manufactured in different kilns and with the use of different glaze recipes.
Column 2 of Table 4 presents the initial stylistic information concerning the 12 samples, i.e., not based on the spectroscopic information. Our studies provided a completely different view in most cases, particularly regarding the origin of the pigments in use in the Ming and Qing Dynasties. The presentation of this table intends to underline the importance of rigorous spectroscopic detailed information for all samples.
4. Conclusions
Taking into consideration all the techniques used in this study, one clearly sees that both GSDR absorption spectra and micro-Raman spectroscopies provided relevant information. GSDR absorption spectra clearly established the use of a blue pigment originating in Iran, in rare cases of dark blue glazes. Most Chinese porcelains were produced using a different blue pigment, most probably of Chinese origin. The two porcelains from the 18th century, Samples S11 and S12, evidence the simultaneous use of Iranian and Chinese pigments.
The micro-Raman spectroscopy also provided a clear differentiation between the dark blue color obtained with the use of the Iranian pigment and the blue color obtained with the use of the Chinese pigment, where the Raman bands of crystalline quartz are superimposed onto the stretching and bending envelopes of the Si-O bonds.
Microstructural analysis confirms that the blue-and-white decoration in all samples (S1–S4, S7–S8, and S11–S12) was achieved through an in-glaze decorative technique, as evidenced by the uniform dispersion of fine cobalt pigment particles within the superficial glaze layer. No under-glaze or over-glaze methods were observed. The glaze layer thickness ranged from 200 to 300 µm, and sherd thickness varied between 3 and 10 mm depending on vessel morphology. In several samples (notably S3, S4, S8, S11), black inclusions—dendritic metallic forms and crystalline assemblages—were documented, suggesting complex interactions between pigment chemistry and thermal processing. These features often coexisted with enlarged gas bubbles, supporting the hypothesis that partial gas entrapment during glaze melting promotes impurity formation and nucleation of crystalline phases.
XRD analysis confirmed the presence of a vitreous (amorphous or nano-crystalline) phase in all glazes, more pronounced than in the ceramic bodies. Superimposed crystalline peaks identified quartz, anorthite, and mullite. Anorthite was more abundant in some glazes than bodies, indicating the use of calcium-based fluxes (Ca2+) in addition to alkali fluxes. Mullite was consistently present in the ceramic bodies, confirming high firing temperatures (1250–1350 °C) and alumina-rich compositions.
X-ray Fluorescence experiments show that only very few samples exhibit manganese in the blue pigment color elemental composition. Lastly, analysis of the ceramic body chemistry via the R parameter (ratio of structural components to calcium flux content) revealed variability, suggesting that stylistically similar porcelains were likely fired in different kilns, implying a decentralized or diversified production model even within the same chronological framework.
Author Contributions
Conceptualization, L.F.V.F. and I.F.M.; experimental, L.F.V.F., I.F.M. and M.F.C.P.; writing—original draft preparation, L.F.V.F., I.F.M. and M.F.C.P.; writing—review and editing, L.F.V.F., I.F.M., M.F.C.P., R.V.G. and M.V.G. All authors have read and agreed to the published version of the manuscript.
Funding
This research was funded by FCT—Fundação para a Ciência e a Tecnologia, I.P., in the scope of the projects UIDB/04565/2020 and UIDP/04565/2020.
Data Availability Statement
Data are contained within the article.
Acknowledgments
This work is financed by national funds from FCT—Fundação para a Ciência e a Tecnologia, I.P., in the scope of the project UIDB/04565/2020 and UIDP/04565/2020 of the Research Unit Institute for Bioengineering and Biosciences—iBB. A final reading of the English manuscript by Helena Liberato is greatly acknowledged.
Conflicts of Interest
The authors declare no conflict of interest.
References
- Page, M. First Global Village: How Portugal Changed the World; Editorial Notícias: Lisboa, Portugal, 2002. [Google Scholar]
- Casimiro, T.M. Globalization, trade, and material culture: Portugal’s role in the making of a multicultural Europe (1415–1806). Post-Mediev. Archaeol. 2020, 54, 1–17. [Google Scholar] [CrossRef]
- de Waals, D. Raman investigation of the ceramics from the 16th and 17th century Portuguese shipwrecks. J. Raman Spectrosc. 2004, 35, 646–649. [Google Scholar] [CrossRef]
- Colomban, P.; Ngo, A.; Edwards, H.G.M.; Prinsloo, L.C.; Esterhuizen, L.V. Raman identification of the different glazing technologies of Blue-and-White Ming porcelains. Ceram. Int. 2022, 48, 1673–1681. [Google Scholar] [CrossRef]
- Vieira Ferreira, L.F.; Casimiro, T.M.; Colomban, P. Portuguese tin-glazed earthenware from the 17th century. Part 1: Pigments and glazes. Spectrochimica Acta A 2013, 104, 437–444. [Google Scholar] [CrossRef] [PubMed]
- Xiong, H.; Varela Gomes, M.; Varela Gomes, R.; Gonçalves, J.; Li, S. Chinese Porcelain Marks Found at the Santana Convent in Lisbon. Eur. Post Mediavalis 2022, 3, 115–127. [Google Scholar]
- Vieira Ferreira, L.F.; Barros, L.; Ferreira Machado, I.; Pereira, M.F.C.; Casimiro, T.M. An archaeometric study of a Late Neolithic cup and coeval and Chalcolithic ceramic sherds found in the São Paulo Cave, Almada, Portugal. J. Raman Spectrosc. 2020, 51, 483–492. [Google Scholar] [CrossRef]
- Vieira Ferreira, L.F.; Casimiro, T.M.; Boavida, C.; Pereira, M.F.C.; Ferreira Machado, I. An Archaeometric Study of Lead Glazed Medieval Ceramics (13th-14th Century) from Santarém, Portugal. Heritage 2024, 7, 2217–2238. [Google Scholar] [CrossRef]
- Reiche, I.; Rohrs, S.; Salomon, J.; Kanngiesser, B.; Hohn, Y.; Malzer, W.; Voigt, F. Development of a nondestructive method for underglaze painted tiles. Anal. Bioanal. Chem. 2009, 393, 1025. [Google Scholar] [CrossRef] [PubMed]
- Padeletti, G.; Fermo, P.; Gilardoni, S.; Galli, A. Technological study of ancient ceramics produced in Casteldurante (central Italy) during the Renaissance. Appl. Phys. A 2004, 79, 335–339. [Google Scholar] [CrossRef]
- Edwards, H.; Colomban, P. Blue by Fire: A Marker of the Technical History of Glass and Ceramics; Cultural Heritage Science; Springer: Berlin/Heidelberg, Germany, 2025. [Google Scholar] [CrossRef]
- Babini, A.; Green, P.; George, S.; Hardeberg, J.Y. Comparison of Hyperspectral Imaging and Fiber-Optic Reflectance Spectroscopy for Reflectance and Transmittance Measurements of Colored Glass. Heritage 2022, 5, 1401–1418. [Google Scholar] [CrossRef]
- Colomban, P.; Tournie, A.; Bellot-Gurlet, L. Raman identification of glassy silicats used in ceramics, glass and jewellery: A tentative differentiation guide. J. Raman Spectrosc. 2006, 37, 841–852. [Google Scholar] [CrossRef]
- Colomban, P. On site Raman identification and dating of ancient glasses: A review of procedures and tools. J. Cult. Herit. 2008, 9, e55–e60. [Google Scholar] [CrossRef]
- Colomban, P. Polymerization degree and Raman identification of ancient glasses used for jewelry, ceramic enamels and mosaics. J. Non-Cryst. Solids 2003, 323, 180–187. [Google Scholar] [CrossRef]
- Wen, J.; Chen, Z.; Zeng, Q.; Hu, L.; Wang, B.; Shi, J.; Zhang, G. Multi-micro analytical studies of blue-and-white porcelain (Ming dynasty) excavated from Shuangchuan island. Ceram. Int. 2019, 45, 13362–13368. [Google Scholar] [CrossRef]
- Tao, S.; Liu, S.; Yuan, Y.; Dong, J.; Li, Q. A Microstructural and Compositional Study of ε-Fe2O3 Crystals in the Hare’s Fur Jian Ware. Crystals 2022, 12, 367. [Google Scholar] [CrossRef]
- Pradell, T.; Molera, J. Ceramic technology. How to characterize ceramic glazes. Archaeol. Anthropol. Sci. 2020, 12, 189. [Google Scholar] [CrossRef]
- Jiang, C.; Wu, J.; Zhou, J.; Luo, T.; Bao, Q.; Liu, K. Formation Mechanism of Crystal Spots in Jian Kiln Oil-Spot. Glaze Revealed by Simulation Experiments. Appl. Sci. 2024, 14, 10210. [Google Scholar] [CrossRef]


Disclaimer/Publisher’s Note: The statements, opinions and data contained in all publications are solely those of the individual author(s) and contributor(s) and not of MDPI and/or the editor(s). MDPI and/or the editor(s) disclaim responsibility for any injury to people or property resulting from any ideas, methods, instructions or products referred to in the content. |
© 2025 by the authors. Licensee MDPI, Basel, Switzerland. This article is an open access article distributed under the terms and conditions of the Creative Commons Attribution (CC BY) license (https://creativecommons.org/licenses/by/4.0/).