Article

Determining the Thickness of Gold Leaf in Post-Byzantine Religious Panel Paintings Using Imaging μ-XRF

by
Ioanna Vasiliki Patakiouta
1,
Anastasios Asvestas
1,
Anastasia Tzima
1,
Sotirios Danakas
2,
Georgios P. Mastrotheodoros
3,
Andreas G. Karydas
4 and
Dimitrios F. Anagnostopoulos
1,*
1
Department of Material Science and Engineering, University of Ioannina, GR-45100 Ioannina, Greece
2
Department of Physics, University of Ioannina, GR-45100 Ioannina, Greece
3
Department of Antiquities and Works of Art Conservation, West Attica University, GR-12243 Egaleo, Greece
4
Institute of Nuclear and Particle Physics, NCSR “Demokritos”, GR-15341 Athens, Greece
*
Author to whom correspondence should be addressed.
Heritage 2025, 8(10), 432; https://doi.org/10.3390/heritage8100432
Submission received: 16 August 2025 / Revised: 7 October 2025 / Accepted: 9 October 2025 / Published: 15 October 2025

Abstract

Thin gold leaves were frequently used to embellish post-Byzantine religious panel paintings. Measuring their thickness using non-destructive methods is essential for understanding the technology behind their creation and developing effective preservation strategies. This study describes a method for non-invasively measuring the thickness of these gildings using large-scale imaging micro-X-ray fluorescence (µ-XRF) spectroscopy. The method relates the intensity of the Au Lα X-ray characteristic transition to the thickness of the gold layer. The method offers precise measurements of gold layer thickness in the submicrometer range on gilded surfaces, while traditional methods based on the intensity ratio of the same element prove ineffective. The method was initially validated on a mock-up sample created using traditional gilding techniques. Subsequently, the gilding was examined on two case studies of Greek religious icons. The analysis accurately measured the thickness of individual gold leaves, approximately one hundred nanometers, and identified regions with multiple overlapping layers, corresponding to structures with up to four leaves. The findings confirm that this technique offers valuable quantitative insights into the materiality and artistic techniques of these cultural heritage artifacts.

1. Introduction

XRF spectrometry is highly suitable in cultural heritage research, mainly because it provides quick, accurate, and non-invasive elemental analysis [1]. Over the past decade, non-invasive, non-destructive X-ray fluorescence imaging (MA- XRF) has enabled rapid scanning of relatively large areas and the creation of elemental distribution maps [2,3]. This technique enables scholars to gather valuable information about the materials, techniques, and preservation status of paintings [4,5,6]. Most relevant studies focus on Western European panel and canvas paintings, whereas only a few address icons, Eastern Orthodox religious panel paintings produced since the dawn of Christianity [7,8,9].
Thin gold leaves were often used to embellish panel and wall paintings within the framework of post-Byzantine religious art [8,10]. Determining the thickness and composition of the leaves in a non-destructive manner is an essential step toward understanding the materiality of these artifacts. Additionally, the thickness of a gold leaf is directly related to its manufacturing process [11]. Therefore, relevant studies significantly contribute to evaluating the technological framework of specific periods. Additionally, determining the nature and thickness of metal decorations on paintings may assist in compiling a well-thought-out preservation plan. In fact, the importance of determining the thickness of original gold leaves is well demonstrated by the numerous pertinent studies that have emerged recently. Scholars working on the analytical study of paintings’ materials and techniques have dedicated significant effort to developing reliable methods for these analyses.
In many studies, thickness is determined solely through the investigation of micro-samples’ cross-sections [12,13]. Nevertheless, it has been demonstrated that examining conventionally prepared cross-sections yields overestimated thickness values [14], and a specialized sample preparation method has recently been developed to address this issue [15]. Apart from merely microscopic methods, scholars have employed more powerful analytical tools to determine the thickness of gold leaves, such as Rutherford backscattering spectrometry [15,16] and mapping of ions through time-of-flight secondary ion mass spectrometry (ToF-SIMS) [12]. However, the techniques mentioned above rely on the examination of paintings’ micro-samples; therefore, they cannot be considered non-invasive, while they are also time-consuming and costly. On the other hand, X-ray fluorescence spectroscopy, particle-induced X-ray emission, and Rutherford backscattering spectroscopy are promising techniques for measuring the thickness of thin films non-destructively. X-ray fluorescence also offers the advantage of portability, allowing measurements to be taken in the field instead of requiring the artifact to be brought into a laboratory. Indeed, X-ray fluorescence has been routinely used for calculating the thickness of layered structures. Early attempts to use it for the analysis of paintings, and, in particular, gold leaves, appeared a couple of decades ago [17,18].
Building on single-point XRF analysis, this study employed XRF imaging to assess the thickness of gilded layers in Greek Orthodox icons, enabling quantitative evaluation by averaging over larger areas and thereby minimizing errors caused by local thickness variations. It is worth noting that the latter can emerge from the traditional manufacturing of gold leaves, which employed a laborious and ingenious method of repetitive hand hammering [19]. Considerable variations on the surface of pertinent leaves have indeed been documented analytically [20]. Additionally, imaging enables the detection of regions with multiple gold layers, providing insights into the handcrafted techniques. The thickness of the gilded layers is determined by directly relating the intensity of the Au Lα transition to the layer thickness. To perform this process, it is essential to know the spectrometer’s sensitivity to the Au Lα transition, which is experimentally determined. The methodology used differs from the often-applied methods for measuring the thickness of gold layers via XRF spectroscopy, which depend on the intensity ratios of measured fluorescence transitions. Specifically, the transition intensity ratio method relies on either the changes in the relative Au intensity ratios caused by self-attenuation within the gold layer as a function of its thickness [18,21], or on the differential absorption of the X-ray characteristic fluorescence photons emitted from a specific element by the sample’s substrate, which attenuate differently as they pass through the gold layer [22,23,24]. These traditional methods, based on the intensity ratio of the same element, prove ineffective for measuring precisely in the submicrometer range [21].
To evaluate the validity of our approach, a mock-up gilded sample, manufactured using traditional post-Byzantine icon gilding techniques, was measured and analyzed. Imaging micro-X-ray fluorescence spectroscopy is applied to determine the single-element intensity distribution maps and transition intensity scatter plots, which provide valuable insights for determining the thickness of the gilded layer. Finally, the gilding of Greek religious panel paintings was examined through two case studies.
In the following sections, the theoretical background regarding the Au L intensity correlation with the thickness of the gold layers, the fabrication of the mock-up gilded sample, the experimental setup and measurement conditions, and the obtained results from studying the mock-up sample and two post-Byzantine Greek religious icons are described.

2. Theory

The intensity of the Au X-ray fluorescence characteristic transition emitted from a gold leaf is related to the surface density of the gilding C A u ρ ξ , and its thickness ξ according to the Sherman equation [25], for the case of monoenergetic excitation:
I A u = C A u ρ ξ S A u 1 e μ ^ ρ ξ μ ^ ρ ξ
where ρ is the density, C A u is the weight percent Au concentration in the leaf, S A u is the spectrometer’s sensitivity for the specific characteristic transition, and μ ^ is the total mass attenuation coefficient given by:
μ ^ = μ i n e i n sin ψ + μ o u t e o u t sin φ
with e i n is the photon energy of the incoming ionization radiation and e o u t is the photon energy of the gold characteristic transition. Figure 1 presents the intensity of the Au Lα characteristic transition (9.71 keV) as a function of gold foil thickness for incoming photon energies of 15.0 and 20.2 keV. The energy of the ionization photon influences the measured intensity. In XRF experiments that use X-ray tubes, the theoretical prediction of the relationship between intensity and layer thickness is challenging based solely on fundamental parameters, mainly because the photon distribution of the ionization spectrum can be described with limited accuracy through the whole energy range. However, the relationship between analyte intensity and thickness can be accurately established using reference standards with known surface density or thickness.
Moreover, the relationship between intensity and thickness drastically depends on the energy of the measured characteristic transition. Figure 2 shows the relative intensity of the Au Lα characteristic transition at 9.71 keV compared to the Mα transition at 2.12 keV as a function of gold leaf thickness. It can be inferred that the intensity of the Mα transition peaks at a leaf thickness of up to 1 μm.
The surface density, according to Equation (1), is given by:
C A u ρ ξ = I A u S A u μ ^ ρ ξ 1 e μ ^ ρ ξ A
where the term A describes the absorption of X-rays in the sample. The evaluation of surface density C A u ρ ξ requires the measurement of the intensity I A u of the Au characteristic transition, the determination of the spectrometer’s sensitivity S A u and the absorption term A . The analysis is significantly simplified in the case of thin foils μ ^ ρ ξ < < 1 because there are no matrix effects involved, and the surface density of the gilding is expressed by:
C A u ρ ξ = I A u S A u
For a thin leaf, the surface density is determined by the measured intensity of the characteristic transition and the spectrometer’s sensitivity. It should be noted that the energy of the measured characteristic transition plays a significant role in deciding whether a leaf qualifies as thin, as it can be verified in Figure 2.

3. Materials and Methods

3.1. The Mock-Up

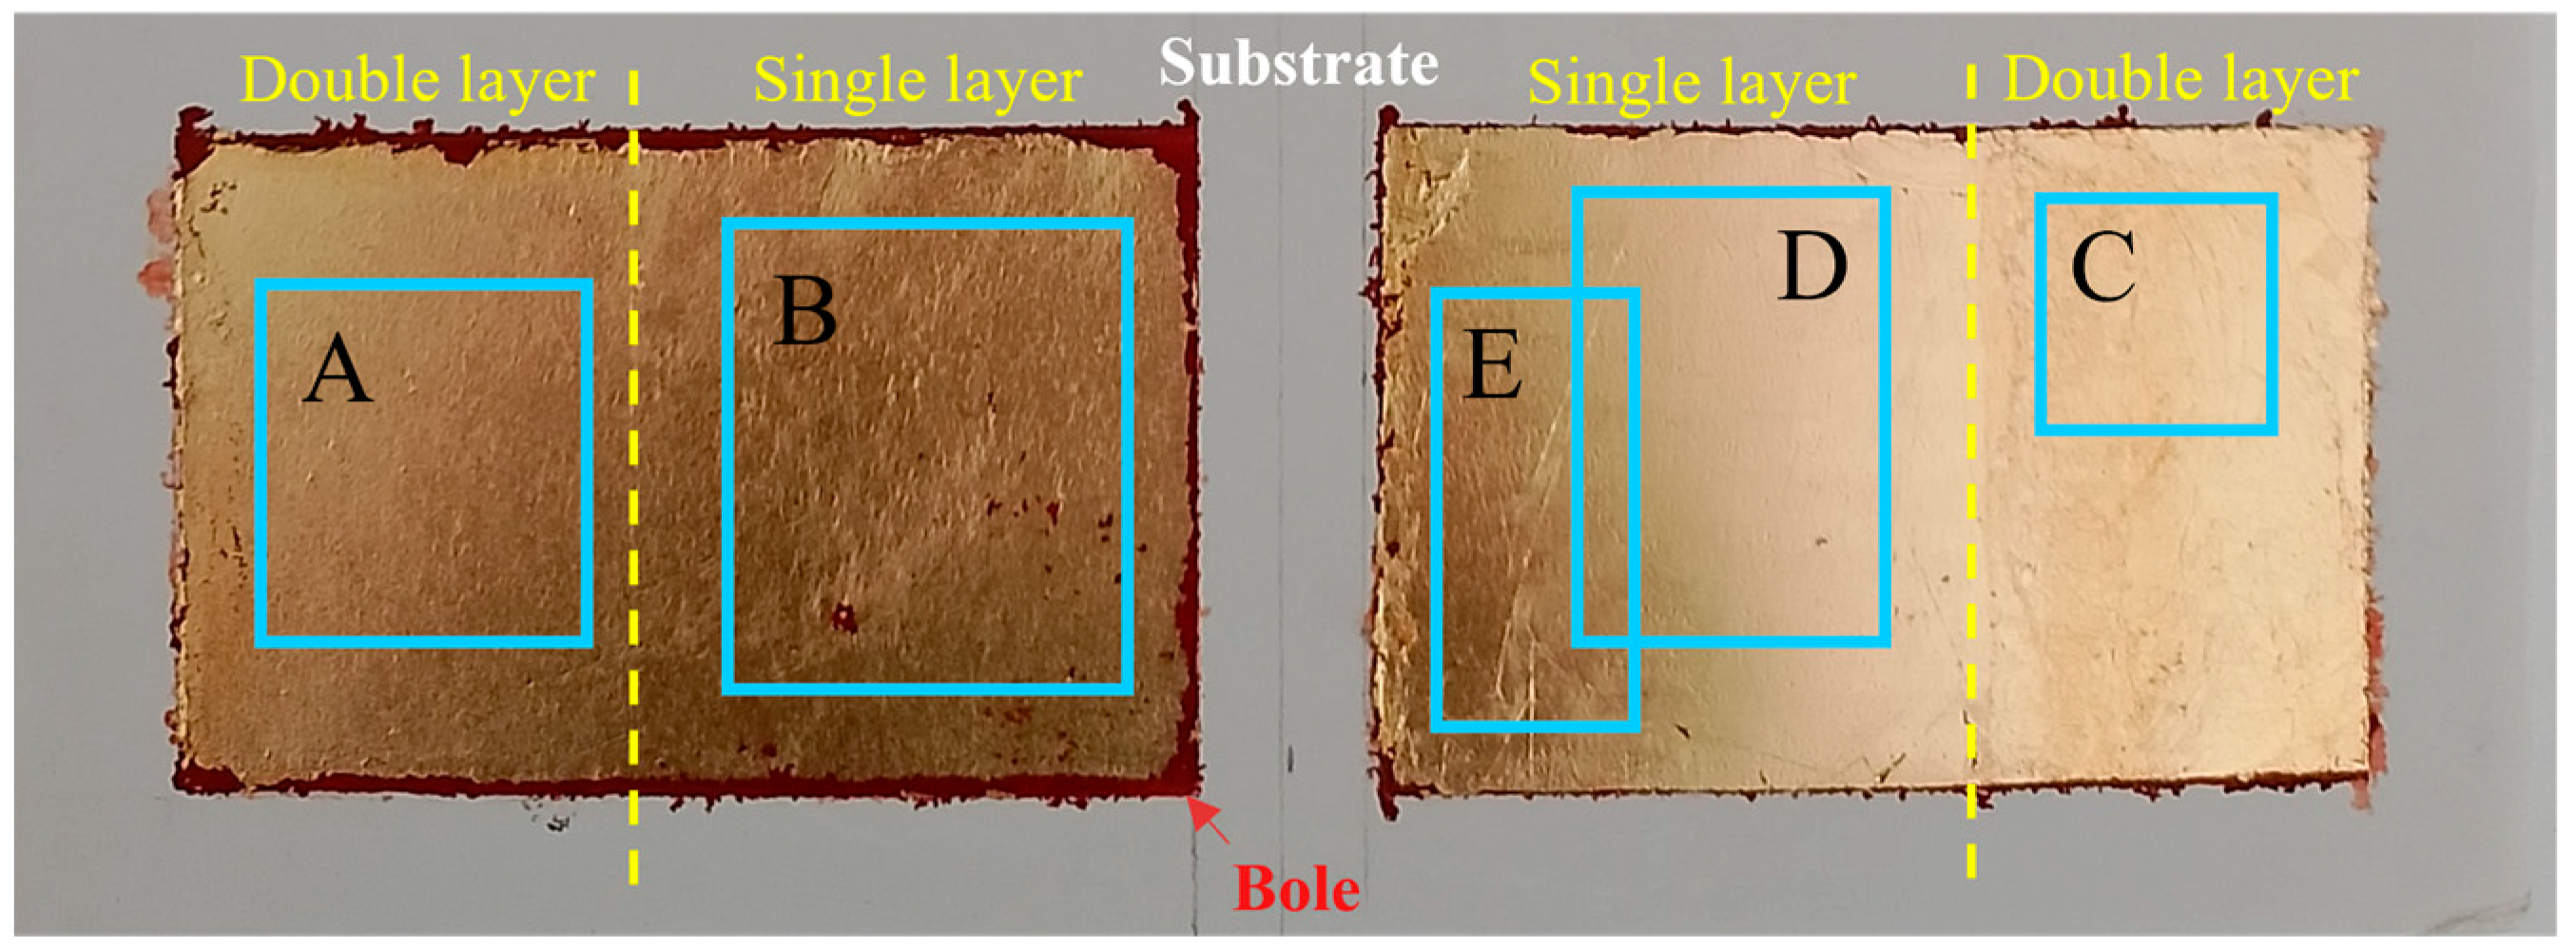
To manufacture the mockup (Figure 3), a plywood board measuring 12.0 × 4.0 cm2 was primed and gilded using a mild variant of the typical medieval and post-Byzantine gilding technique [27,28].
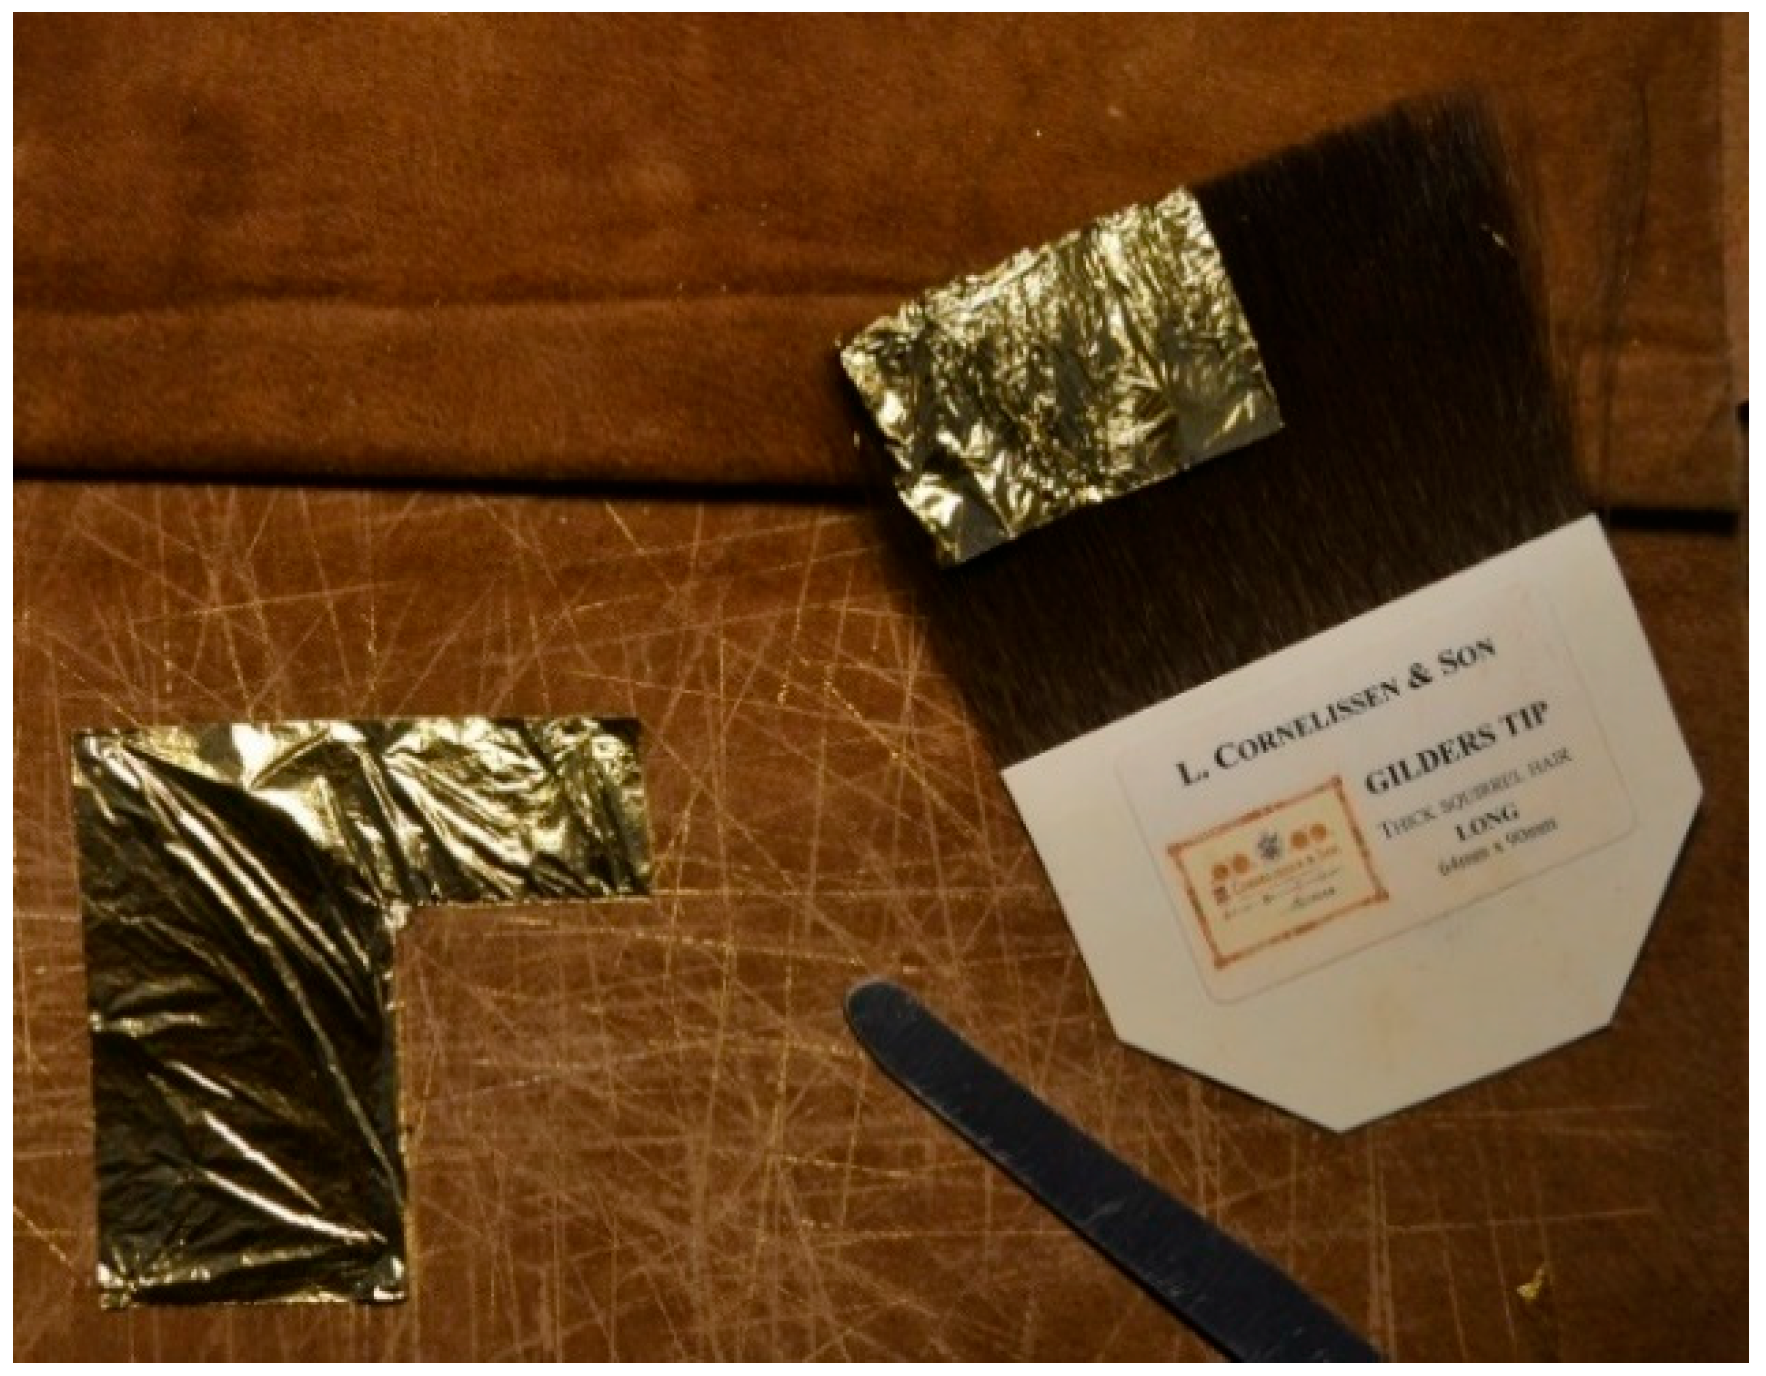
In particular, the board was first sized using a dilute warm rabbit skin glue solution (10% w/v in water). Upon the setting of the glue, the wood was covered by numerous successive, thin layers of gesso (powdered calcium sulfate mixed with the aforementioned glue). Subsequently, the surface of the ground (gesso) was gently sanded down using fine sandpaper (300 grit), and the areas (rectangles measuring approximately 3.6 × 5.2 cm2) to receive gilding were then covered by the gluing agent (bole/poliment). The latter consisted of a mixture of fine red bole (“Bolo Rosso” by Ferrario) and dilute rabbit skin glue (10% w/v in water) and was applied using a thin round paintbrush in successive, cross-hatched layers. Two distinct types of 23.75-carat gold leaf were used for the gilding: a loose leaf (Kremer #98410) and a transfer leaf (Kremer #98412). Before the application of the gold leaves, the surface of the bole was wetted using a mixture of dilute animal glue and ethanol [27]; loose leaves were applied using a gilder’s tip (Figure 4), while the transfer ones were directly applied on the pre-wetted bole. To obtain areas of two overlapping gold leaves, part of the gilded rectangles was covered by a second leaf using the same glue plus ethanol mixture; in this stage, minor faults of the first gold leaf application were also covered by small, superimposed gold leaves. The gildings were left unburnished.

3.2. Experimental Setup

The measurements were conducted using the M6-Jetstream scanner (Bruker Nano GmbH, Berlin, Germany), which is equipped with a 30 W Rhodium anode X-ray tube, polycapillary optics, and a silicon drift detector (active area: 30 mm2). The polycapillary full lens focuses the X-ray radiation from the tube on the target. The X-ray tube was operated at 50 kV and 600 µA voltage and current settings, respectively, without a beam filter (“condition A”). The measuring head was positioned at the focal point of the M6 Jetstream camera, aiming for a nominal beam spot of 100 µm for Mo Kα. The collected spectra were processed and visualized (i.e., transformed into elemental distribution maps) with the built-in M6-Jetstream ESPRIT software (version 1.6.621.0).
The spectrometer’s sensitivity for the Au Lα during measurements with the M6-Jetstream under “condition A” was found to be (40 ± 6) cps/μg/cm2. The sensitivity evaluation is provided in Appendix A. The knowledge of the sensitivity allows the determination of the leaf’s thickness by measuring the Au Lα intensity. By scanning a rectangular region of 15.1 mm × 10.5 mm (in total 15,855 measurement points) on the 23.75 karat Rosenoble Double Gold transfer leaf (Kremer #98412), the surface density was determined to be (230 ± 35) μg/cm2. Considering gold’s density equal to 19.3 g/cm3, the average thickness of the leaf was found to be (120 ± 20) nm.

4. Results and Discussion

4.1. Mock-Up μ-XRF Imaging

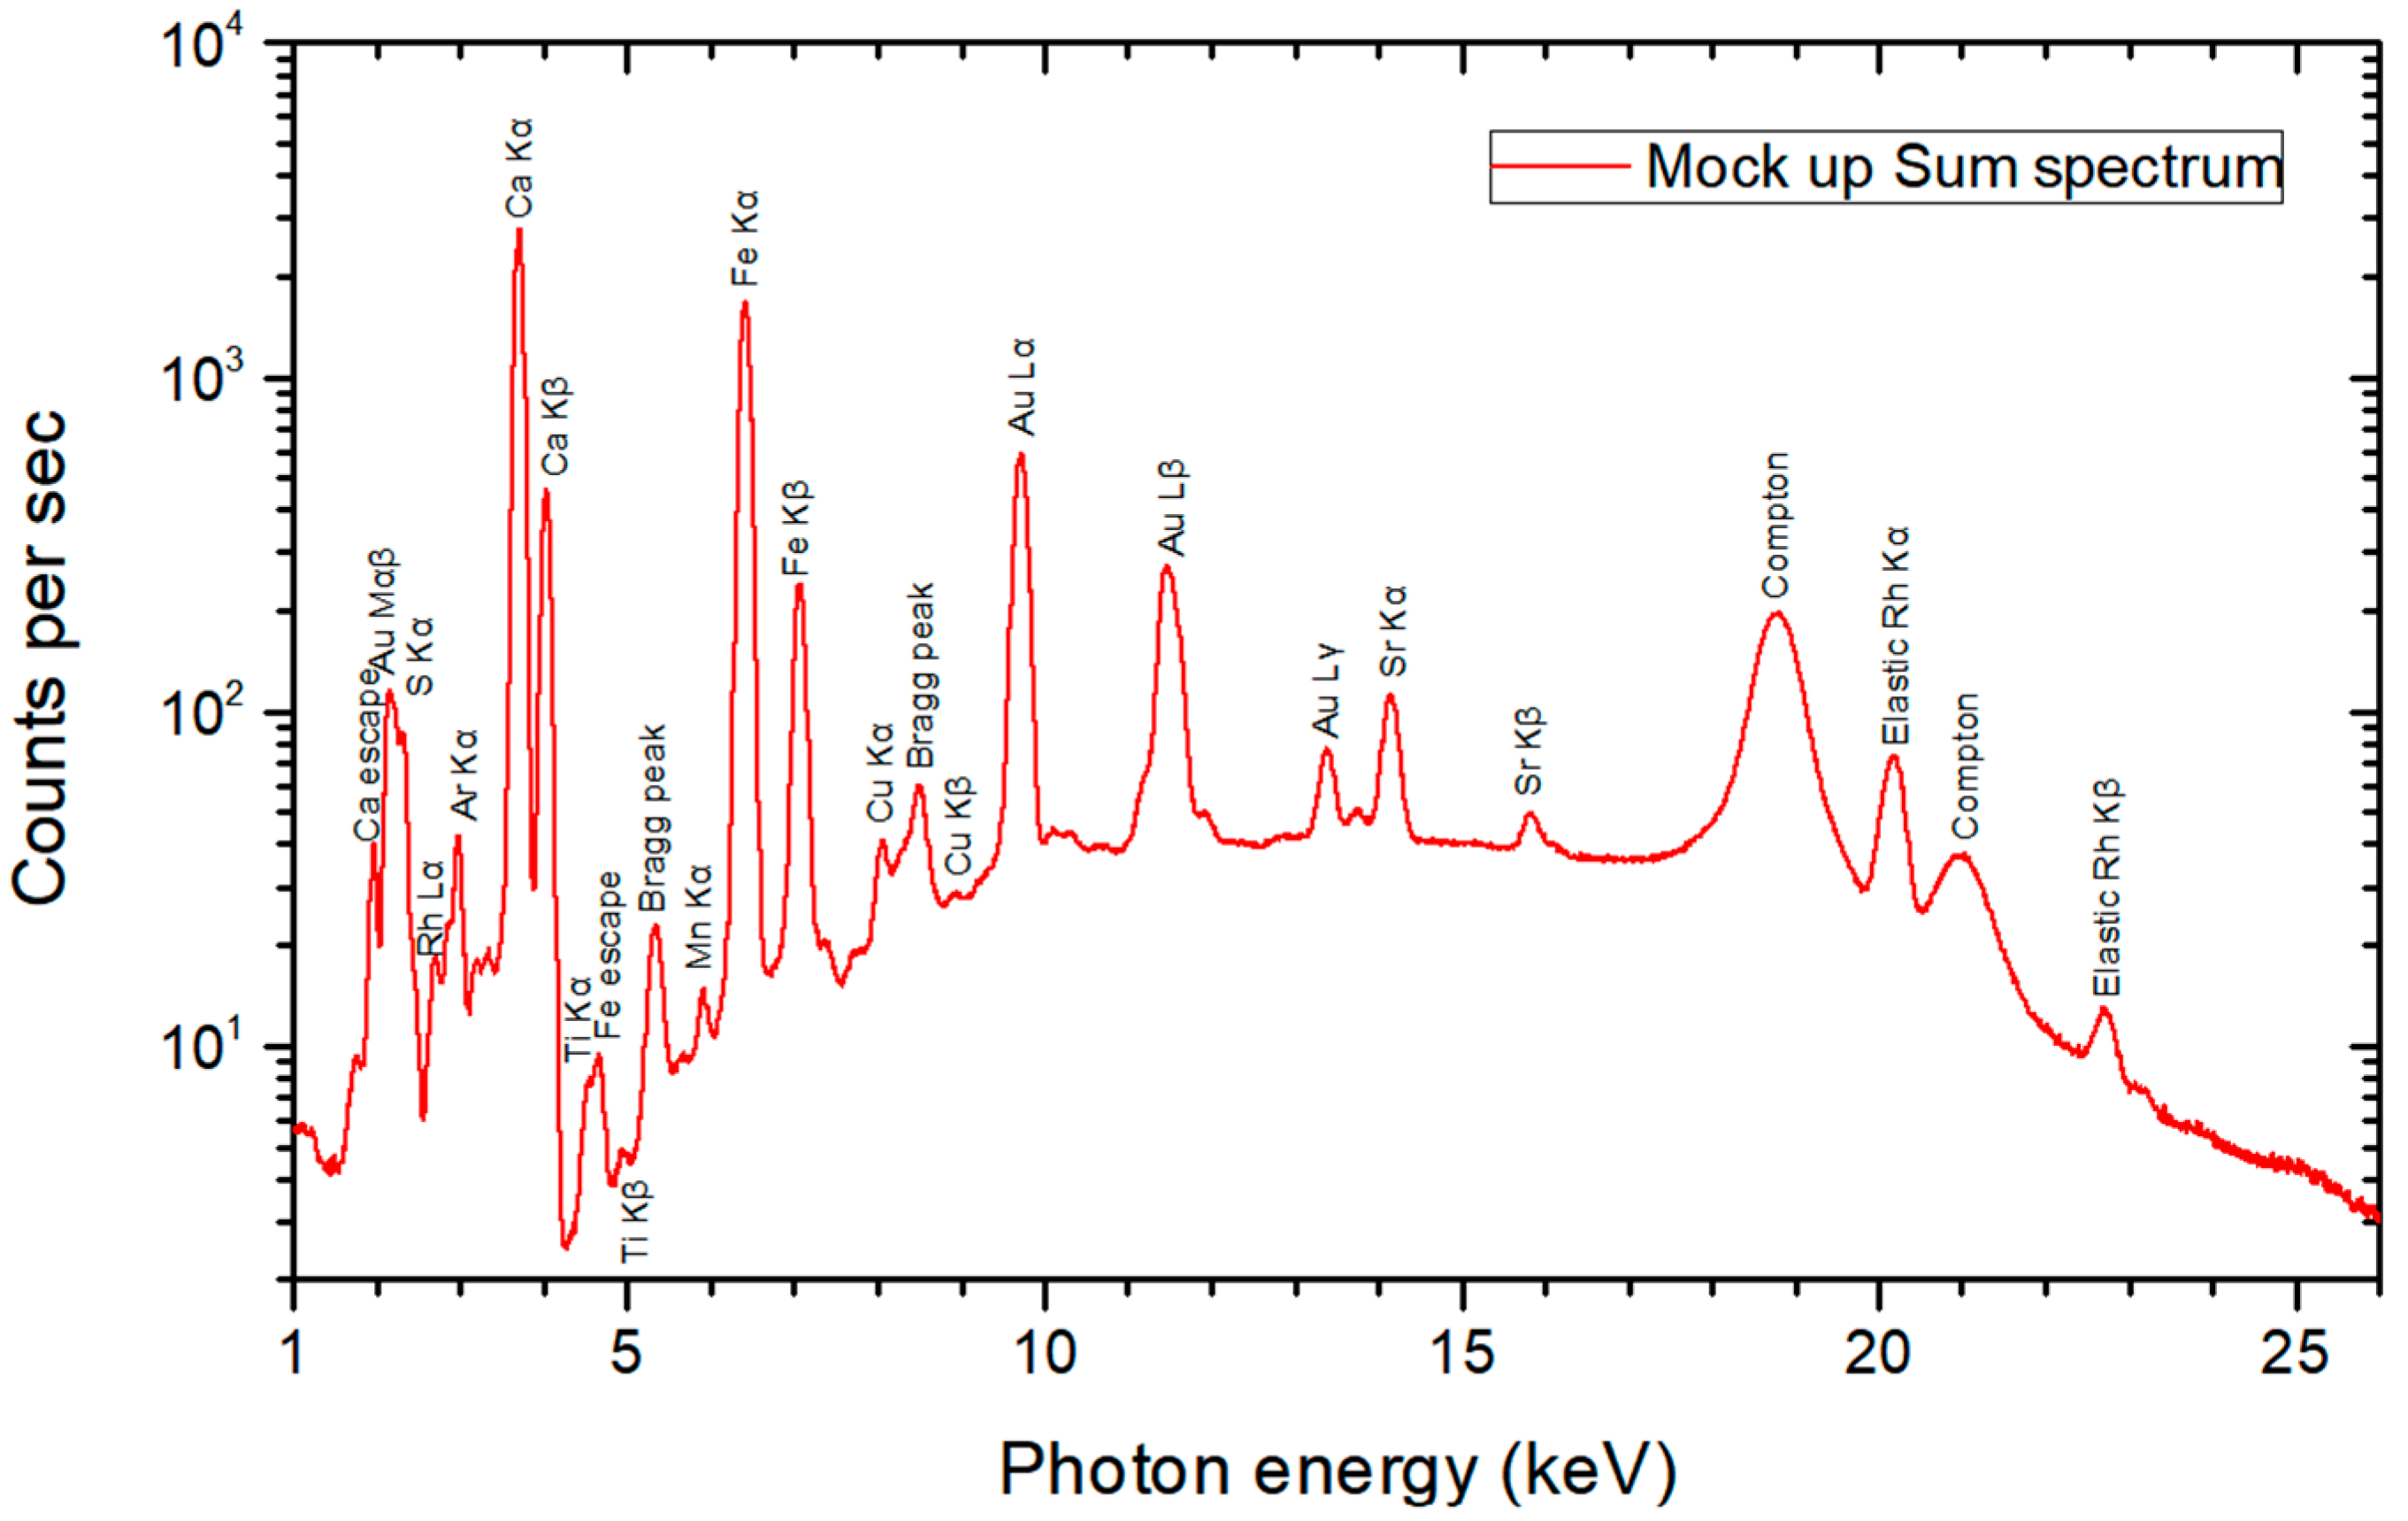
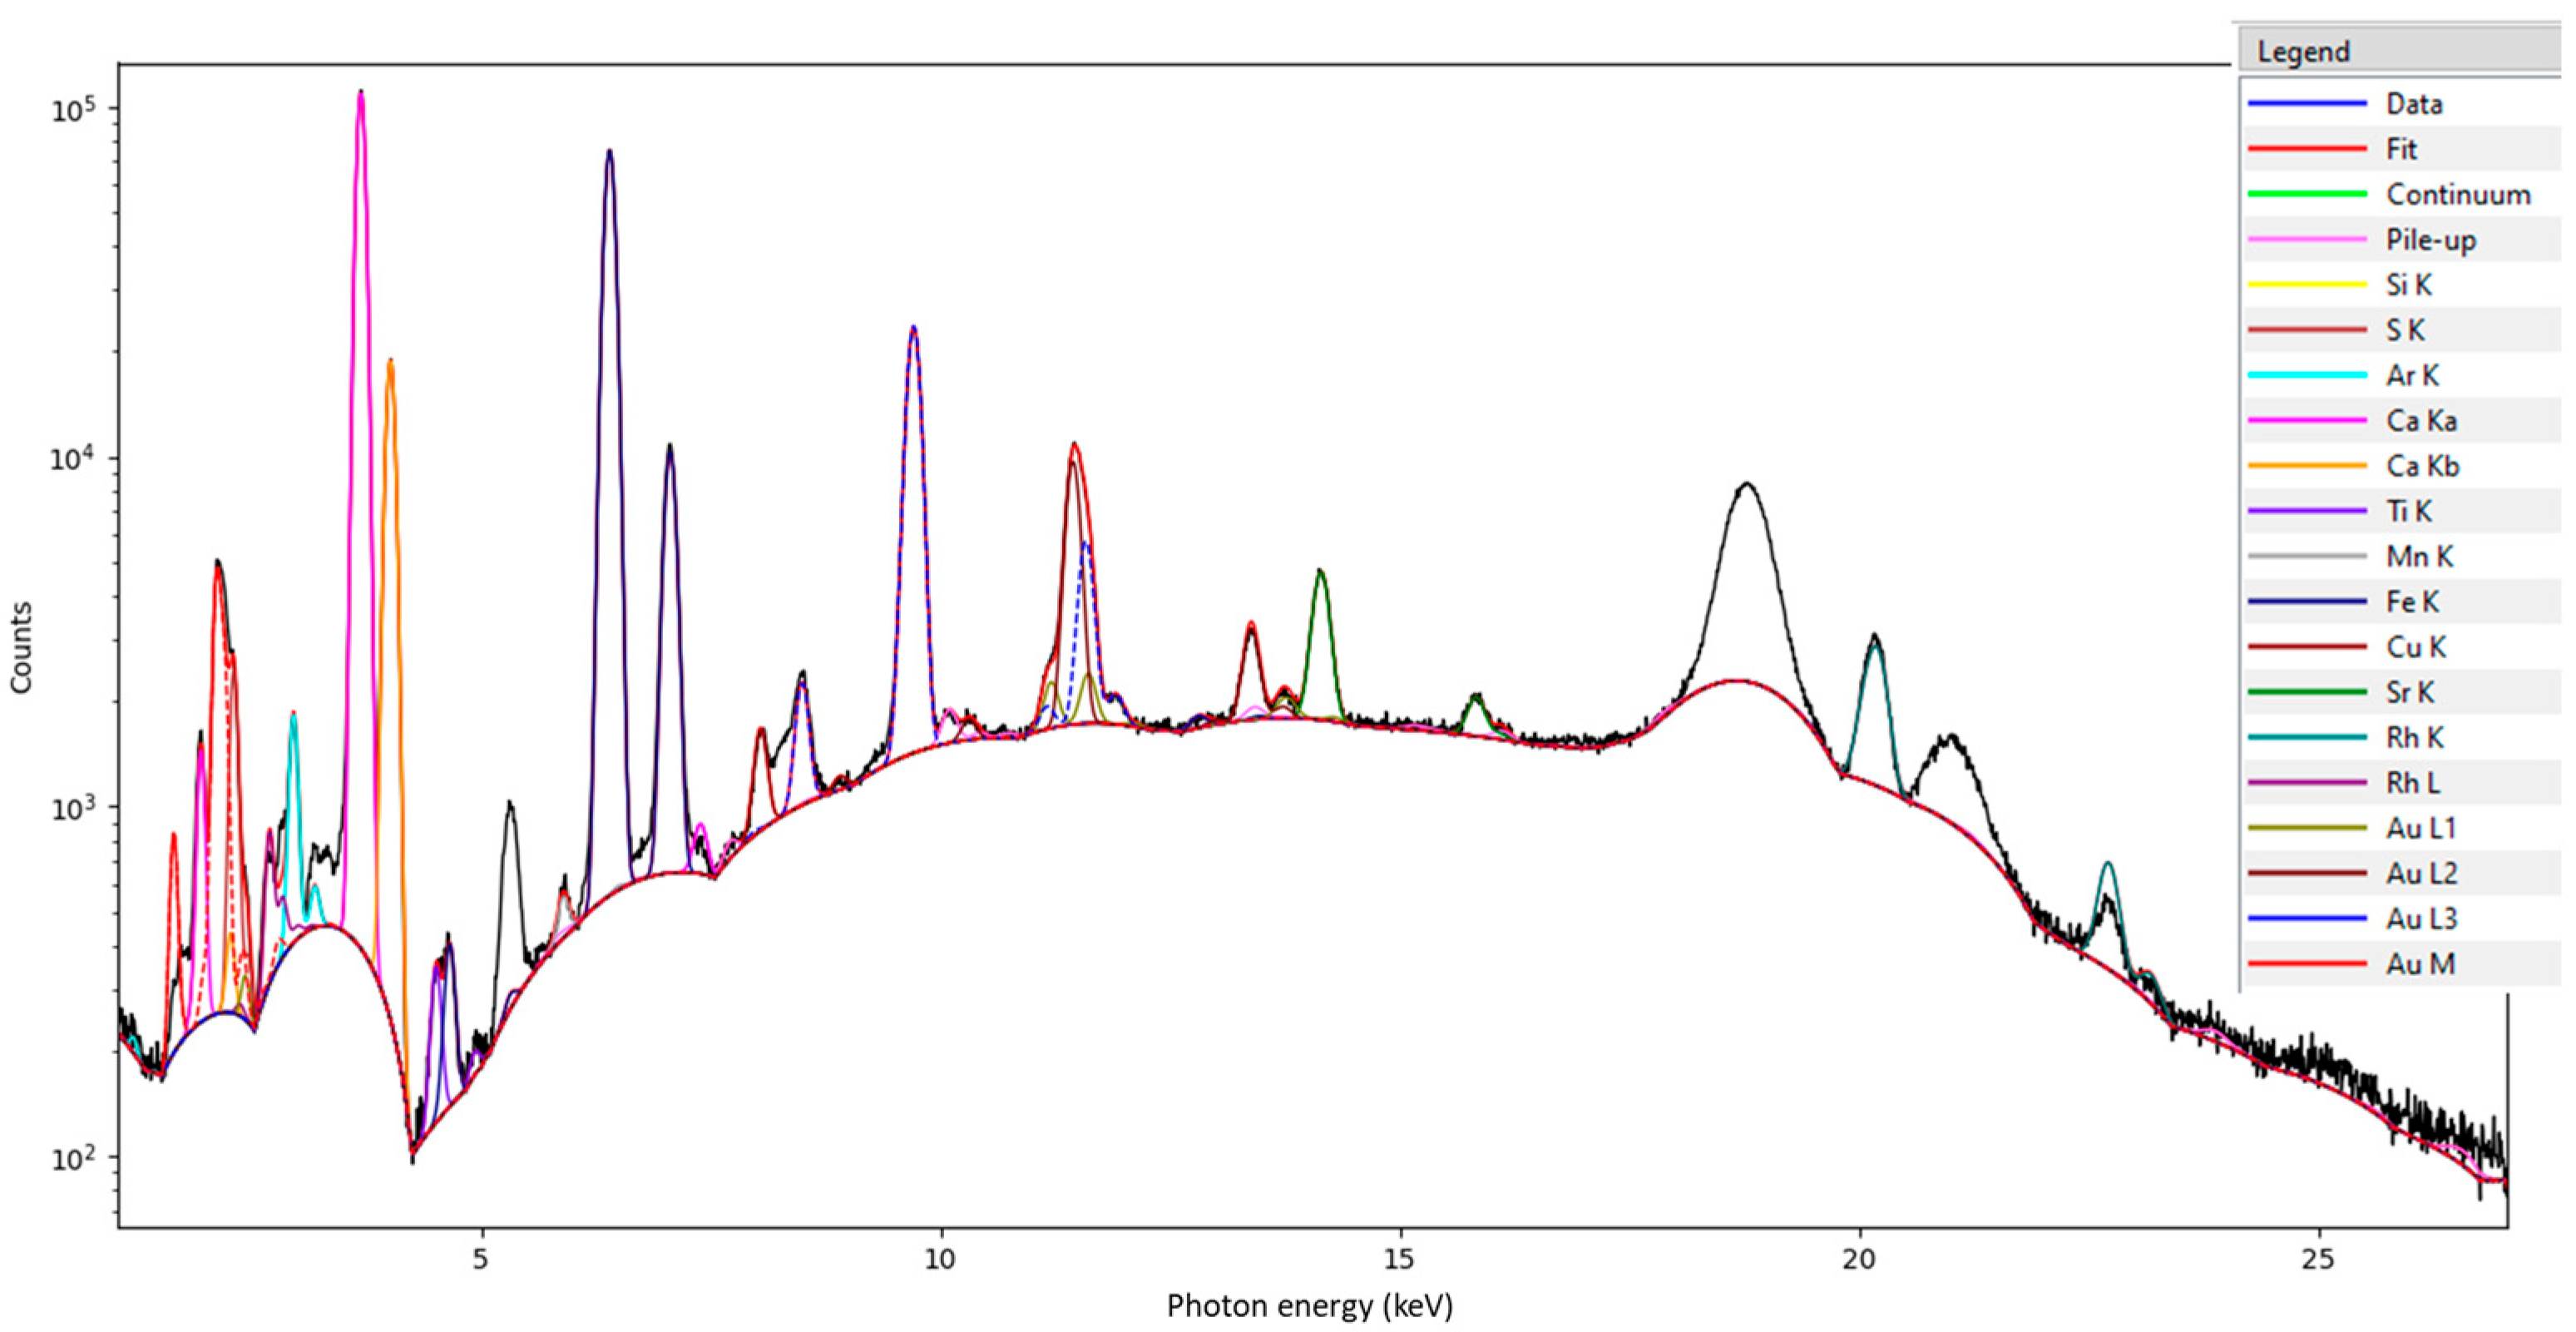
The mock-up sample was scanned using the MA-XRF M6-JetStream scanner. The measuring parameters were set to a high voltage of 50 kV, an X-ray tube intensity of 600 μA, with no filter on the beam path, a beam spot size of 100 μm, a pixel size of 500 × 500 μm2, and a dwell time of 25 ms. In total, 16 × 103 pixels were recorded. The measurement lasted for 5 min, while the total duration of the measuring process was 9 min. Figure 5 shows the sum spectrum. The spectrum analysis shows the presence of sulfur, calcium, manganese, iron, copper, gold, and strontium. Additionally, traces of titanium are present, and Bragg peaks are observed.
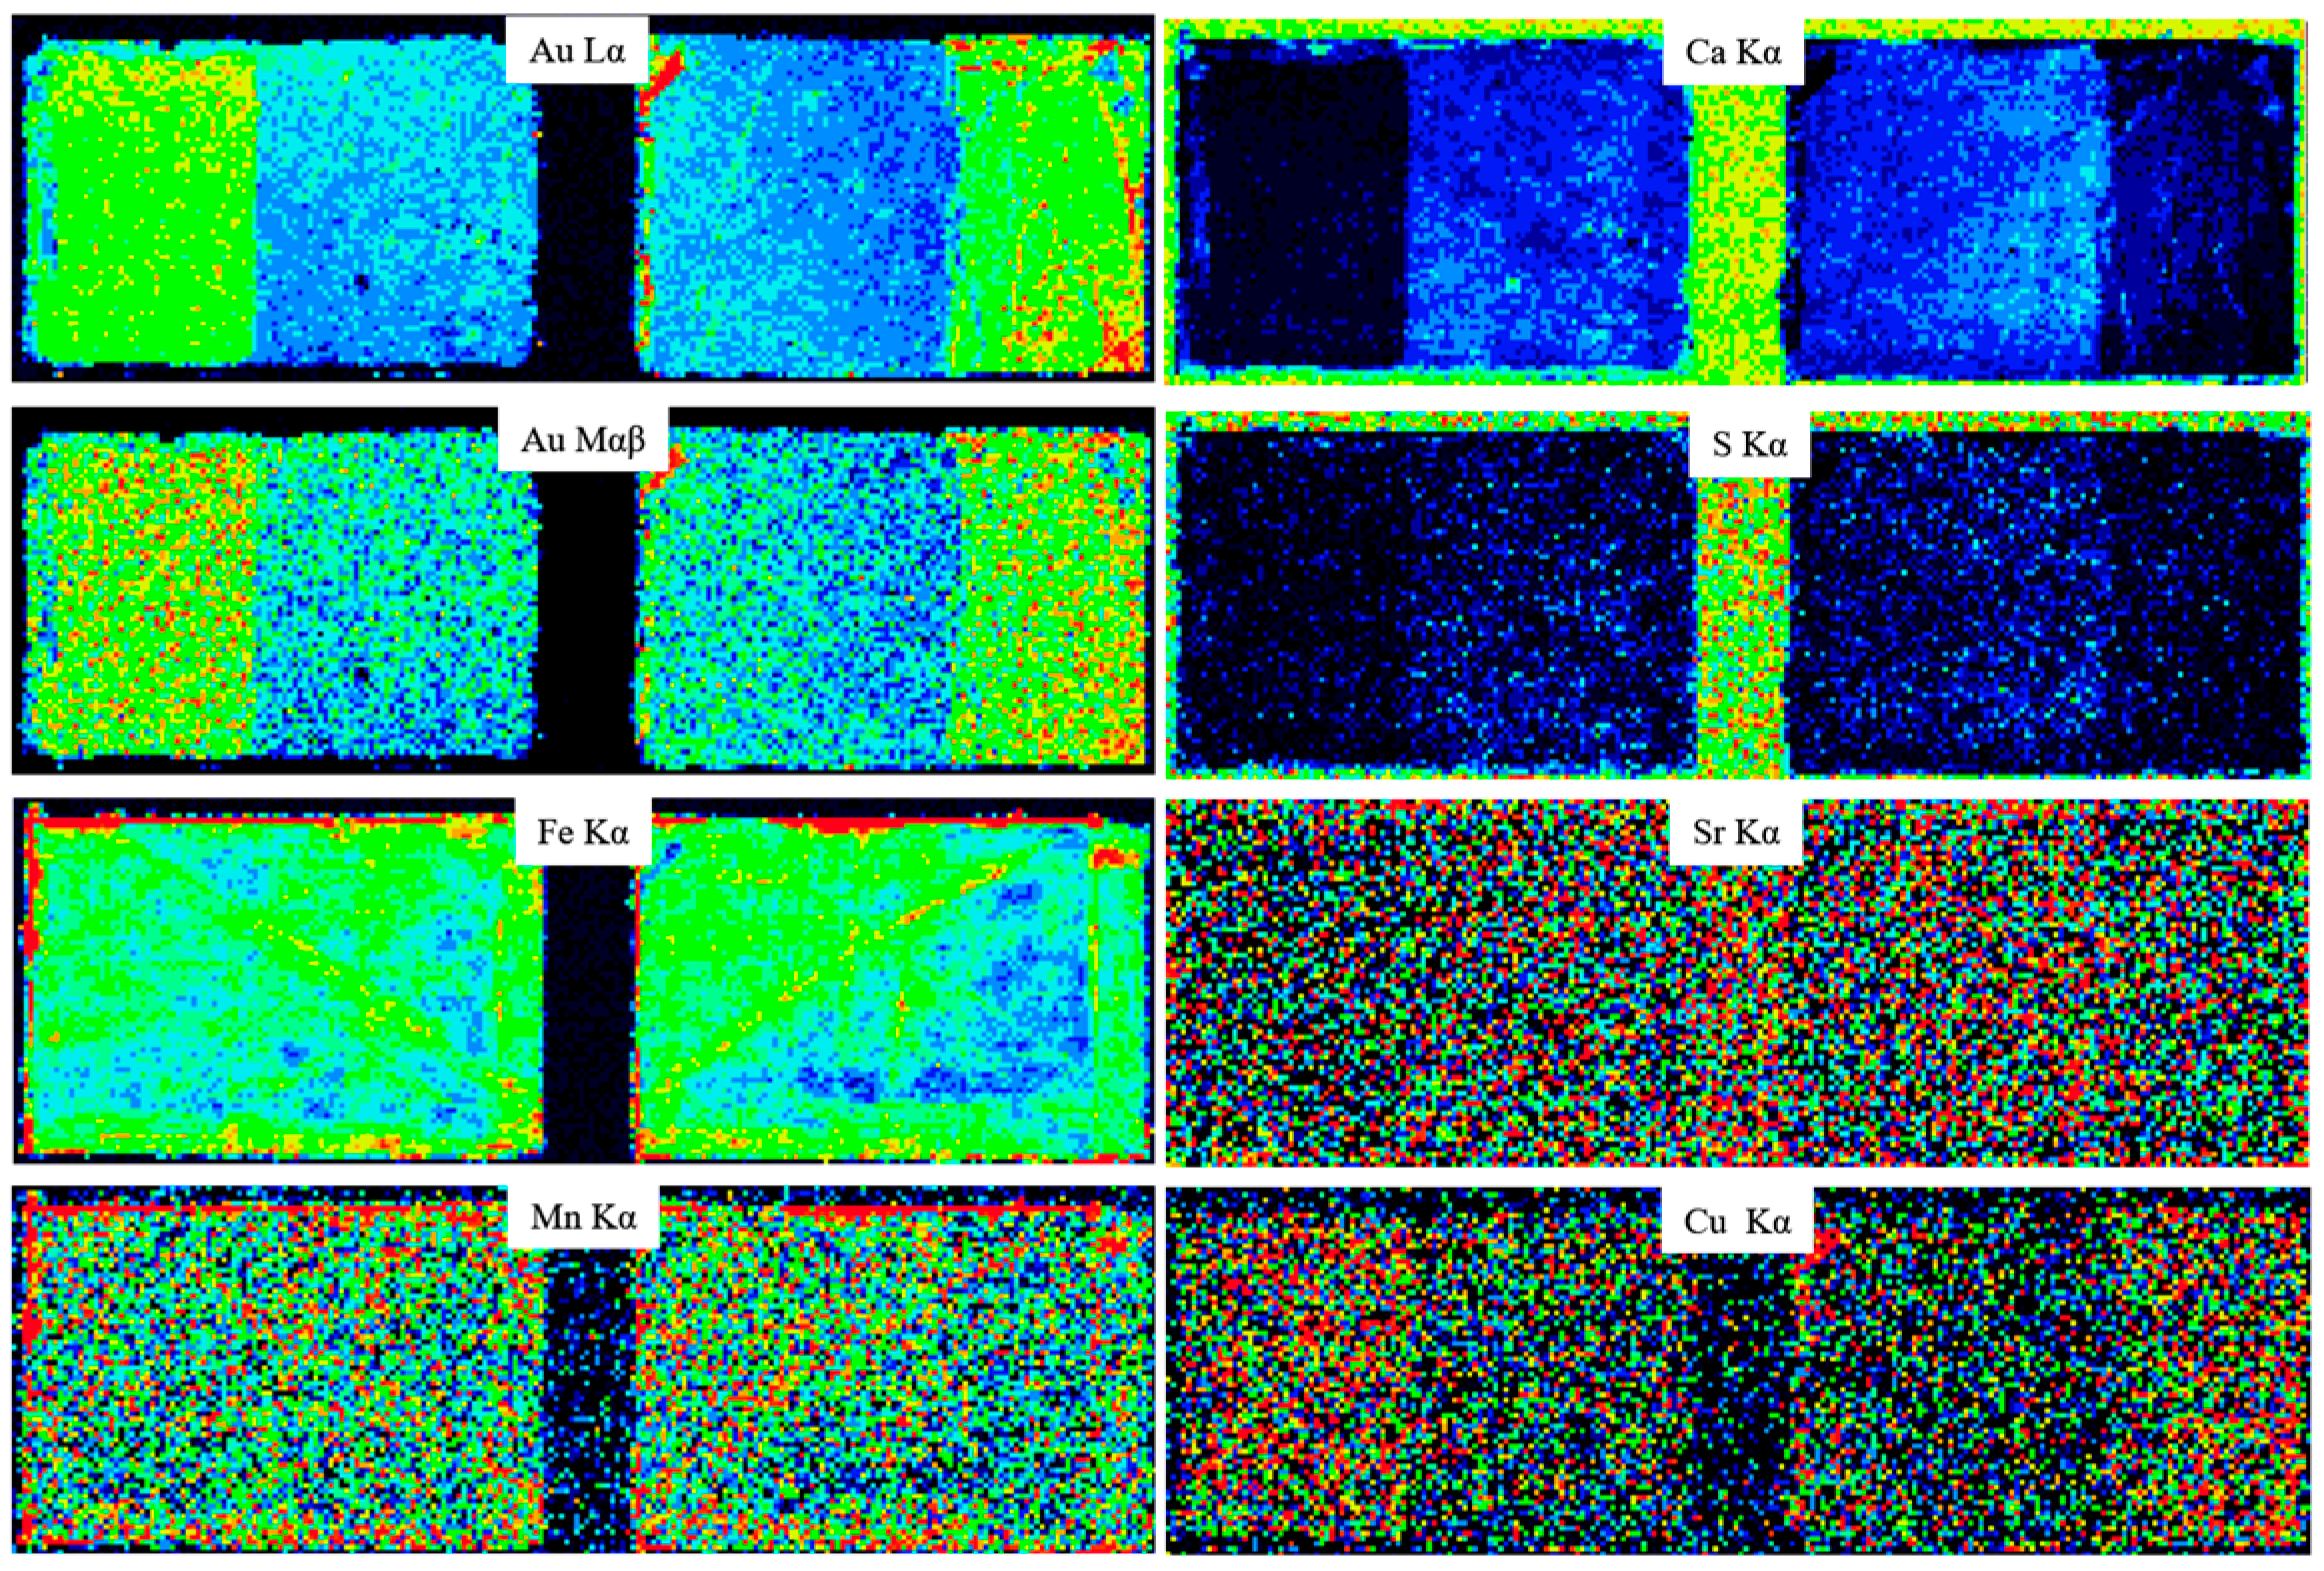
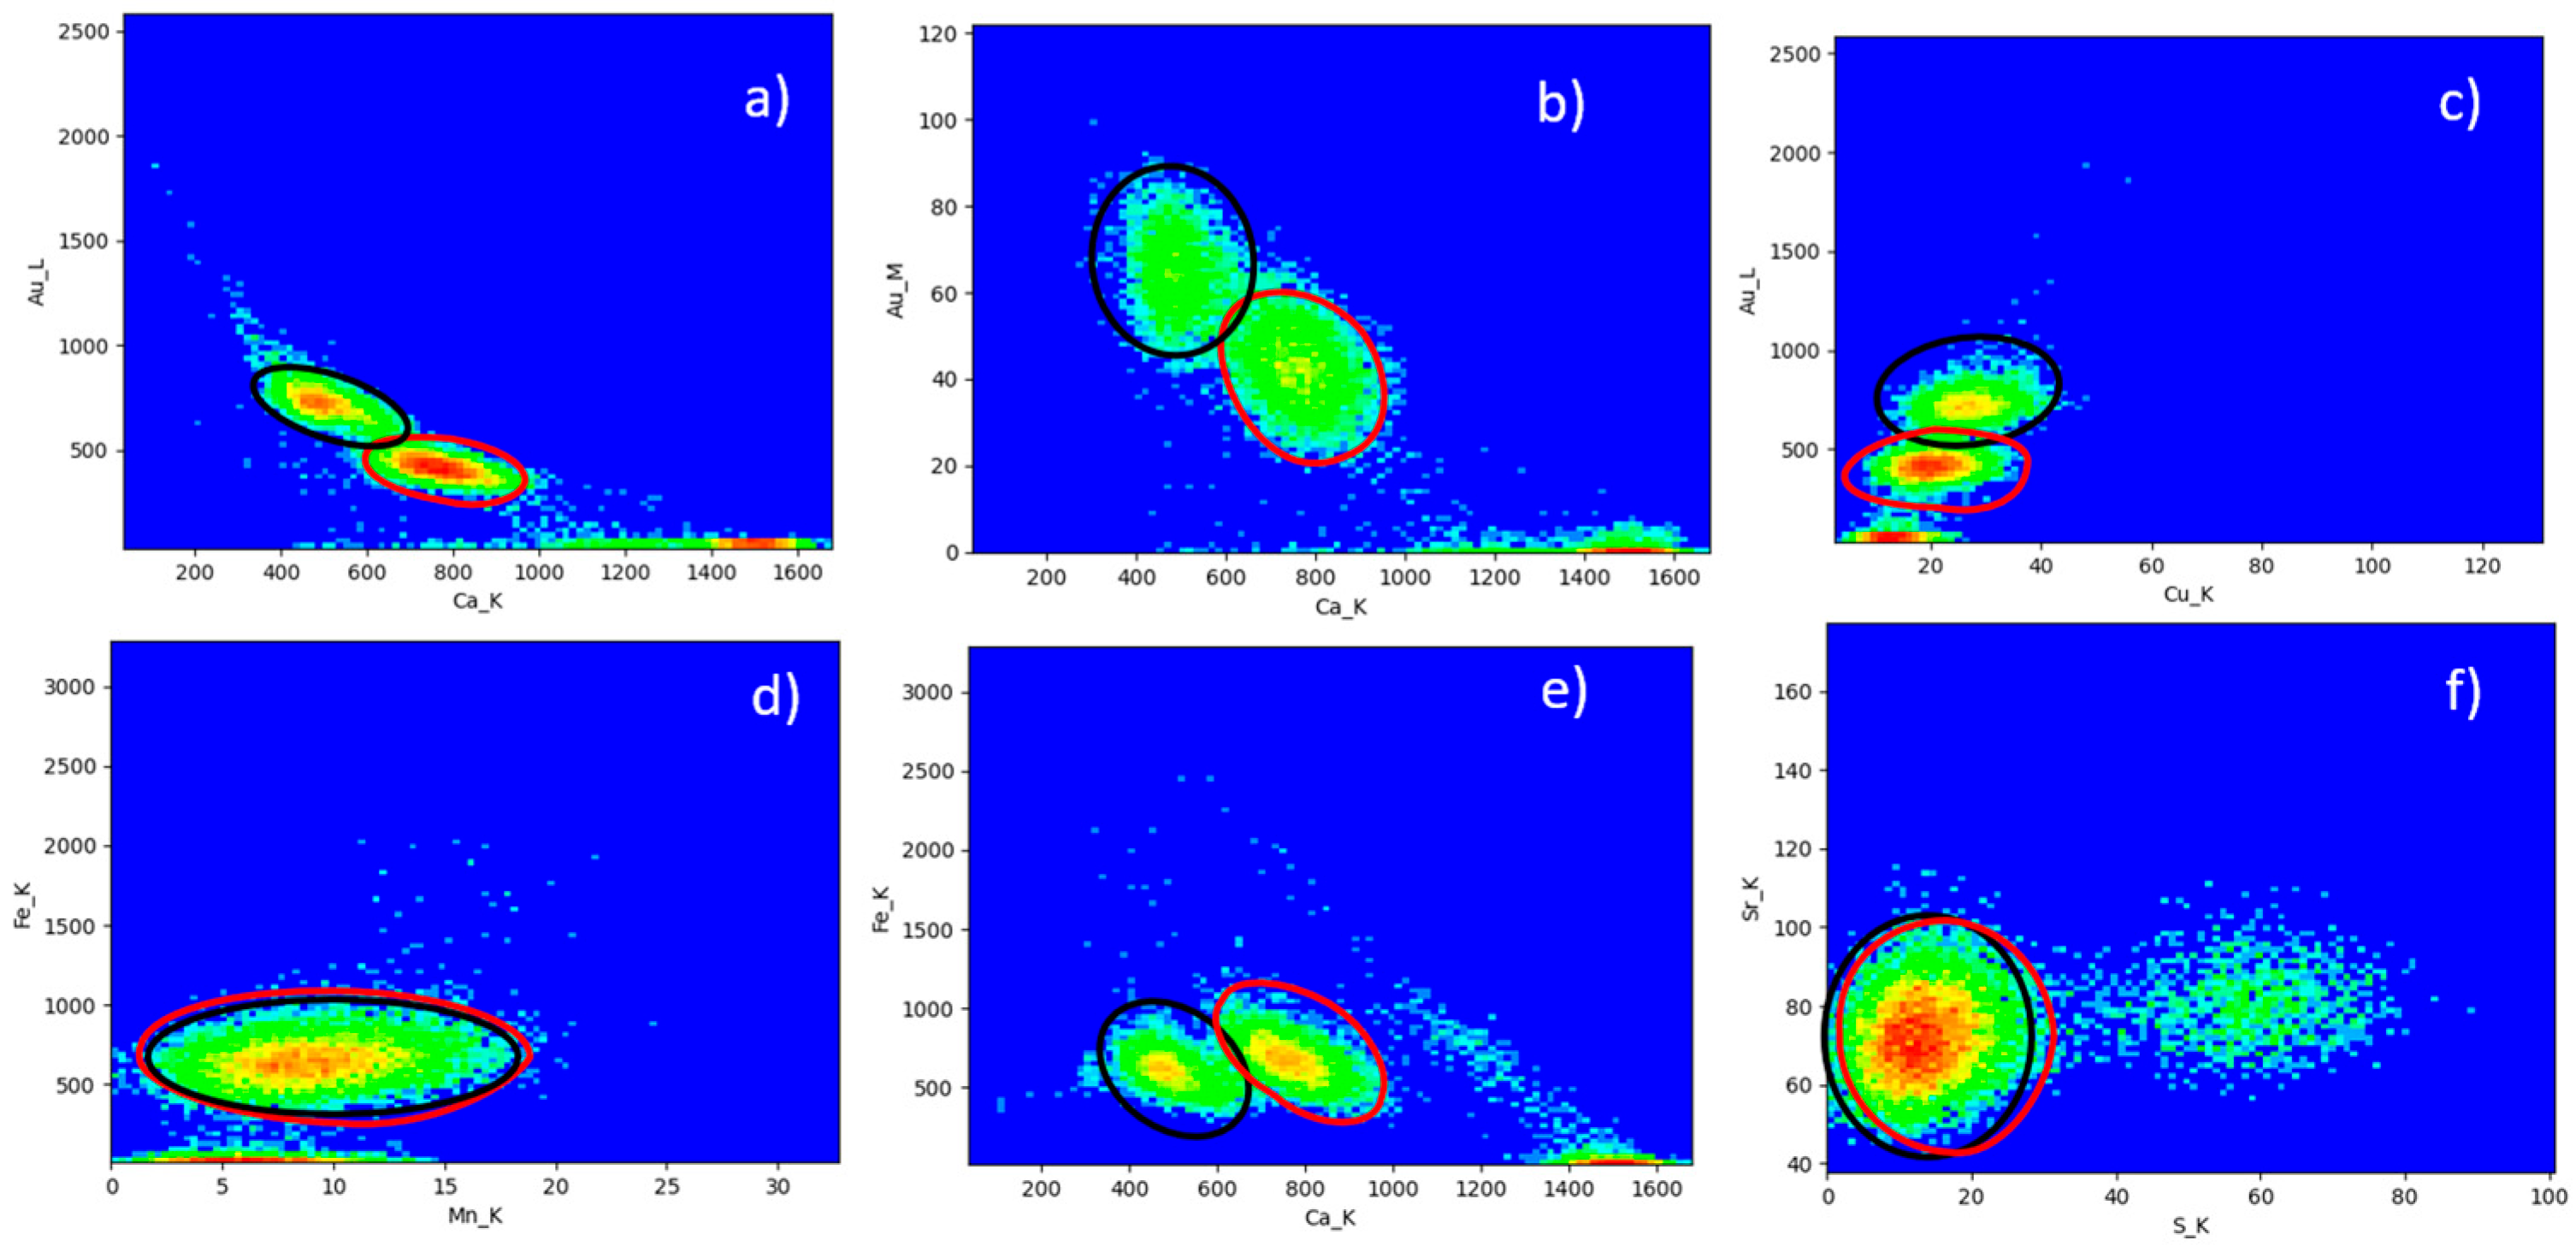
The intensity distribution maps of the S Kα, Ca Kα, Mn Kα, Fe Kα, Cu Kα, Sr Kα, Au Lα, and Au Mα are shown in Figure 6, while the transition scatter plots as extracted by PyMCA [29] are given in Figure 7. On the Au Lα transition map, the areas of the double foil are well separated from the single foil areas. The mean length of the Au Lα photons in gold is about 4 μm (Figure 8). The Au Mα transition map resembles the Au Lα map despite the two transition energies differing by almost an order of magnitude. This indicates that the gold foils are only a few hundred nanometers thick since the mean length of a 2.12 keV photon in gold is approximately 0.5 μm (Figure 8). On the Cu Kα transition map, the areas of the double foil are easily identified even though the Cu weight concentration is expected to be 1%. The Ca Kα intensity distribution exhibits its maximum intensity at the area of the uncovered proprietary layer. The Ca and S Κα intensity distributions are in anti-correlation with the Au intensity distribution. This is justified because the Ca and S Kα photons from the substrate are absorbed more by the double gold leaf. The mean length of the Ca Kα photons (3.69 keV) in gold is about 0.34 μm (Figure 8).
On the other hand, the intensity distribution of Sr Kα of 14.2 keV, although derived from the calcium sulfate ground layer [30], does not distinguish the double film from the single film. This is because the mean length of the Sr Kα photons in gold is 3.2 μm, an order of magnitude greater than the thickness of the leaves. Interestingly, the Fe Kα intensity map reveals no differences between areas covered by a single gold layer and those covered by a double gold layer. This can be explained by the mean length of Fe Kα photons in gold, which is 1.4 μm, one order of magnitude greater than the thickness of the leaf. The Fe Kα intensity map reveals uneven areas of adhesive distribution between the preparatory layer and the gold leaf, which correlates with the bole application method. The Mn Kα intensity map exhibits a similar distribution to the Fe Kα intensity map, though with less statistical data. The mean length of Mn Kα photons in gold is 1.2 μm, comparable to Fe Kα’s.
Figure 8. Mean absorption length in gold as a function of photon energy [31]. The energies of specific characteristic transitions and the corresponding mean lengths are marked in black dots.
Heritage 08 00432 g008

4.2. Thickness of the Gilded Areas on the Mock-Up

The gold leaves’ surface density and thickness are determined by measuring the intensity of the Au Lα transition and applying the Sherman equation under the thin film approximation, as described in Equation (4). The thin leaf approximation is justified twofold. Firstly, the leaf thickness was determined as a free-standing object in Section 3.2. The extracted value of about (120 ± 20) nm justifies the thin leaf approximation for the Au Lα transition. Secondly, and most importantly, the leaves’ thickness below 1 μm is verified experimentally from the intensity distribution map and the scatter plot of the Au Mα transition. The intensity of the Au Mαβ transition is nearly double for the double layer compared to that of a single layer, indicating that the leaf thickness is well below 500 nm. This observation is significant because it allows us to estimate the order of magnitude of the leaf’s thickness without prior knowledge of the film thickness and before we pursue accurate quantification.
The surface density of the gilded structure was measured for five areas on the mock-up, as illustrated in Figure 3. The sum spectrum has been evaluated for each area, and the intensity of the Lα transition has been evaluated by fitting the spectrum using the PyMCA code [29] (Figure 9). Based on Equation (4), the extracted gold thickness, with a sensitivity of (40 ± 6) cps/μg/cm2, an Au weight concentration of 99% (which corresponds to 23.75-karat gold leaf), and a leaf density of 19.3 g/cm3, is provided for the five areas in Table 1.

4.3. The Thickness of the Gilded Areas on the “Virgin Mary, Odigitria” Icon

An 18th-century Greek icon from Epirus (NW Greece) depicting the Virgin Mary “Odigitria” (The Guide) was treated as a case study example to determine the thickness of the gold leaves [10]. The icon is attributed to the renowned “Kapesovites” painters active in NW Greece from the mid-18th to late 19th century. The icon, which measures 28 × 21 cm2, was scanned with M6-Jestream [32]. The measuring parameters were 50 kV, 600 μA, no filter, beam spot 100 μm, pixel size 300 × 300 μm2, and dwell time 10 ms. In total, 0.7 M pixels were recorded. The overall measuring time was 3.20 h.
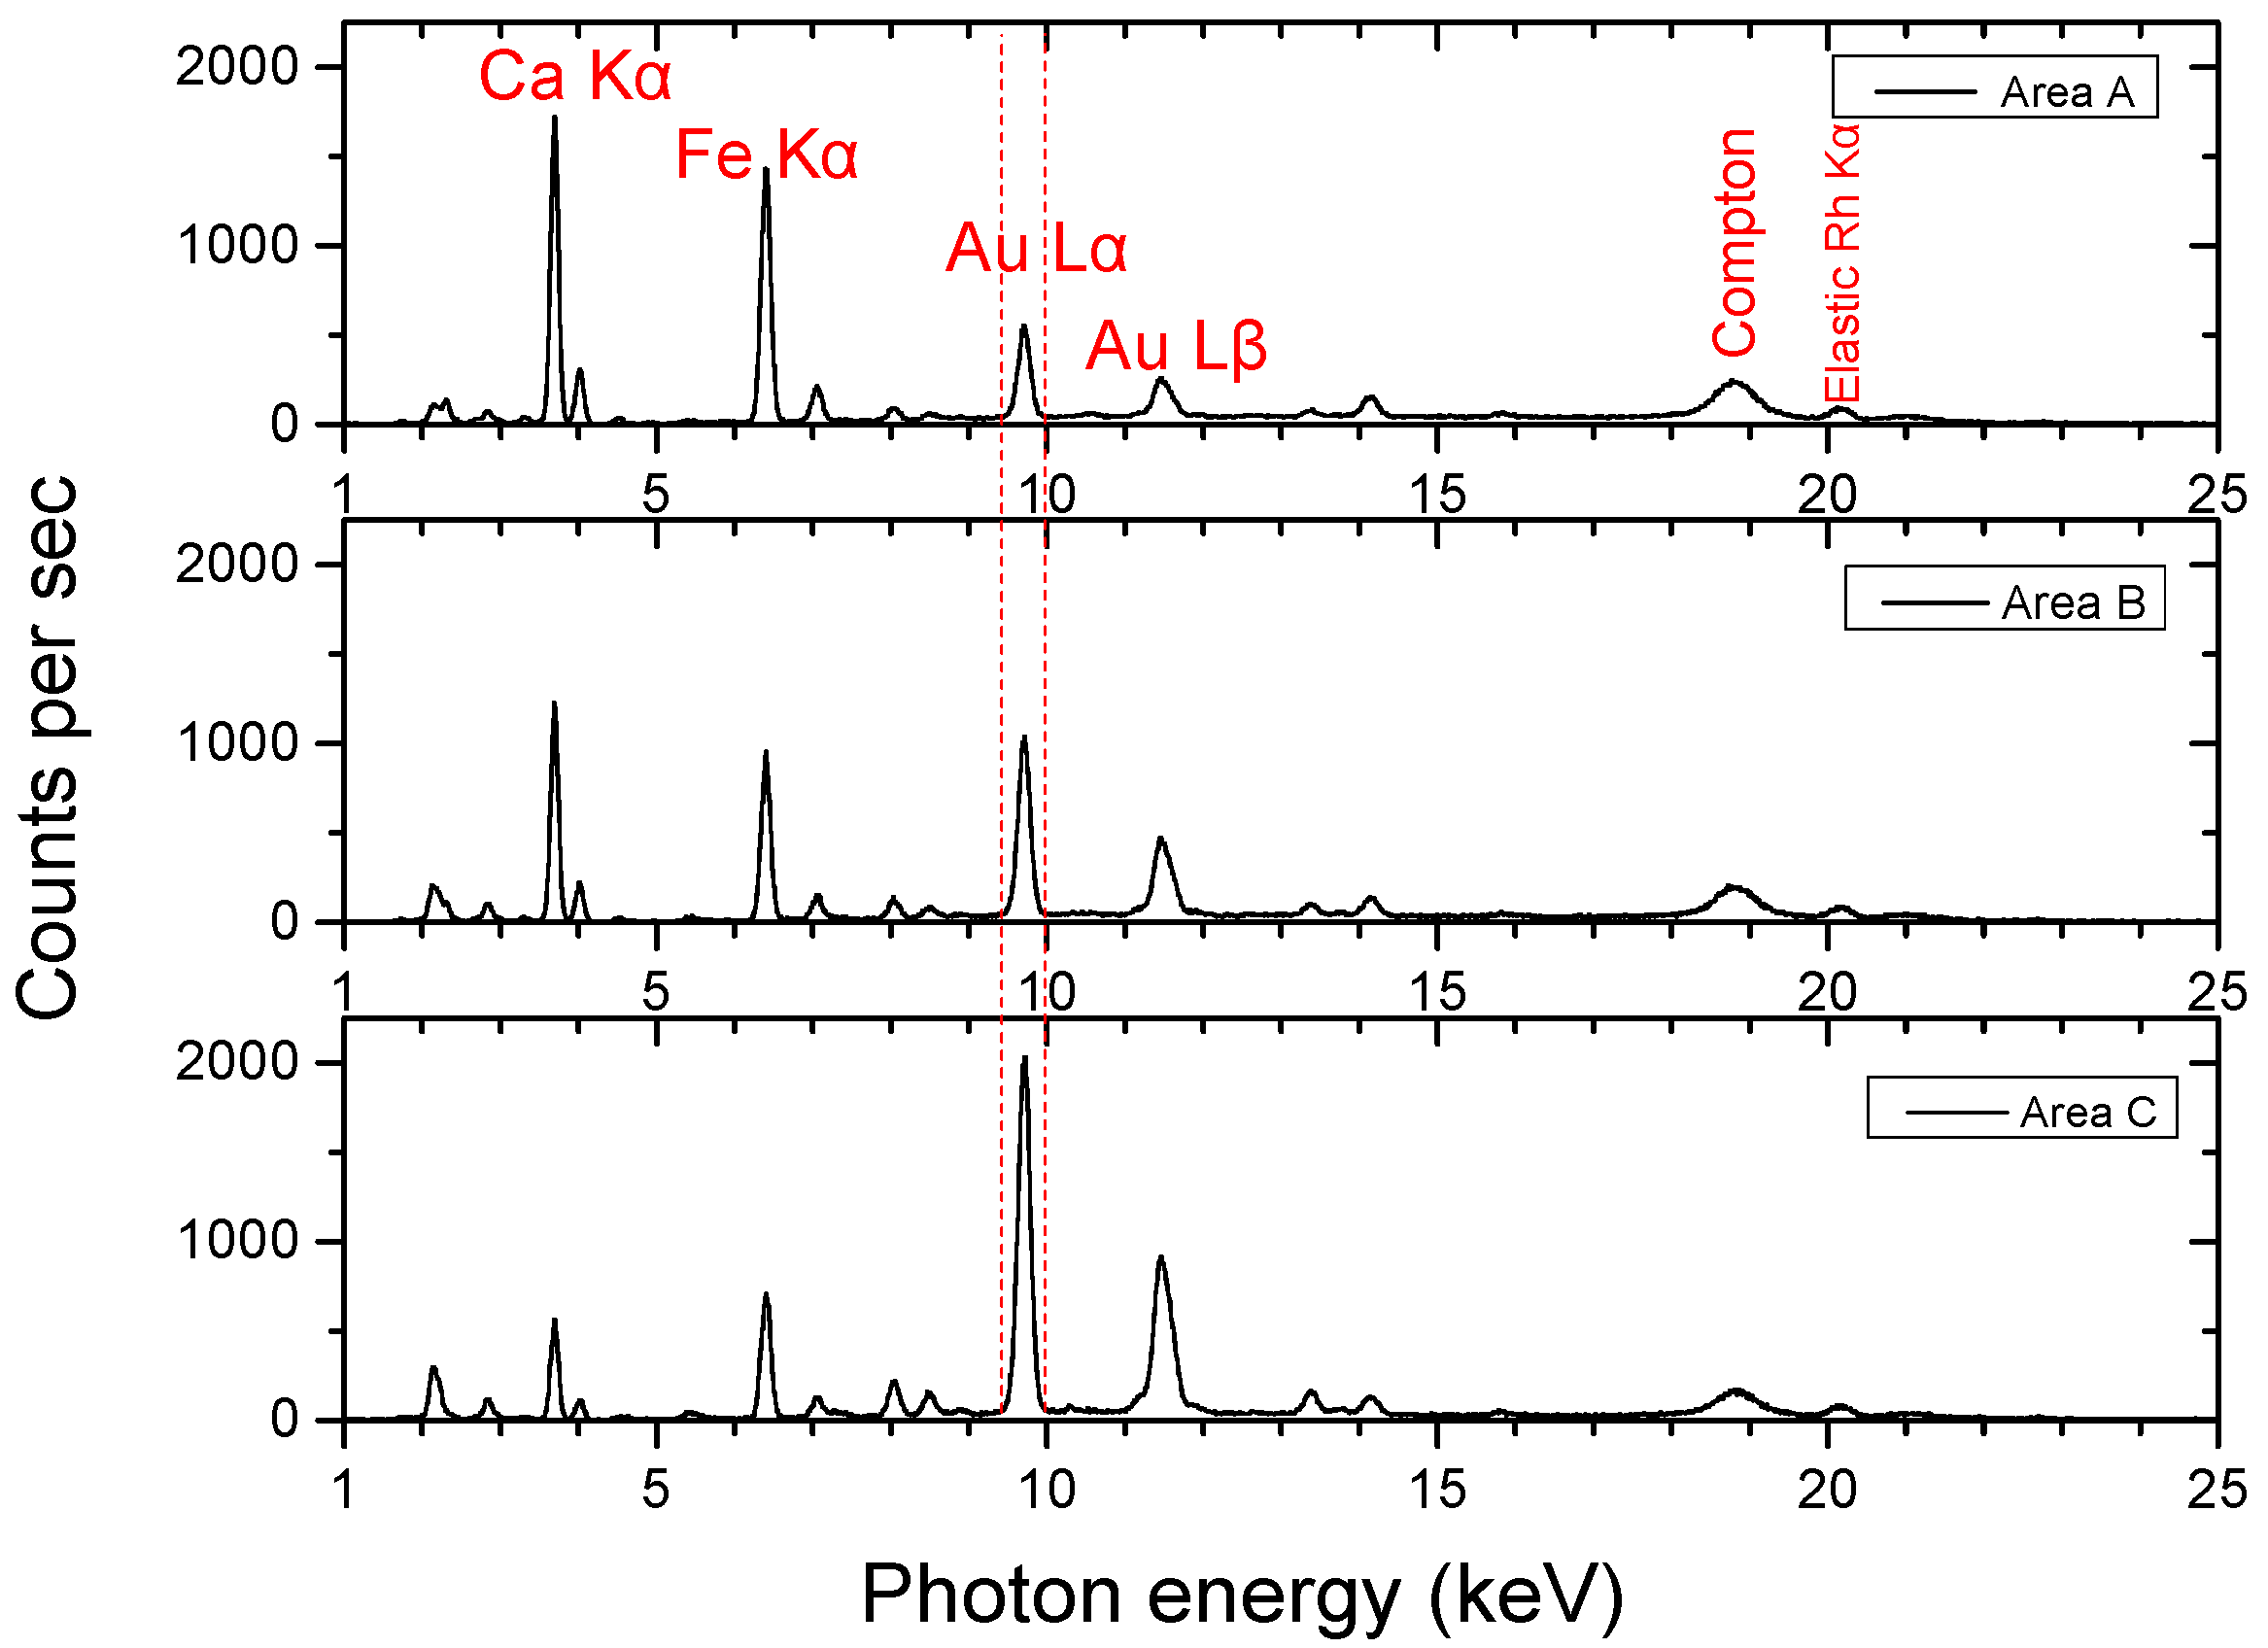
On the Au Lα and Mα transition map, the halo and mantle fringe appear as continuous areas, indicating the use of gold leaf (Figure 10). It is worth mentioning that gold was extensively used in post-Byzantine painting to render icons’ backgrounds, saints’ halos, and other iconographical details because this glittering and noble material was considered a symbol of divine glory. The distribution of Au Lα and Mαβ intensities varies depending on position. Notably, the changes in Au Mαβ intensities align with the changes in L intensities, suggesting that the gold foils are only a few hundred nanometers thick (refer to the discussion in Section 4.1). Three regions with varying intensities of Au Lα were selected, as shown in Figure 10. The average sum spectrum of each region is shown in Figure 11.
The Au intensity variations indicate the presence of different thickness layers. The extracted average intensity from each area is given in Table 2. It is interesting that the intensities in areas “B” and “C” are approximately two and four times higher than the measured intensity in area “A”. Additionally, the measured gold thicknesses for the selected areas “A,” “B,” and “C” are listed in Table 2. The value of the smaller gold leaf was determined to be approximately 120 nm, indicating a single layer of gold leaf. Moreover, the typical gold leaves used by post-Byzantine painters were extremely thin, measuring less than 1 µm [14], which is also true for the studied icon. Notably, the intense Au structure observed in the Lα and Mα maps (area “C”) is estimated to correspond to a structure with four layers of gold foil.

4.4. The Thickness of the Gilded Areas on “St John the Forerunner with Scenes from His Life” Icon

The icon “St. John the Forerunner, with scenes from his life,” created by the renowned Cretan artist Theodoros Poulakis (ca. 1622–1692), was selected to assess the thickness of the applied gold leaf [8]. Poulakis, a prolific artist of the post-Byzantine period, is well known for his refined technique, often incorporating detailed miniature scenes and stylistic elements inspired by Western European—particularly Flemish—engravings. His work had a lasting influence on religious icon painting during the late 17th and 18th centuries, shaping the idiom of many contemporary and later iconographers. Today, more than 130 icons, either signed by or attributed to Poulakis, are preserved.
The icon examined in this study measures 52.7 × 42.0 × 2.7 cm3 and is exhibited at the Byzantine Museum of Ioannina (BMI). Following official approval, the artwork was transferred under the supervision of conservators and archaeologists from the Ioannina Ephorate of Antiquities. The analysis was conducted using the M6 Jetstream system. Measurement parameters included an accelerating voltage of 50 kV and a current of 600 μA, with no filter applied. The beam spot was 100 μm, and the pixel size was set to 300 × 300 μm2, with a dwell time of 4 ms per pixel. A total of ~2,500,000 spectra were recorded. The total measurement time lasted about 3.3 h.
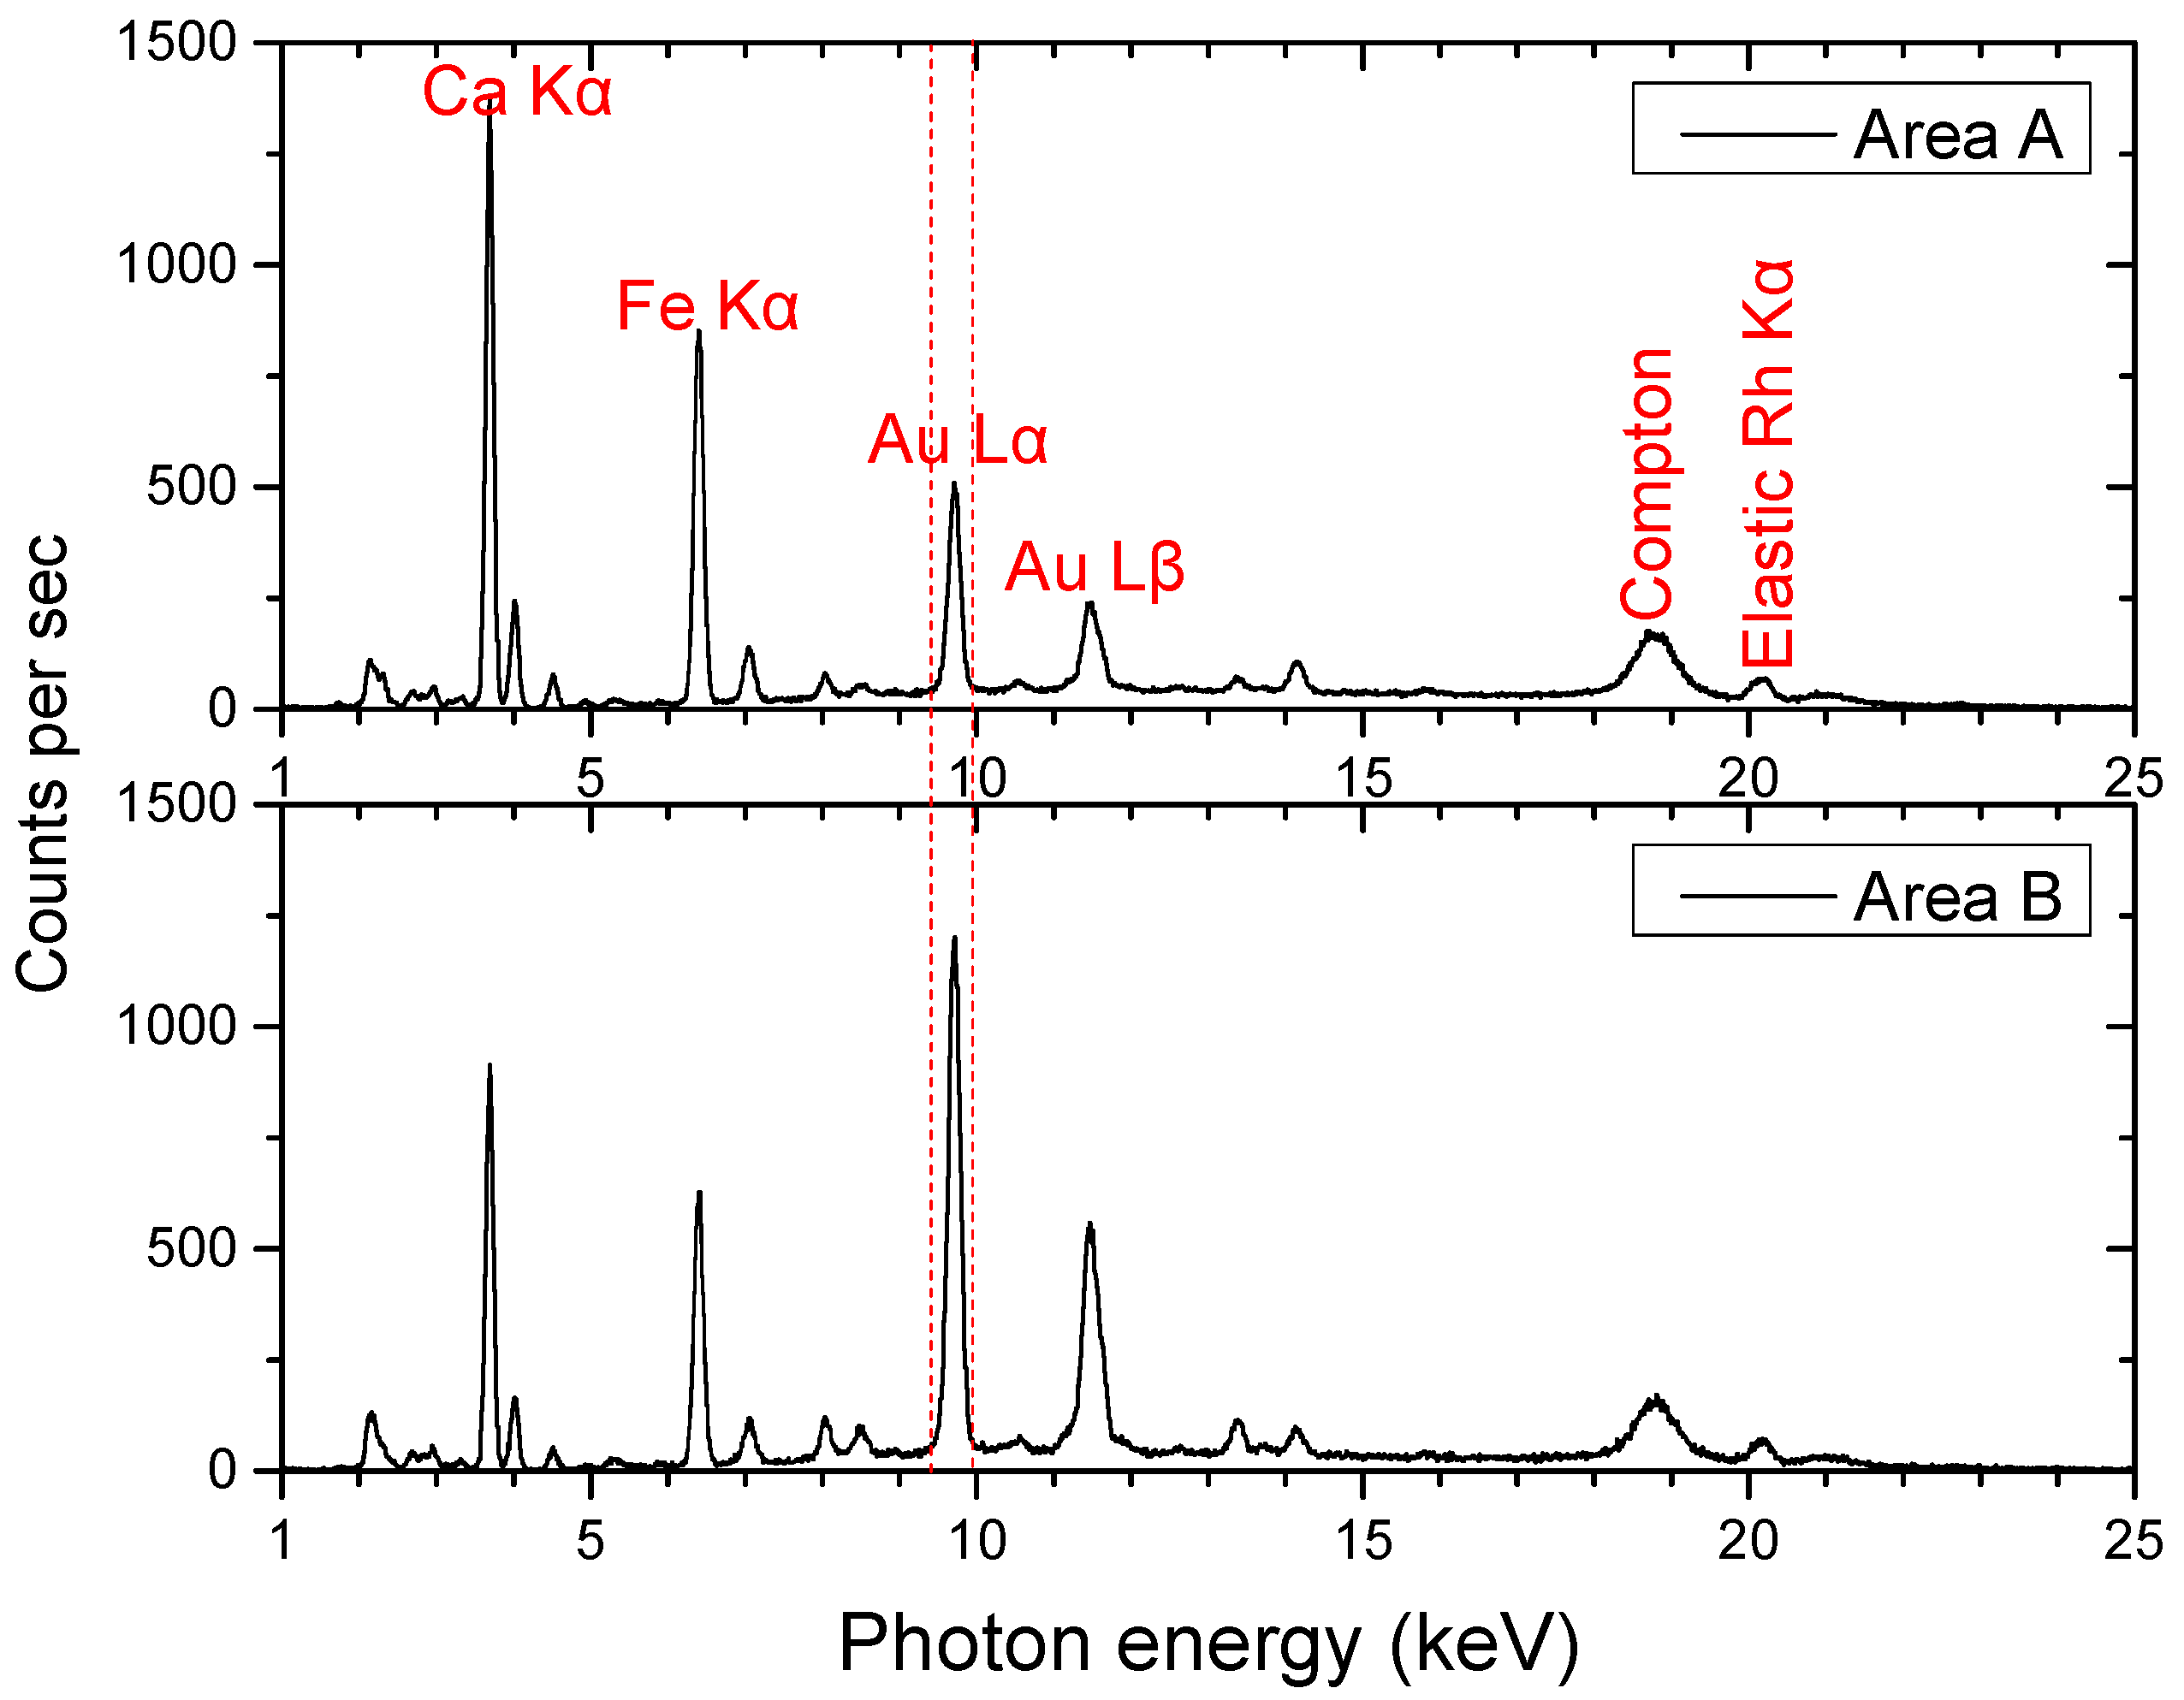
The elemental maps of the Au Lα and Mα transitions clearly delineate gilded areas, such as the halo and decorative elements, pointing to the use of gold leaf—a widespread practice in post-Byzantine iconography for conveying divine radiance and symbolic prominence. Two regions with varying intensities of Au Lα were selected, as shown in Figure 12. The average spectrum of each region is shown in Figure 13.
Quantitative assessment of regions A and B (Figure 12) yielded thickness values of 118 ± 18 nm and 300 ± 45 nm, respectively. Area A corresponds to a single leaf of gold, whereas the higher intensity in area B is consistent with the application of approximately three overlapping gold layers (Table 3). These results confirm the use of ultra-thin gold leaf (typically <1 µm), in line with historical techniques, and highlight the deliberate use of multiple layers to achieve stronger visual or symbolic effects in specific iconographic zones.

5. Conclusions

Thin gold leaves were frequently used to embellish panels and wall paintings in post-Byzantine religious art. Measuring the thickness and composition of leaves non-destructively is essential for understanding the materiality of these artifacts and could help create a comprehensive preservation plan. In the present study, large-dimension imaging micro-X-ray fluorescence spectroscopy is applied to determine the thickness of gildings noninvasively using the M6-Jestream, Bruker scanner. A mock-up gilded sample manufactured using traditional post-Byzantine icon gilding techniques was measured and analyzed. The thickness determination is based on the correlation between the intensity of the Au Lα and the thickness of the gilded layers. We show that single-element intensity distribution maps and scatter plots of elemental transitions provide valuable insights for determining the thickness of the gilded layer. The M and L Au X-ray intensity distribution not only allows for the discrimination of areas with single, double, or more gold-leaf layers but also gives an immediate estimation of the order of magnitude of the leaf’s thickness. Summing spectra from similar layer structures enables us to address statistical issues caused by the short measuring time during the scanning process. More importantly, it helps to minimize local structure artifacts. A precise calibration curve was established to determine the exact thickness value that links the intensity of the characteristic gold X-ray Lα fluorescence transition with the layer’s sensitivity. The determined gold thickness for single and double gold leaves on the mock-up aligns with the standard thickness of the foils used to create the gilded structure. Furthermore, the gilded structure of Greek religious iconography was examined through two case studies. The single gold leaf thickness was found to be well below 0.2 μm. This thickness is in very good agreement with the high-quality medieval gold leaves.

Author Contributions

Conceptualization, D.F.A.; methodology, G.P.M., A.G.K. and D.F.A.; software, S.D.; validation, A.T., A.G.K. and D.F.A.; formal analysis, I.V.P. and A.A.; investigation, I.V.P., A.A., and A.T.; resources, G.P.M., A.G.K. and D.F.A.; data curation, I.V.P. and A.A.; writing—original draft preparation, I.V.P., G.P.M., D.F.A.; writing—review and editing, A.G.K. and D.F.A.; visualization, I.V.P., A.A., S.D., and D.F.A.; supervision, D.F.A.; project administration, D.F.A.; funding acquisition, D.F.A. All authors have read and agreed to the published version of the manuscript.

Funding

Part of the research was funded through the project of the Region of Epirus titled: “Conservation–restoration of cultural monuments of the Region of Epirus 2020–2022 (2020ΕΠ53000002)”. Sub-project: Grant from the Research Committee of the University of Ioannina for the project: “Study of cultural heritage objects of the Ephorate of Antiquities of Ioannina with non-destructive characterization techniques”. We declare that the funding source had no involvement in the design and implementation of this study.

Data Availability Statement

The raw data supporting the conclusions of this article will be made available by the authors on request.

Acknowledgments

The authors would like to acknowledge the Ioannina Ephorate of Antiquities for issuing the permits for the study of the icon “St John the Forerunner with scenes from his life”.

Conflicts of Interest

The authors declare no conflicts of interest. The funders had no role in the design of the study; in the collection, analyses, or interpretation of data; in the writing of the manuscript; or in the decision to publish the results.

Appendix A

The sensitivity S j for a specific characteristic transition j depends on (a) the X-ray tube ionization spectral distribution I t u b e E as a function of the ionization photon energy E , (b) the transition’s XRF cross-section σ j E , (c) the spectrometer’s geometrical parameters G , (d) the detector’s efficiency ε j for the energy of the measured transition j, and it is given by:
S j = E B E max I t u b e E σ j E d E G ε j
where E B is the electron’s binding energy for the transition’s initial state and E m α x is the maximum ionization photon energy.
The sensitivity can be extracted experimentally by measuring the intensity of a characteristic transition from a reference thin target according to the Sherman equation:
S = I C ρ ξ
As no gold reference thin target was available, the sensitivity determination of the Au Lα transition was based on the sensitivity of the Cu Kα transition measured from a CuSx reference target from micromattertm [33]. The copper’s surface density was 40.7 μg/cm2, with an error of 5%.
The XRF cross-section σ j E for these two transitions was evaluated by fundamental parameters [26], and their dependence on the ionization photon energy is shown in Figure A1a. For photon energies higher than 15 keV, the ratio of Au Lα XRF cross-section to the Cu Kα XRF cross-section is nearly energy independent. For the Rh Kα ionization energy of 20.2 keV, the Au Lα fluorescence cross-section is 0.79 times that of the Cu Kα fluorescence cross-section. The detection efficiency, ε, for the Cu Kα (8.04 keV) and Au Lα (9.71 keV) photons is the same. Finally, since the Cu K binding energy is 8.98 keV and the Au L3 is 11.92 keV, care was taken to ensure that the ionization spectrum starts from energies above 12 keV. The Cu Kα sensitivity was determined by measuring the CuSx reference target at a high voltage of 50 kV, with an X-ray tube current of 600 μA, and a beam filter of 200 μm Al and 200 μm Ti (condition “B”). This measuring condition produces an excitation spectrum with photon energies mainly exceeding 15 keV (Figure A1b). The Cu Kα sensitivity under condition “B” was found to be (4.25 ± 0.20) cps/μg/cm2, where the error is due to the uncertainty of the reference sample surface density. Consequently, the sensitivity of the Au Lα transition is evaluated to be equal to (3.4 ± 0.5) cps/μg/cm2. The error is due to the uncertainty on the Cu Kα sensitivity and on the uncertainties of the fundamental parameters involved in extrapolating the sensitivity from the Cu Κα to the Au Lα. The result is confirmed by Monte-Carlo simulations [34].
The sensitivity of the Au Lα transition at the nominal measuring condition (condition “A”: 50 kV, 600 μA, no filter) was evaluated by comparing the intensities of the Lα transition from a thin gold leaf in conditions “A” and “B”:
S A u L a A = S A u L a B I A u L a A I A u L a B
The gold sensitivity S A u L a A under condition “A” was found to be equal to (40 ± 6) cps/μg/cm2.
Figure A1. (a) XRF cross-sections for the Cu Kα and Au Lα according to fundamental parameters given in XRAYLIB [26]. (b) Scattered X-ray tube ionization spectrum from pure acrylic target with no filter (condition “A”, see text) and with 200 μm Al–200 μm Ti filter (condition “B”).
Heritage 08 00432 g0a1

References

  1. Mantler, M.; Schreiner, M. X-ray fluorescence spectrometry in art and archaeology. X-Ray Spectrom. 2000, 29, 3–17. [Google Scholar] [CrossRef]
  2. Alfeld, M.; Pedroso, J.V.; van Eikema Hommes, M.; Van der Snickt, G.; Tauber, G.; Blaas, J.; Haschke, M.; Erler, K.; Dik, J.; Janssens, K. A Mobile Instrument for in Situ Scanning Macro-XRF Investigation of Historical Paintings. J. Anal. At. Spectrom. 2013, 28, 760. [Google Scholar] [CrossRef]
  3. Romano, F.P.; Caliri, C.; Nicotra, P.; Di Martino, S.; Pappalardo, L.; Rizzo, F.; Santos, H.C. Real-Time Elemental Imaging of Large Dimension Paintings with a Novel Mobile Macro X-Ray Fluorescence (MA-XRF) Scanning Technique. J. Anal. At. Spectrom. 2017, 32, 773–781. [Google Scholar] [CrossRef]
  4. Alfeld, M. MA-XRF for Historical Paintings: State of the Art and Perspective. Microsc. Microanal. 2020, 26, 72–75. [Google Scholar] [CrossRef]
  5. Mazzinghi, A.; Ruberto, C.; Castelli, L.; Czelusniak, C.; Giuntini, L.; Mandò, P.A.; Taccetti, F. Ma-Xrf for the Characterisation of the Painting Materials and Technique of the Entombment of Christ by Rogier van Der Weyden. Appl. Sci. 2021, 11, 6151. [Google Scholar] [CrossRef]
  6. dos Santos, H.C.; Caliri, C.; Pappalardo, L.; Catalano, R.; Orlando, A.; Rizzo, F.; Romano, F.P. Real-Time MA-XRF Imaging Spectroscopy of the Virgin with the Child Painted by Antonello de Saliba in 1497. Microchem. J. 2018, 140, 96–104. [Google Scholar] [CrossRef]
  7. Walczak, M.; Tarsińska-Petruk, D.; Płotek, M.; Goryl, M.; Kruk, M.P.; Tarsińska-Petruk, D.; Płotek, M.; Goryl, M.; Kruk, M.P.; Tarsińska-Petruk, D.; et al. MA-XRF Study of 15th–17th Century Icons from the Collection of the National Museum in Krakow, Poland. X-Ray Spectrom. 2019, 48, 303–310. [Google Scholar] [CrossRef]
  8. Mastrotheodoros, G.P.; Asvestas, A.; Gerodimos, T.; Tzima, A.; Papadopoulou, V.; Anagnostopoulos, D.F. MA-XRF Investigation of a 17th Century Icon by the Renowned Painter Theodoros Poulakis. J. Archaeol. Sci. Rep. 2024, 53, 104313. [Google Scholar] [CrossRef]
  9. Nikolaidou, N.V.; Asvestas, A.; Kaminari, A.A.; Panou, T.; Sampatakos, A.; Anagnostopoulos, D.F.; Alexopoulou, A.G.; Mastrotheodoros, G.P. Seeking the Unseen: A Multimodal Non-Invasive Investigation of a Post-Byzantine Overpainted Icon. Heritage 2025, 8, 377. [Google Scholar] [CrossRef]
  10. Gerodimos, T.; Asvestas, A.; Mastrotheodoros, G.P.; Chantas, G.; Liougos, I.; Likas, A.; Anagnostopoulos, D.F. Scanning X-ray Fluorescence Data Analysis for the Identification of Byzantine Icons’ Materials, Techniques, and State of Preservation: A Case Study. J. Imaging 2022, 8, 147. [Google Scholar] [CrossRef]
  11. Broecke, L. Cennino Cennini’s il Libro Dell’arte: A New English Language Translation and Commentary with Italian Transcription, 1st ed.; Archetype Publisher: London, UK, 2015. [Google Scholar]
  12. Atrei, A.; Scala, A.; Giamello, M.; Uva, M.; Pulselli, R.M.; Marchettini, N. Chemical Composition and Micro Morphology of Golden Laminae in the Wall Painting. “La Maestà” by Simone Martini: A Study by Optical Microscopy, XRD, FESEM-EDS and ToF-SIMS. Appl. Sci. 2019, 9, 3452. [Google Scholar] [CrossRef]
  13. Osticioli, I.; Capozzoli, L.; Salvadori, B.; Banchelli, M.; Lavacchi, A.; Matteini, P.; Siano, S.; Gallo, L. The “oro di metà” Gilding in the Fifteenth-Century: A Multi-Analytical Investigation. Heritage 2019, 2, 1166–1175. [Google Scholar] [CrossRef]
  14. Mastrotheodoros, G.P.; Anagnostopoulos, D.F.; Beltsios, K.G.; Filippaki, E.; Bassiakos, Y. Glittering on the Wall: Gildings on Greek Post-Byzantine Wall Paintings. In Transdisciplinary Multispectral Modeling and Cooperation for the Preservation of Cultural Heritage; Communications in Computer and Information Science, Volume 962; Springer: Cham, Switzerland, 2019; pp. 397–404. [Google Scholar] [CrossRef]
  15. Wu, Q.; Döbeli, M.; Lombardo, T.; Schmidt-Ott, K.; Watts, B.; Nolting, F.; Ganz, D. Does Substrate Colour Affect the Visual Appearance of Gilded Medieval Sculptures? Part II: SEM–EDX Observations on Gold Leaf Samples Taken from Medieval Wooden Sculptures. Herit. Sci. 2020, 8, 119. [Google Scholar] [CrossRef]
  16. Fourdrin, C.; Pagès Camagna, S.; Pacheco, C.; Radepont, M.; Lemasson, Q.; Moignard, B.; Pichon, L.; Bourgeois, B.; Jeammet, V. Characterization of Gold Leaves on Greek Terracotta Figurines: A PIXE-RBS Study. Microchem. J. 2016, 126, 446–453. [Google Scholar] [CrossRef]
  17. Cesareo, R.; Castellano, A.; Buccolieri, G.; Quarta, S.; Marabelli, M. Giotto in the Chapel of the Scrovegni: EDXRF Analysis of the Golden Haloes with Portable Equipment. X-Ray Spectrom. 2004, 33, 289–293. [Google Scholar] [CrossRef]
  18. Karydas, A.G.; Brekoulaki, H.; Bourgeois, B.; Jockey, P. In-situ X-Ray Fluorescence analysis of raw pigments and traces of polychromy on Hellenistic sculpture at the archaeological museum of Delos, ASMOSIA VII. In Proceedings of the 7th International Conference of Association for the Study of Marble and Other Stones in Antiquity, Thassos, Greece, 15–20 September 2003; pp. 811–829. [Google Scholar]
  19. Theophilus. In On Divers Arts; Hawthorne, J.G.; Smith, C.S., Translators; Dover: New York, NY, USA, 1979. [Google Scholar]
  20. Mastrotheodoros, G.P.; Beltsios, K.G.; Bassiakos, Y.; Papadopoulou, V. On the Metal-Leaf Decorations of Post-Byzantine Greek Icons. Archaeometry 2018, 60, 269–289. [Google Scholar] [CrossRef]
  21. Pessanha, S.; Queralt, I.; Carvalho, M.L.; Sampaio, J.M. Determination of gold leaf thickness using X-ray fluorescence spectrometry: Accuracy comparison using analytical methodology and Monte Carlo simulations. Appl. Radiat. Isot. 2019, 152, 6–10. [Google Scholar] [CrossRef]
  22. Cesareo, R.; Lins, S.A.B.; Ridolfi, S.; Brunetti, A. Thin Thickness Gilding Determined by X-Rays Ratios from EDXRF-Spectra. X-Ray Spectrom. 2022, 51, 170–177. [Google Scholar] [CrossRef]
  23. Pessanha, S.; Manso, M.; Antunes, V.; Carvalho, M.L.; Sampaio, J.M. Monte Carlo Simulation of Portable XRF Setup: Non-Invasive Determination of Gold Leaf Thickness in Indo-Portuguese Panel Paintings. Spectrochim. Acta—Part B At. Spectrosc. 2019, 156, 1–6. [Google Scholar] [CrossRef]
  24. Lins, S.A.B.; Gigante, G.E.; Cesareo, R.; Ridolfi, S.; Brunetti, A. Testing the Accuracy of the Calculation of Gold Leaf Thickness by MC Simulations and MA-XRF Scanning. Appl. Sci. 2020, 10, 3582. [Google Scholar] [CrossRef]
  25. Mantler, M. Quantitative Analysis. In Handbook of Practical X-Ray Fluorescence Analysis; Beckhoff, B., Kanngießer, B., Langhoff, N., Wedell, R., Wolff, H., Eds.; Springer: Berlin/Heidelberg, Germany, 2006; pp. 317–321. [Google Scholar]
  26. Schoonjans, T.; Brunetti, A.; Golosio, B.; Del Rio, M.S.; Solé, V.A.; Ferrero, C.; Vincze, L. The xraylib library for X-ray-matter interactions. Recent developments, Spectrochim. Acta—Part B At. Spectrosc. 2011, 66, 776–784. [Google Scholar] [CrossRef]
  27. Dionysios of Fourna. In Ερμηνεία της ζωγραφικής Τέχνης [Hermeneia of the Art of Painting]; Spanos: Athens, Greece, 1997.
  28. Mactaggart, P.; Mactaggart, A. Practical Gilding; Archetype: London, UK, 2002. [Google Scholar]
  29. Solé, V.A.; Papillon, E.; Cotte, M.; Walter, P.; Susini, J. A multiplatform code for the analysis of energy-dispersive X-ray fluorescence spectra, Spectrochim. Acta Part B At. Spectrosc. 2007, 62, 63–68. [Google Scholar] [CrossRef]
  30. Franceschi, E.; Locardi, F. Strontium, a new marker of the origin of gypsum in cultural heritage? J. Cult. Herit. 2014, 15, 522–527. [Google Scholar] [CrossRef]
  31. X-ray Interactions with Matter, Center for X-Ray Optics at Lawrence Berkeley National Laboratory. Available online: https://henke.lbl.gov/optical_constants/ (accessed on 15 July 2025).
  32. Gerodimos, T.; Georvasilis, I.; Asvestas, A.; Mastrotheodoros, G.P.; Likas, A.; Anagnostopoulos, D.F. MA-XRF Datasets Analysis Based on Convolutional Neural Network: A Case Study on Religious Panel Paintings. Chemom. Intell. Lab. Syst. 2024, 250, 105138. [Google Scholar] [CrossRef]
  33. MICROMATTER, Technologies Inc. Available online: https://www.micromatter.com/XRFCalibrationStandards.aspx (accessed on 15 July 2025).
  34. Brunetti, A.; Golosio, B.; Schoonjans, T.; Oliva, P. Use of Monte Carlo simulations for cultural heritage X-ray fluorescence analysis. Spectrochim. Acta Part B At. Spectrosc. 2015, 108, 15–20. [Google Scholar] [CrossRef]
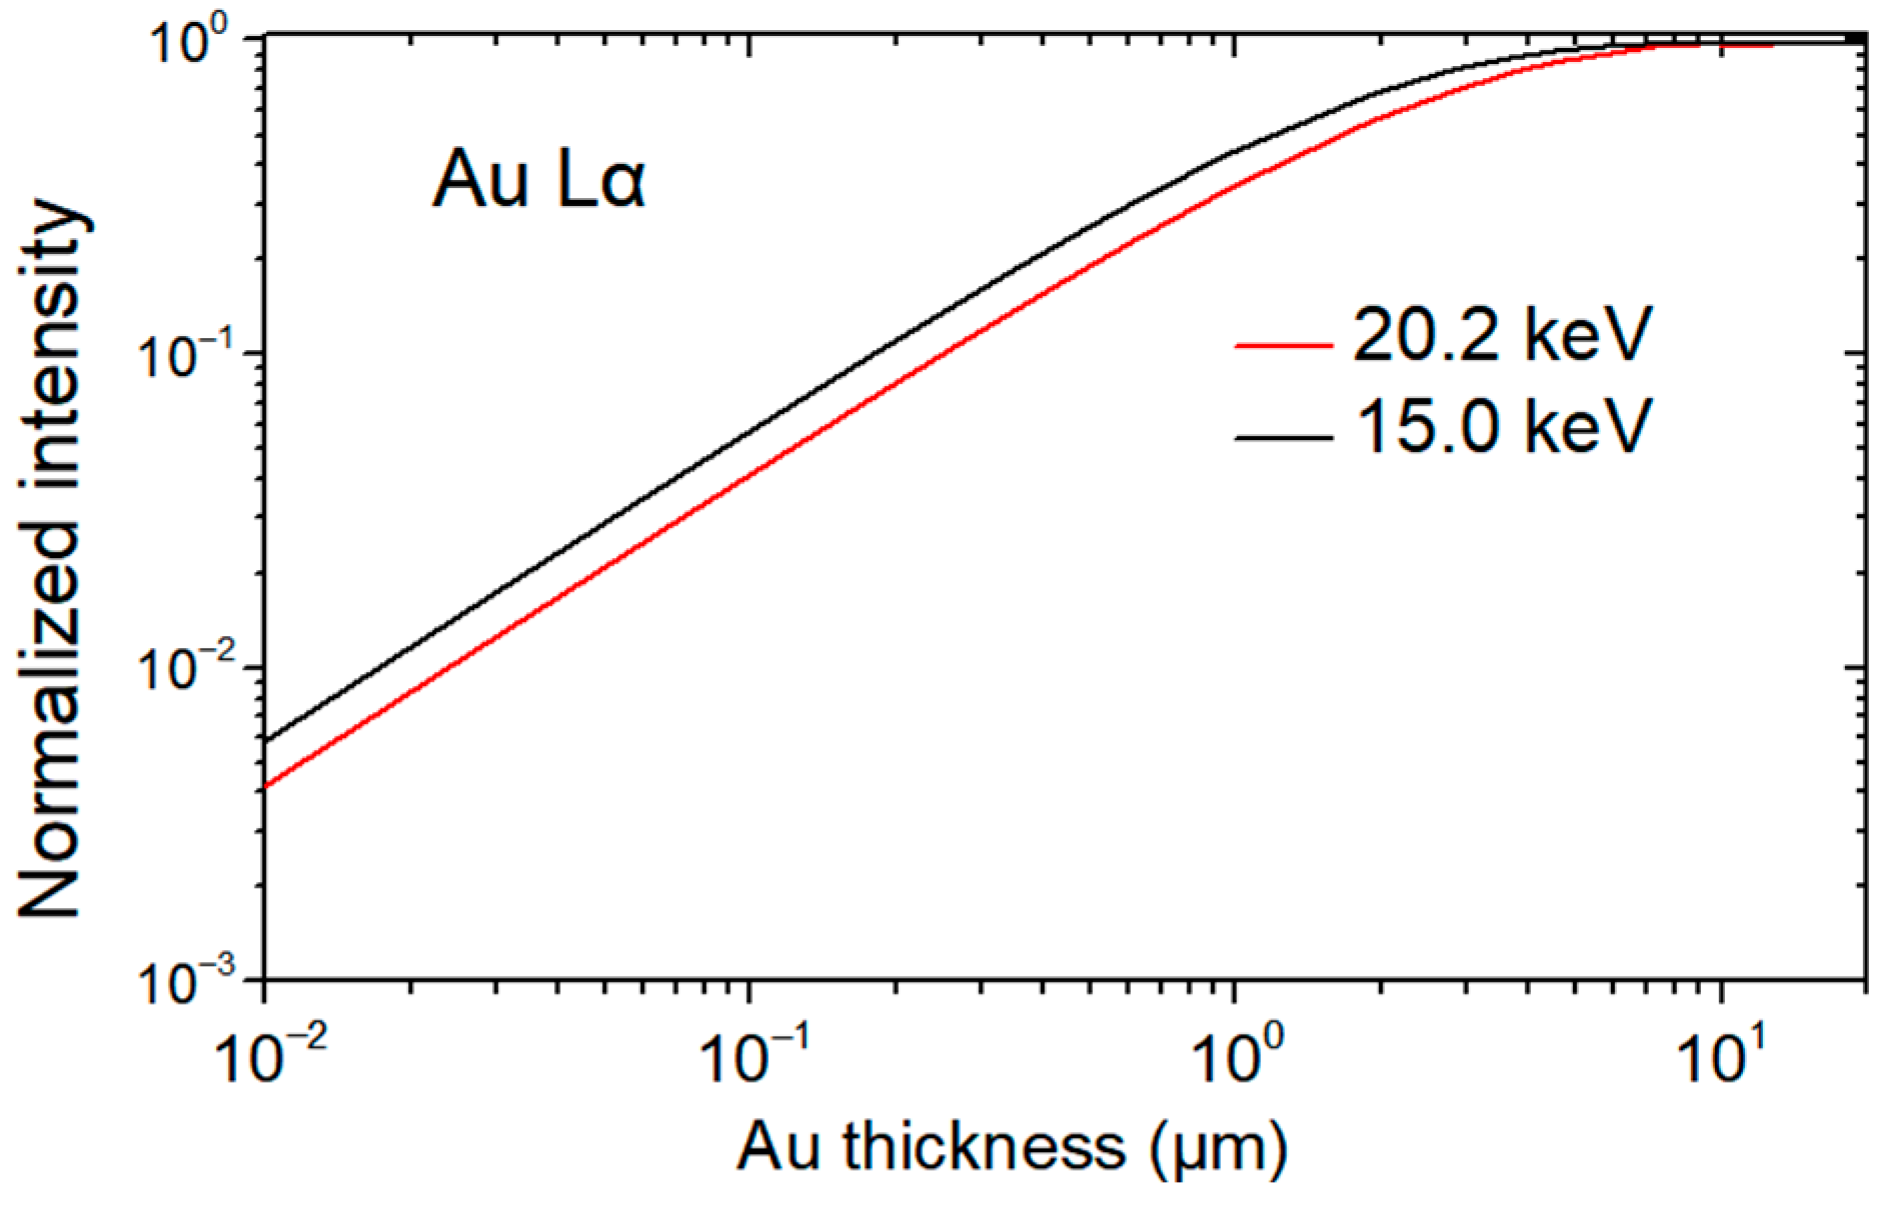
Figure 1. Normalized intensity of the Au Lα transition as a function of gold foil thickness for excitation energies of 15.0 and 20.2 keV [26]. Each curve has been normalized according to its maximum intensity value.
Heritage 08 00432 g001
Figure 2. Normalized intensity of the Au Lα and Μα transitions as a function of gold thickness for incoming photon energies of 15.0 keV [26]. Each curve has been normalized according to its maximum intensity value.
Heritage 08 00432 g002
Figure 3. The gilded mock-up. Left: loose leaf (Kremer #98410), right: transfer leaf (Kremer #98412). In both cases, the dashed lines divide areas covered by single and double gold leaves, respectively. The blue rectangles A, B, C, D, and E indicate areas where the mean layer thickness was determined. The red areas correspond to the uncovered gluing agent (bole/poliment).
Heritage 08 00432 g003
Figure 4. A loose gold leaf was cut and attached to the gilder’s tip before being transferred to the mockup (Rosenoble Double Gold Leaf).
Heritage 08 00432 g004
Figure 5. Sum X-ray fluorescence spectrum originating from the mock-up sample.
Heritage 08 00432 g005
Figure 6. Single-element intensity distribution maps of the S Kα, Ca Kα, Mn Kα, Fe Kα, Cu Kα, Sr Kα, Au Lα and Au Mα from the mock-up target.
Heritage 08 00432 g006
Figure 7. Scatter plots of elemental transitions from the entire mock-up target are used to derive spatial correlations: (a) Au Lα relative to Ca Kα, (b) Au Mα relative to Ca Kα, (c) Au Lα relative to Cu Kα, (d) Fe Kα relative to Mn Kα, (e) Fe Kα relative to Ca Kα, and (f) Sr Kα relative to S Kα. Pixels belonging to the single gold layer are marked in red circles, while pixels belonging to the double gold layer are indicated in black circles.
Heritage 08 00432 g007
Figure 9. X-ray fluorescence spectrum from area “B” in Figure 3 fitted using the PyMCA code [29].
Heritage 08 00432 g009
Figure 10. (Left) Detail of the Virgin Mary Odigitria icon (mid-18th century), (Middle) Au Lα intensity distribution map, (Right) Au Mα intensity distribution map. The areas “A”, “B” and “C” for the thickness determination are marked on the RGB image and the Au intensity maps.
Heritage 08 00432 g010
Figure 11. Mean sum spectra of the dataset in areas “A”, “B”, and “C” of the “Virgin Mary Odigitria” icon in Figure 10.
Heritage 08 00432 g011
Figure 12. (Left) Detail of the icon St John the Forerunner with scenes from his life; (Middle) Au Lα intensity distribution map; (Right) Au Mα intensity map. The areas labeled “A” and “B” used for thickness analysis are indicated on both the optical and elemental distribution images.
Heritage 08 00432 g012
Figure 13. Mean sum spectra of the dataset in the selected areas “A” and “B” of the “St John the Forerunner with scenes from his life” icon in Figure 12.
Heritage 08 00432 g013
Table 1. Selected areas in Figure 3 and their dimensions, number of measured pixels, total live measuring time for each area, measured Lα counts as evaluated using the PyMCA software (version 5.6.7), and extracted surface thickness and thickness according to Equation (4). The error values for the surface density and thickness are provided in Appendix A.
AreaDimensions
(mm2)
Number of PixelsLive Time
(s)
Lα Intensity
(104 c/s)
Surface Density
(μg/cm2)
Thickness
(nm)
A17.0 × 21.5146228.471.83 ± 0.03458 ± 70237 ± 36
B22.5 × 24.0216042.061.01 ± 0.02253 ± 38131 ± 20
C12.5 × 13.567513.171.71 ± 0.05427 ± 64221 ± 33
D18.5 × 28.0202740.350.91 ± 0.02227 ± 34117 ± 18
E10.0 × 24.096018.621.05 ± 0.03263 ± 39136 ± 20
Table 2. Selected areas in Figure 10 and their dimensions, number of measured pixels, total live measuring time for each area, measured Lα intensity as evaluated using the PyMCA software and extracted surface density and thickness according to Equation (4). The error values for the surface density and thickness are provided in Appendix A.
AreaDimensions
(mm2)
Number of PixelsLive Time
(s)
Lα Intensity
(104 c/s)
Surface Density
(μg/cm2)
Thickness
(nm)
A8.7 × 3.02902.270.95 ± 0.01237 ± 36123 ± 18
B4.5 × 4.22101.661.88 ± 0.01470 ± 71244 ± 37
C8.4 × 1.81681.283.85 ± 0.02961 ± 140497 ± 75
Table 3. Selected areas in Figure 12 and their dimensions, number of measured pixels, total live measuring time for each area, measured Lα intensity as evaluated using the PyMCA software and extracted surface density and thickness according to Equation (4). The error values for the surface density and thickness are provided in Appendix A.
AreaDimensions
(mm2)
Number of PixelsLive Time
(s)
Lα Intensity
(104 c/s)
Surface Density
(μg/cm2)
Thickness
(nm)
A15.0 × 5.79503.100.90 ± 0.01226 ± 34118 ± 18
B16.8 × 2.75041.602.30 ± 0.01574 ± 86300 ± 45
Disclaimer/Publisher’s Note: The statements, opinions and data contained in all publications are solely those of the individual author(s) and contributor(s) and not of MDPI and/or the editor(s). MDPI and/or the editor(s) disclaim responsibility for any injury to people or property resulting from any ideas, methods, instructions or products referred to in the content.