Article

A Multidisciplinary Study for the Recognition of Fault-Induced Instability Conditions on Cultural Heritage: The Case of Paternò (Sicily, Italy)

by
Gloria Maria Ristuccia
1,
Pietro Bonfanti
1,
Orazio Caruso
2 and
Salvatore Giammanco
1,*
1
Istituto Nazionale di Geofisica e Vulcanologia, Osservatorio Etneo, Sezione di Catania, Piazza Roma 2, 95125 Catania, Italy
2
Independent Researcher, 95047 Paternò, Italy
*
Author to whom correspondence should be addressed.
Heritage 2024, 7(9), 5007-5031; https://doi.org/10.3390/heritage7090237
Submission received: 19 July 2024 / Revised: 5 September 2024 / Accepted: 6 September 2024 / Published: 11 September 2024

Abstract

:
The 16th century AD St. Barbara’s Church in Paternò, a town located at the SW foot of Mt. Etna volcano (Sicily, Italy), has since 2009 showed evident signs of structural instability and collapse. This is causing great concern among the local population and poses a growing hazard to the attendees to the masses. After precautionary closure of the church, we carried out geological, seismic, geophysical and geochemical surveys in order to shed light on the possible causes of the phenomenon. From the results of all surveys above, the presence of a hidden fault was hypothesized. The fault would prove to cross the west side of the church, parallel to its front portal, and continue both to the north and to the south of the edifice. It is part of a more complex system of faults that crosses the whole town of Paternò and is likely a result of the complex dynamics of Mt. Etna. This fault seems to also be a pathway for the upward flow of saline hydrothermal fluids, similar in composition to those emitted in nearby areas and whose corrosive action possibly contributed to the weakening of the rocks beneath the church. Temporal monitoring of several hydrological parameters (water temperature, water level and CO2 content) in some sites in and around the church allowed a better understanding both of the fault dynamics and of the extent of hydrothermal influence in the studied area.

1. Introduction

The ever-increasing growth of the world population, together with its growing urbanization in recent times, are leading to a higher exposure to natural hazards in general due to demographic pressure on geologically and geographically unstable areas [1]. In active volcanic and/or seismic areas, this is particularly prominent, due to the combined effects of volcanic eruptions, earthquakes and the structural instability of the soil due to tectonic faulting. This has led to a need for accurate and multidisciplinary studies aimed at defining and monitoring all possible hazards posed by natural phenomena, especially in densely urbanized areas of relevant historical and artistic interest that have developed in active volcanic areas.
Mt. Etna is one of the world areas particularly prone to all of the above processes, both because of the complex interplay between volcanic and tectonic forces that affect the whole region and because of the widespread urbanization that has taken place. Most of the urbanization has developed since the 1950s. Mt. Etna is a very active volcano, with a wide range of eruptive styles [2,3]. It is also the site of many different geologic phenomena, some of which are not easy to detect or reveal. Due to the large population living on this volcano today (about one million, according to the latest census [4]), the impact of volcanic activity in a broad sense on the lives of the local people can be strong, and sometimes it produces disastrous effects, especially on human infrastructures [5,6]. Some of these effects are known and monitored by volcanologists, but others are underhand and ambiguous, especially when they develop over time spans of hundreds of years. In particular, slow deformation events and persistent emissions of natural fluids (especially those rich in hypersaline waters and/or corrosive gases) may alter the physical (mechanical) properties of building materials, and hence they may provoke their breaking or even their collapse [7,8]. This is particularly evident in ancient architectural structures, some of which are many centuries old, in the study area.
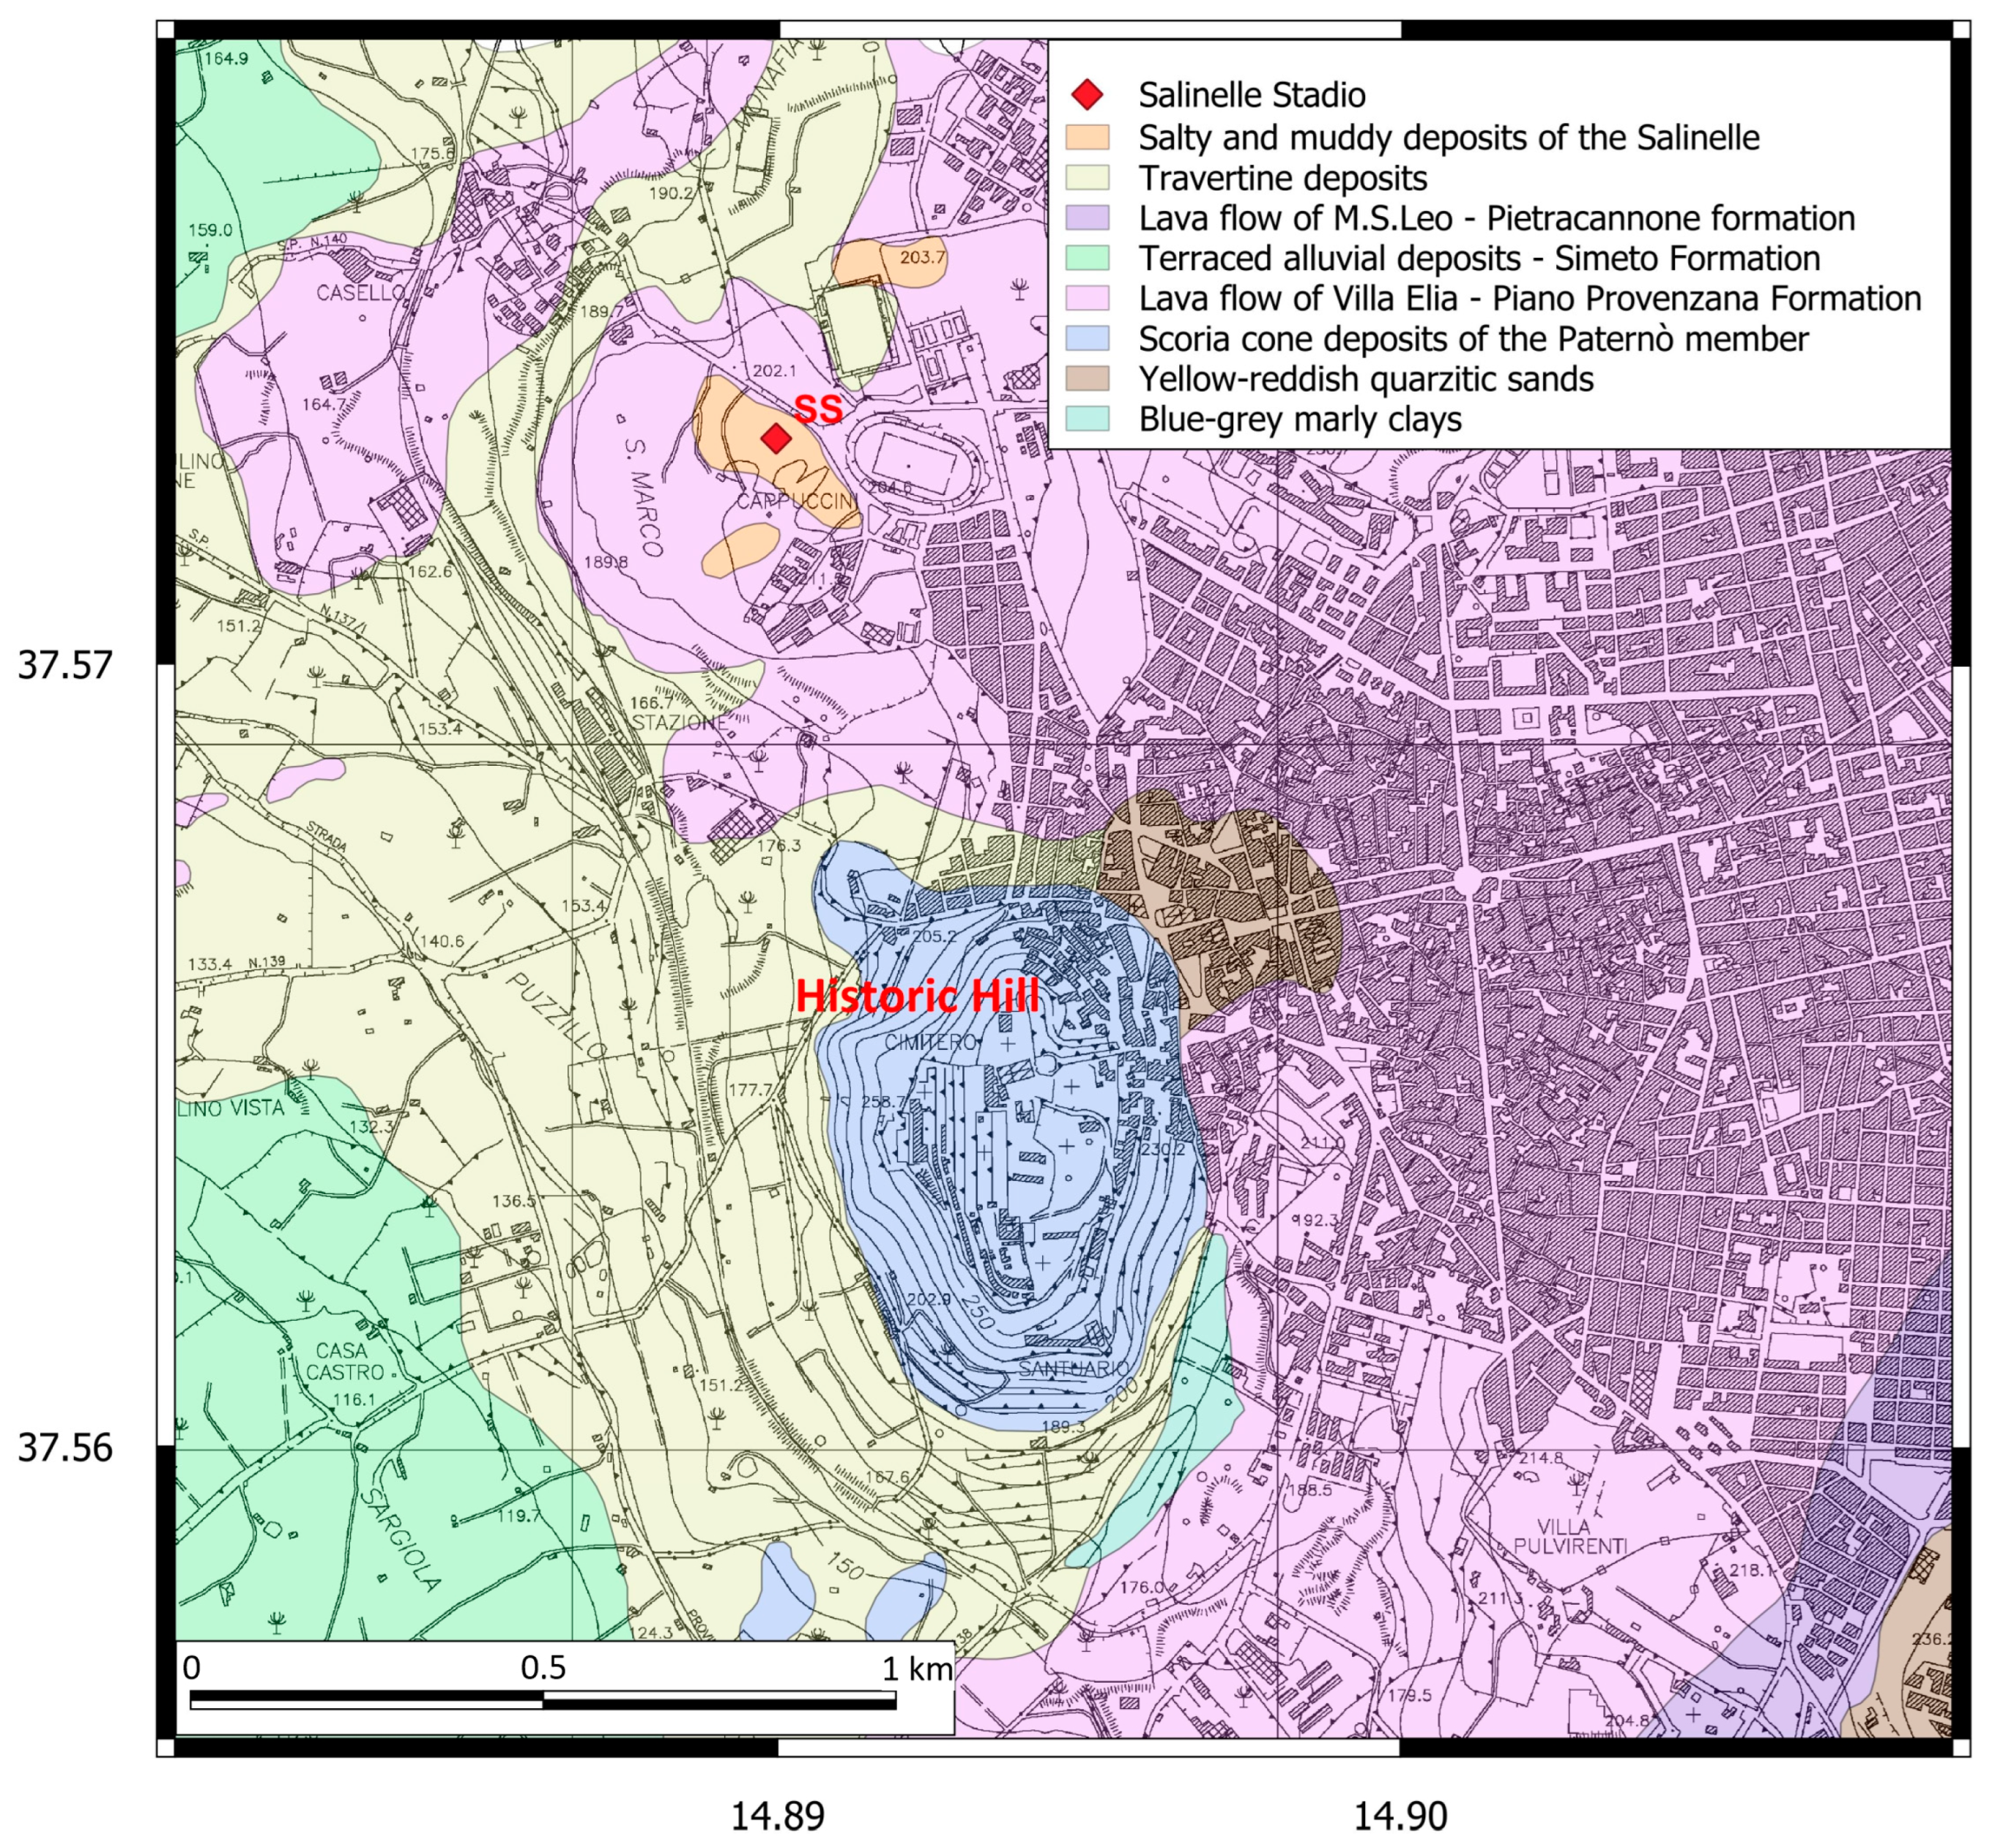
The St. Barbara’s Church, located in downtown Paternò (Figure 1 and Figure 2), offered us an evident and interesting example of long-term effects of volcano-related geodynamic phenomena on ancient buildings. Paternò is a town on the lower southwest slopes of Mt. Etna volcano, about 18 km west of the major city of Catania. From a volcanological point of view, Paternò is famous both for having developed on the slopes of an ancient pre-etnean volcanic complex [2] and also for being the site of mud volcanoes (known as Salinelle) (Figure 2). The gas emissions from the Salinelle are mostly sourced into the deepest magma reservoirs of Mt. Etna, and their eruptive activity was found to be linked with that of the main volcano [9,10,11,12].
The St. Barbara’s Church dates to the 16th century and its facade was made in 1781, as evidenced in a cartouche in the tympanum of the main entrance. The interior space of the structure is designed according to an octagonal plan, with a dome of considerable height, approximately 40 m, covering the central space (Figure 3). This dome is intersected by a Greek cross of greater longitudinal development. Furthermore, the oblique sides of the octagon have four secondary altars. The wall structures consist of lava ashlars bonded with lime and/or pozzolan mortar, basically a mixture of different matrices, i.e., binder, aggregates and water. Since the early 1900s, the building structure has been affected by a sequence of structural failures that were not well identified. In fact, as shown by the historical research drawn up by an named architect Caruso, until 1908, the year of the Messina earthquake [14,15] there were no reports of subsidence or noteworthy damage, not even after the strongest earthquake that has struck Sicily in the last 1000 years (in 1693, magnitude ≈ 7.4), with an epicenter about 65 km south-southeast of Paternò. It was only after this period that problems began to arise, especially on the north facade. In the 1940s, studies relating to the subsidence were conducted by Eng. Nicolosi who, with the modest means available at the time, relied solely on visual evidence and intuitions from his personal experiences in carrying out his investigations. In particular, lesions were deeper on the north facade, similar to those that afflict the monument today.
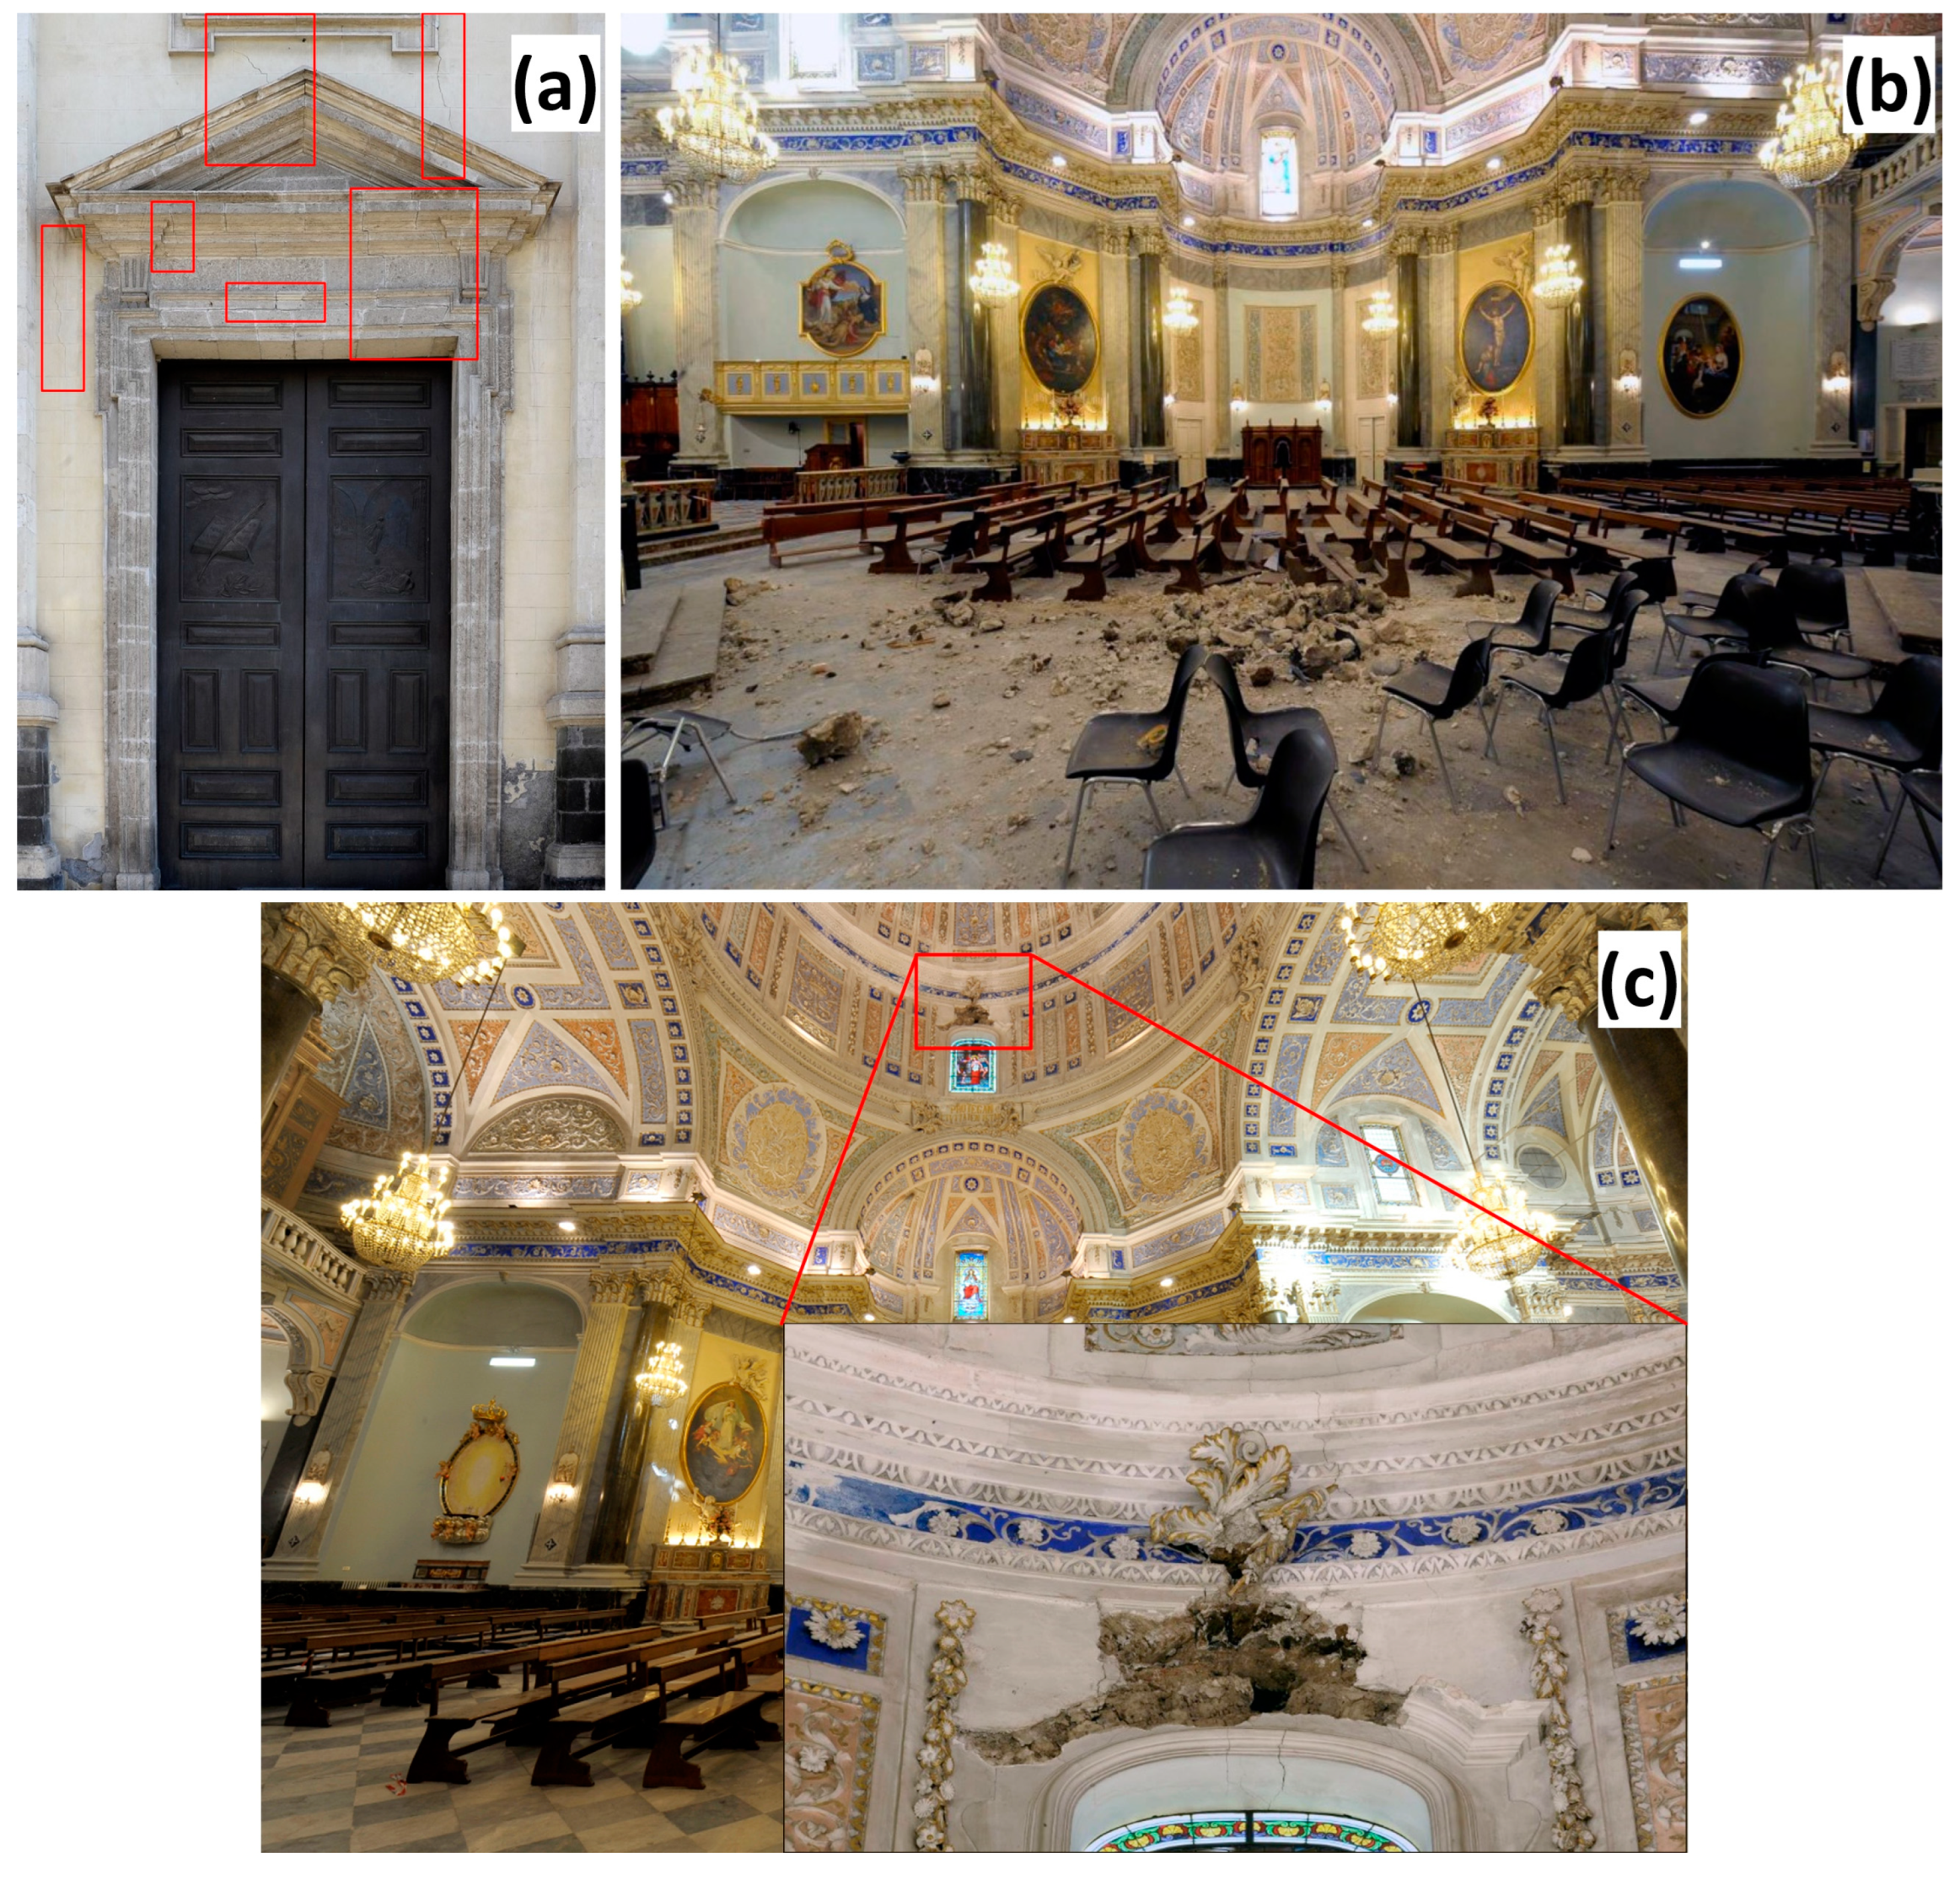
In December 2008, the plaster frieze on the north side collapsed (Figure 4), highlighting a wall crack precisely in correspondence with its attack on the main wall. In particular, it was found that the hook that supported the frieze was sited, by pure chance, exactly on the lesion line, which widened and caused the frieze support clip to come out. A first reading of the phenomenon correlated the lesion with a subsidence of the foundation of the north wall. In 2009, a series of engineering surveys began, in which the inclinations of the walls and the stress state of the masonry involved were continuously monitored. Despite the efforts, however, a single answer was not given to the causes of the collapses that have afflicted the building for years. In January 2012, unexpectedly, new ground movements caused the closure of most of the cracks and lesions in the church, thus suggesting a more complex source of ground deformation than a simple landslide motion.
The project to monitor St. Barbara’s Church, which started in 2009, also provided for the safety of the building in order to consolidate the walls subject to collapse and injuries. As part of this project, geophysical, geological and piezometric monitoring were carried out in order to retrieve information useful for the reconstruction of the stratigraphy and hydrogeological conditions of the area below the church. A geochemical survey was also carried out by measuring the flow of CO2 emitted diffusely from the soils, accompanied by monitoring of the temperature of the groundwater around the church. The decision to survey the CO2 emissions of the soil arose from a suspicion of possible volcanic influences on the observed structural problems of the church. In fact, CO2 is a common and widespread gas in soils, especially in hydrothermal and volcanic areas, as in our case. Furthermore, the release of CO2 at the surface normally occurs through fractures or faults of the Earth’s crust, even if not visible (due to soil alterations produced by erosive/depositional phenomena, human activities or, in the case of active volcanic areas, their covering by recent lavas and tephra), that represent areas of higher gas permeability [16]. Therefore, the detection of anomalous CO2 emissions at the soil surface allows the identification and mapping of hidden tectonic structures [17,18,19,20,21,22,23].
The data obtained from the monitoring project served as a stimulus to carry out a larger and more in-depth scientific investigation, giving us the opportunity to better understand the geological framework of the area below and around the church, which is a unique example of its kind in the Mt. Etna region. In particular, the aims of this investigation were (i) to reveal possible endogenous causes for the structural instability of Santa Barbara’s Church and (ii) to produce a dynamic geological-structural model of the area that may serve as a starting point for plans to secure the building.

2. Geological Settings

2.1. General Outlines

The area under study (Figure 1) is located on the southwestern foothills of Mt. Etna, on the northern edge of the Plain of Catania, just north of the Simeto river valley. Etna, the most active volcano in Europe (elevation about 3350 m a.s.l.), is located on the Ionic edge of eastern Sicily and covers an area of about 1300 km2. It is a polygenic strato-volcano that developed in an active geodynamic context, in which the orogen is located in the collision zone between the African and European plates [24,25,26,27,28,29].
The geology of the study area (Figure 2) is almost entirely made up of sedimentary deposits belonging to the Etna basement. Such deposits dated from the Pliocene to the Quaternary and are interspersed with volcanic lithotypes consisting of volcanoclastites and Plio-Pleistocene lavas. The sedimentary rocks that outcrop in this area are represented by white-yellowish calcarenites dated to the Calabrian period, by yellow-blue clays of the Sicilian period and by recent-to-current alluvial deposits. Throughout the series, there are heteropic passages between sedimentary and volcanic soils [2,13]. In particular, the ancient urban center of Paternò is built on volcanic products of the so-called “Conetto dei Cappuccini” (also called the Historic Hill) (Figure 2). This is an old eruptive cone (height of about 100 m), with outcrops both of tephra and of lava flows, recently attributed to the Paternò Member of the Acireale Synthem, dated to about 134.2 ± 6.6 ka [2,13]. The geologic structure of the Historic Hill constitutes a high permeability crustal zone acting as a preferential pathway for meteoric water infiltration and thence for the circulation of underground fluids at shallow depth [10]. To the north-northeast of Paternò, a tectonic system made of normal faults with a slight right-lateral component (Ragalna Fault System; [30,31]) displaces the Holocene Etna eruptive products.
This area is seismically active [32,33,34,35]. However, it is not generally affected by high-magnitude earthquakes produced within 25 km of its radial distance, the highest magnitude measured in recent years having been 4.8, associated with an earthquake that occurred on 6 October 2018, located 6 km northwest of the church and at a depth of 6 km. This territory is also of considerable interest due to the presence of pseudo-volcanic manifestations such as mud volcanoes, locally known as “Salinelle” [9,10,36,37,38,39,40] and located just about 1 km northwest of the church (Figure 2). Mud volcanoes are generally geological structures characterized by the emission of mud, hypersaline waters (brines) and gas. Their formation is due to the rise of fluids (gases and muddy water) subject to overpressure along discontinuities in the earth’s crust. The name “Salinelle” derives from the high salinity (average salinity of about 70–75 g/L, [9]) and higher-than-ambient temperature (temperature up to about 50 °C) water emitted by the vents [9,10,41,42]. Together with the hot water, they emit many different gases in large amounts. The composition of the emitted gases is mainly CO2 (reaching up to 90% of the total gas) and CH4 (10–50% of the total, depending on the site), with other gases (i.e., O2, N2, H2, H2S) being present only in trace amounts. Oftentimes, water pools form into what might be called mud craters, and heavy hydrocarbons (petroleum, oils) are seen floating on the liquid surface [43,44]. Three well-known mud volcano fields are located around Paternò, the most important and active of which is the one known as Salinelle dello Stadio (Salinelle of the Stadium), because it is located near the Paternò football stadium (Figure 2). In this site, mud volcano activity is considered to be an indicator of the deep magmatic activity of Mt. Etna, and therefore these vents are studied and monitored for volcanological purposes [9,40,45,46,47,48,49,50,51]. The emission of fluids from the Salinelle mud volcanoes is continuous, although with highly variable intensity. As a consequence, the morphology (i.e., dimensions, shape, number) of these volcanoes is also highly variable, due to the frequent opening of new vents replacing older ones and the consequent formation of new cones and new mud flows. The ground around the vents is often covered in clays-mud masses and saline (mostly halide—NaCl) deposits.
Depending on the gas flux from the vents, mud eruptions can become intense, with rare sporadic paroxysmal episodes that emit fountains of mud and water up to a meter high and with fluid temperatures of up to about 45 °C [10,51] (and literature therein cited). The most recent paroxysmal episode occurred between early January and June 2016 at the Salinelle dello Stadio, with a violent mud eruption from new vents that opened beneath a private house. On that occasion, several thick mudflows were emitted, and they invaded some nearby streets, surrounding parked cars with flows up to one meter high. This eruption lasted about six months, and it caused severe trouble to local inhabitants and to local farmers, because several flows spread into nearby cultivated fields. Furthermore, between June 2016 and March 2017, for the first time since routine satellite InSAR monitoring began to be performed over Mt. Etna, a clear ground deformation was detected on the whole southern periphery of the volcano. The observed deformation included the area where the mud volcano fields are located, and activity there peaked in September 2016 [52]. A new, though less intense, eruption at the Salinelle was then observed in late January 2017. The latest activity occurred between November 2020 and April 2021.
At the end of the paroxysmal eruptions of the Salinelle, only funnel-shaped cavities remained, with their edges slightly raised from the ground as the formation of significant conical relief is not possible due to the great fluidity of the muddy mass [53].

2.2. Local Hydrothermal Systems

Beneath the Salinelle, there are geochemical indicators of a vast and relatively shallow hydrothermal system [9,10,53,54,55] that probably extends beyond the limits of the mud volcano area. Estimates based on chemical geothermometry indicate an equilibrium temperature of fluids at depth ranging between 120 and 150 °C [9].
Geochemical studies on soil degassing in hydrothermal and/or volcanic areas generally attribute the origin of CO2 to a mixture of multiple sources. In the case of the Etna area [23,45,47,56,57,58,59,60], these sources are essentially of two types: (i) a biogenic one linked to the respiration of soils, the activity of plant roots, the respiration of small animals or bacterial activity in the soil; (ii) a deeper one, linked to magmatic/hydrothermal degassing. All of the geochemical data concur in indicating that the source of CO2 in the Salinelle area is the degassing of deep (about 7–12 km) magma in the Mt. Etna feeding system [11,12,47], whereas methane comes from shallow hydrocarbon reservoirs [47,60].
Diffuse emissions of CO2 from the soils are widespread in and around Paternò, and their magnitude changes according both to environmental factors and to the volcanic activity of Mt. Etna [45,48,50,60,61].

3. Materials and Methods

In order to reconstruct the lithostratigraphic succession of the urbanized area, geomorphological and structural surveys (at 1:10,000 scale), together with analyses of cores from drillings, were carried out. Furthermore, periodic surveys both of the depth of the groundwater level and water temperatures were carried out in the new boreholes produced from drillings from March 2011 (in this case with only a piezometric survey) to 2014. Piezometers allowed the measurement of both the hydrostatic pressure in soil pores and the groundwater level. Piezometric pipes with a diameter of 50 mm were installed into the boreholes. They consisted of slotted PVC pipes, covered with untreated fabric to avoid occlusion, placed inside a borehole and coated with loose sand. In order to measure the depth of the groundwater level, portable probes were inserted into each piezometer and made to go down until they emitted a sound that indicated that they were in contact with water. The length of the inserted cable as it touched water was then measured to calculate the depth of the water table below the surface [62]. Water temperatures were measured with a piezometric OTR probe combined with a temperature sensor. In May 2012, a new probing borehole, named SV6, was added to the initial ones. In order to intercept the basal rock formation, in 2012 the SV6 coring drilling was deepened from 7.5 m to 15.0 m below the surface.
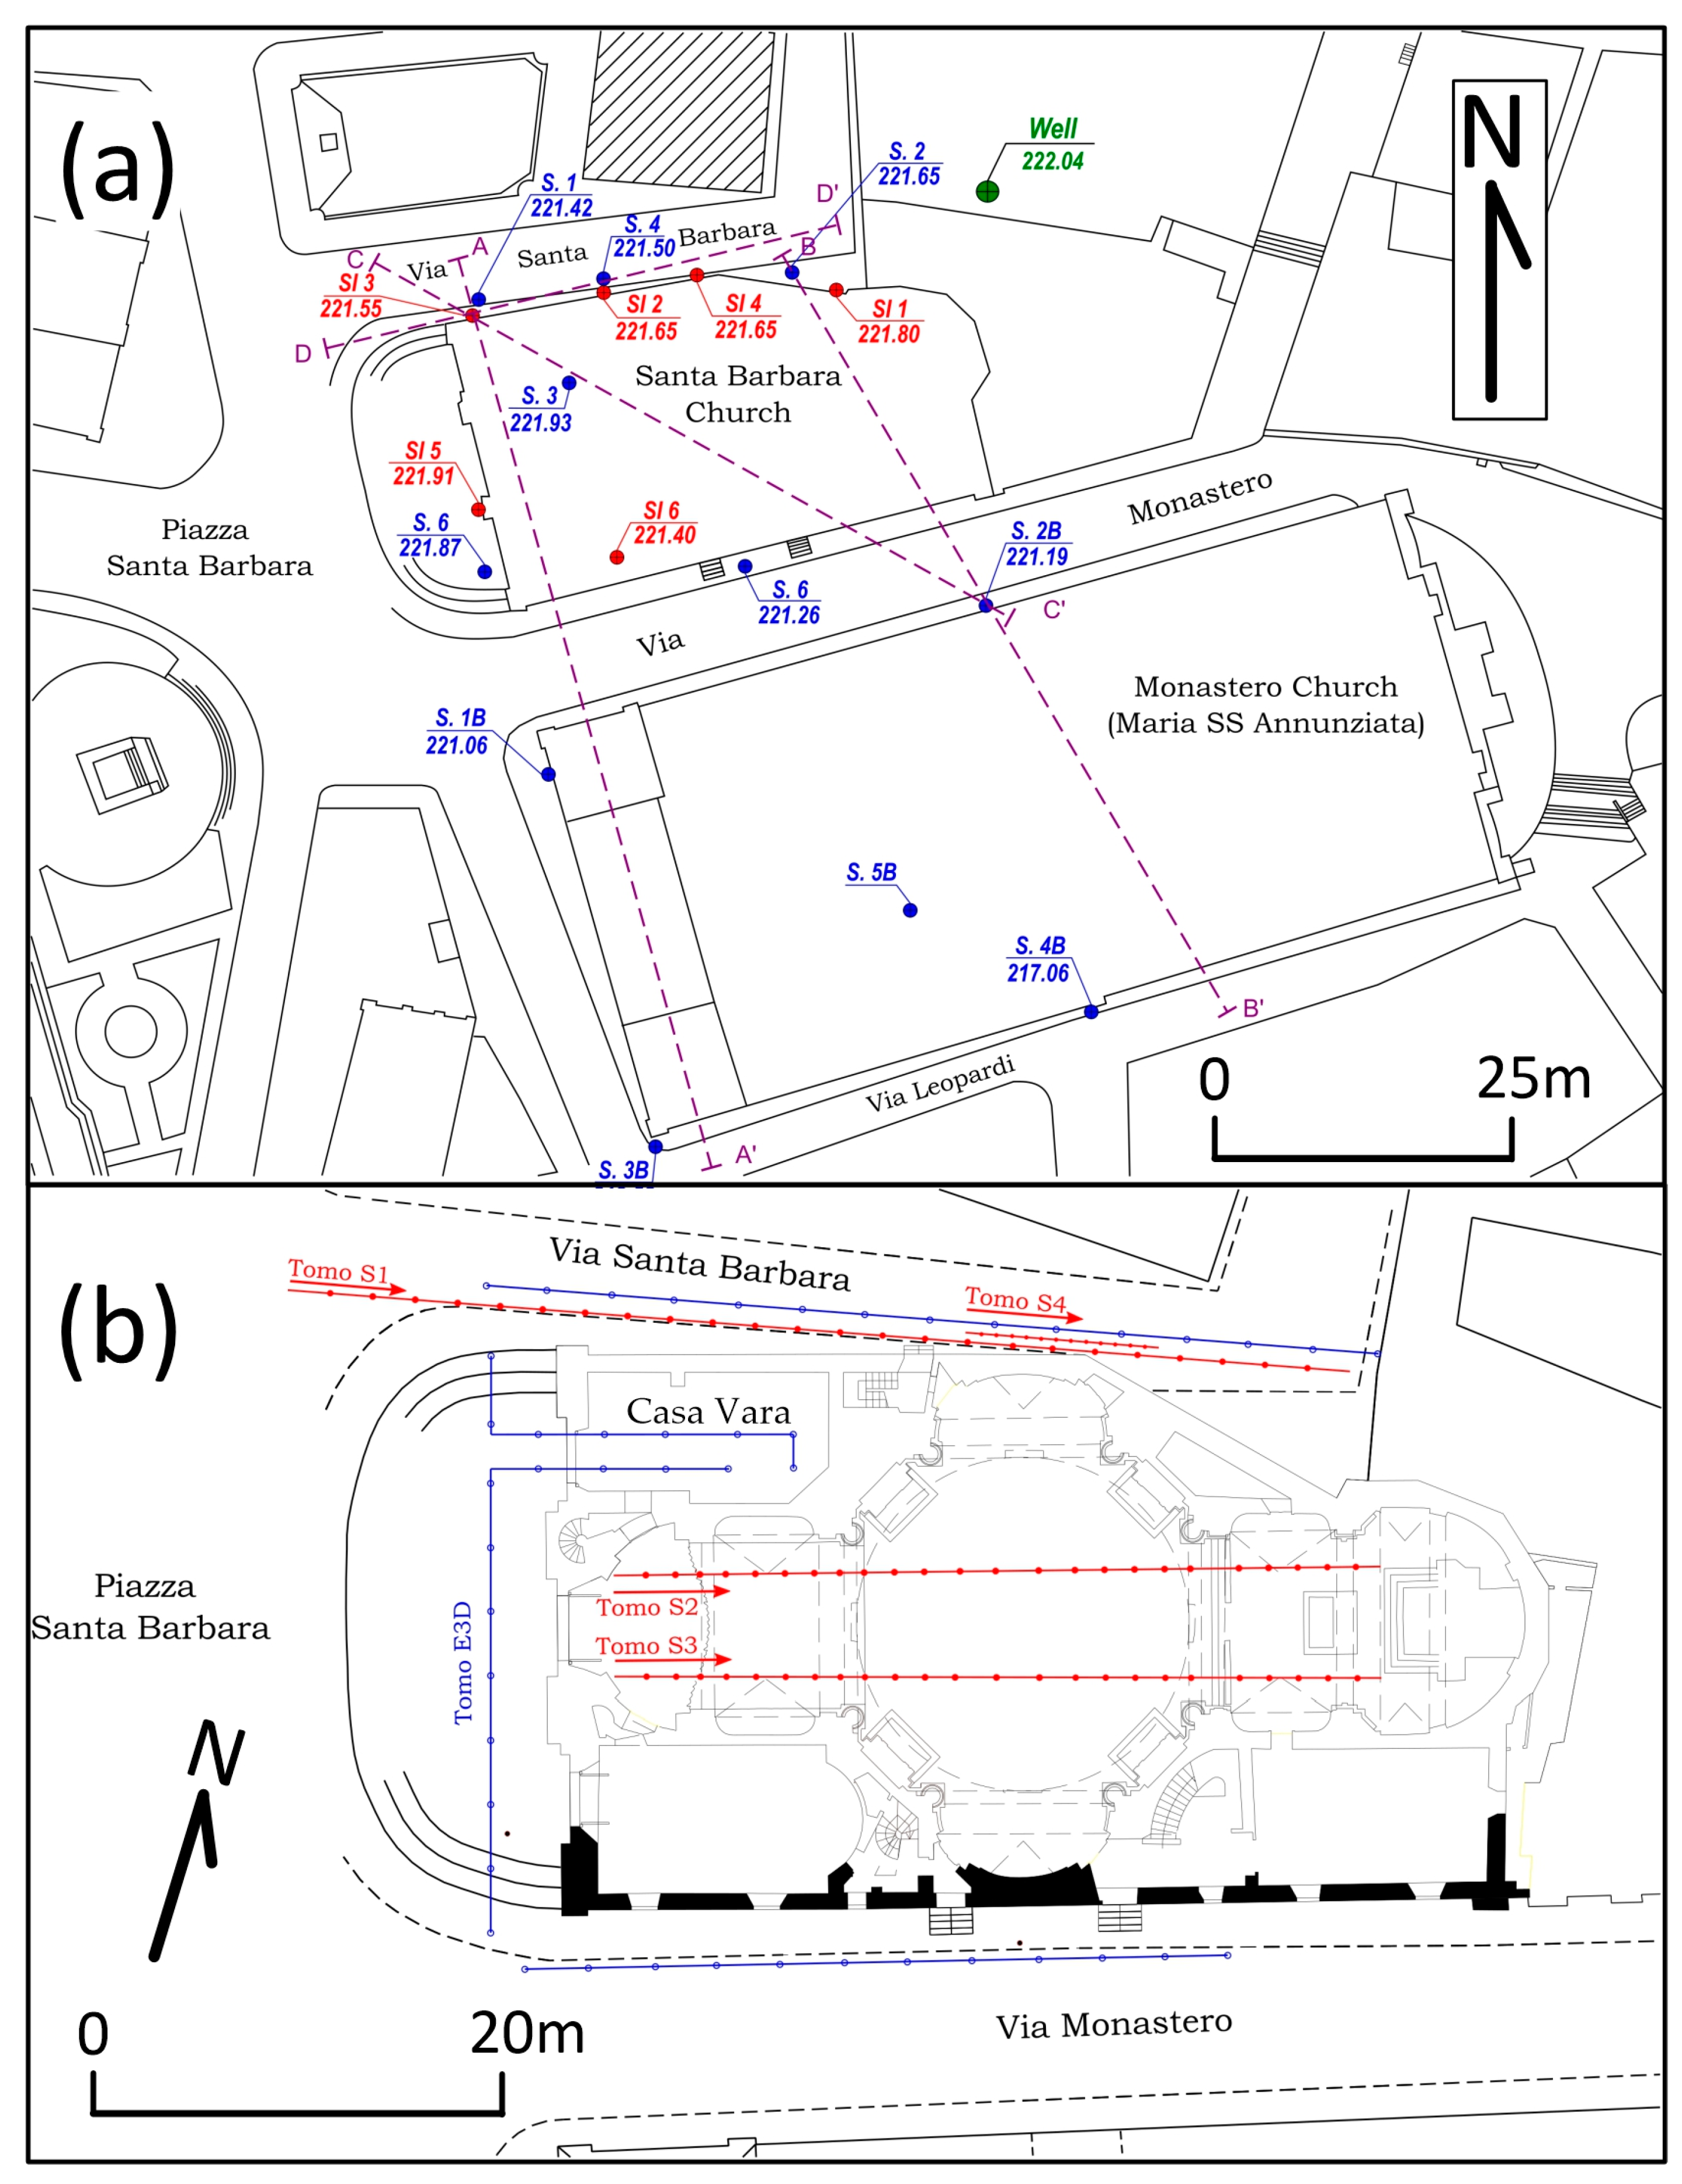
Figure 3a shows the planimetry of the area, with the location of the boreholes and of the respective installed piezometers. Six more drillings (SI1 to SI6) were carried out along the outer walls of the church, with some inclination from vertical in order to get more details of the shallow underground geology below the church (the maximum depth analyzed was 20.0 m).
The stratigraphic sections (Figure 5) retrieved from all of the borehole data were traced on a planimetric relief (at 1:500 scale), together with the location of direct surveys and the location of the Chisari water well (all altitudes are above sea level). In this way, it was possible to define the absolute altitude excursion of the water table surveyed.
From 2009 to 2014, a new set of surveys was carried out in which, in addition to monitoring the groundwater level using piezometers, it was also possible to measure the CO2 concentration inside the boreholes in the headspace above the water’s surface. A silicone tube was lowered into the borehole to as close as possible to the water’s surface, and the gas was pumped into a portable CO2 NDIR (non-dispersive infrared) spectrophotometer (PP Systems, mod. EGM4, Amesbury, MA, USA).
Furthermore, the diffuse soil CO2 emissions in the area around St. Barbara’s Church were measured using the accumulation chamber method [63]. It consists of measuring the rate of increase of the CO2 concentration inside a cylindrical chamber opened at its bottom and placed on the ground surface. The chamber is provided with an internal fan to achieve an efficient gas mixing and is connected to the portable NDIR spectrophotometer. The change in concentration during the initial measurement is proportional to the efflux of CO2 [64,65]. This is an absolute method, and it does not require corrections in relation to the soil’s physical characteristics. This method was tested in the laboratory with a series of replicate measurements of known CO2 effluxes. The average error was about ±5%, which is assumed as a random error in the natural emission rates. The reproducibility in the 200–1600 g m−2 d−1 range was 5%.
In order to discriminate among different possible sources of CO2, we applied a statistical procedure based on the partitioning of the whole set of data into subpopulations, each with a lognormal frequency distribution, through the examination of Normal Probability Plots [66]. In these plots, a linear distribution of data points indicates a unimodal distribution of data; otherwise, the distribution is polymodal and comes from overlapping of different geochemical populations, each with a different source of CO2. Once the threshold values of CO2 efflux between populations were set, we produced a map of the spatial distribution of the CO2 efflux values for each population recognized in the studied area.
Chemical analyses of water samples were carried out at the SCAIB laboratory of Paternò (Sicily), in order to ascertain that the monitored waters in the SV1, SV2 and SV3 boreholes were not polluted by sewage waters from nearby houses. Before sampling (February 2012), the SV1 piezometer was purged for over an hour, equipping the borehole with a submersible pump placed at 15 m depth, and after pumping out about 110 L of water. Sampling of the water in the piezometers was carried out with a tube sampler equipped with a non-return valve submerged, for each piezometer, at least two meters below the water table’s surface.
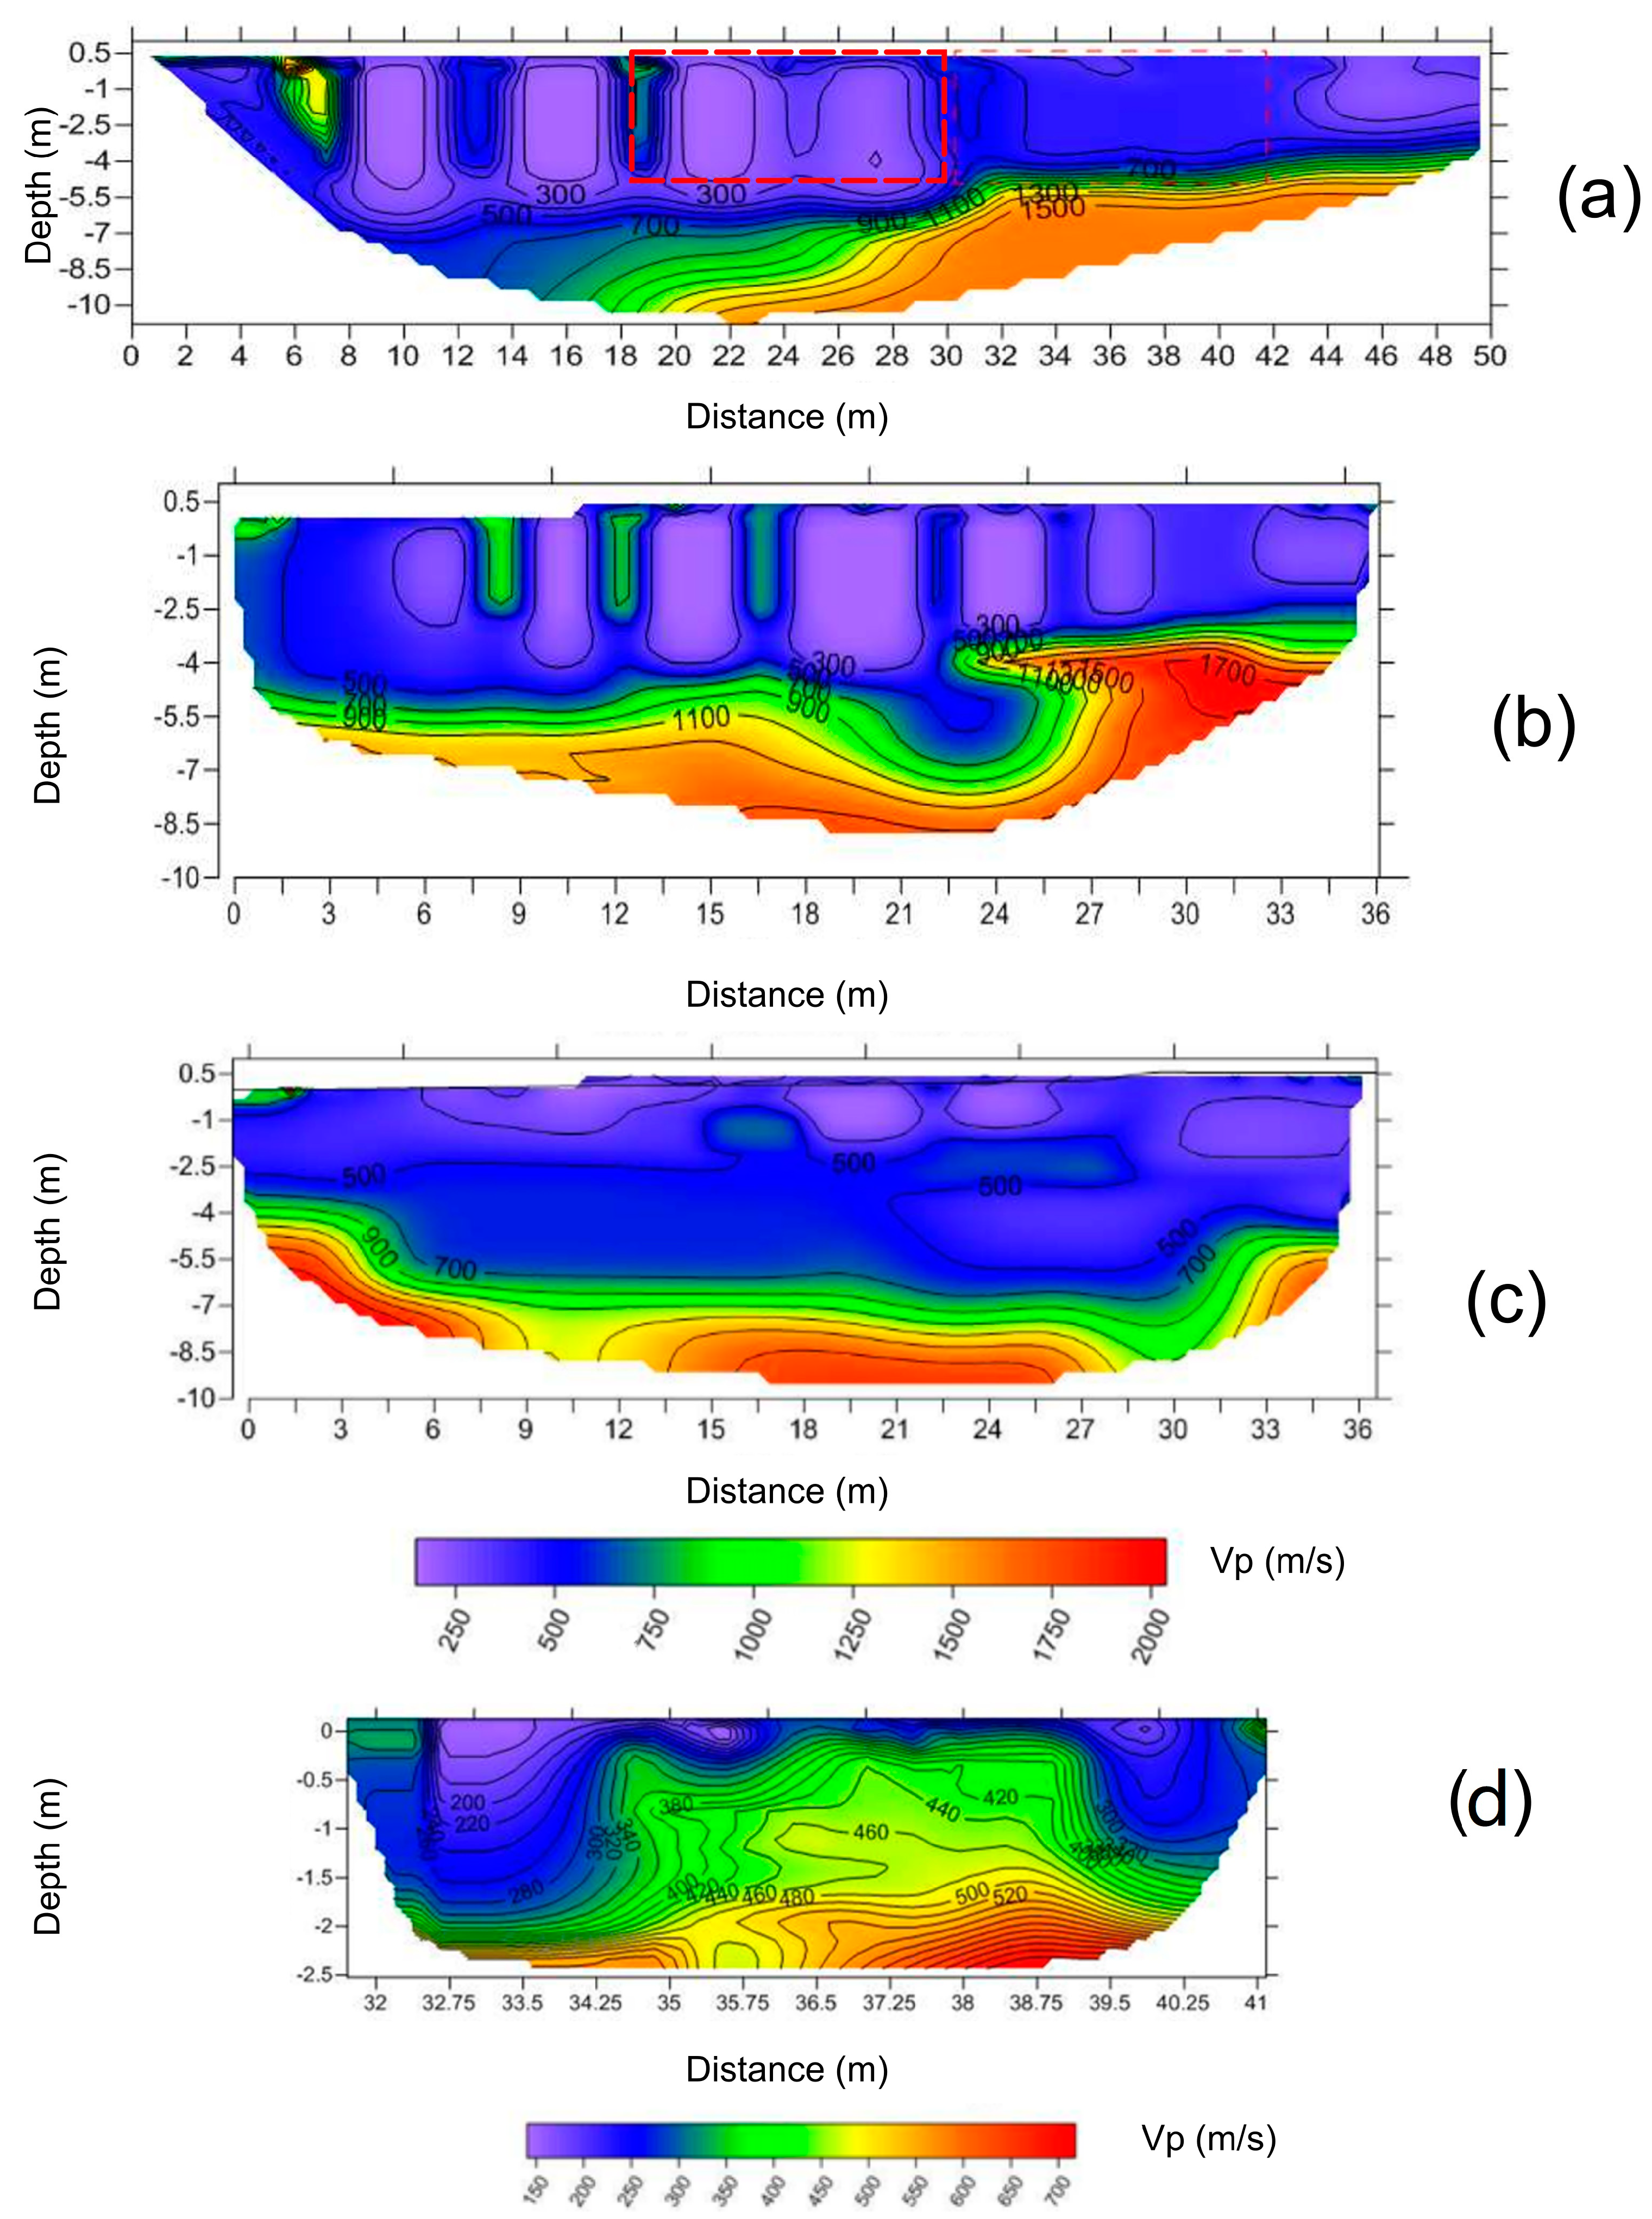
In order to acquire the local seismic stratigraphy and reconstruct the 3D geoelectric image of the rocks underneath St. Barbara’s Church, both a seismic tomography and a geoelectric one were carried out. Surface axial seismic tomography is a technique that allows the reconstruction of the internal structure of the ground as 3D images using the travel time of the seismic waves that propagate from the surface [67]. The results consist in the reconstitution of the seismic image of the subsoil expressed in terms of the propagation speed of the seismic waves P and the density of seismic rays. Four seismic tomographies were carried out in the study area, the geometric configuration of which is shown in Figure 3b. Seismic tomographies were performed both along Santa Barbara Street (TOMO S1 and TOMO S4) and inside the church (TOMO S2 and TOMO S3). For the purposes of this study, particular attention was paid to the TOMO S1 and TOMO S4 tomographies. The latter partially overlaps with TOMO S1 (Figure 3b), but it had a higher density of geophones (twelve geophones were used, with an inter-geophone distance of 0.7 m and resolution of 0.35 m), in order to further detail the shallowest portion of the subsoil on the north side of the church.
The 3D geo-electrical tomography has the purpose of reconstructing an electro-resistive three-dimensional image of the ground [68]. This is done through arrangement of a large number of electrodes on the ground surface, placed according to a pre-established geometry. Continuous electric current is passed through the electrodes into the ground and the difference in electrical potential of the current is measured on the way up to the surface. By means of this process, it is possible to identify any electrical anomaly in the ground that is attributable to cavities, aquifers, wastewaters, etc. For this test, 48 electrodes were used (47 pickets + 1 electrode in a “remote” position—geometrically arranged as shown in Figure 3b). The geometric configuration of the electrodes was designed as a function of the available accessible sites, in order to obtain measurements of electrical potential according to a pole-dipole configuration. In this specific case, it was decided to increase the density of measurements both along the church’s perimeter and inside the “Casa Vara” (Figure 3b). The results consist of the definition of the three-dimensional electro-resistive image of the volume of soil surrounding and underlying the church.
In this study, the mechanical properties of the church’s masonry materials were not investigated on-site, but they were tested in the laboratory.

4. Results

4.1. Geological Survey

The geological surveys in the study area led to the recognition and mapping of lenticular outcrops of travertine, located both west and northwest of Paternò (Monafia locality, Figure 2) and west of the Historic Hill [2,13] in the Puzzillo locality (Figure 2).
Figure 5 shows four lithostratigraphic sequences under St. Barbara’s Church. In particular, the 2012 vertical probing SV6 (see Figure 5a) intercepted yellowish clayey silt and sand down to a depth of 13.2 m. It then found basal gray clays, already intercepted at a depth of 15.4 m in probing at point SV1, which was carried out during the 2009 survey. Probing SI5 showed a 3 m thick basement of the church made of polygenic and heterometric clasts (mainly lavas with a thickness of 2.5 m) cemented by mortar and lying on a sub-foundation constituted by decimeter-sized volcanic clasts into a sandy matrix (with a thickness of 0.5 m). The foundation of the church sits on sandy gravels, with some local inclusions of travertine. Probing SI6 showed that the church’s foundation is made of about 1.4 m thick heterogenic and polygenic pebbly ground, poorly thickened and including bricks and decimetric lava clasts. This foundation, too, sits on sandy gravels, sometimes with local inclusions of travertine. The presence of carbonate deposits in the sediments immediately above the sandy gravels suggests an ascent of CO2 gas. This is also evidenced in boreholes SV1, SV2, SV4 and SV6, where we found travertine-rich deposits with thicknesses of 2.0 m, 4.0 m, 0.2 m and 3.3 m, respectively. Traces of this deposit were also found in the inclined boreholes SI5 and SI6. In the planimetry of the area (Figure 3a), probing SV2 is assumed as a reference point (zero relative elevation).
In all stratigraphic sections (Figure 5), the travertine deposit is highlighted. Section A–A’ (Figure 5a) is parallel to the church’s main prospectus. Sections B–B’ (Figure 5b) and C–C’ (Figure 5c) are coherent in showing a possible structural discontinuity (i.e., a fault), whose plane dips toward the south. These sections were drawn using data coming both from direct geological surveys—carried out by the local municipal administration during works done in 2001 to consolidate the nearby convent of the Benedictines—and from the results of a soil CO2 survey carried out in 2006 inside the town of Paternò [69] and then integrated with the CO2 degassing data from the present study. Structural discontinuities were also suggested in the other three geological sections (Figure 5b–d). However, the tectonic structures hypothesized in sections A–A’, B-B’ and C–C’ can be assumed to be the same fault. That indicated in section D–D’ is seemingly a different one, in terms of location, direction and dip (Figure 5d). In this section, in fact, the position of the travertine layer at the depth where it was intercepted in boreholes SV1, SV4 and SV2, together with the results of the new in-well CO2 measurements, indicate a fault with a modest dislocation and plane dipping toward the east.

4.2. CO2 Survey

4.2.1. Soil CO2 Effluxes

During the 2009 geochemical survey, 82 measurements of CO2 effluxes from the soil surface were carried out within the town of Paternò, over a surface of about 0.3 km2 (Figure 6). The obtained values (Table 1) ranged from 1.7 g m−2 d−1 to 2386.0 g m−2 d−1, with average value of 126.9 g m−2 d−1 and a standard deviation of 378.6 g m−2 d−1. The Normal Probability Plot of Figure 6a allowed us to recognize several distinct populations of CO2 data, each one characterized by a specific linear distribution of points in the plot. The plot shows five flexure points, and hence as many threshold values, respectively corresponding (after conversion from the log10 scale) to 14.1 g m−2 d−1 (20th percentile), 29.5 g m−2 d−1 (46th percentile), 114.0 g m−2 d−1 (84th percentile) and 268.8 g m−2 d−1 (96th percentile). The six populations thus recognized suggest that values below 29.5 g m−2 d−1 (representing 46 % of total data) can be reasonably attributed to background degassing from a biogenic source of CO2. Conversely, the peak population, representing 4% of the total data, is characterized by efflux values above 268.8 g m−2 d−1, and it can be reasonably attributed to a volcanic/hydrothermal source of CO2. The two intermediate populations likely represent efflux values produced from a mixing, in variable proportions, of the two end-members. In this sense, the volcanic/hydrothermal source would become progressively predominant as the efflux values increase (i.e., from population C to F). Once the populations of CO2 efflux data were defined, we produced a map of the spatial distribution of efflux values, divided by population, in order to highlight anomalous degassing areas. The map was obtained by interpolation of the single values measured according to the Kriging method, and it shows several anomalous areas, apparently distributed according to well-defined directions (indicated on the map with I, II and III). Alignment I has an approximately north–south direction, and it is visible in the southwestern sector of the study area, downstream of Paternò. Alignment II has an approximate northwest–southeast direction and it can be observed in the northeastern sector of the area. Lastly, alignment III shows a roughly east-northeast–west-southwest direction and it is mostly visible in the northern sector of the study area, inclusive of Paternò. This latter alignment seems to be present also in the southern sector of the area, although in a less obvious way.
Soil CO2 efflux measurements were repeated on 18 June 2012 at twenty sites measured in 2009, located in the area around the church and along the main street located just west of the church. The 2012 soil CO2 efflux values were significantly lower, ranging from 3.6 g m−2 d−1 to 88.8 g m−2 d−1, with average value of 32.9 g m−2 d−1 and a standard deviation of 25.2 g m−2 d−1. However, they confirmed the results obtained in 2009 in terms of the surface distribution of high efflux values.

4.2.2. Borehole CO2 Concentrations

As regards the CO2 measurements carried out inside the boreholes and just above the water’s surface, during March 2012 only the SV1 and SV2 piezometers were surveyed. In SV1, a CO2 concentration of about 1% vol (equal to about 10,000 ppm vol) was found, while in SV2 a concentration of about 0.1% vol (equal to about 1000 ppm vol) was measured. Since May 2012, these measurements were periodically repeated until May 2014, both in the same piezometers and in others located around the church, as well as in the Chisari well (Table 2). The results indicate strong fluctuations of the CO2 concentration in all of the boreholes and two moments of clear and marked increases in the CO2 concentrations, one of which occurred in October–December 2012 and the other in December 2013. In the inclined borehole SI6, however, no anomalous CO2 emissions were found, presumably due to its obstruction.

4.3. Groundwater Survey

4.3.1. Water Chemistry

The chemical composition of the local ground waters was determined using two samples collected at SV1 and SV2 on 28 June 2012 (Table 3). According to the Langelier-Ludwig classification diagram (Figure 7a), the composition of both samples falls outside the typical composition of Etna’s groundwaters. The compositions of the two samples suggest both interaction with CO2 and a slight contribution from geothermal fluids. Both processes are much more evident in the sample of SV1 water.
The HCO3-SO4-Cl ternary diagram (Figure 7b), modified according to [70], highlights what is already indicated by the Langelier-Ludwig diagram. The modified graph helps to discriminate between mature geothermal fluids and immature unstable waters. In this diagram, the two samples analyzed plot clearly along a mixing line between the typical composition of fresh groundwater and that of steam-heated groundwaters, thus suggesting that samples SV1 and SV2 represent immature geothermal waters. This is further supported by the graph of log(K2/Mg) vs. log(K2/Ca), which is commonly used to evaluate both the temperature of the last water-rock equilibrium and the pCO2 of geothermal fluids (Figure 7c). According to the plotted values, both the SV1 and SV2 samples fall within the conditions of geothermal interest, indicating temperature values in the range between about 100 °C and about 120 °C.

4.3.2. Water Temperature

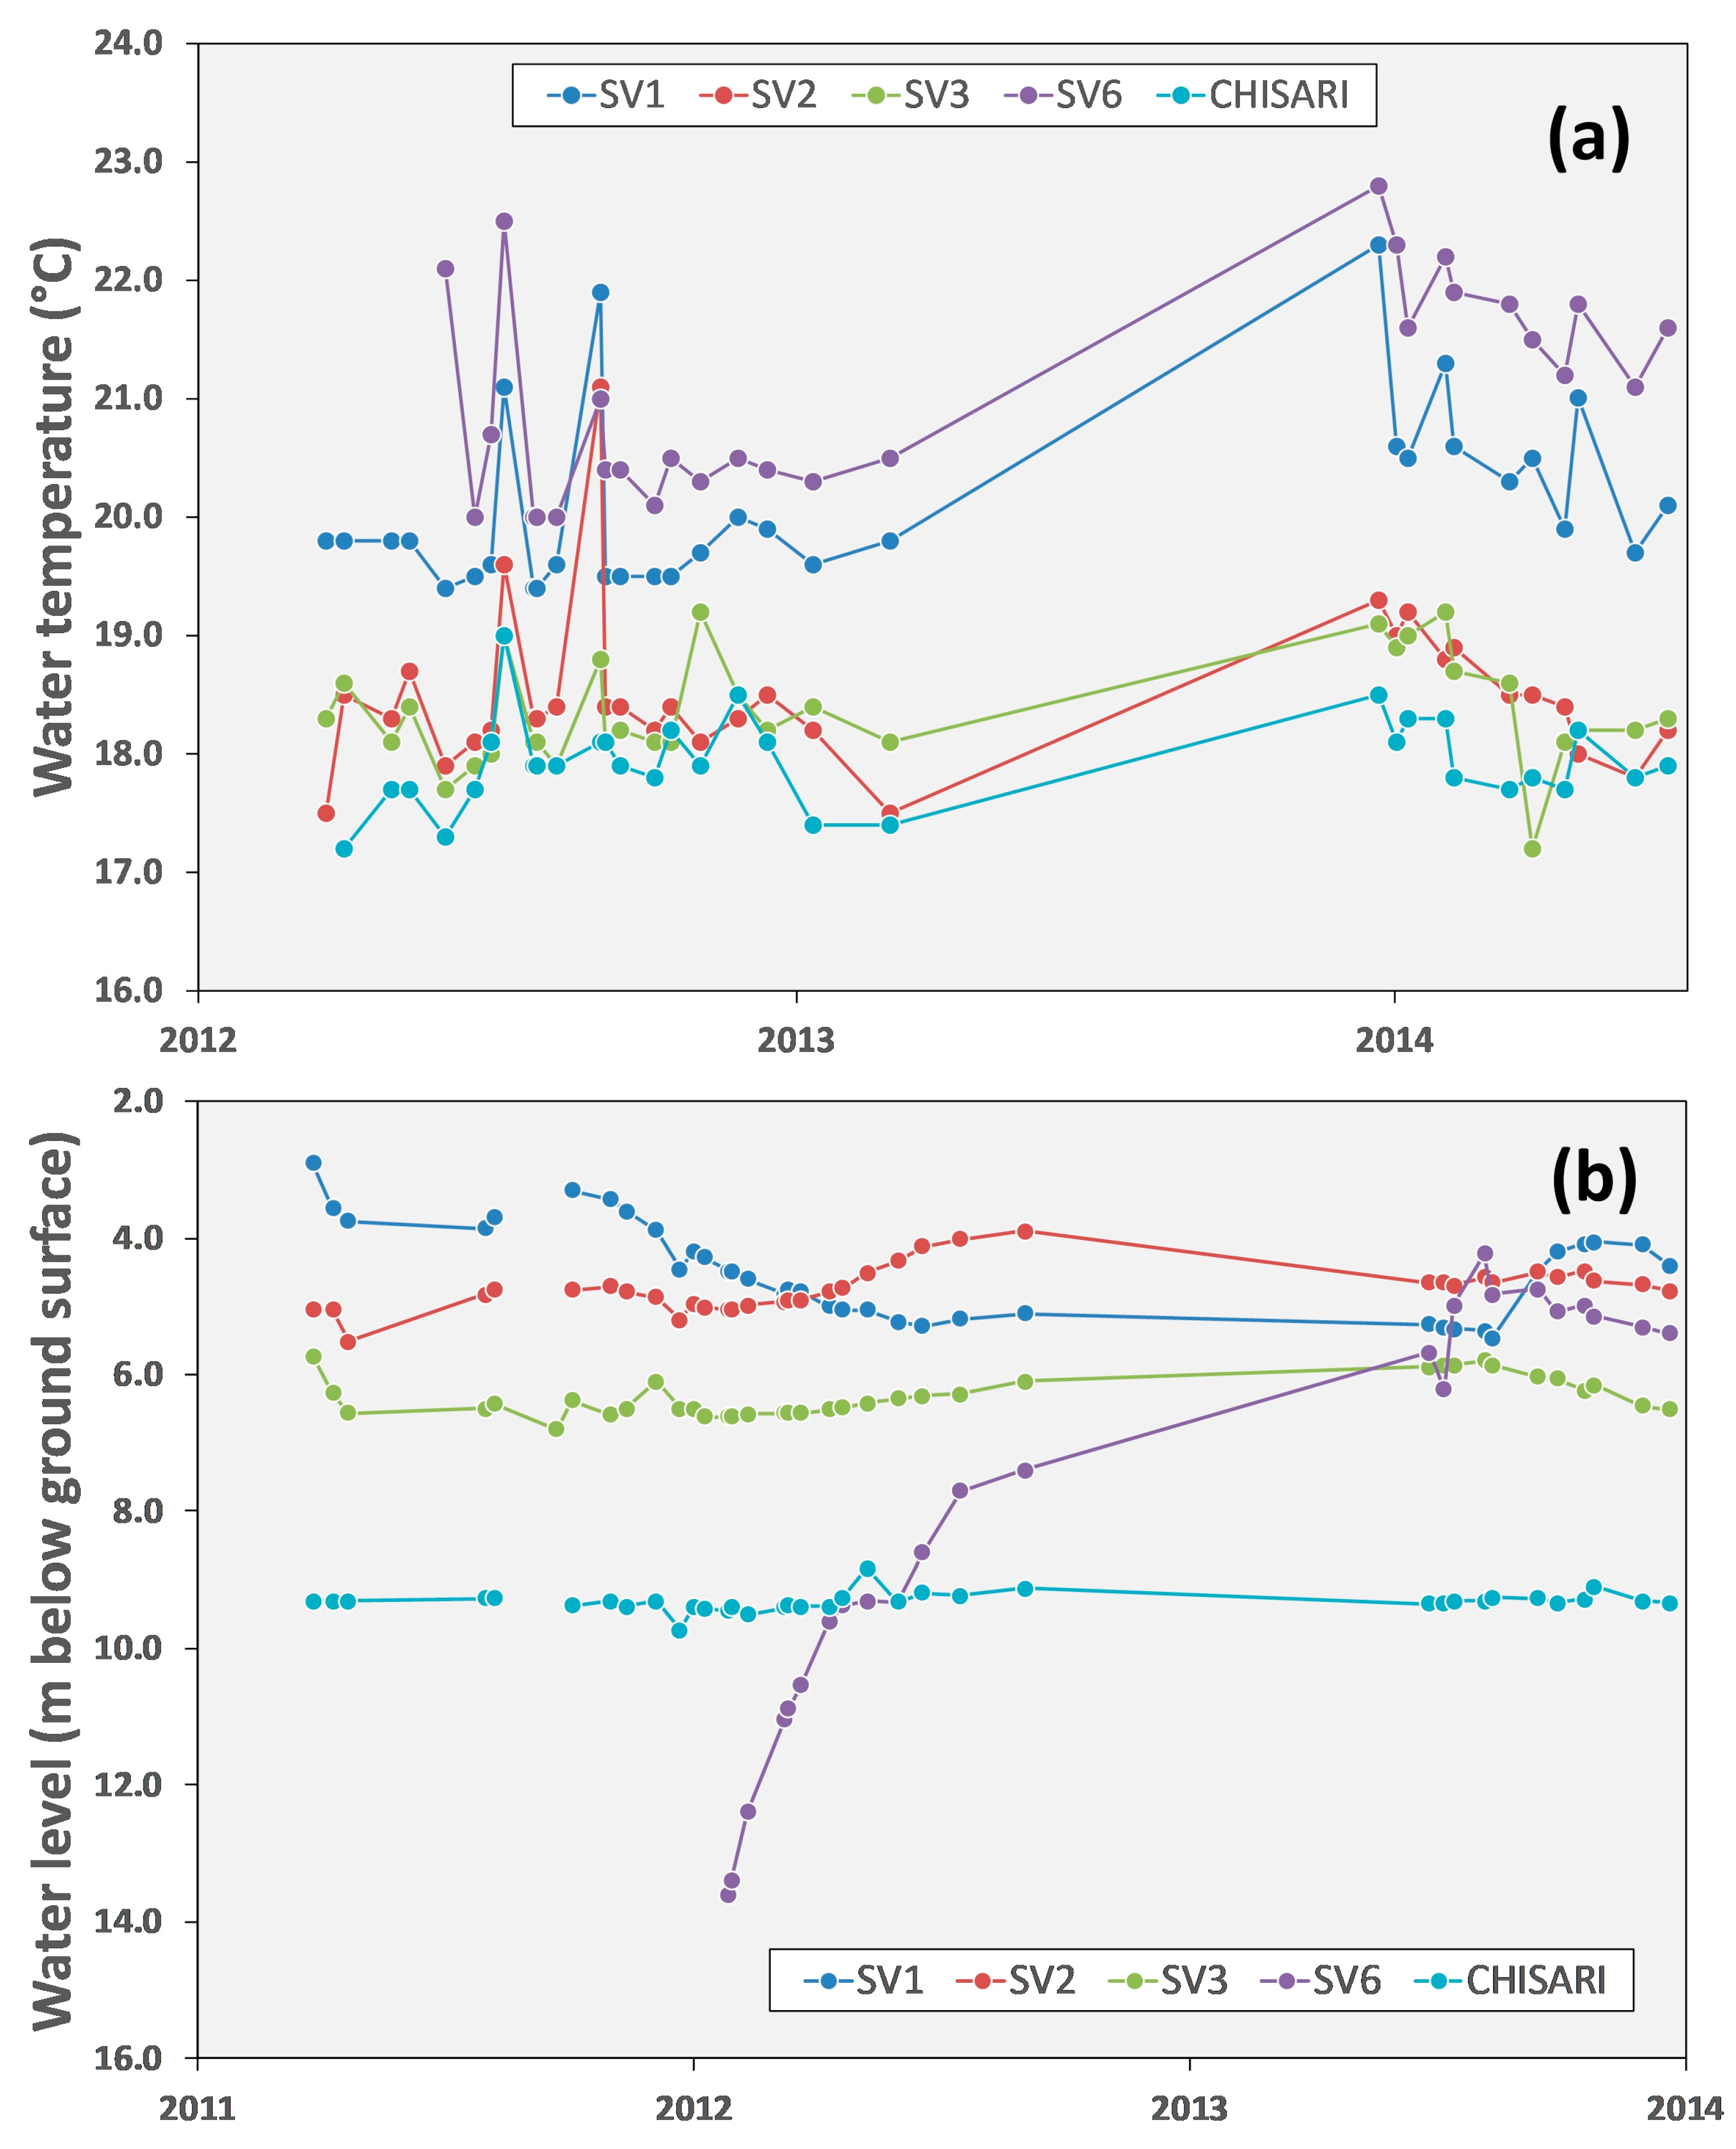
The measured water temperature values in all of the monitored wells during the period from 19 March 2012 to 18 June 2014 ranged from 17.2 °C at the Chisari water well to 23.1 °C at SI5 borehole, with no apparent seasonal cycles (Figure 8a). All values recorded were significantly higher than the typical range in Mt. Etna’s groundwaters [46,71,72], thus suggesting conditions of weak thermalism in the local groundwaters. Similar water temperature values were also found in two boreholes drilled in 2007 inside Carmelo’s Church, located just in front of St. Barbara’s Church. A piezometer was installed in both of these boreholes. In both cases, the water table level was about 6 m below the surface, and the water temperature varied between 18.2 °C and 22.4 °C. Water temperatures in the SV1 and SV6 piezometers were the warmest, always remaining between 20 °C and 21 °C. In general, temporal water temperature changes were similar in all boreholes (Figure 8a), with variable correlations among monitoring sites (Table 4).
The highest correlations were found between SV1 and the other four sites, whereas the lowest ones were generally found between the Chisari well and the other sites. Some sharp increases were observed at all of the sites on 6 July and 3 September 2012, and a longer period with higher-than-normal values was observed between December 2013 and April 2014 (Figure 8a).

4.3.3. Water Table Level

Figure 8b shows data regarding the changes in the water level as periodically measured in the boreholes located around the church during the period of 21 September 2011 to 18 June 2014. The water levels shown in the Figure are expressed as depths (in meters) below the ground surface. Water level data (Figure 8b) showed in general a poor correlation among sites (Table 5), the only significant ones being that between SV3 and SV6 and that between SV2 and the Chisari well.
Unlike the other boreholes, no water was found in SV6 at the beginning of our observations, but since mid-July 2012 the water level at this site has been increasing, going from the initial 13.6 m to about 5.0 m below the ground’s surface (Figure 8b). The most stable values were those of the Chisari well, whereas those of SV1 and VS2 showed the largest variations. The water level was shallower between March and May of 2012 and 2014 at SV1, thus suggesting a possible seasonality, typically due to the input of rainwater into the local groundwater system (the lack of data during most of 2013, however, does not allow a confirmation of this hypothesis). Conversely, shallower water levels were measured between late 2012 and early 2013 at SV2. Water level changes in boreholes SV1, SV2 and SV3 showed some interesting common features, such as a rising in September-October 2011, more evident in boreholes SV1 and SV3, followed by a deepening in mid-October of the same year. A new rise was observed from early February to late May 2012, this time more evidently in SV1 and SV2 (although SV3 showed a sharp rise on 31 May 2012). Until late May 2012, the piezometric level in the Chisari water well remained stable. On 18 June 2012, however, a marked and short-lived deepening of the water level was concurrently observed in the SV1 and SV2 boreholes and in the Chisari water well. The water level returned to its previous depth in about 10 days in the SV2 borehole and in the Chisari well, but it did not entirely recover in the SV1 borehole, thus remaining about 40 cm lower than its normal depth until March 2014. Furthermore, a sudden rise in level was observed on 3 November 2013 only at the Chisari well. Finally, another sudden, though not strong, rise in water level was observed on 2 February 2014 at all sites except the Chisari well, followed by a drop in level on 7 February 2014.

4.4. 2D Seismic Tomography

The TOMO-S1, TOMO-S2 and TOMO-S3 seismic tomographies highlighted several discontinuous zones at a low velocity of propagation of P waves (Figure 9). Based on the seismic-stratigraphic correlation, four different seismo-layers were identified: (i) a seismo-layer with a Vp < 700 m/sec, in part referable to backfill (Vp < 300 m/sec), that is, an unsaturated physical medium with poor water retention and many void spaces inside its structure, and in part referable to slightly-gravelly silty sands (300 < Vp < 700 m/sec), locally cemented with horizons of calcareous gravels and pebbles. The thickness of this sequence ranged between 4 and 7 m; (ii) A seismo-layer with 700 < Vp < 1250 m/sec, immediately beneath the previous one, very thin and referable to the altered portion of the above silty sands. This layer represents a transitional band to the following deeper seismo-layer; (iii) a seismo-layer with 1251 < Vp < 1500 m/sec, referable to slightly plastic silt having veins of gray-blue clays and centimeter thick horizons of fairly consistent yellowish sand; (iv) a seismo-layer with Vp > 1500 m/sec, attributable to the same lithotype as above described, but with a greater consistency that increases with depth. As already mentioned above, the TOMO-S4 seismic tomography was carried out with a partial overlap with TOMO-S1, in order to further detail the shallowest part of the ground, attaining a resolution of 0.35 m. This test tomography was shallower than the other three, as its depth was only about 3 m, and it indicated seismic velocities ranging from 300 m/sec and 2050 m/sec, whose variability, interpreted again as seismo-layers, is chiefly vertical and attributable to the same sequence of layers as deduced from the other tomographic profiles. The morphologic pattern of the refractors appears regular, indicating layers that rest mostly sub-horizontally (Figure 9d). From the seismic ray density sections, it appears that the greatest density, and thus the greatest contrast in seismic impedance, is located between the first (uppermost) seismo-layer and the second/third one. We also noted that the low-velocity zones were not crossed by seismic rays.
Along the TOMO-S1 seismic profile (Figure 9a), the substratum degrades to the west, becoming much deeper near borehole SV1. The TOMO-S4 seismic profile (Figure 9d) shows a physical horizon at about 2.1 m in depth, with an average Vp of about 500 m/sec and lying sub-horizontally. The ground over this horizon is characterized by lateral inhomogeneity, showing a lateral variation of velocity both in the initial and in the final part of the section, where Vp increases markedly, from 220 m/sec to 420 m/sec.

4.5. 3D Electrical Tomography

The retrieval of geoelectric data regarded the overall georesistive block, as well as the low-resistive (BR), resistive (R) and high-resistive (AR) volumes of rock. Resistivity values were distributed over a wide range, from 1.15 ohm m to 106 ohm m. The depth of investigation was 10 m. In order to make the reading of the electro-resistive block unambiguous and simplified, a chromatic scale of resistivity values was displayed (Figure 10), whose values were divided into four significant ranges of values, each one referring to a specific lithotype found in the previous geognostic survey.
From Figure 10 it is clear that the electro-resistive volume shows electro-layers of types AR and R in the most superficial portion (i.e., to a depth of about 4 m). These layers refer, respectively, to the foundational complex and to the weakly gravelly sands underlying the church’s foundations. Going deeper, the low resistivity (BR) electro-layer becomes dominant. This layer was ascribed to the silt-sandy and clayey sediments that constitute the substrate of the investigated area. It was also observed that the area around the SV1 survey and the “Casa Vara” (SV3 survey, Figure 3b) is characterized by the highest electrical conductivity of the investigated volume of ground, likely because of fluids permeating the shallow rocks.

5. Discussion and Conclusions

This multidisciplinary work takes its cue from previous geological and geophysical surveys carried out in 2009 to investigate the causes of unprecedented partial structural failures in the northern perimeter wall of Santa Barbara’s Church in Paternò. The 2009 surveys obtained a first picture of the geological, geotechnical and structural features of the area on which the church stands. These features had been unknown until that moment.
The stratigraphic reconstruction obtained from direct investigations, together with the seismic velocity model of the local shallow ground that was inferred both from seismic tomographies and from the 3D images of ground resistivity from geoelectric profiles, provided evidence of what is interpreted as a structural discontinuity in the rocks on which the church’s foundations were built. In particular, the geoelectric data showed a change in ground resistivity in the shallowest 10 m upon moving from more resistive rocks (gravelly sands with some travertine) to more conductive rocks (silt and clay). Moreover, the high conductivity of the church’s substratum in the area near the sounding SV1 and the “Casa Vara” could be due to a greater water saturation of the surveyed grounds.
From 2009 to 2012, at irregular intervals, measurements both of the soil’s CO2 concentration and of the soil’s CO2 efflux were carried out in the areas surrounding the church. The data obtained indicated strong anomalies in soil CO2 emissions, whose origin is likely a deep magmatic source due to their intensity and their vicinity to the Salinelle mud volcanoes. Actually, at least two sources of CO2 gas are present in the study area: (i) a deep one, either directly from magma degassing or from the outgassing of a hydrothermal system; (ii) a shallow one, essentially due to microbial activity in the most superficial part of the soil [23,47,72]. Compared to the shallower source, the deeper one has the ability to sustain higher gas fluxes [73]. Magma degassing at a high confining pressure produces migration of mostly high-enthalpy fluids (water vapor mixed with mainly CO2) toward the surface along deep-rooted faults, which causes the formation of local hydrothermal reservoirs at relatively shallow depths [10,54,59,74,75].
Figure 11 shows the likely location of tectonic structures around Santa Barbara’s Church as inferred from the soil CO2, geological and geophysical data. In such a situation, hydrothermal fluids may leak through shallower and smaller faults, and they can interact with the shallow aquifer, thus modifying the water’s chemical-physical characteristics. Indications of hydrothermalism in the shallow groundwaters beneath the church come from the water temperature measurements in the drilling wells equipped with piezometers. Actually, the water temperature in piezometer SV1 was constantly in the range 19–20 °C, in piezometer SV6 it was on average higher than 22 °C and in soundings SI5 and SI6 the water temperature was on average 20 °C. In all cases, therefore, there was a strong indication of thermalized waters in the shallow aquifer around the church, with the thermal conditions of the water being markedly constant in time. Furthermore, the presence of travertine deposits embedded among the rock layers under the church and intercepted by soundings SV1 and SV6 provides further evidence of past emissions of hydrothermal fluids at the surface in the study area. Travertine is actually a typical mineral deposit associated with surface springs of thermal and CO2-rich water.
Monitoring of the piezometric level from March 2011 to July 2012 showed that the water table tapped in soundings SV1, SV2 and SV3 had level changes markedly coherent among those wells during the whole period. In particular, the rise in level observed since January 2012 coincided with the closing of the lesions in “Casa Vara”, together with the closure of all the other lesions monitored. Sounding SV1 was dry during the first three months of operation after March 2009, but then water appeared at its bottom and the water level increased progressively, varying between 2.67 and 4.23 m below the surface and hence interfering continuously with the basement of the church, whose depth reaches 5 m below the surface.
The presence of groundwater, with its frequent oscillations, contributes to the plasticization of the substratum on which the church’s foundations sit. The substratum is made of clayey silt, thus making its geotechnical properties ill-suited to supporting a church. The piezometric level in the zone near sounding SV2 and “Casa Vara”, at a depth between 6.20 m and 6.90 m below the surface, does not interact with the foundations of the church that, in this zone, rest on thickened gravelly sands.
The opposite behavior of the water level at piezometer SV3 to that of the other piezometers during May 2012 may be related with its location. This piezometer is actually the only one located inside the church, therefore the deepening of the water level may reflect water flow related with adjustments in the structure of the church edifice, as suggested by the closure of the monitored cracks.
The marked difference in piezometric level (3.3 m on average) between SV1 and SV3 is to be considered anomalous, given the very short distance (12 m) between the two sounding wells. Conversely, no anomalous behavior can be found in the water level differences (average difference of 1.6 m) between SV1, SV2 and the Chisari well, as they are 7 to 30 m apart (Figure 3a). These observations suggest that the groundwater tapped by the Chisari well is part of an aquifer likely large enough not to be subject to level variations due to sudden, but relatively small, inputs of external water. On the contrary, the water table tapped by the other piezometers, mostly those with the largest variations in level, is likely located over portions of the same aquifer where it is subject to fluctuations caused by significant inputs of external waters. The nature of such waters is revealed by the results of chemical analyses performed on water samples from soundings SV1 and SV2. The waters from those soundings actually showed salinity values higher than those typical of Etna’s groundwaters and an overall composition that indicates mixing between shallow ground water and brine-type deep fluids, as is common in the area near Paternò and especially in the nearby mud volcanoes known as the Salinelle [9,76,77]. The water level changes observed, therefore, seem to be due to a marked input of deep saline, likely thermalized, fluids chemically similar to those emitted from the Salinelle mud volcanoes.
The overall picture that derives from the many different parameters surveyed around Santa Barbara’s Church strongly suggests the presence of at least one major tectonic fault that crosses the church parallel to its front portal in an apparently north–south direction according to the well logs and the results of the seismic and geophysical surveys. The presumed fault appears to have a dip toward the northeast. It is not seismically active, or at least it has not been active in the last 1000 years, but it is permeable enough to fluids to allow the upward migration of CO2, water vapor and fluids rich in chemical elements and having a hydrothermal signature. Hydrothermalism in the Paternò area is clearly produced by interactions between high-enthalpy magmatic fluids (partly condensed as brines) and shallow groundwater.
The ascent of deep fluids would explain the temporal anomalies observed in the wells closest to the inferred normal fault, in terms of water level, water temperature, water salinity and the concentration of CO2. It would also explain the high soil CO2 effluxes in the areas around the church, which normally occur in association with the upward migration of geothermal steam, as well as a high level of moisture in the subsurface ground.
In conclusion, our surveys revealed that the most likely cause of the structural instability of St. Barbara’s Church is a ground weakness along a fault that seemingly crosses the foundations of the church. This instability is possibly enhanced by the flow of saline hydrothermal fluids along the fault plane. Our results are being used to guide the work of consolidating the church’s foundations, especially under the facade and the side walls crossed by the inferred north–south fault.
This work highlighted the importance of a multidisciplinary approach to case studies, in line with other recent studies on similar architectural situations in Europe [78,79,80,81], in order to define and better constrain the geological, structural and geochemical features of urbanized areas prone to geological hazards. The adopted approach, though difficult because of the logistical problems created by the presence of a densely populated and built-up area, allowed us to identify (and/or to hypothesize) tectonic structures that in the long term could influence the stability not only of the studied church, but also of other artifacts of cultural/historical importance in the same area. Therefore, in the future we plan to develop a “protocol” of research activities to be carried out in densely populated cities whose geodynamics suggest the presence of active fault zones and/or volcanic features (e.g., potential sites of mud volcano eruptions or thermal fluid releases at the surface). The purpose of such a protocol could be the construction of geohazard maps that would be useful for planning the protection and conservation of historic buildings otherwise inevitably destined be erased from the local historical and cultural memory.

Author Contributions

Conceptualization, G.M.R., P.B. and S.G.; Methodology, O.C., P.B. and S.G.; Validation, G.M.R., P.B. and S.G.; Investigation, O.C. and S.G.; Resources, O.C. and S.G.; Data Curation, G.M.R., P.B., O.C. and S.G.; Writing–Original Draft Preparation, G.M.R. and S.G.; Writing–Review & Editing, G.M.R., P.B. and S.G.; Supervision, G.M.R. and S.G.; Funding Acquisition, O.C. and S.G. All authors have read and agreed to the published version of the manuscript.

Funding

This work was supported by the CNR/DTA-INGV Agreement “Caratterizzazione di risorse geotermiche delle Regioni del Mezzogiorno d’Italia”, within the project “Atlante Geotermico delle Regioni Mezzogiorno”, URL http://atlante.igg.cnr.it (accessed on 5 July 2024), funded by the Italian Council for Research.

Data Availability Statement

The raw data supporting the conclusions of this article will be made available by the authors on request.

Acknowledgments

We wish to thank G. Coco for his help in the field acquisition of seismic and geoelectric data and the elaboration of seismic tomographies and G.R. Messina for her help in the acquisition of soil CO2 data. We also thank the Parish of Santa Barbara, in particular A. Privitera, for giving us the permission to work inside and around the church.

Conflicts of Interest

The authors declare no conflicts of interest.

References

  1. Chester, D.K.; Degg, M.; Duncan, A.M.; Guest, J.E. The Increasing Exposure of Cities to the Effects of Volcanic Eruptions: A Global Survey. Glob. Environ. Chang. Part B Environ. Hazards 2000, 2, 89–103. [Google Scholar] [CrossRef]
  2. Branca, S.; Coltelli, M.; Groppelli, G. Geological Evolution of a Complex Basaltic Stratovolcano: Mount Etna, Italy. Ital. J. Geosci. 2011, 130, 306–317. [Google Scholar] [CrossRef]
  3. Branca, S.; Coltelli, M.; De Beni, E.; Wijbrans, J. Geological Evolution of Mount Etna Volcano (Italy) from Earliest Products until the First Central Volcanism (between 500 and 100 ka ago) Inferred from Geochronological and Stratigraphic Data. Int. J. Earth Sci. 2008, 97, 135–152. [Google Scholar] [CrossRef]
  4. Istituto Nazionale di Statistica. Censimento Permanente della Popolazione e delle Abitazioni; Istituto Nazionale di Statistica: Rome, Italy, 2019. [Google Scholar]
  5. Andronico, D.; Lodato, L. Effusive Activity at Mount Etna Volcano (Italy) During the 20th Century: A Contribution to Volcanic Hazard Assessment. Nat. Hazards 2005, 36, 407–443. [Google Scholar] [CrossRef]
  6. Barsotti, S.; Andronico, D.; Neri, M.; Del Carlo, P.; Baxter, P.J.; Aspinall, W.P.; Hincks, T. Quantitative Assessment of Volcanic Ash Hazards for Health and Infrastructure at Mt. Etna (Italy) By Numer. Simulation. J. Volcanol. Geotherm. Res. 2010, 192, 85–96. [Google Scholar] [CrossRef]
  7. Jenkins, S.F.; Spence, R.J.S.; Fonseca, J.F.B.D.; Solidum, R.U.; Wilson, T.M. Volcanic Risk Assessment: Quantifying Physical Vulnerability in the Built Environment. J. Volcanol. Geotherm. Res. 2014, 276, 105–120. [Google Scholar] [CrossRef]
  8. Norman, C.R.; Kelley, K.L.; Sanner, C.; Lueck, S.; Norman, J.; Norrow, C. Water Intrusion: An Analysis of Water Sources, Categories, and the Degradation Science of Building Materials. Water 2024, 16, 1576. [Google Scholar] [CrossRef]
  9. Chiodini, G.; D’Alessandro, W.; Parello, F. Geochemistry of Gases and Waters Discharged by the Mud Volcanoes at Paternò, Mt. Etna (Italy). Bull. Volcanol. 1996, 58, 51–58. [Google Scholar] [CrossRef]
  10. Chicco, J.M.; Giammanco, S.; Mandrone, G. Multidisciplinary Study of the “salinelle” of Paternò Mud Volcanoes: Characteristics of the Fluids and Possible Correlations with the Activity of Mt. Etna. Ann. Geophys. 2020, 63, 1–34. [Google Scholar] [CrossRef]
  11. Caracausi, A.; Favara, R.; Giammanco, S.; Italiano, F.; Paonita, A.; Pecoraino, G.; Rizzo, A.; Nuccio, P.M. Mount Etna: Geochemical Signals of Magma Ascent and Unusually Extensive Plumbing System. Geophys. Res. Lett. 2003, 30, 1057. [Google Scholar] [CrossRef]
  12. Caracausi, A.; Italiano, F.; Paonita, A.; Rizzo, A.; Nuccio, P.M. Evidence of Deep Magma Degassing and Ascent by Geochemistry of Peripheral Gas Emissions at Mount Etna (Italy): Assessment of the Magmatic Reservoir Pressure. J. Geophys. Res. Solid Earth 2003, 108, 2463. [Google Scholar] [CrossRef]
  13. Branca, S.; Coltelli, M.; Groppelli, G.; Lentini, F. Geological Map of Etna Volcano, 1:50,000 Scale. Ital. J. Geosci. 2011, 130, 265–291. [Google Scholar] [CrossRef]
  14. Barbano, M.S.; Azzaro, R.; Grasso, D.E. Earthquake Damage Scenarios and Seismic Hazard of Messina, North-Eastern Sicily (Italy) as Inferred from Historical Data. J. Earthq. Eng. 2005, 9, 805–830. [Google Scholar] [CrossRef]
  15. Polonia, A.; Torelli, L.; Gasperini, L.; Mussoni, P. Active Faults and Historical Earthquakes in the Messina Straits Area (Ionian Sea). Nat. Hazards Earth Syst. Sci. 2012, 12, 2311–2328. [Google Scholar] [CrossRef]
  16. Irwin, W.P.; Barnes, I. Tectonic Relations of Carbon Dioxide Discharges and Earthquakes. J. Geophys. Res. 1980, 85, 3115–3121. [Google Scholar] [CrossRef]
  17. Sugisaki, R.; Ido, M.; Takeda, H.; Isobe, Y.; Hayashi, Y.; Nakamura, N.; Satake, H.; Mizutani, Y. Origin of Hydrogen and Carbon Dioxide in Fault Gases and Its Relation to Fault Activity. J. Geol. 1983, 91, 239–258. [Google Scholar] [CrossRef]
  18. Rose, A.; Hawkes, H.; Webb, J. Geochemistry in Mineral Exploration; Academic Press: London, UK, 1979; ISBN 13: 9780965096805. [Google Scholar]
  19. Evans, W.C.; Sorey, M.L.; Kennedy, B.M.; Stonestrom, D.A.; Rogie, J.D.; Shuster, D.L. High CO2 Emissions through Porous Media: Transport Mechanisms and Implications for Flux Measurement and Fractionation. Chem. Geol. 2001, 177, 15–29. [Google Scholar] [CrossRef]
  20. Kerrick, D.M. Present and Past Nonanthropogenic CO2 Degassing from the Solid Earth. Rev. Geophys. 2001, 39, 565–586. [Google Scholar] [CrossRef]
  21. Klusman, R.W. Soil Gas and Related Methods for Natural Resource Exploration; Wiley: Hoboken, NJ, USA, 1993. [Google Scholar] [CrossRef]
  22. Azzaro, R.; Branca, S.; Giammanco, S.; Gurrieri, S.; Rasà, R.; Valenza, M. New Evidence for the Form and Extent of the Pernicana Fault System (Mt. Etna) Struct. Soil Gas Surveying J. Volcanol. Geotherm. Res. 1998, 84, 143–152. [Google Scholar] [CrossRef]
  23. Giammanco, S.; Inguaggiato, S.; Valenza, M. Soil and Fumarole Gases of Mount Etna: Geochemistry and Relations with Volcanic Activity. J. Volcanol. Geotherm. Res. 1998, 81, 297–310. [Google Scholar] [CrossRef]
  24. Grasso, M.; Lentini, F. Sedimentary and Tectonic Evolution of the Eastern Hyblean Plateau (Southeastern Sicily) during Late Cretaceous to Quaternary Time. Palaeogeogr. Palaeoclimatol. Palaeoecol. 1982, 39, 261–280. [Google Scholar] [CrossRef]
  25. Carbone, S.; Grasso, M.; Lentini, F. Lineamenti Geologici del Plateau Ibleo (Sicilia SE). Present. Delle Cart. Geol. Della Sicil. Sud-Orientale Mem. Della Soc. Geol. Ital. 1987, 38, 127–135. [Google Scholar]
  26. Lentini, F.; Carbone, S.; Grasso, M. Introduzione Alla Geologia della Sicilia e Guida all’escursione. In Proceedings of the Convegno della Società Geologica Italiana, Naxos/Pergusa, Italy, 22–25 April 1987. [Google Scholar]
  27. Lentini, F.; Carbone, S.; Catalano, S.; Grasso, M. Elementi per la Ricostruzione del Quadro Strutturale della Sicilia Orientale. Mem. Della Soc. Geol. Ital. 1996, 51, 179–195. [Google Scholar]
  28. Ristuccia, G.M.; Bonfanti, P.; Giammanco, S.; Stella, G. Assessment of the Geochemical Potential in a Complex Tectonic Environment of South-East Sicily: New Insights from Hydrochemical Data. Front. Earth Sci. 2019, 7, 13. [Google Scholar] [CrossRef]
  29. Ristuccia, G.; Bonfanti, P.; Giammanco, S. A Hydrogeochemical Approach to the Characterization of Low-Enthalpy Geothermal Systems: The Scordia—Lentini Graben (Sicily, Italy). Ann. Geophys. 2021, 64, HS438. [Google Scholar] [CrossRef]
  30. Rust, D.; Neri, M. The Boundaries of Large-Scale Collapse on the Flanks of Mount Etna, Sicily. Geol. Soc. Spec. Publ. 1996, 110, 193–208. [Google Scholar] [CrossRef]
  31. Rust, D.; Behncke, B.; Neri, M.; Ciocanel, A. Nested Zones of Instability in the Mount Etna Volcanic Edifice, Italy. J. Volcanol. Geotherm. Res. 2005, 144, 137–153. [Google Scholar] [CrossRef]
  32. Boschi, E.; Guidoboni, E.; Ferrari, G.; Mariotti, D.; Valensise, G.; Gasperini, P. Catalogue of Strong Italian Earthquakes from 461 B.C. to 1997 (Appendix to Volume 43 N° 4, 2000). Ann. Di Geofis. 2000, 43, 609–868. [Google Scholar] [CrossRef]
  33. Lentini, F.; Carbone, S.; Guarnieri, P. Collisional and Postcollisional Tectonics of the Apenninic-Maghrebian Orogen (Southern Italy). In Postcollisional Tectonics and Magmatism in the Mediterranean Region and Asia; Geological Society of America: Boulder, CO, USA, 2006; pp. 57–81. [Google Scholar]
  34. Gerardi, F.; Smedile, A.; Pirrotta, C.; Barbano, M.S.; De Martini, P.M.; Pinzi, S.; Gueli, A.M.; Ristuccia, G.M.; Stella, G.; Troja, S.O. Geological Record of Tsunami Inundations in Pantano Morghella (South-Eastern Sicily) Both from near and Far-Field Sources. Nat. Hazards Earth Syst. Sci. 2012, 12, 1185–1200. [Google Scholar] [CrossRef]
  35. Bottari, C.; Barbano, M.S.; Pirrotta, C.; Azzaro, R.; Ristuccia, G.; Gueli, A. Archaeological Evidence for a Possible First Century AD Earthquake in the Necropolis of Abakainon (NE Sicily). Quat. Int. 2013, 316, 190–199. [Google Scholar] [CrossRef]
  36. Silvestri, O. Eruzione di Fango presso l’Etna. Boll. Del Vulcan. Ital. 1879, 6, 28–31. [Google Scholar]
  37. Cumin, G. Le Salinelle di Paternò e la loro Attuale Attività. Boll. Dell’accademia Gioenia Di Sci. Nat. Catania 1954, 4, 515–528. [Google Scholar]
  38. D’Alessandro, W.; Bellomo, S.; Brusca, L.; Calabrese, S. Are the Salinelle Mud Volcanoes Threatening Human Health or Are Anthropogenic Activities Threatening the Salinelle Mud Volcanoes? A Comment on “Trace Element Biomonitoring Using Mosses in Urban Areas Affected by Mud Volcanoes around Mt. Etna. the Case of the Salinelle, Italy” by Bonanno et al. (DOI 10.1007/S10661-011-2332-z). Environ. Monit. Assess. 2013, 185, 2351–2354. [Google Scholar] [CrossRef]
  39. Mammino, P.I. Vulcani Di Fango Della Sicilia. Agorà 2014, 50, 90–95. [Google Scholar]
  40. Federico, C.; Liuzzo, M.; Giudice, G.; Capasso, G.; Pisciotta, A.; Pedone, M. Variations in CO2 Emissions at a Mud Volcano at the Southern Base of Mt Etna: Are They Due to Volcanic Activity Interference or a Geyser-like Mechanism? Bull. Volcanol. 2019, 81, 2. [Google Scholar] [CrossRef]
  41. Carveni, P.; Barone, F.; Benfatto, S.; Imposa, S.; Mele, G. Mud Volcano Fields in the MT. Etna Area (Eastern Sicily). In Raising the Profile of Geomorphological Heritage through Iconography, Inventory and Promotion, Proceedings of the International Symposium on Geomorphosites, Paris, France, 10-12 June 2009; Giusti, C., Ed.; Sorbonne Universitè: Paris, France, 2012; pp. 54–60. [Google Scholar]
  42. Carveni, P.; Benfatto, S.; Sturiale, G. Aspetti Geologici e Geomorfologici dei Vulcani di Fango del Basso Versante Sud–Occidentale Etneo ed Ipotesi sulla loro Genesi. Il Quat. 2001, 14, 117–130. [Google Scholar]
  43. Francaviglia, A. L’Imbasamento Sedimentario dell’Etna e il Golfo Pre-Etneo. Boll. Del Serv. Geol. D’italia 1959, 81, 593–684. [Google Scholar]
  44. Giammanco, S.; Carbone, S.; Pistorio, A. Il Geosito “Sistema delle Salinelle del Monte Etna” (Paternò e Belpasso—Sicilia Orientale). Geol. Dell’ambiente 2016, 3, 42–47. [Google Scholar]
  45. Giammanco, S.; Gurrieri, S.; Valenza, M. Soil CO2 Degassing on Mt Etna (Sicily) during the Period 1989-1993: Discrimination between Climatic and Volcanic Influences. Bull. Volcanol. 1995, 57, 52–60. [Google Scholar] [CrossRef]
  46. Bonfanti, P.; D’Alessandro, W.; Dongarrà, G.; Parello, F.; Valenza, M. Medium-Term Anomalies in Groundwater Temperature before 1991-1993 Mt. Etna Eruption. J. Volcanol. Geotherm. Res. 1996, 73, 303–308. [Google Scholar] [CrossRef]
  47. Pecoraino, G.; Giammanco, S. Geochemical Characterization and Temporal Changes in Parietal Gas Emissions at Mt. Etna (Italy) during the Period July 2000—July 2003. Terr. Atmos. Ocean. Sci. 2005, 16, 805–841. [Google Scholar] [CrossRef]
  48. Giammanco, S.; Bonfanti, P. Cluster Analysis of Soil CO2 Data from Mt. Etna (Italy) Reveals Volcanic Influences on Temporal and Spatial Patterns of Degassing. Bull. Volcanol. 2009, 71, 201–218. [Google Scholar] [CrossRef]
  49. Paonita, A. Long-Range Correlation and Nonlinearity in Geochemical Time Series of Gas Discharges from Mt. Etna, and Changes with 2001 and 2002–2003 Eruptions. Nonlinear Process. Geophys. 2010, 17, 733–751. [Google Scholar] [CrossRef]
  50. Camarda, M.; De Gregorio, S.; Gurrieri, S. Magma-Ascent Processes during 2005–2009 at Mt Etna Inferred by Soil CO2 Emissions in Peripheral Areas of the Volcano. Chem. Geol. 2012, 330–331, 218–227. [Google Scholar] [CrossRef]
  51. D’Alessandro, W.; Parello, F.; Valenza, M. Gas Manifestations of the Mt. Etna Area: Historical Notices and New Geochemical Data (1990–1993). Acta Vulcanol. 1996, 8, 23–29. [Google Scholar]
  52. Bonforte, A.; Guglielmino, F.; Coltelli, M.; Ferretti, A.; Puglisi, G. Structural Assessment of Mount Etna Volcano from Permanent Scatterers Analysis. Geochem. Geophys. Geosyst. 2011, 12. [Google Scholar] [CrossRef]
  53. La Manna, F.; Carnazzo, A. Le Salinelle Di Paternò; Nuova Ipotesi sulla loro Struttura e Formazione. Boll. Della Soc. Geol. Ital. 2000, 119, 9–14. [Google Scholar]
  54. Imposa, S.; Grassi, S.; De Guidi, G.; Battaglia, F.; Lanaia, G.; Scudero, S. 3D Subsoil Model of the San Biagio ‘Salinelle’ Mud Volcanoes (Belpasso, Sicily) Derived from Geophysical Surveys. Surv. Geophys. 2016, 37, 1117–1138. [Google Scholar] [CrossRef]
  55. Panzera, F.; Sicali, S.; Lombardo, G.; Imposa, S.; Gresta, S.; D’Amico, S. A Microtremor Survey to Define the Subsoil Structure in a Mud Volcanoes Area: The Case Study of Salinelle (Mt. Etna, Italy). Environ. Earth Sci. 2016, 75, 1140. [Google Scholar] [CrossRef]
  56. Allard, P.; Carbonnelle, J.; Dajlevic, D.; Le bronec, J.; Morel, P.; Robe, M.C.; Maurenas, J.M.; Faivre-Pierret, R.; Martin, D.; Sabroux, J.C.; et al. Eruptive and diffuse emissions of CO2 from Mount Etna. Nature 1991, 351, 387–391. [Google Scholar] [CrossRef]
  57. Giammanco, S.; Gurrieri, S.; Valenza, M. Soil CO2 Degassing along Tectonic Structures of Mount Etna (Sicily): The Pernicana Fault. Appl. Geochem. 1997, 12, 429–436. [Google Scholar] [CrossRef]
  58. Giammanco, S.; Gurrieri, S.; Valenza, M. Anomalous Soil CO2 Degassing in Relation to Faults and Eruptive Fissures on Mount Etna (Sicily, Italy). Bull. Volcanol. 1998, 60, 252–259. [Google Scholar] [CrossRef]
  59. Giammanco, S.; Gurrieri, S.; Valenza, M. Geochemical Investigations Applied to Active Fault Detection in a Volcanic Area: The North-East Rift on Mt. Etna (Sicily, Italy). Geophys. Res. Lett. 1999, 26, 2005–2008. [Google Scholar] [CrossRef]
  60. Grassa, F.; Capasso, G.; Favara, R.; Inguaggiato, S.; Faber, E.; Valenza, M. Molecular and Isotopic Composition of Free Hydrocarbon Gases from Sicily, Italy. Geophys. Res. Lett. 2004, 31, 2003GL019362. [Google Scholar] [CrossRef]
  61. Messina, G. Geologia dell’area Urbana di Paternò; University of Catania: Catania, Italy, 2004. [Google Scholar]
  62. Garber, M.; Koopman, F. Methods of Measuring Water Levels in Deep Wells; Techniques of Water-Resources Investigations; US Government Printing Office: Washington, DC, USA, 1968. [Google Scholar]
  63. Parkinson, K.J. An Improved Method for Measuring Soil Respiration in the Field. J. Appl. Ecol. 1981, 18, 221. [Google Scholar] [CrossRef]
  64. Tonani, F.; Miele, G. Methods for Measuring Flow of Carbon Dioxide through Soils in the Volcanic Setting. In Proceedings of the International Conference on Active Volcanoes and Risk Mitigation, Napoli, Italy, 27 August–1 September 1991. [Google Scholar]
  65. Chiodini, G.; Cioni, R.; Guidi, M.; Raco, B.; Marini, L. Soil CO2 Flux Measurements in Volcanic and Geothermal Areas. Appl. Geochem. 1998, 13, 543–552. [Google Scholar] [CrossRef]
  66. Sinclair, A.J. Selection of Threshold Values in Geochemical Data Using Probability Graphs. J. Geochem. Explor. 1974, 3, 129–149. [Google Scholar] [CrossRef]
  67. Stewart, R.R. Exploration Seismic Tomography: Fundamentals; Society of Exploration Geophysicists: Houston, TX, USA, 1991. [Google Scholar] [CrossRef]
  68. Loke, M.H.; Barker, R.D. Practical Techniques for 3D Resistivity Surveys and Data Inversion. Geophys. Prospect. 1996, 44, 499–523. [Google Scholar] [CrossRef]
  69. Messina, G. Rilevamento Geologico e Geochimico dell’area di Paternò; University of Catania: Catania, Italy, 2006. [Google Scholar]
  70. Giggenbach, W.F. Geothermal Solute Equilibria. Derivation of Na-K-Mg-Ca Geoindicators. Geochim. Et Cosmochim. Acta 1988, 52, 2749–2765. [Google Scholar] [CrossRef]
  71. Aiuppa, A.; Bellomo, S.; Brusca, L.; D’Alessandro, W.; Federico, C. Natural and Anthropogenic Factors Affecting Groundwater Quality of an Active Volcano (Mt. Etna, Italy). Appl. Geochem. 2003, 18, 863–882. [Google Scholar] [CrossRef]
  72. Aiuppa, A.; Allard, P.; D’Alessandro, W.; Giammanco, S.; Parello, F.; Valenza, M. Magmatic Gas Leakage at Mount Etna (Sicily, Italy): Relationships with the Volcano-Tectonic Structures, the Hydrological Pattern and the Eruptive Activity. Geophys. Monogr. Ser. 2004, 143, 129–145. [Google Scholar]
  73. Kanemasu, E.T.; Powers, W.L.; Sij, J.W. Field Chamber Measurements of CO2 Flux from Soil Surface. Soil Sci. 1974, 118, 233–237. [Google Scholar] [CrossRef]
  74. D’Amore, F.; Panichi, C. Geochemistry in Geothermal Exploration. Int. J. Energy Res. 1985, 9, 277–298. [Google Scholar] [CrossRef]
  75. Sibson, R.H. Fluid Involv. Norm. Faulting. J. Geodyn. 2000, 29, 469–499. [Google Scholar] [CrossRef]
  76. Liotta, M.; D’Alessandro, W.; Bellomo, S.; Brusca, L. Volcanic Plume Fingerprint in the Groundwater of a Persistently Degassing Basaltic Volcano: Mt. Etna. Chem. Geol. 2016, 433, 68–80. [Google Scholar] [CrossRef]
  77. Liotta, M.; D’Alessandro, W.; Arienzo, I.; Longo, M. Tracing the Circulation of Groundwater in Volcanic Systems Using the 87Sr/86Sr Ratio: Application to Mt. Etna. J. Volcanol. Geotherm. Res. 2017, 331, 102–107. [Google Scholar] [CrossRef]
  78. Formisano, A.; Vaiano, G.; Davino, A.; Citro, S.; D’Amato, M. Seismic Vulnerability Assessment of Two Territorial Case Studies of Italian Ancient Churches: Comparison Between Simplified and Refined Numerical Models. Int. J. Mason. Res. Innov. 2022, 7, 172–216. [Google Scholar] [CrossRef]
  79. Ruggieri, S.; Tosto, C.; Rosati, G.; Uva, G.; Ferro, G.A. Seismic Vulnerability Analysis of Masonry Churches in Piemonte After 2003 Valle Scrivia Earthquake: Post-event Screening and Situation 17 Years Later. Int. J. Archit. Herit. 2022, 5, 717–745. [Google Scholar] [CrossRef]
  80. Lo Monaco, A.; Grillanda, N.; Onescu, I.; Fofiu, M.; Clementi, F.; D’Amato, M.; Formisano, A.; Milani, G.; Mosoarca, M. Seismic Assessment of Romanian Orthodox Masonry Churches in the Banat Area Through a Multi-level Analysis Framework. Eng. Fail. Anal. 2023, 153, 107539. [Google Scholar] [CrossRef]
  81. Onescu, I.; Lo Monaco, A.; Grillanda, N.; Mosoarca, M.; D’Amato, M.; Formisano, A.; Milani, G.; Clementi, F.; Fofiu, M. Simplified Vulnerability Assessment of Historical Churches in Banat Seismic Region, Romania. Int. J. Archit. Herit. 2024, 18, 1–14. [Google Scholar] [CrossRef]
Figure 1. Map of Mt. Etna volcano. The area of the town of Paternò is delimited by a blue square box.
Heritage 07 00237 g001
Figure 2. Geological map of the area around the town of Paternò, with the location of the Salinelle mud volcanoes (red diamond, see text for details) and of the Historic Hill. Data from [13].
Heritage 07 00237 g002
Figure 3. (a) Detailed map of the urban area around St. Barbara’s Church in Paternò (Map scale 1:500). Red circles show the location of piezometers, blue circles indicate core drillings and the green circle indicates the location of the Chisari well. Names and absolute altitudes (in m a.s.l.) are also shown near each circle. Lithological profiles A–A’, B–B’, C–C’ and D–D’ are shown with purple dashed lines. (b) Detailed map of St. Barbara’s church, showing the location of seismic profiles (red lines) and geo-electrical profiles (blue lines).
Heritage 07 00237 g003
Figure 4. (a) Image of the north facade of St. Barbara’s Church, showing the lesions and the cracks that formed in December 2008 (the most evident of which are highlighted with red square boxes); (b,c) images of the interior of the church, showing pieces of the plaster frieze of the north side after their collapse to the church floor.
Heritage 07 00237 g004
Figure 5. Geologic cross sections along profiles A–A’ (a); B–B’ (b); C–C’ (c); D–D’ (d).
Heritage 07 00237 g005
Figure 6. (a) Normal probability plot of 82 soil CO2 efflux data collected in 2009 and 2012. Black dots show the whole set of original data, whereas the different statistical populations are highlighted with different colored dots and capital letters (A–F); (b) Distribution map of interpolated soil CO2 effluxes (expressed in log10 g m−2 d−1) in the Paternò area. Blue dots show the sites of soil CO2 efflux measurements. The different colors in the areas on the map indicate the different statistical populations of CO2 efflux values as discriminated using the normal probability plot (colors are the same as in plot (a) and the threshold values in the scale correspond to those of populations A–F in plot (a)). The two areas in hatched red lines show the location of the Salinelle mud volcanoes on the NW outskirts of Paternò. Topographic map at scale 1:10,000.
Heritage 07 00237 g006
Figure 7. Graphical results of the chemical analyses of groundwater samples from piezometers SV1 and SV2: (a) Langelier-Ludwig classification graph (arrows show major mixing trends between the typical composition of Mt. Etna groundwater and other types of waters/fluids); (b) Ternary plot of major anions in solution, modified from [70]. The cyan arrow shows the main mixing trend between typical Etna groundwaters and steam-heated groundwaters in acidic volcanic environments; (c) Graph of log(K2/Mg) vs. log(K2/Ca), showing calculated equilibrium temperature and pCO2 values for the analyzed samples (see text for explanation).
Heritage 07 00237 g007
Figure 8. Temporal evolution of (a) groundwater temperature and (b) water level (in meters below ground surface) measured in SV1, SV2, SV3, SV6 the piezometers and in the Chisari water well during the investigated period.
Heritage 07 00237 g008
Figure 9. 2D seismic tomographies of the shallow rocks underneath St. Barbara’s Church and their interpretations in terms of lithology. (a) TOMO-S1 (the dashed red box indicates the volume of ground investigated in detail with TOMO-S4); (b) TOMO-S2; (c) TOMO-S3; (d) TOMO-S4.
Heritage 07 00237 g009
Figure 10. 3D geo-electrical tomography of the volume of rock underneath St. Barbara’s Church (to a depth of 10 m). Red dots indicate the resistivity measurement points. Resistivity values expressed in ohm m.
Heritage 07 00237 g010
Figure 11. Schematic representation of the local tectonic structures around St. Barbara’s Church (indicated with a red square), inferred from soil CO2 efflux data. The different colors in the interpolated CO2 efflux values (expressed in log10 g m−2 d−1) indicate the different statistical populations as discriminated using the normal probability plot.
Heritage 07 00237 g011
Table 1. Values of soil CO2 efflux measured during the 2009 survey in downtown Paternò.
EastingNorthingCO2 Efflux
(g m−2 d−1)
EastingNorthingCO2 Efflux
(g m−2 d−1)
EastingNorthingCO2 Efflux
(g m−2 d−1)
49090441578051.68490815415777622.56491036415776360
49094441577882.16491017415778423.52490847415819460.24
49052741579422.64490797415805224490857415788560.48
49116741577573.6490773415778424.24490927415787061.68
49089241579715.28490618415808724.48490610415791966.48
49079241579856.24491210415794026.64490671415796866.72
49091641579756.48490908415788726.88490941415803675.36
49069841577326.48491172415770327.12491044415807180.4
49085341580897.68490877415807727.6490754415779389.04
49115441581798.64490873415790728.32491197415795893.6
49069741579959.12490858415795929.04490972415779394.32
49070941579779.6490991415806429.524908644158034100.8
49085241581039.6490874415799036.484908884157980112.56
490840415814910.08490789415814536.724908504157934112.8
490814415811910.32490868415788537.444909204157888114
490913415802312.24490801415786839.844910964158024135.84
490860415794914.16490803415796544.164908494158178138.72
490842415810014.8490856415776844.164908064157840142.08
490852415782517.04490934415805847.764912584158046144.48
490985415808318.24490931415782650.44909314157853185.04
490668415818818.96491026415825650.884909924157814198.96
490893415798718.96490932415789451.364908494158123200.88
491222415792419.44490907415806152.324908614158065206.64
491207415809120.64490978415804552.564908214157888226.8
491130415777621.36490883415792453.284911024158042268.8
490966415803621.84490778415817054.72
491024415799722.08491163415801658.32
Table 2. Values of CO2 concentration (in ppm vol) measured during 2012–2014 in the water wells and boreholes around St. Barbara’s church. n.m. = not measured.
Date of SamplingSV1SV2SV3SV6SI5Chisari Well
3 January 201210,0001000n.m.n.m.n.m.n.m.
31 May 201219,6503150n.m.97001600n.m.
7 September 20122600n.m.n.m.6000n.m.n.m.
24 July 2012950025005201200n.m.n.m.
10 June 201248,600n.m.n.m.20,000n.m.n.m.
14 December 201241,00085013,60033,700n.m.520
2 January 201325,50012001830730n.m.2800
23 December 201343,50036,0004805600n.m.7900
1 October 201427,80019,80013201795n.m.2868
2 July 20146004572200450n.m.489
13 March 20143300240022452550n.m.2300
27 March 201453148224651216n.m.521
16 April 2014455110029851030n.m.1244
29 May 2014427429615564n.m.10,214
Table 3. Groundwater composition at piezometers SV1 and SV2. Values of pH are expressed in pH units, values of conductivity are expressed in μS/cm and all concentrations of chemical parameters are expressed in mg/L.
SitepHCondNaKCaMgHCO3SO42−NO3ClCO32−
SV16.94414038921610521963133.90.01380<0.5
SV26.84186719413370.8703618.040.03108<0.5
Table 4. Correlation matrix for water temperature values measured at water wells SV1, SV2, SV3, SV6 and Chisari. Statistically significant correlations (R > 0.5) are highlighted in bold.
SV1SV2SV3SV6Chisari
SV11
SV20.711
SV30.580.511
SV60.730.380.441
Chisari0.540.480.450.351
Table 5. Correlation matrix for water level values measured at water wells SV1, SV2, SV3, SV6 and Chisari. Statistically significant correlations (R > 0.5) are highlighted in bold.
SV1SV2SV3SV6Chisari
SV11
SV2−0.471
SV3−0.220.371
SV6−0.020.440.791
Chisari−0.140.550.280.331
Disclaimer/Publisher’s Note: The statements, opinions and data contained in all publications are solely those of the individual author(s) and contributor(s) and not of MDPI and/or the editor(s). MDPI and/or the editor(s) disclaim responsibility for any injury to people or property resulting from any ideas, methods, instructions or products referred to in the content.