Article

The Classification of Cultural Heritage Buildings in Athens Using Deep Learning Techniques

by
Konstantina Siountri
1,2,* and
Christos-Nikolaos Anagnostopoulos
2
1
Digital Culture, Smart Cities, IoT & Advanced Digital Technologies, Department of Informatics, University of Piraeus, 185 34 Piraeus, Greece
2
Cultural Technology and Communication Department, University of the Aegean, 811 00 Mytilene, Greece
*
Author to whom correspondence should be addressed.
Heritage 2023, 6(4), 3673-3705; https://doi.org/10.3390/heritage6040195
Submission received: 18 February 2023 / Revised: 26 March 2023 / Accepted: 7 April 2023 / Published: 13 April 2023
(This article belongs to the Section Cultural Heritage)

Abstract

:
Architectural structures, the basic elements of the urban web, are an aggregation of buildings that have been built at different times, with different materials, and in different styles. Through research, they can be divided into groups that present common morphological attributes and refer to different historical periods with particular social, economic, and cultural characteristics. The identification of these common repeating elements and organizational construction structures leads to the identification of the “type” of the building, which until now has required specialized knowledge, time, and customized proof checking. Recent developments in the field of artificial intelligence (AI) and, more specifically, in deep learning (DL) appear to contribute gradually to the study of the typological evolution of buildings, especially those of cultural heritage (CH). In this paper, we present a deep-learning-based method for the classification of modern Athenian architecture (since 1830) using the YOLO algorithm. This research work can contribute to the digital management of the existing urban building stock, the autonomous large-scale categorization of data that are available from street view images, and the enhancement of the tangible CH.

1. Introduction

The architectural type, i.e., a repetitive system of setting into groups similar structures with common morphological features, evolved over time, depending on the social, economic, political, and religious conditions of each region. At the same time, the technical possibilities, the access to building materials, and the climate were decisive factors for shaping the style of the constructions of a place. The study of architectural history is to this day the subject of research by architects, archaeologists, historians, and cultural heritage (CH) specialists, which is based on long-term training, specialization, and often in situ work [1].
Surveying a city’s buildings usually requires several evaluators, an efficient way of recording survey data, and an efficient way of storing the results [2]. These studies are connected not only to the identification of the evolution of architecture but also to the construction period of the buildings, as their type changes progressively over time.
The mapping and analysis of city, neighborhood, or even street-level buildings are of primary importance for infrastructure management, financial planning, emergency management [3] (i.e., earthquakes, fires, etc.), climate change adaptation (i.e., energy management), climate change mitigation, etc.
In particular, with regard to the effects on the local and regional economy, the construction period of buildings is directly linked to real estate and to purchase and rental prices [4], owing to factors such as population density due to restrictions on the size of older buildings, maintenance costs, amenities offered to residents (e.g., parking), but also the added value that historical centers and settlements often have, especially those with increased tourist interest.
At the same time, the categorization of buildings affects national and international policies. More specifically, in the context of the upcoming Greek bill concerning arrangements for abandoned and vacant properties as well as intervention procedures for their restoration and reuse by the private sector under conditions of legal certainty and with fast procedures, and the European Renovation Wave initiative [5], establishing the age of buildings and their quantitative classification is necessary to facilitate the taking of financial measures, the securing of a budget, and the provision of incentives for their maintenance and upgrading. After all, in the philosophy imposed by the new environmental conditions, the preservation and use of existing structures is preferred over their demolition [6].
In addition, the classification and quantification of buildings according to their age and materials supplies the market with new data, as, in the context of the circular economy, knowledge about potential customers can inform the organization of a system of restoration and maintenance of materials and their collection and reuse, as well as the development of new compatibles ones [7], according to the new context and obligations (i.e., carbon neutral materials).
Finally, the classification of buildings is a key source of knowledge in urban and spatial planning. By the beginning of the 21st century, the study of the protection of the wider historical environment had been implemented separately from the development of spatial planning. For this reason, following the Declaration of Amsterdam (1975), the Council of Europe has tried to promote a more comprehensive approach with the UNESCO Recommendation (2011) on the Historic Urban Landscape (HUL) [8,9]. HUL supports the implementation of a holistic approach that supports social involvement for the promotion of community education to recognize and maintain the diversity of CH that, despite the fact that it can be transformed over time, helps to maintain the physiognomy of the place [10].
In this context, urban development is promoted in terms of improvement in quality of life and sustainability. The classification of the building stock decisively determines not only protection zones and land uses but also the possibilities of, or limitations on, investment initiatives [11] and the decisions about the regeneration of an area and its management, especially regarding net zero zones, under the pressure of achieving climate neutrality in urban areas and respecting the Green Deal [12].
In Greece, data on the age of buildings can be extracted from the Greek Statistical Authority [13], but without information concerning the typology of buildings. From the Archaeological Land Register [14], data concerning the monuments listed by the Ministry of Culture can be derived; however, these data do not cover all the historical buildings, but only a part of them. Accordingly, the database of the Ministry of Environment and Energy [15], the co-competent public service in Greece for the preservation of cultural heritage, has limited data from the buildings that have been designated as preserved. The lack of a comprehensive registration of valuable historical buildings is mainly due to limited financial means, a lack of human resources, and long bureaucratic procedures.
On the other hand, efforts based mainly on private initiatives (mainly NGOs) or crowdfunding are either limited to well-defined study areas or to specific periods, depending on the special interest of each group. The initiatives of the NGO Monumenta, which proceeded with records within the municipality of Athens with the help of volunteers [16], and the “Archive of Modern Monuments-ModMov” of the Elliniki Etairia Society for the Environment and Cultural Heritage [17], which was limited to the recording of the buildings of the Modern Movement, also in Athens, are characteristically mentioned. At the same time, initiatives to create databases with the help of crowdfunding, such as the “Listed Buildings Archive” [18] and the “Interesting Architecture of Athens” [19], provide a limited number of records, as they are based on voluntary contributions and not a systematic survey of an area. All the aforementioned efforts required many hours of human labor and in several cases the expenditure of financial resources, which came mainly from sponsorships.
As regards the typological studies of architecture that inform the classification of buildings, many research studies have been carried out that indicate ways of recording and categorizing buildings at a multinational level [20,21] or, more specifically, in Greece and in Athens [22,23].
However, all the above cases from the public and private sectors, as well as civil society initiatives, even if they are brought together after additional long hours of work by many people, do not give comprehensive information about all the buildings in a city, e.g., in our case, in the municipality of Athens. This is due to the fact that, through the above efforts, only the historical buildings are recorded, and not those from later periods, such as post-war buildings (e.g., apartment buildings); additionally, with regard to cultural heritage buildings, the information is fragmented and, in many cases, not complete.
In our paper, deep learning (DL) is used by means of the YOLO algorithm for building typology classification (and consequently also the construction period) in specific areas of the municipality of Athens from 1834 onwards, which is the year of the proclamation of the city as the capital of the newly established Greek state. The fact that before 1834 there was a very small number of buildings around the Acropolis, with most of the structures and the road network being built in the following decades [24], was a decisive parameter in defining the specific period of study.
Our effort was focused on (a) determining the typology of the buildings using facade images and (b) identifying separately morphological and structural elements of each period. The advantages of this method are multiple. Firstly, as in the aforementioned databases (except those of the Ministry of Culture, which in several cases receive data from the inside of the buildings), the recording material was formed from the facades of the buildings; this can be freely obtained from the street level. Secondly, at the level of a municipality, an urban unit, a neighborhood, or a building block, by means of a quick scan with a camera, the use of Google Street View, or scanning with UAVs, a huge amount of data can be acquired and very promptly classified. Thirdly, the results of the research can be effectively used for (a) the evaluation and comparison of the common elements of the architectural structures; (b) the effective digital management of the information concerning the existing building stock; and (c) the export of useful conclusions for the further study of cultural heritage, e.g., the identification of concentrations of historic buildings, the approximate dating of these concentrations, the extraction of statistics, and the formulation of short-term and long-term renovation policies that will ultimately lead to more in-depth studies of the existing condition, restoration, and conservation.
The structure of the article is organized as follows: firstly, Section 2 explains deep learning and the Yolo algorithm and, Section 3 describes the related work on the classification of cultural heritage buildings using IT. Then, Section 4 analyses the methodology of the paper through the description of the architectural styles of Athenian houses after 1834, and the creation of the data set and the training of the YOLO algorithm in several experiments are presented analytically. Section 5 presents the study cases for generalization assessment. Section 6 demonstrates the results of the training and comments on misclassifications of the YOLO system. Section 7 discusses the results of this research, and finally, the last section summarizes the conclusions of our work.

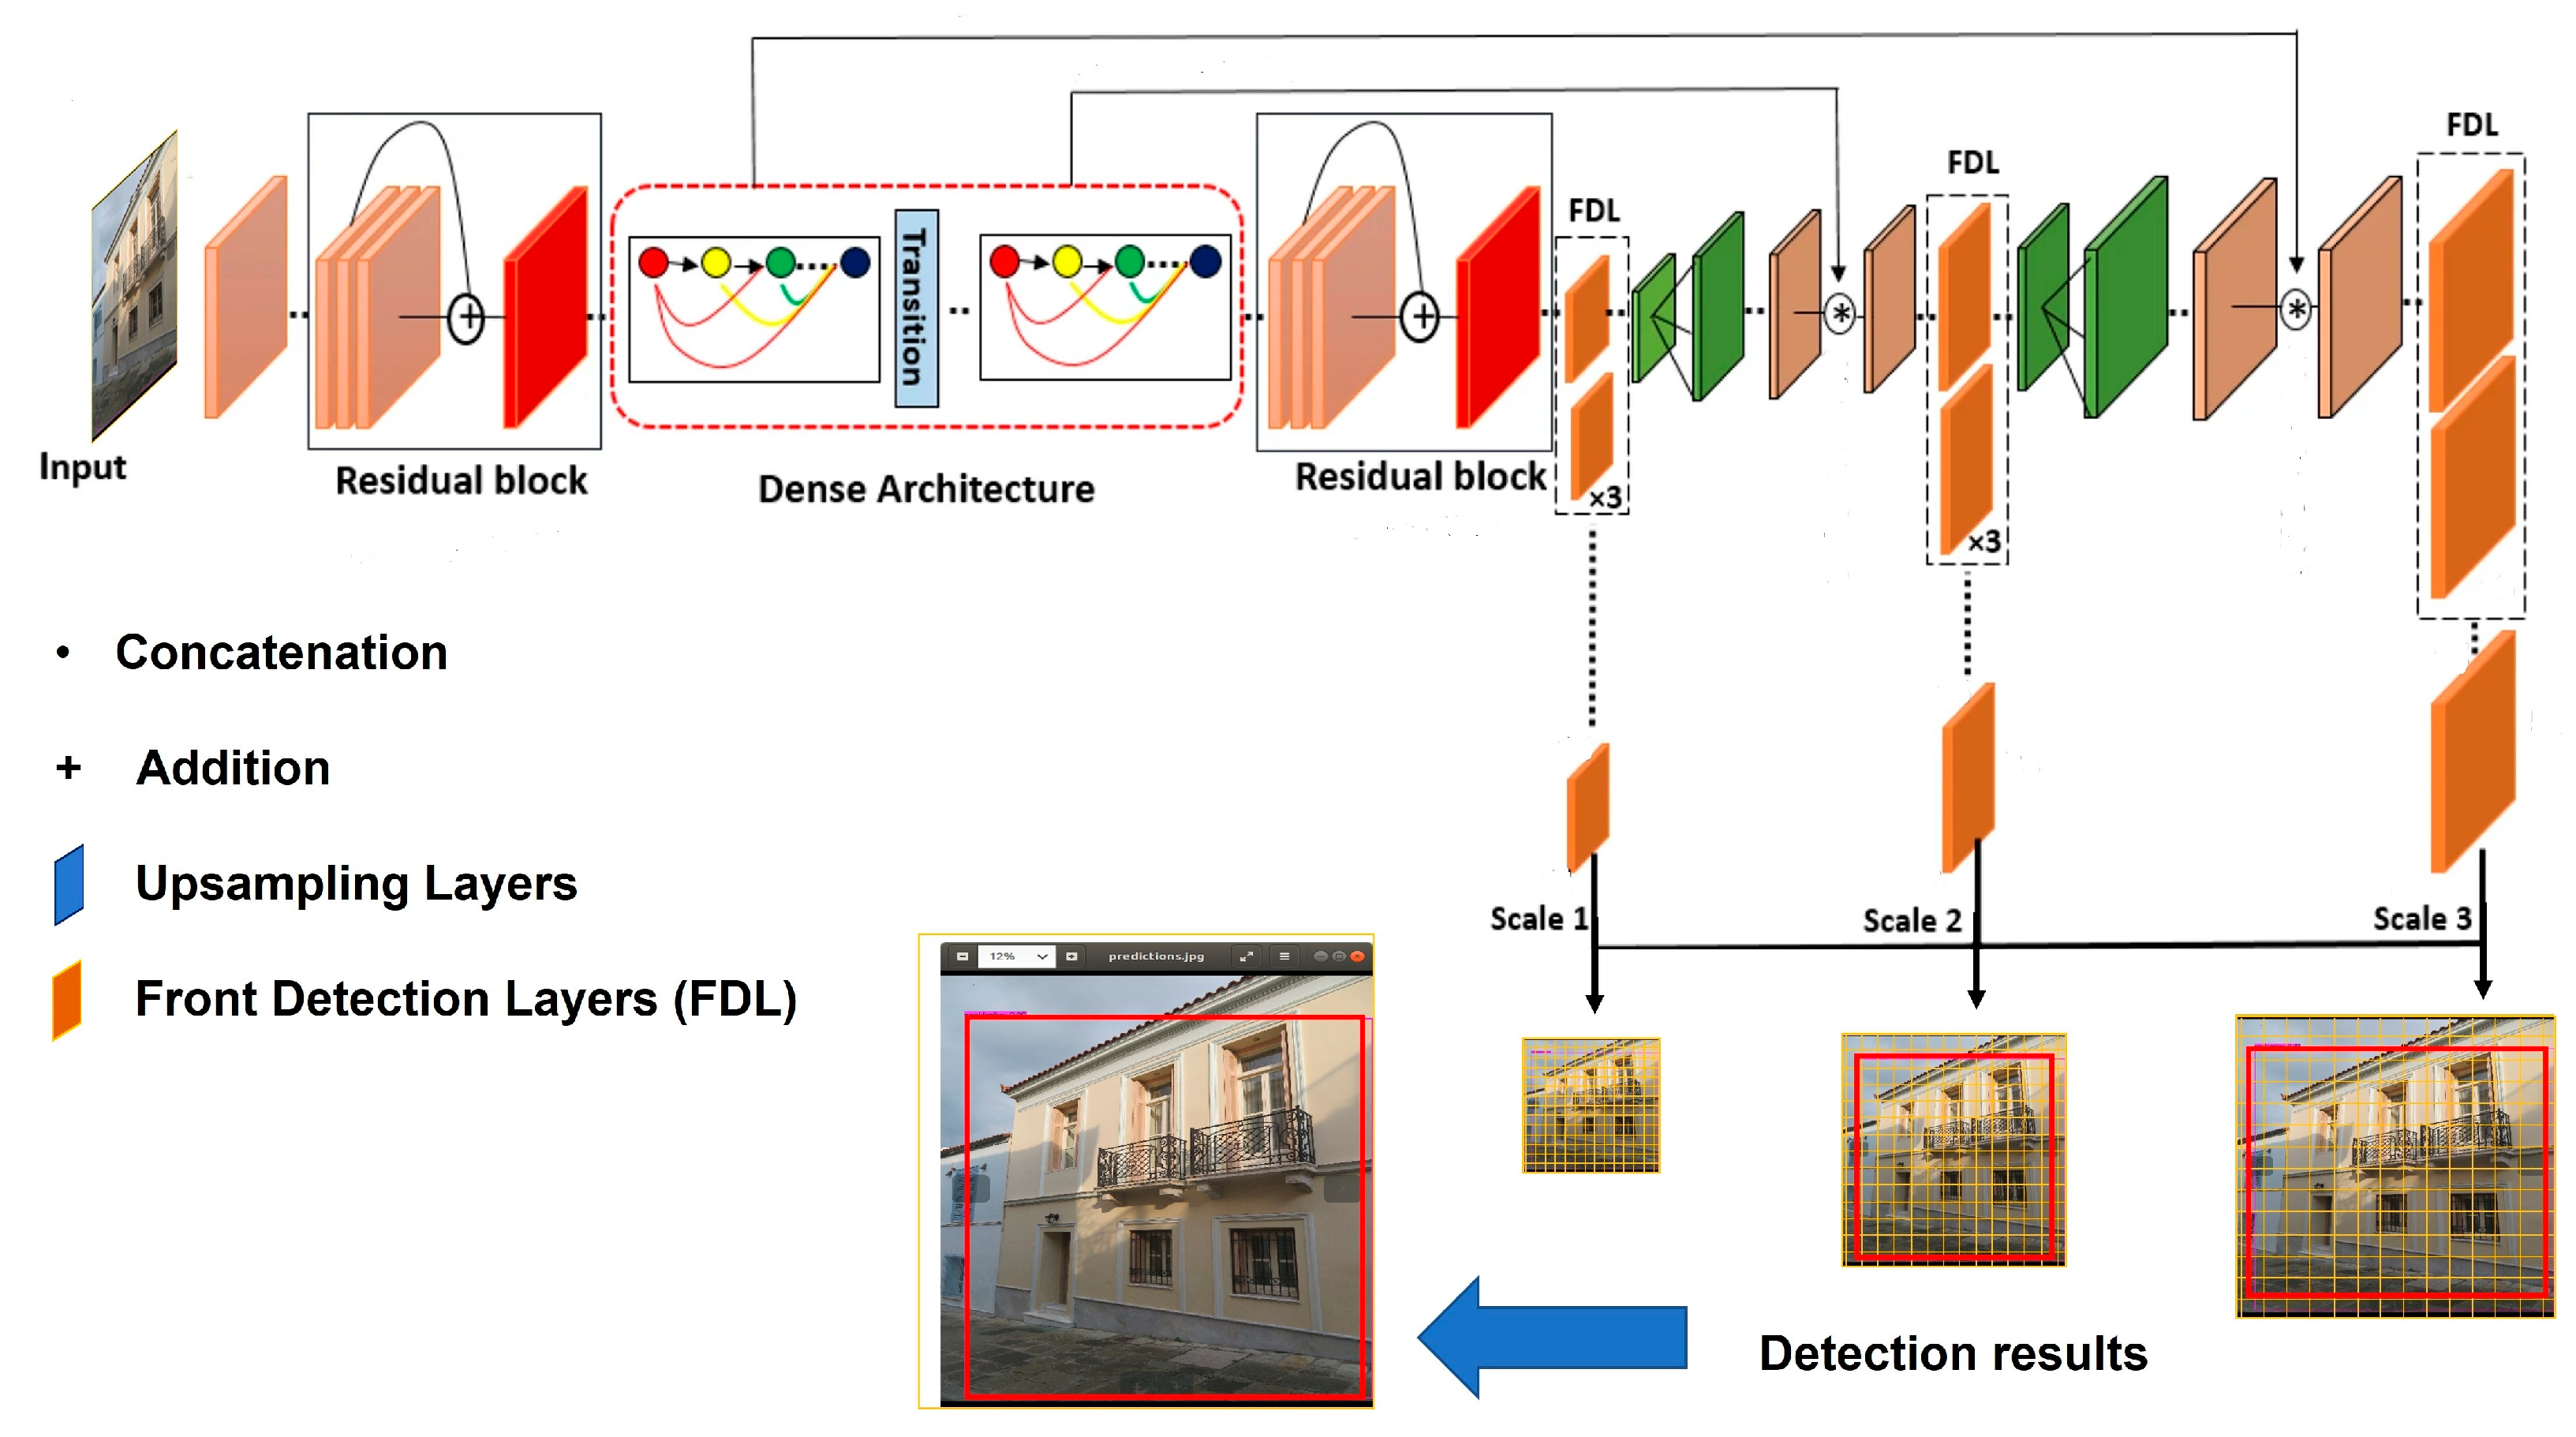
2. Deep Learning and the Yolo Algorithm

Deep learning (DL) is a subfield of machine learning and artificial intelligence that uses algorithms known as neural networks. An artificial neuron is a mathematical and informatic model of a biological neuron that was first introduced by Warren McCulloch and Walter Pitts in 1943 [25]. Its use involves multiple layers to process complex and large amounts of data, such as images or text, and it has the ability to learn and make predictions or decisions faster and more efficiently than a human [26].
Until now, the use of DL has been applied in many different fields [27,28], such as speech recognition, computer vision, machine translation, etc. However, thanks to its architecture and to the fact that its procedures are almost autonomous, DL can be applied to many other sectors.
In the context of classifying cultural heritage buildings, deep learning algorithms could be used to analyze images of buildings and automatically classify them according to certain characteristics, such as their architectural style or historical period [1]. For example, a deep learning model could be trained on a large data set of images of cultural heritage buildings and then be able to accurately identify and classify new buildings it has not seen before. This could be useful for cataloguing and organizing large collections of buildings, as well as for assisting in the preservation procedure. Moreover, it may even help in identifying unknown or unmarked structures.
This study focuses on DL using the YOLO method. YOLO (you only look once) is a type of object detection algorithm developed by Joseph Redmon and Ali Farhadi in 2015 [29] that is able to classify objects in images and videos with high accuracy and speed. It is widely used in computer vision tasks, such as classifying buildings in satellite images [30]. YOLO was inspired by the success of the R-CNN (regional convolutional neural network), an earlier object detection algorithm developed by Ross Girshick in 2014 [31]. However, the R-CNN [32] required multiple passes over an image to detect objects, which made it slow and impractical for real-time applications.
YOLO uses a single convolutional that divides the image into a grid of cells, and each cell is responsible for predicting the presence of a certain number of objects in its area [33]. By doing this, YOLO is able to process an entire image in a single pass, making it much faster than other object detection algorithms that require multiple passes or separate detection and classification stages. This makes it particularly useful for applications where real-time object detection is important [34], such as in self-driving cars or surveillance systems.
In general, the ability of YOLO to detect smaller objects in an image is significantly improved by providing even more areas to recognize. The prediction of the class as well as the confidence of the subject is achieved through logistic regression, compared to the first versions, which were dominated by linear regression. Its architecture differs from other object detection architectures, as it applies the neural network to the whole image and not to parts of it; the image is divided into regions, and bounded boxes and their corresponding probabilities are predicted for each region. More specifically, the input is divided into an S × S grid. Each part of the grid is responsible for identifying a single object. At the same time, B bounded boxes and their corresponding confidence rates, as well as C bounded probabilities of the classes, are produced. The confidence is defined as:
Pr O b j e c t I O U p r e d t r u t h ,
where I O U tands for intersection over union and the conditional class probabilities as P r ( C l a s s i | O b j e c t ) [29]. A bounded box contains the x and y coordinates of the center of the box, the height and the width of the box, and a confidence score. The latter describes how accurate the grid cell is and the likelihood that an object is contained within it. The highest scores are also those that qualify as final predictions, and the output is in the form:
Pr C l a s s i O b j e c t Pr O b j e c t I O U p r e d t r u t h = Pr ( C l a s s i ) I O U p r e d t r u t h
The above formula describes the probability of a class characterizing the object within the box and the ability to match [29].
YOLO is using a CNN with 24 convolutional layers and two fully connected layers. It also uses 1 × 1 filters to reduce the number of feature maps followed by 3 × 3 layers to extract features. Its prediction has a vector shape of (S, S, B × 5 + C). Therefore, it converts numerical scores into probabilities. Based on the ImageNet classification, the final layer convolution of a tensor (7, 7, 1024) using two fully connected layers gives us a vector (7, 7, 30).
YOLO architecture is based on both a CPU (central processing unit) and a GPU (graphics processing unit), leaving the final choice to the user and the capabilities of their terminal machine. The implementation under consideration only works using the GPU, which is designed in such a way that it excels in the aforementioned functions. The use of this algorithm requires a complete system to be installed.
The first version of YOLO clearly includes its architecture; the second version, or YOLOv2, redefines its architecture and introduces techniques to optimize bounded envelopes, while YOLOv3 [35] improves its architecture to the maximum extent as well as the process of education. YOLOv3 performs remarkably well with fast predictions while maintaining its accuracy to a satisfactory degree. YOLO4 [36], released in April 2020, is an improvement on the YOLOv3 algorithm, improving the mean average precision (mAP) by 10% and the number of frames per second by 12%. The latest version, YOLOv5 [36], was released on 25 June 2020 by Ultralytics and is a computer vision model used for detecting objects.
In the context of classifying cultural heritage (CH) buildings, in this research work, YOLO was firstly trained on a data set of labeled images of cultural heritage house buildings in Athens (after 1834 A.D.) using photographs from their facades (street view images). The algorithm then used this training to make predictions on new, unseen images. For each grid cell in the input image, YOLO would predict the probability of each class (i.e., style of CH building) and the coordinates of the bounding box around the detected object. These predictions were then used to classify the objects in the image and identify any CH buildings present.
The training of the algorithm was initiated in 2019 and ended with the YOLOv4, meaning that the results could be even better today. However, we consider that, regarding the significantly limited published work on implementing this algorithm on tangible cultural heritage, this paper contributes to the relevant research.

3. Related Work

The digital classification of cultural heritage (CH) is being analyzed in a considerable amount of research work, highlighting the need for a standardized pipeline for an autonomous style-prediction task, despite the necessity of a multi-criteria process [37]. The current chapter focuses on the literature on the classification of CH facade assets based on data sets of 2D images.

3.1. Non-Deep Learning Architectural Style Identification

Mathias, M. et al. (2011) [38] propose a method to automate the classification process of different architectural styles. In addition, they contribute to the field of architecture by firstly determining if there is an actual facade of a building in an image and, secondly, by rectifying the distorted image. Finally, they introduce a vertical line system to separate multiple facades within the same image. Thereafter, the task of classification of the architectural style is performed, recording the building style as Flemish Renaissance, Haussmannian, or neoclassical using a Naïve Bayes Nearest Neighbor classifier. The observed results clearly distinguish the Haussmannian class from the neoclassical class, whereas many Flemish Renaissance results are classified as background. According to the authors, the proposed model may be used to initialize a building reconstruction process if all the stages are respectfully applied. Mathias et al. noted that little work had been carried out on architectural style identification.
In the same year (2011), Shalunts, G. et al. [39] examined the task of classifying different architectural elements of a building’s facade. The objective of this research is to distinguish the architectural style of facade windows belonging to Romanesque, Gothic, and Renaissance/Baroque periods. However, since the number of arches may differ in the Romanesque windows, eight intra-class types are also proposed. Since each different window is built with specific geometrical rules, certain gradient directions are introduced. As a result, gradient directions can categorize windows from different periods. Accordingly, the features are extracted with the scale-invariant feature transform (SIFT), whereas the bag-of-words algorithm classifies the final extracted result. The database includes 400 images with different resolutions. Experimental results approach a high classification rate of 95.16%.
Shalunts, G. et al. (2012) [40] discuss the need to not only classify buildings based on their architectural style but also on their structural elements. Accordingly, a classification pipeline is proposed to categorize Gothic and Baroque architectural elements. The scale-invariant feature transform (SIFT) algorithm provides invariance to scale and orientation; the bag of visual words (BoW) and the k-means clustering construct a model which classifies and extracts information on gradient directions. Each shape of the tracery, pediment, and balustrade classes includes specific gradient directions. Simultaneously, a data set of 520 images along with their bounding boxes depicts the necessity for optimal training during the learning phase. To conclude, a 96.67% successful classification rate is obtained on a testing data set of 420 images.
Shalunts, G. et al. (2017) [41] propose a methodology for distinguishing faces in human sculptures. Their study includes three experiments. First, they conduct their experiments by establishing the OpenCV Viola–Jones face detector on their custom data set. However, real-world faces cannot be used properly for the current study, owing to the problem of low accuracy. In the second place, new cascade classifiers are trained to detect the sculpted face based on a data set containing 700 photographs with 1608 faces. Augmentation techniques expanded the initial data set. Finally, the last experiment compares the two classifiers on a test data set, resulting in an F-measure of 0.90 using the custom classifier and in an F-measure of 0.73 using the OpenCV face detector. This article serves as an additional feature called STYLE, in the context of the image-based architectural style classification system.
The contact with the work of Shalunts, G. et al. was instrumental in deciding our research on CH, even though they did not use deep learning algorithms and focused on individual architectural elements. However, their diffusion and success were so influential that they inspired us to experiment in the relevant subject.
In [42], the use of convolutional neural networks is abandoned, as the authors Mercioni, M. A. and Holban, S. (2018) propose data mining techniques to determine the architectural style of an input image. The database consists of 100 images from Timisoara, grouped into five classes: Baroque, eclectic, secession, Moorish, and Byzantine buildings. Content-based image retrieval (CBIR) and local binary pattern (LBP) systems or clustering algorithms aim to classify efficiently architectural buildings. The proposed system is fast and accurate, and its applicability was measured by applying Euclidean and Manhattan distances on the custom data. Moreover, data retrieved with high accuracy tend to share the same texture, shape, and color components that preexist in the mind of culture heritage researchers. However, high performance is achieved when images have the same texture, shape, and color, and the quality or effectiveness of the data set plays a critical role in this system.

3.2. Deep Learning Architectural Style Identification

Llamas, J. et al. (2016) [43] contribute to the digital documentation of cultural heritage by developing convolutional neural networks for the INCEPTION European project. This project aims to preserve and protect cultural heritage assets by establishing modern-day technologies. In particular, a pre-trained convolutional neural network is configured by replacing the final layer of the network. As a result, the new output and classes are included (10 categories of elements with cultural heritage interest). Subsequently, a data set with over 10,000 images from Flickr trains the network. The authors train it with variations in the number of iterations and the learning rate. Consequently, they achieve accuracy that reaches a 92% rate. The authors claim that the results of the proposed method are very promising, as the time needed to classify assets is shorter compared to the manual methods. For future work, they are looking to introduce new categories of elements (arches, altars, frescos, etc.) and also to train other networks for classifying new kinds of categories, e.g., artistic styles and historical periods; they admit that this new task will require more computational power and a bigger data set.
Schmitz, M. and Mayer, H. (2016) [44] propose a method for an automatic semantic facade segmentation and interpretation. The authors depict the advantages of the transfer learning technique. In particular, when a part of a convolutional neural network already exists, large data sets are unessential. A specific part of the introduced method is based on the AlexNet in order to segment and classify elements of a facade. In addition, the facade, the door, the window, and other elements construct the classes. Moreover, an accurate data set, based on the eTRIM images for training and validation, trains the proposed architecture. Data augmentation techniques enlarge the data set by rescaling the images. During the validation process, a sixfold cross-validation was successfully used. The paper concludes with the F1 metric that describes the convincing results by achieving an 82% rate in this four-class (facade, door, window, and other) segmentation problem.
Pesto, C. (2017) [45] indicates the use of computer vision to automatically understand architectural styles and their wide range of applications by using real-world real-estate listing photography, claiming that it is strong enough to apply to real-life applications. The author also claims that, until then (2017), minimal research has been conducted on this specific area, where convolutional neural networks classify and localize U.S. houses. In particular, three different algorithms including an end-to-end trained model, ResNet-18, and ResNet-34 simplify the aforementioned procedures. The data set of 2500 images from a real estate photography list is personally examined by the author (the images were all collected manually from Zillow.com); it contains at- or near-ground houses, the same houses from different angles or illuminations, and the front facades of the houses. Each one of the five classes is balanced with 500 images of the U.S. houses. The paper indicates that input sizes of 256 × 256 are inadequate for this task. For that reason, several image size experiments finalize the superiority of ResNet-34 with a 512 × 512 dimension. Altogether, a total loss of 0.51 and 0.56 is acquired after a successful evaluation with the test set. The author was able to achieve a correct classification rate of 79.8%, and a 0.710 intersection-over-union localization score on the test set, using ResNet-34 as a feature extractor.
Multiple techniques and optimizations for convolutional neural networks are studied in [46]. In particular, the authors Guo, K. and Li, N. (2017) describe the effects of changes in the architecture of a CNN when trained by a data set with different architectural styles from Wikipedia. Two different data sets describe 10 and 25 different styles, respectively. The number of each category of pictures ranges from 60 to 300; in short, a total of about 5000 architectural style pictures was used as a data set. In this paper, multiple changes are applied in traditional deep learning models including the LeNet-5 framework. Specifically, the classification rate varies depending on dropout implementations and different activation functions, including the sigmoid, the rectified linear unit, tanh, etc., as well as random sampling and drop-connect. According to the authors, the paper concludes that the deeper the network is, the better the training results that emerge.
Laupheimer, D. and Haala, N. (2018) [47] aim to contribute to exporting semantic information from 3D urban models. Accordingly, an end-to-end convolutional network is proposed to classify facades by resolving occlusions, illumination, angles, and orientation. The data set includes labeled data with images from Google Street View to train the proposed model by using various CNNs (VGG16, VGG19 (SIMONYAN and ZISSERMAN 2014), Resnet50 (HE et al. 2016), InceptionV3 (SZEGEDY et al. 2016), self-designed networks). However, the authors not only aim to classify images but also want to understand which features are important for the final decision. Consequently, the class activation maps (CAMs) are introduced to visualize the classification criteria in each image. The considered classes include commercial, hybrid, residential, special-use, and under-construction facades of buildings. The research work reaches an overall accuracy of approximately 64%. The residential class undoubtedly has the best accuracy of 98.57, which is encouraging because most of the buildings fall into this category. This conclusion reinforces our decision in this work to focus on house buildings. Moreover, the CAM as well as the manual methods of human activity choose the same criteria to classify.
Li, Y. et al. (2018) [48] study the availability of methods that estimate a building’s age. With respect to current databases, a new entry containing the age of a building may contribute further to greater cultural heritage awareness, as, according to the authors, building age estimation from images has not been studied sufficiently in the research community. This paper proposes the use of convolutional neural networks such as AlexNet, ResNet, and DenseNet to extract features from the required data set from Google Street View images from the North and West Metropolitan Region (NWMR) in Victoria, Australia. Finally, the support vector regression extracts the building’s age from the input data. Consequently, among the different CNN models, the DenseNet develops the best accuracy for the specific purpose. According to the authors, the complex appearances, materials, components, and styles of buildings allow the deep learning to acquire interesting figures.
Zou, Z et al. (2019) [49] aim to contribute to the protection and the maintenance of ancient buildings by applying deep learning algorithms. Additionally, they propose the use of convolutional neural networks with a manually collected data set and their tuning for inspecting historical buildings. The procedure takes place in the Forbidden City to detect the missing components and consequently abandons the respective human activity. Specifically, the Faster R-CNN architecture is trained and configured for detecting the aforementioned objects in 2D images. This methodology can be applied with high accuracy at the test data, especially when the distance from the camera is characterized as close or median. To conclude, future work may produce a fully automated inspection system based on the principles of machine learning. This research paper gives a strong impetus to the use of deep learning in monument pathology detection methods and proposed restoration solutions.
Dautov, E. and Astafeva, N. (2021) [50] state that the recognition of architectural styles has not been thoroughly investigated in the modern literature due to their similarity. They introduce the 15 most famous architectural styles including Art Nouveau, Bauhaus, Gothic, Greek revival architecture, Palladian, etc. With respect to the above-mentioned styles, 100,000 images were collected and processed with augmentation techniques to train the neural network. In the second place, the Tensorflow and the Keras libraries established a suitable convolutional neural network by utilizing multiple convolutional and subsampling layers to solve the specific classification problem. Consequently, the accuracy of the proposed classifier was 0.7652 (a prediction rate similar to our research results) after 50 training epochs. What is worth mentioning is that according to the authors, a higher accuracy is not conceivable, due to the configuration flaws of the proposed algorithm that is capable of providing acceptable, but not very high, validation accuracy.
Finally, in a similar work to our research, Ji, S. Y. and Jun, H. J (2020) [51] introduce two deep learning algorithms to classify buildings and detect objects in East Asian buildings. Specifically, a region-based convolutional network (R-CNN) classifies buildings by country (classification of type) and the you-only-look-once algorithm detects structural elements (classification and location of structural members). Two different data sets, including 3872 images with buildings belonging to Japan, Korea, and China and 16,478 images of Gong-pos and columns in Korean architecture, respectively, support the optimal training of the algorithms. Moreover, the data set with structural members requires extensive grouping and supervised labeling processes. Therefore, experimental results depict an 85.4% probability of successful building classification. Similarly, the training accuracy of the convolutional neural network is 99.6%, whereas the test accuracy is 73.04% (a prediction rate very close to the results of our study). In conclusion, the paper points out that different deep learning algorithms are suitable for classifying or detecting features in traditional architectural styles, but according to their different concepts, a fair performance comparison is difficult. Additionally, the paper concludes that a DL model calculates the output of an input but does not explain why it produces such a result. Moreover, YOLO has a faster processing speed than R-CNN and can detect major objects in videos and images in real time, but it has a limited ability to detect objects in images captured from various angles or less exposed images with blind spots, a fact that aligns with our own results.
In summary, in terms of the relevant literature, the applications of deep learning techniques of CH buildings have not been implemented as much as they should be [45,50,52], especially using the YOLO algorithm. For this reason, in this paper we investigate the transfer of the aforementioned experience to the classification and digital management of CH building stock and the urban environment by applying the YOLO model.

4. Methodology

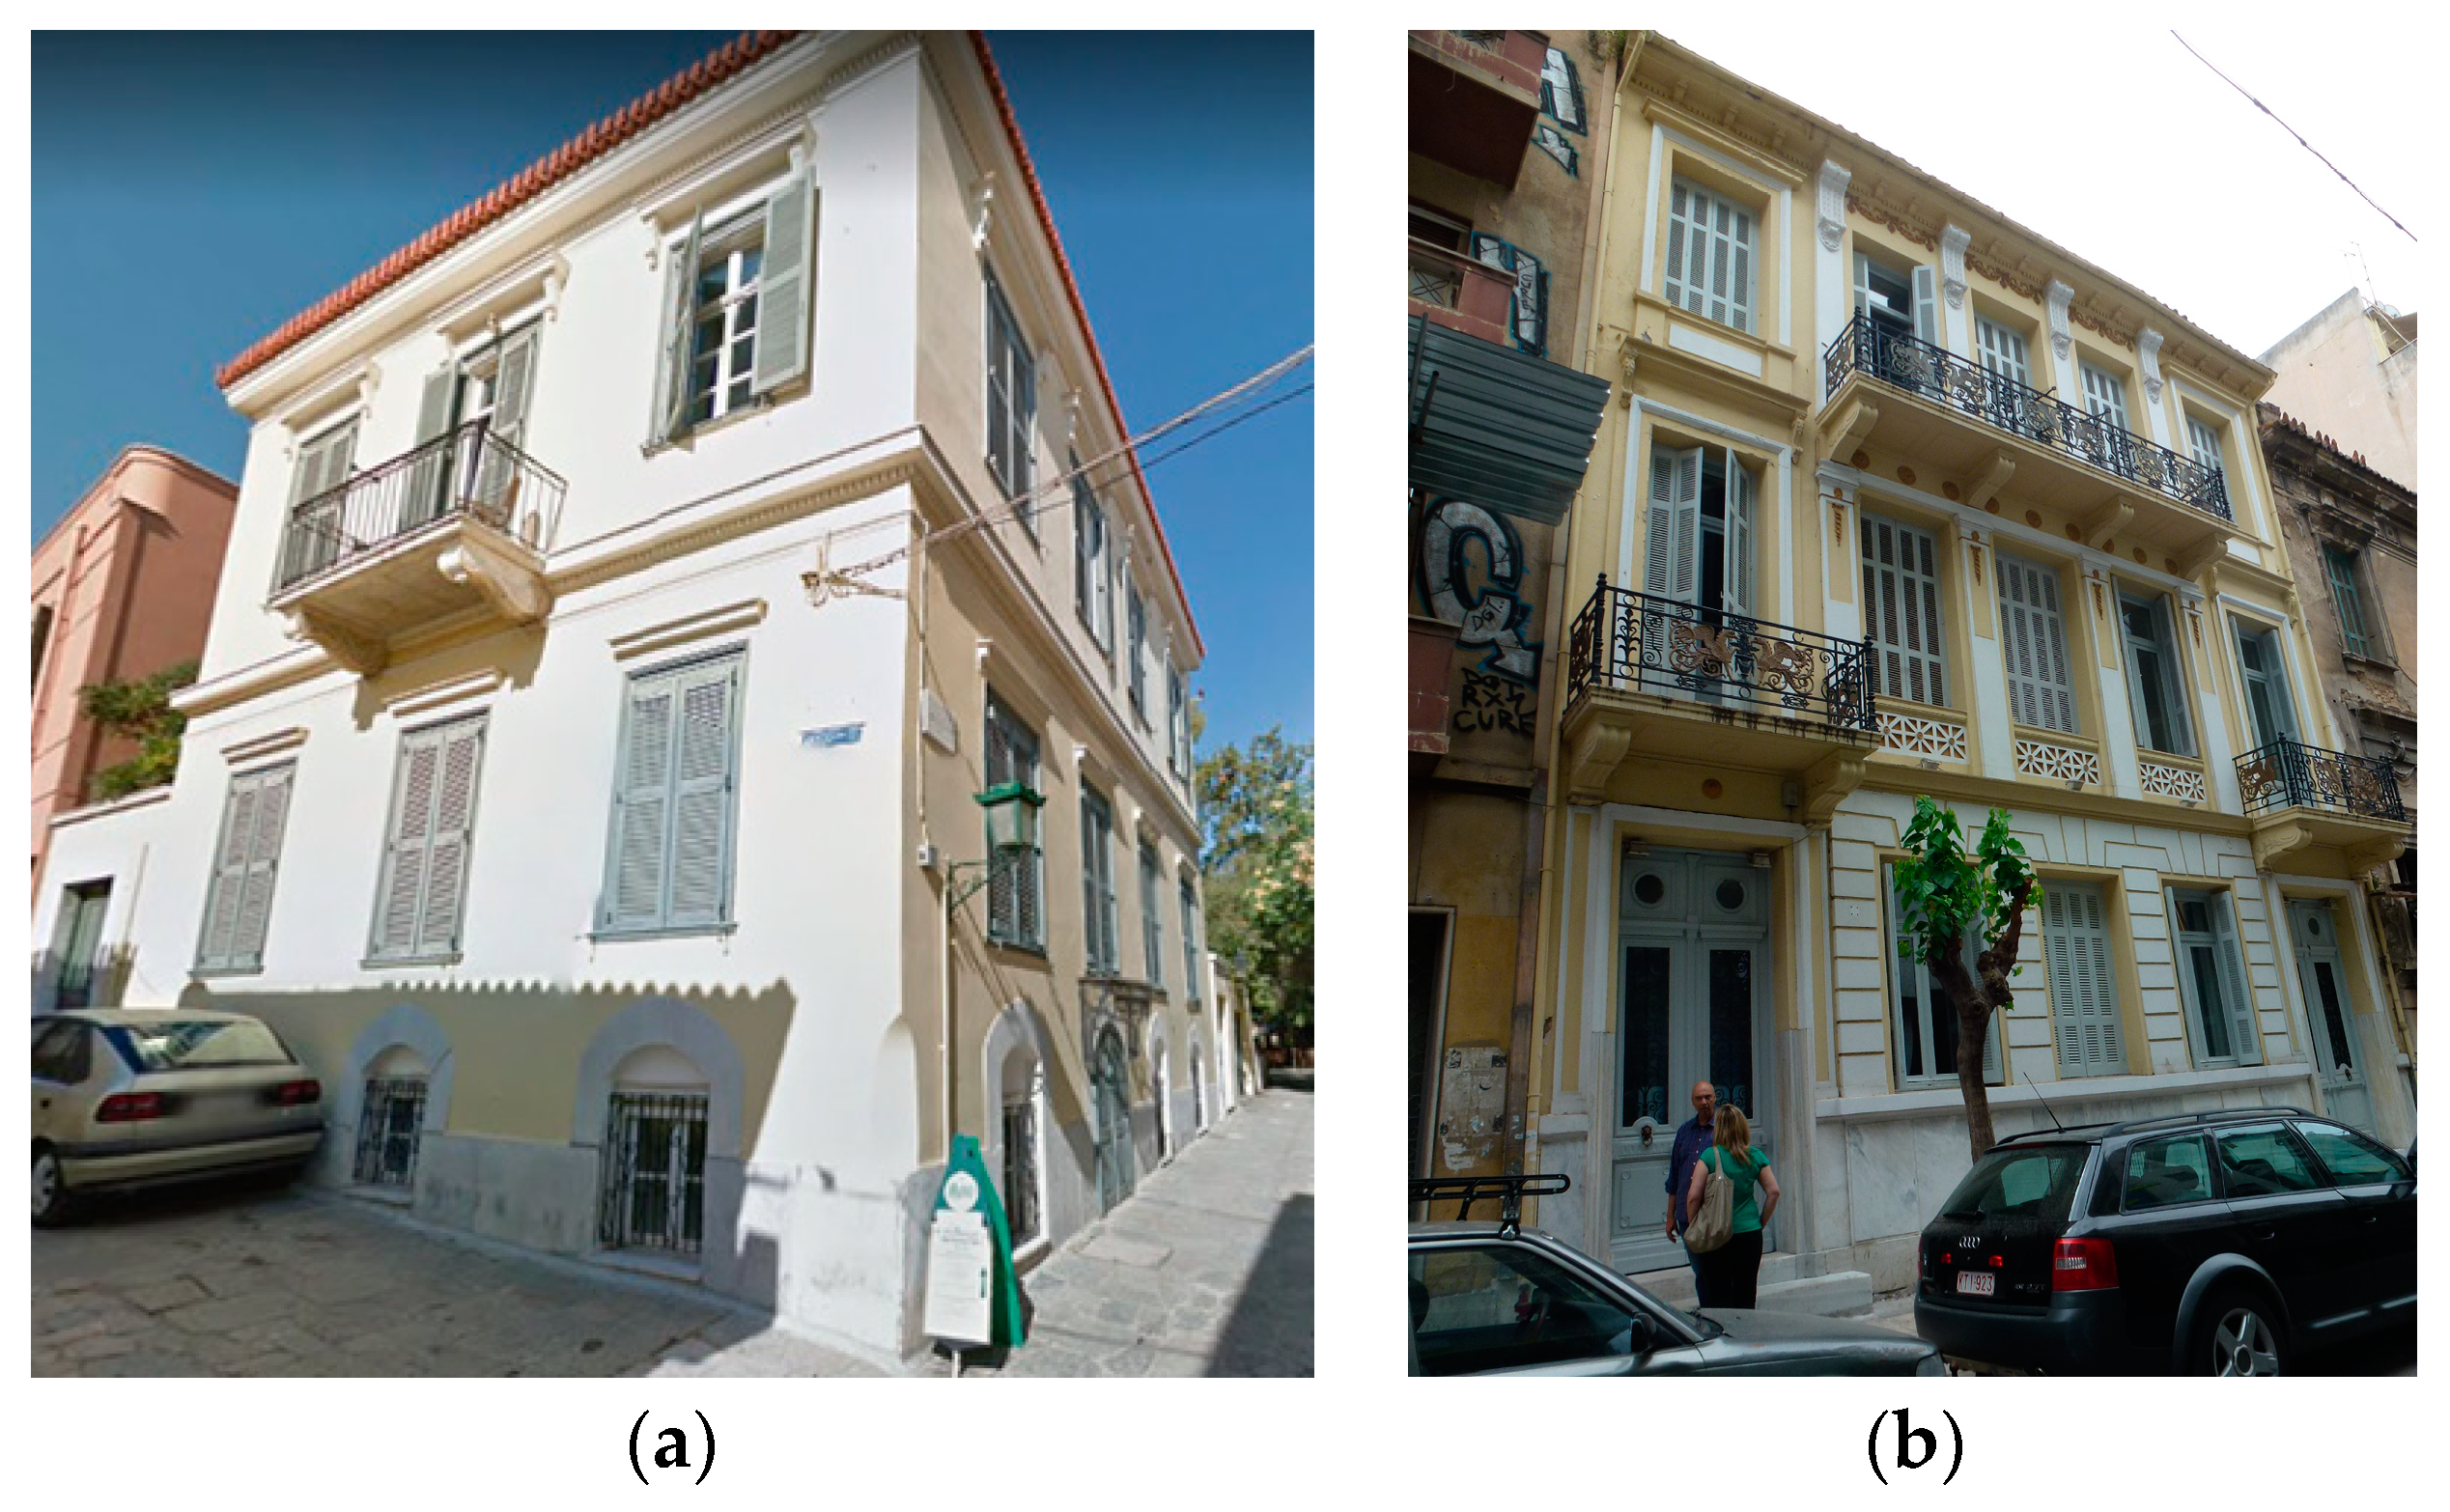
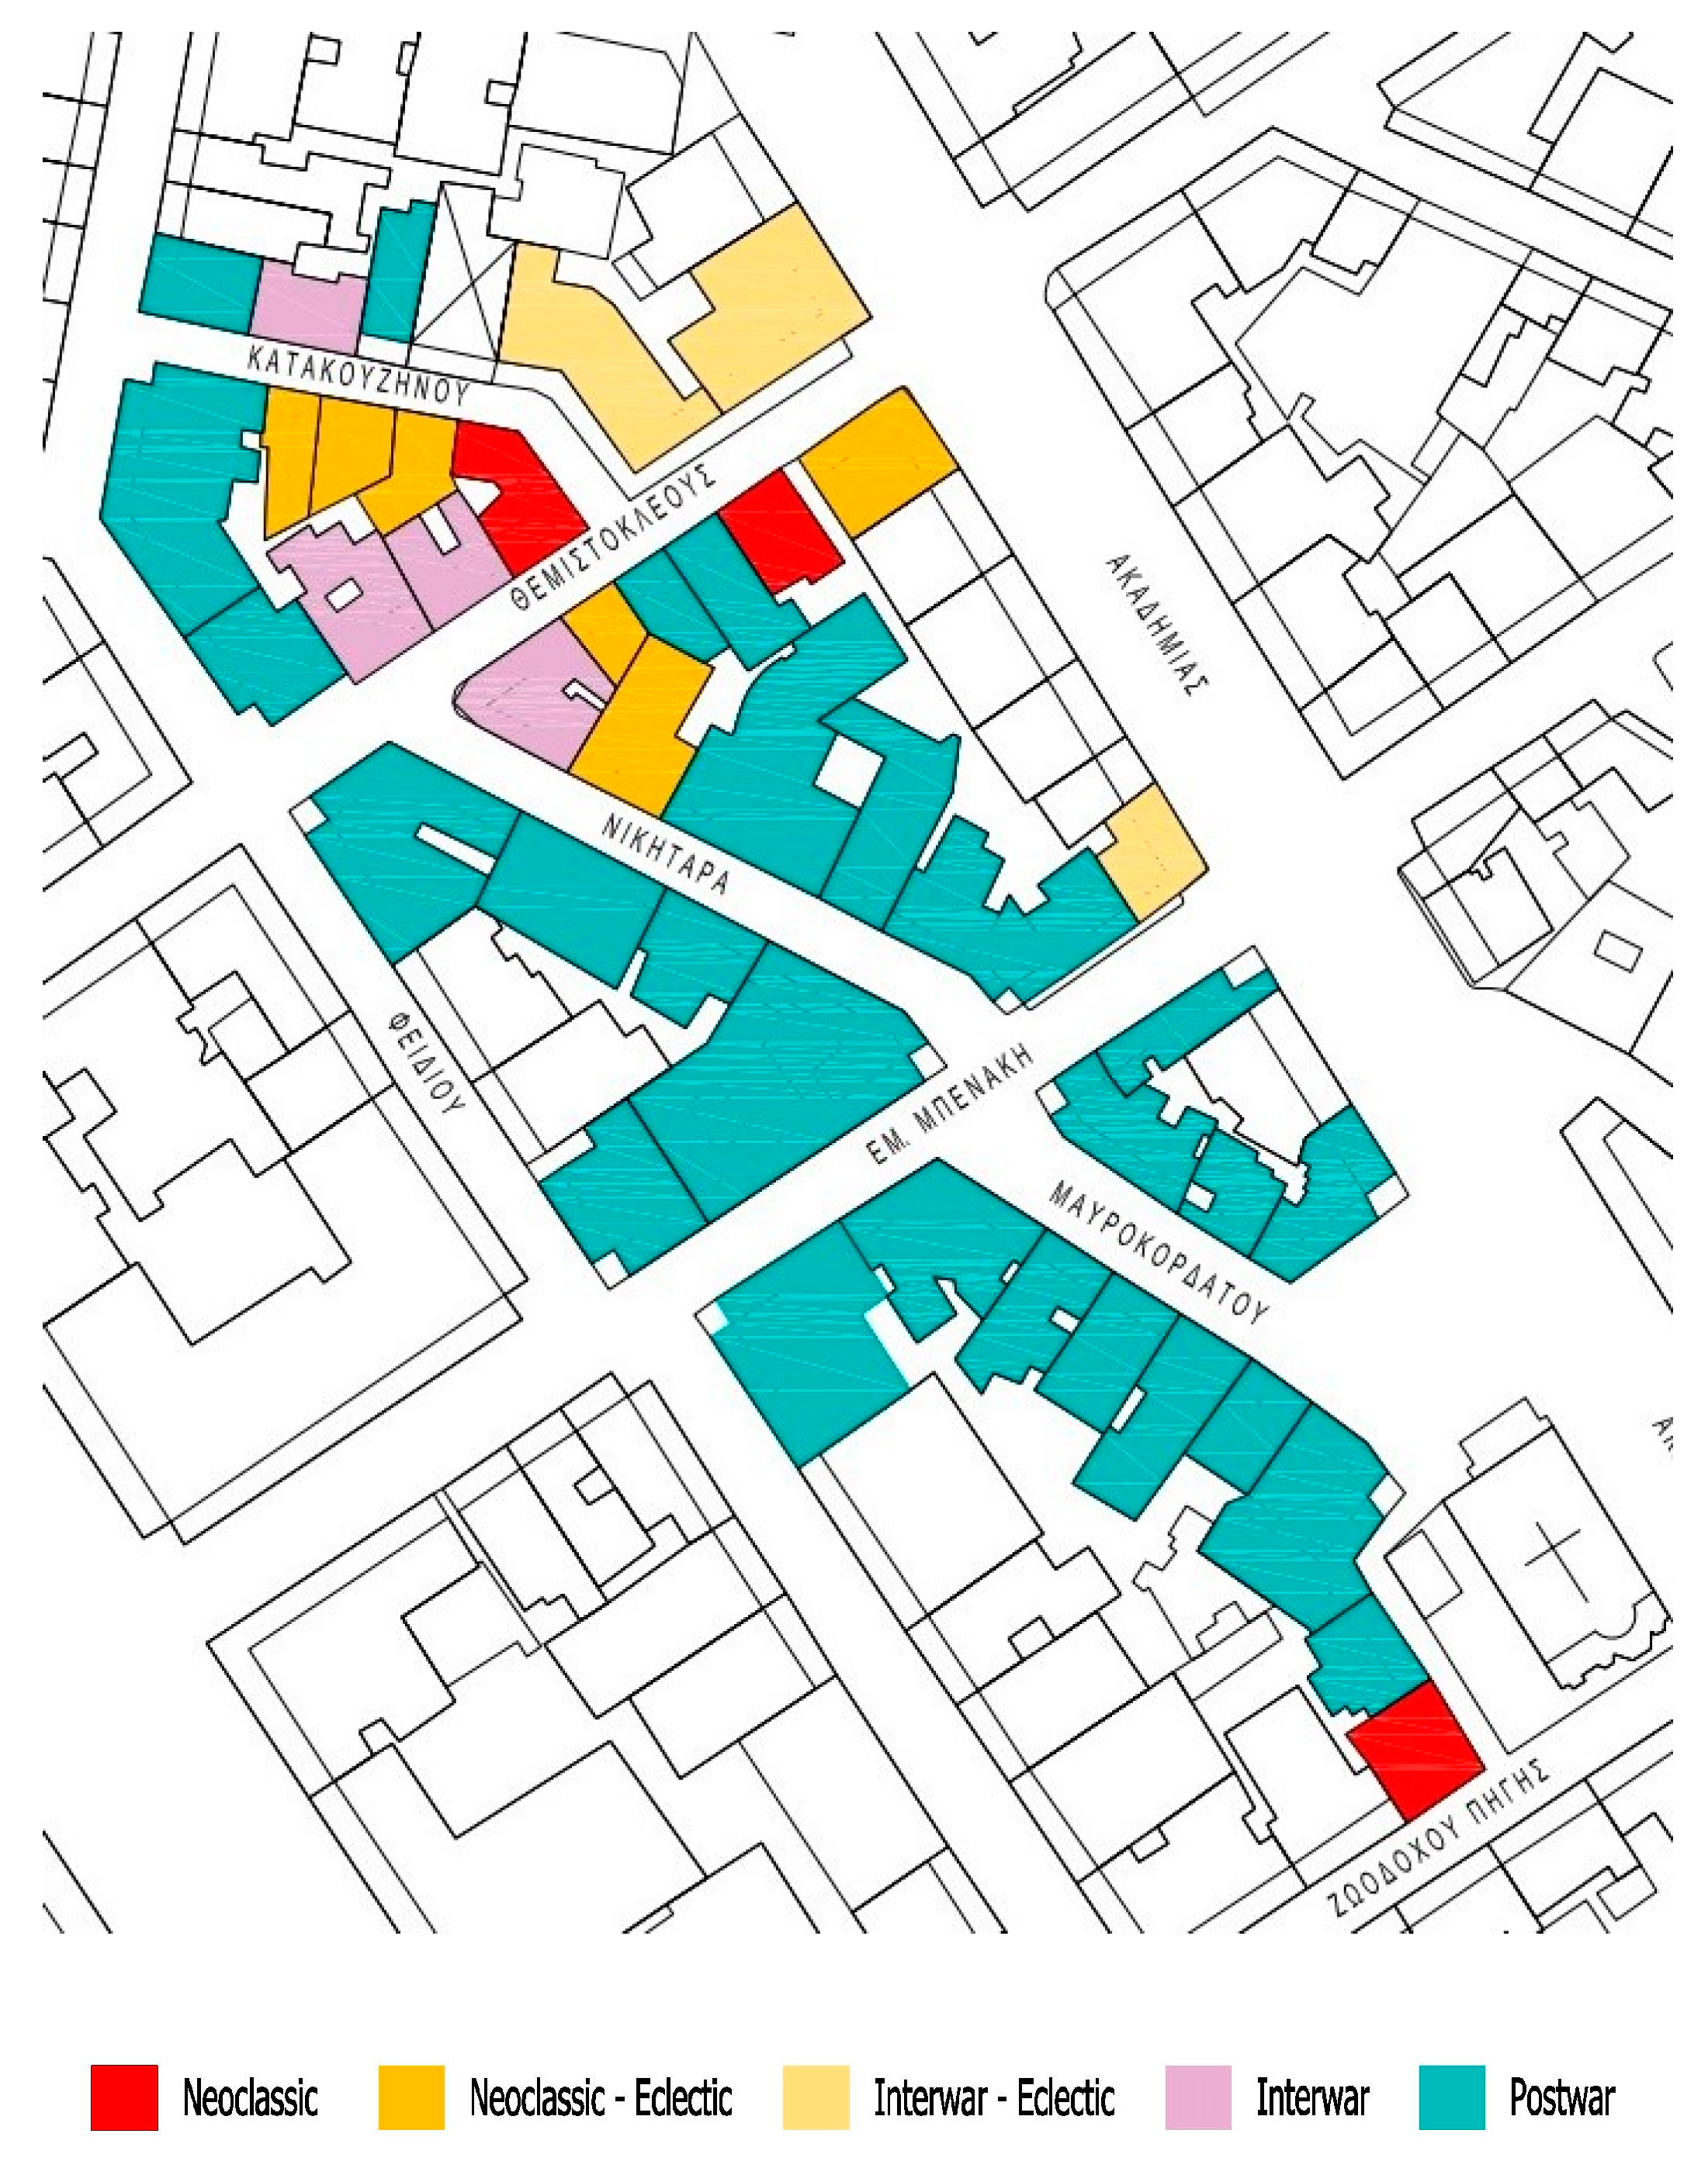
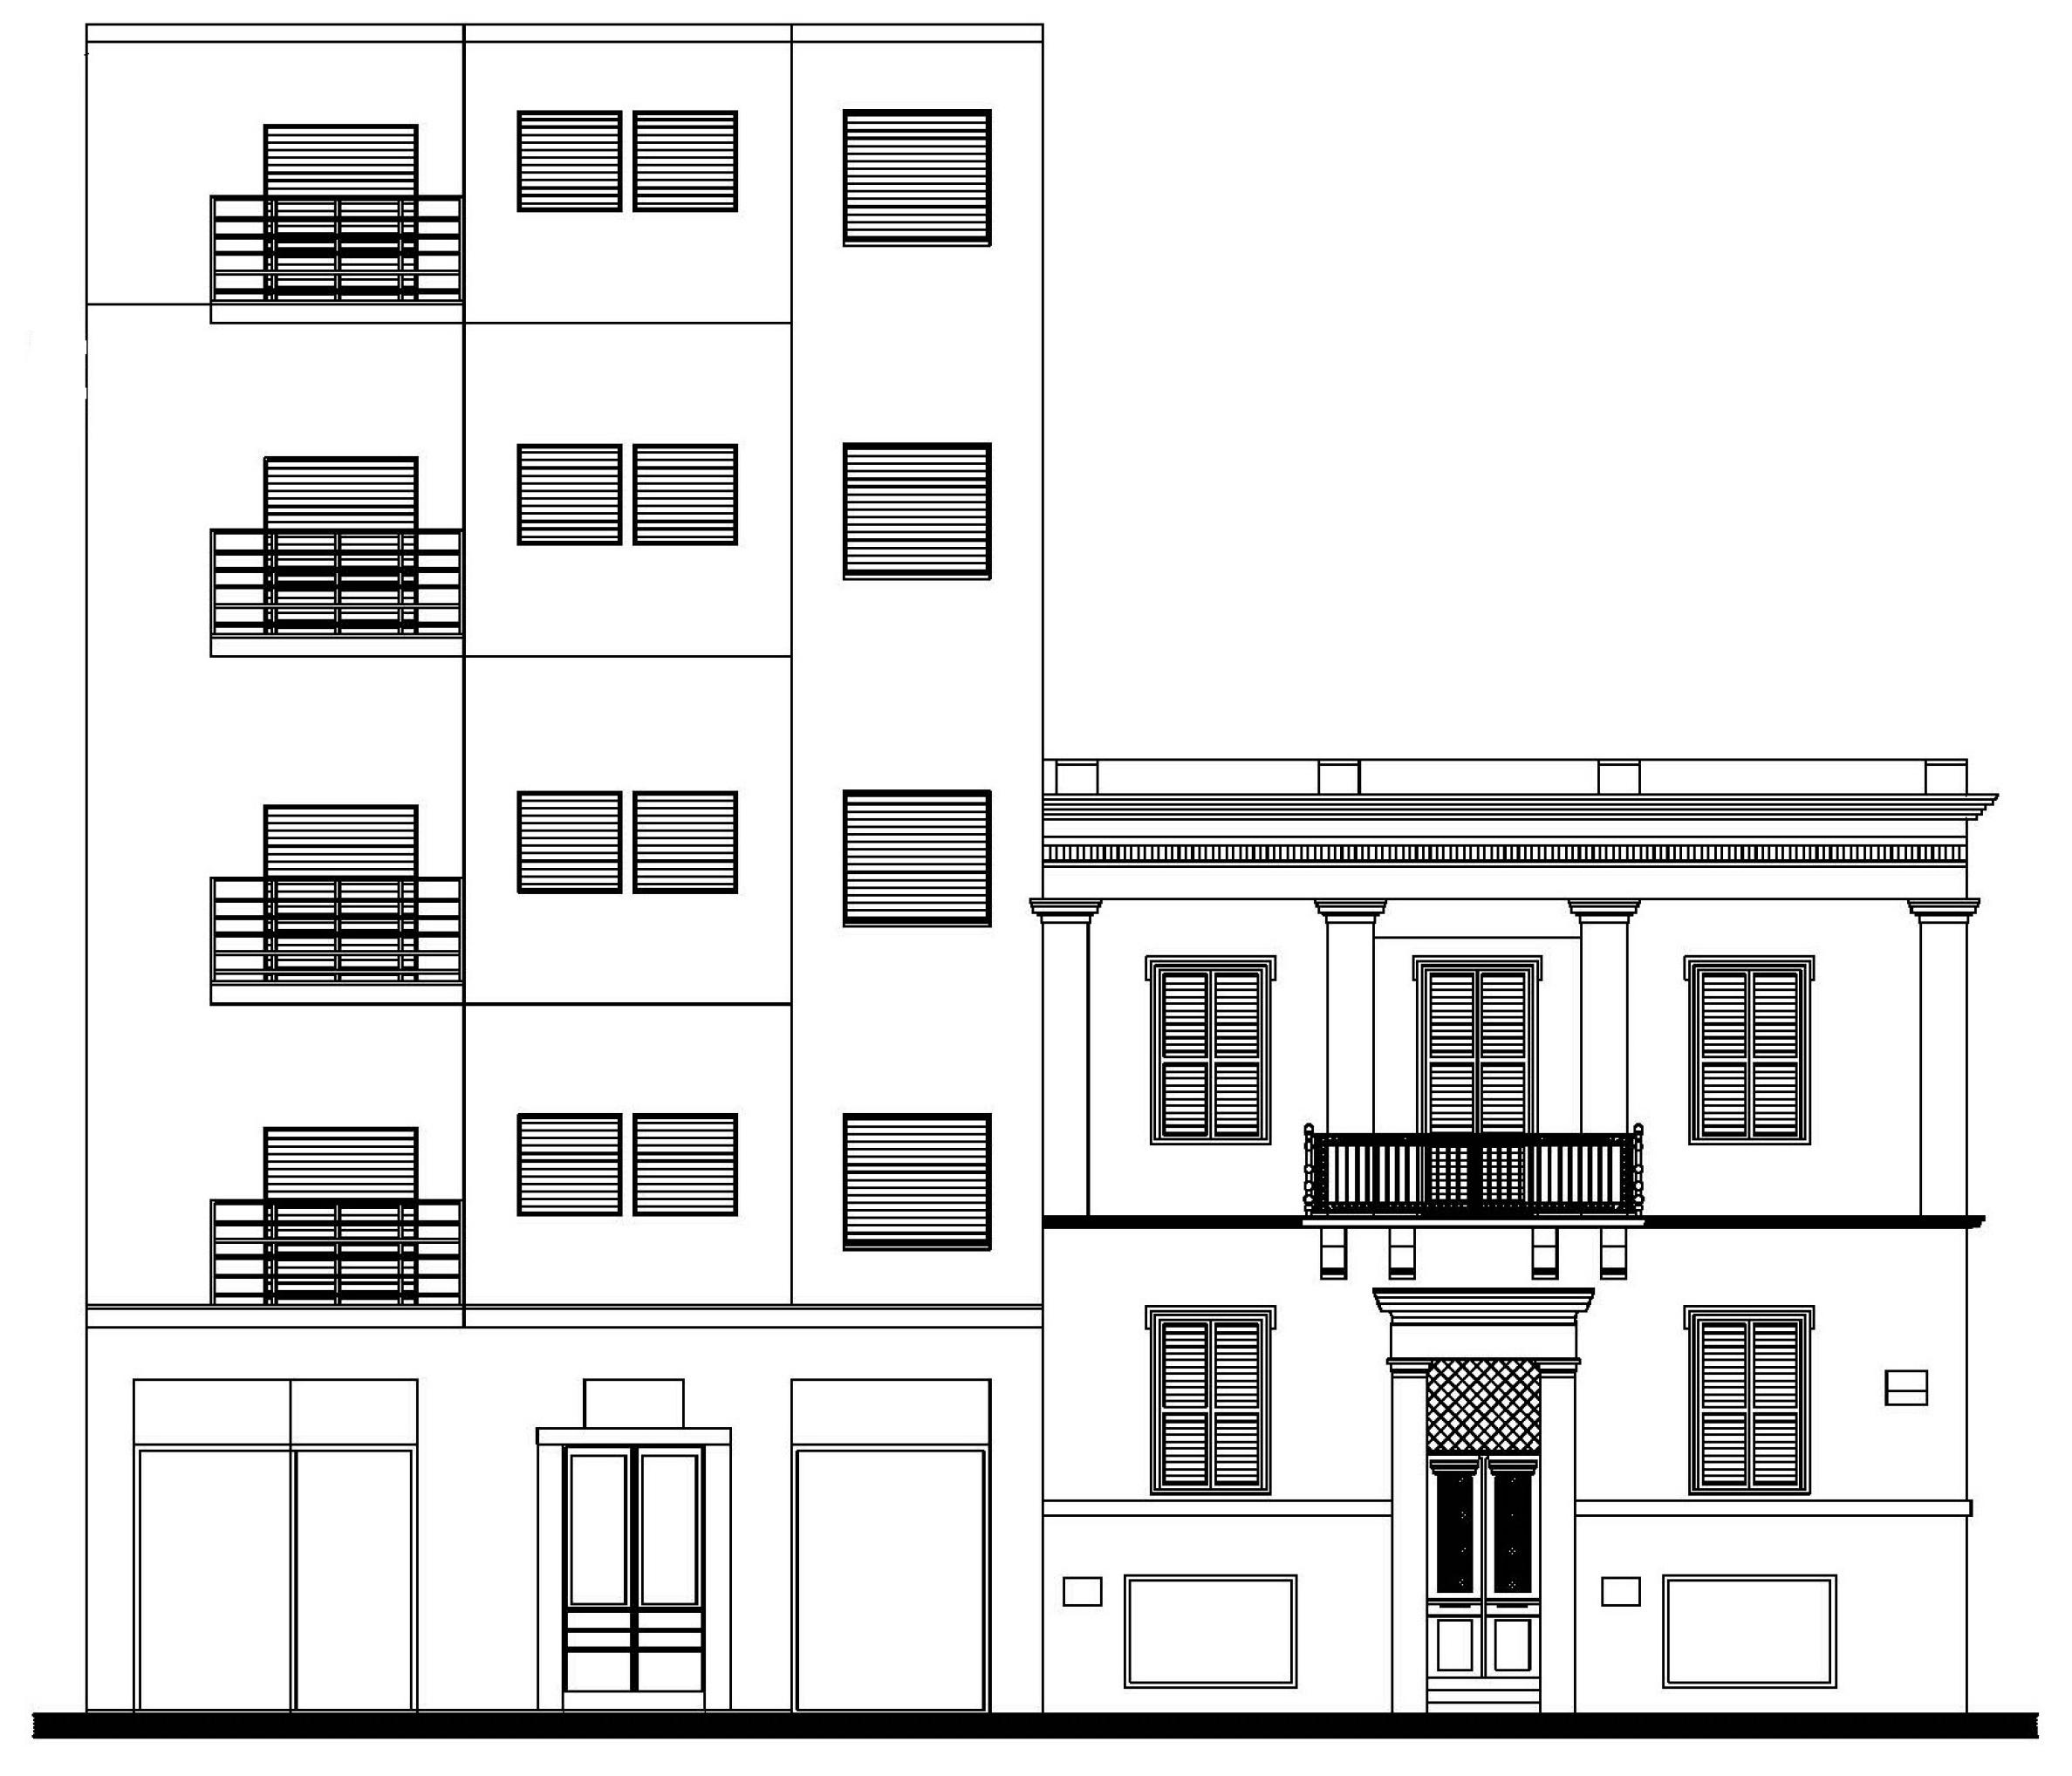
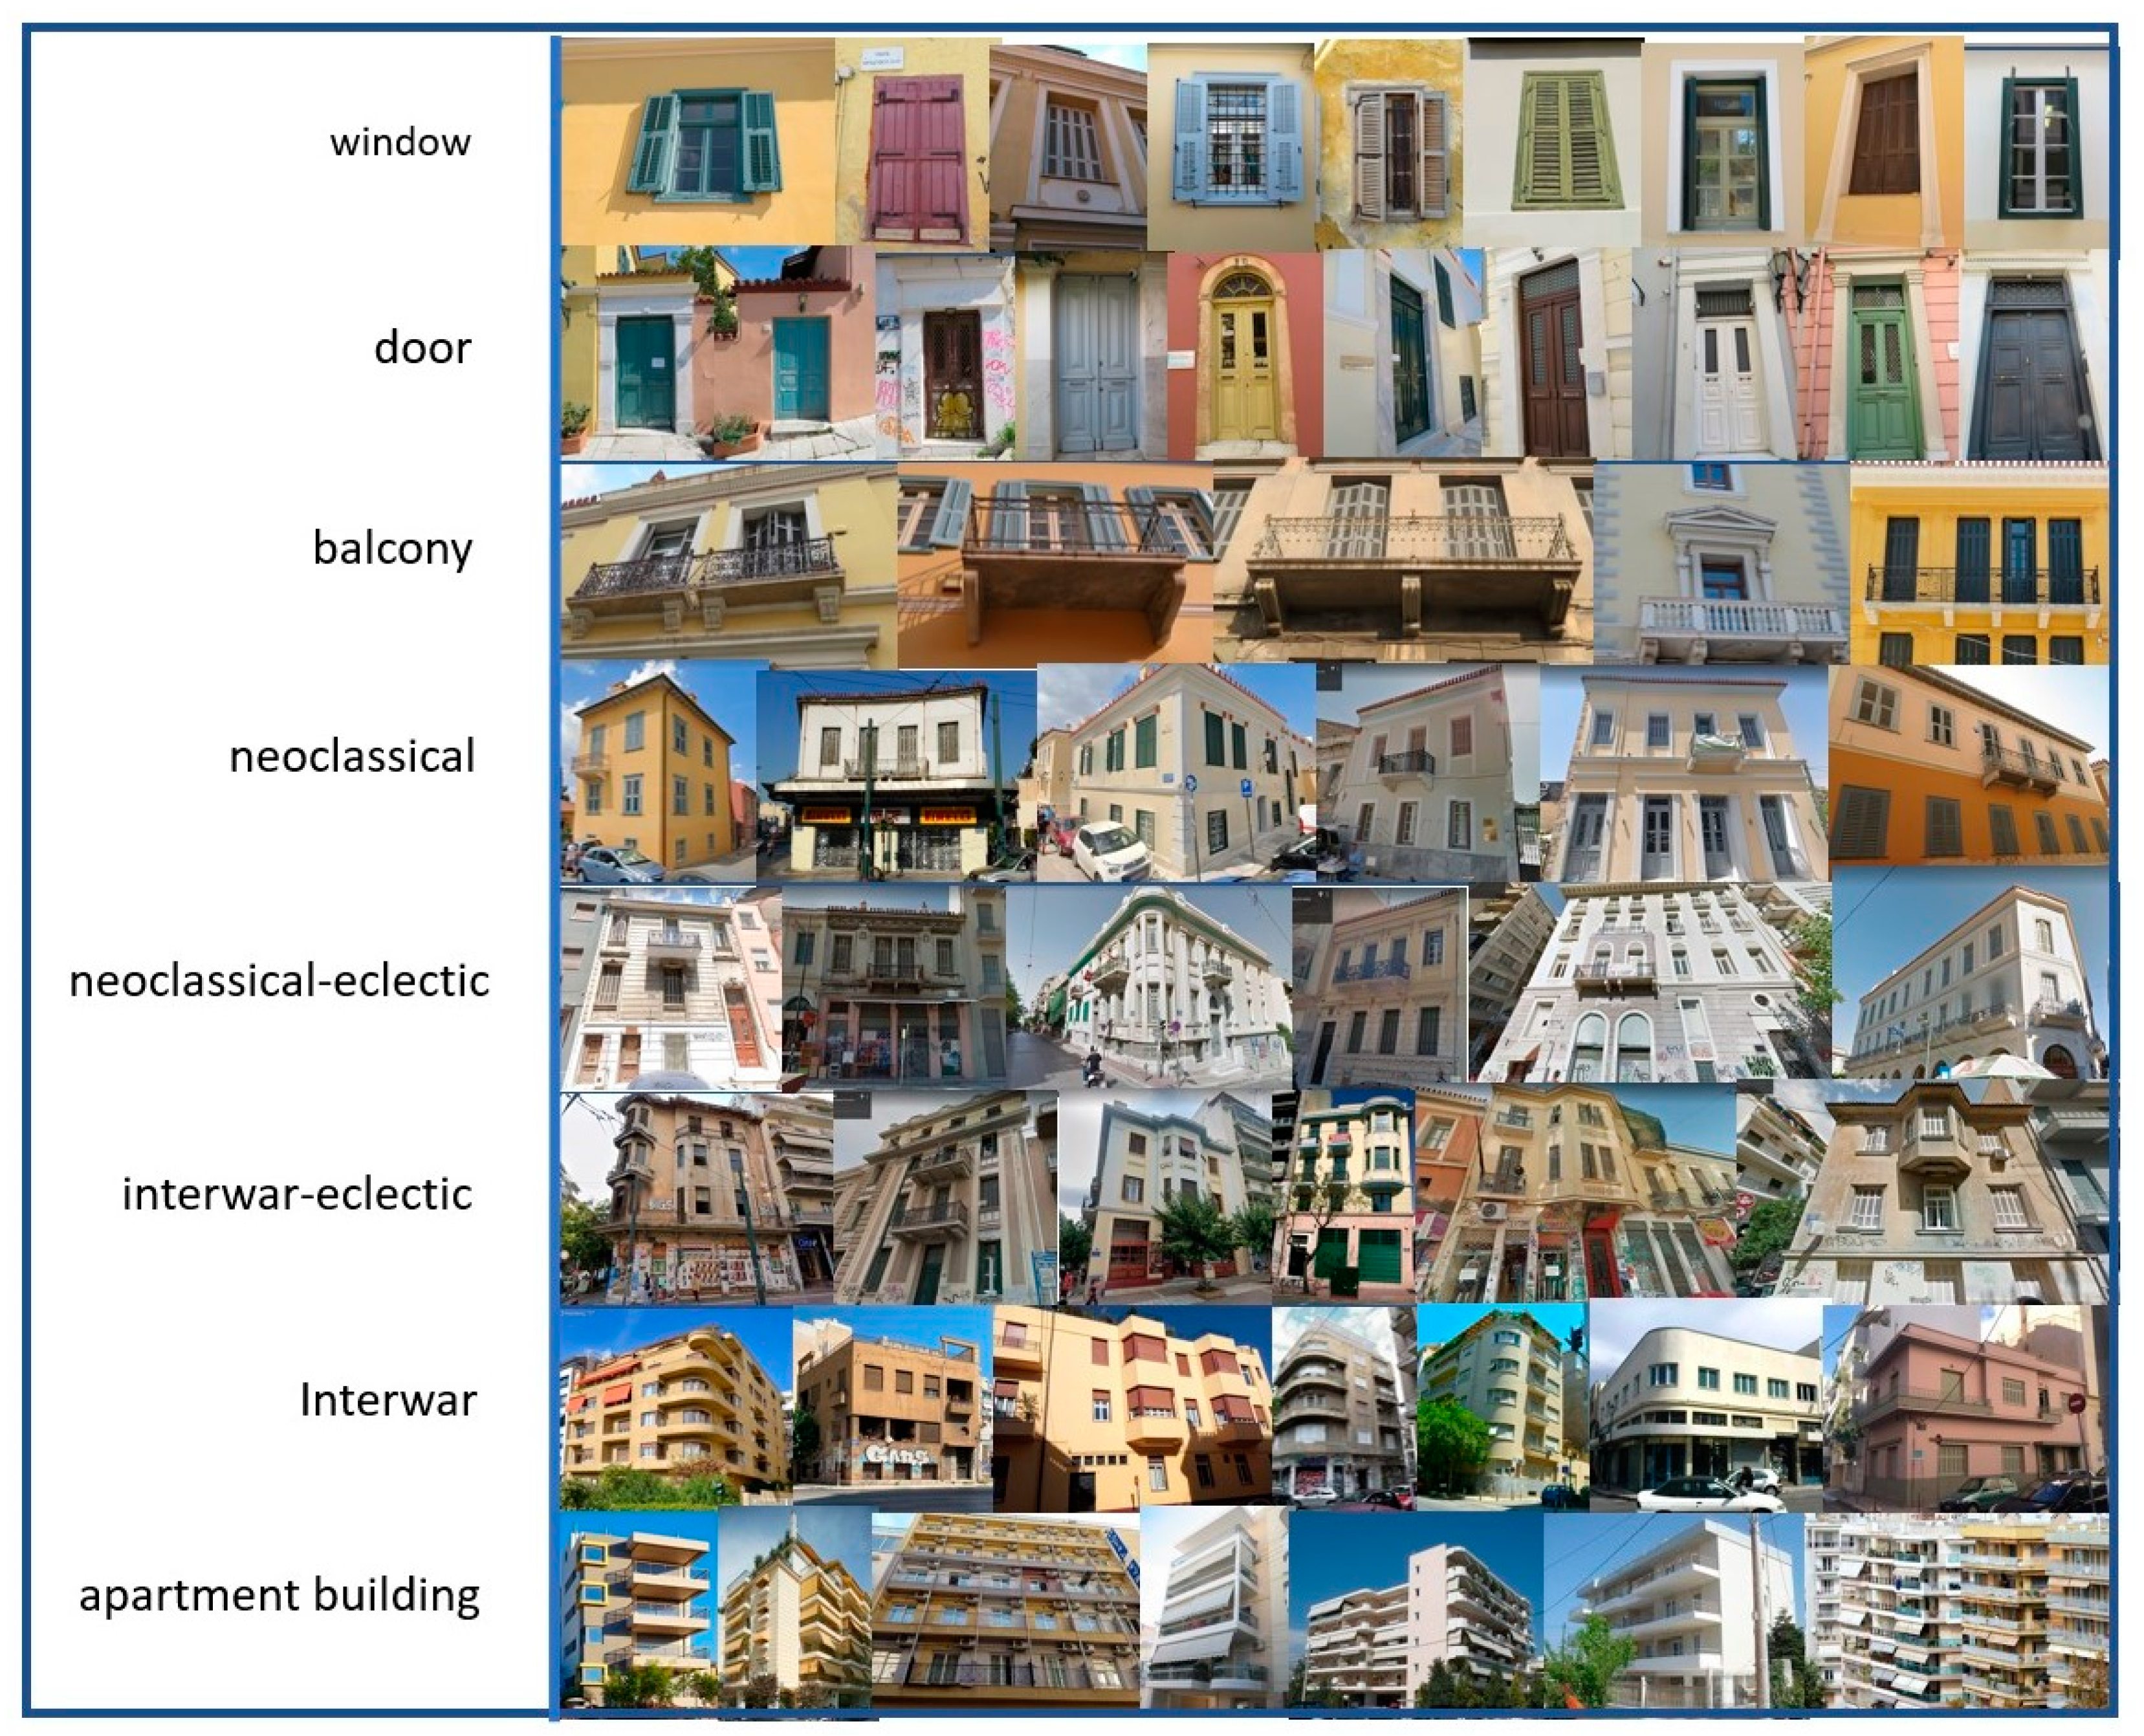
4.1. The Architectural Styles of Athenian Houses (after 1834)
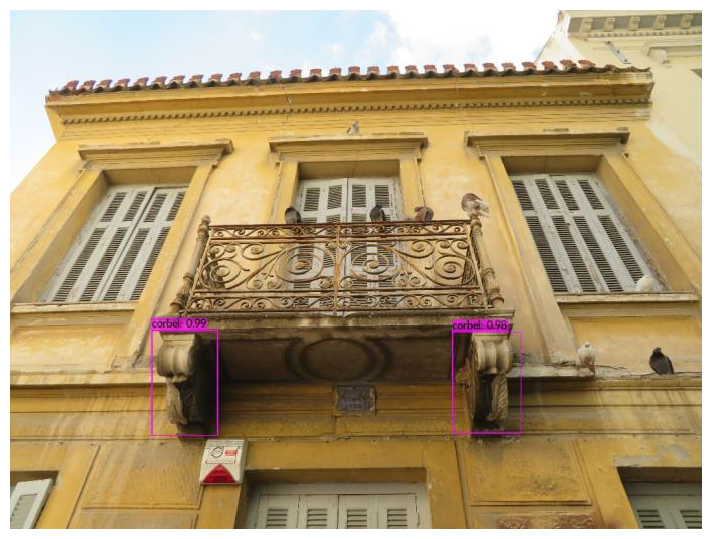
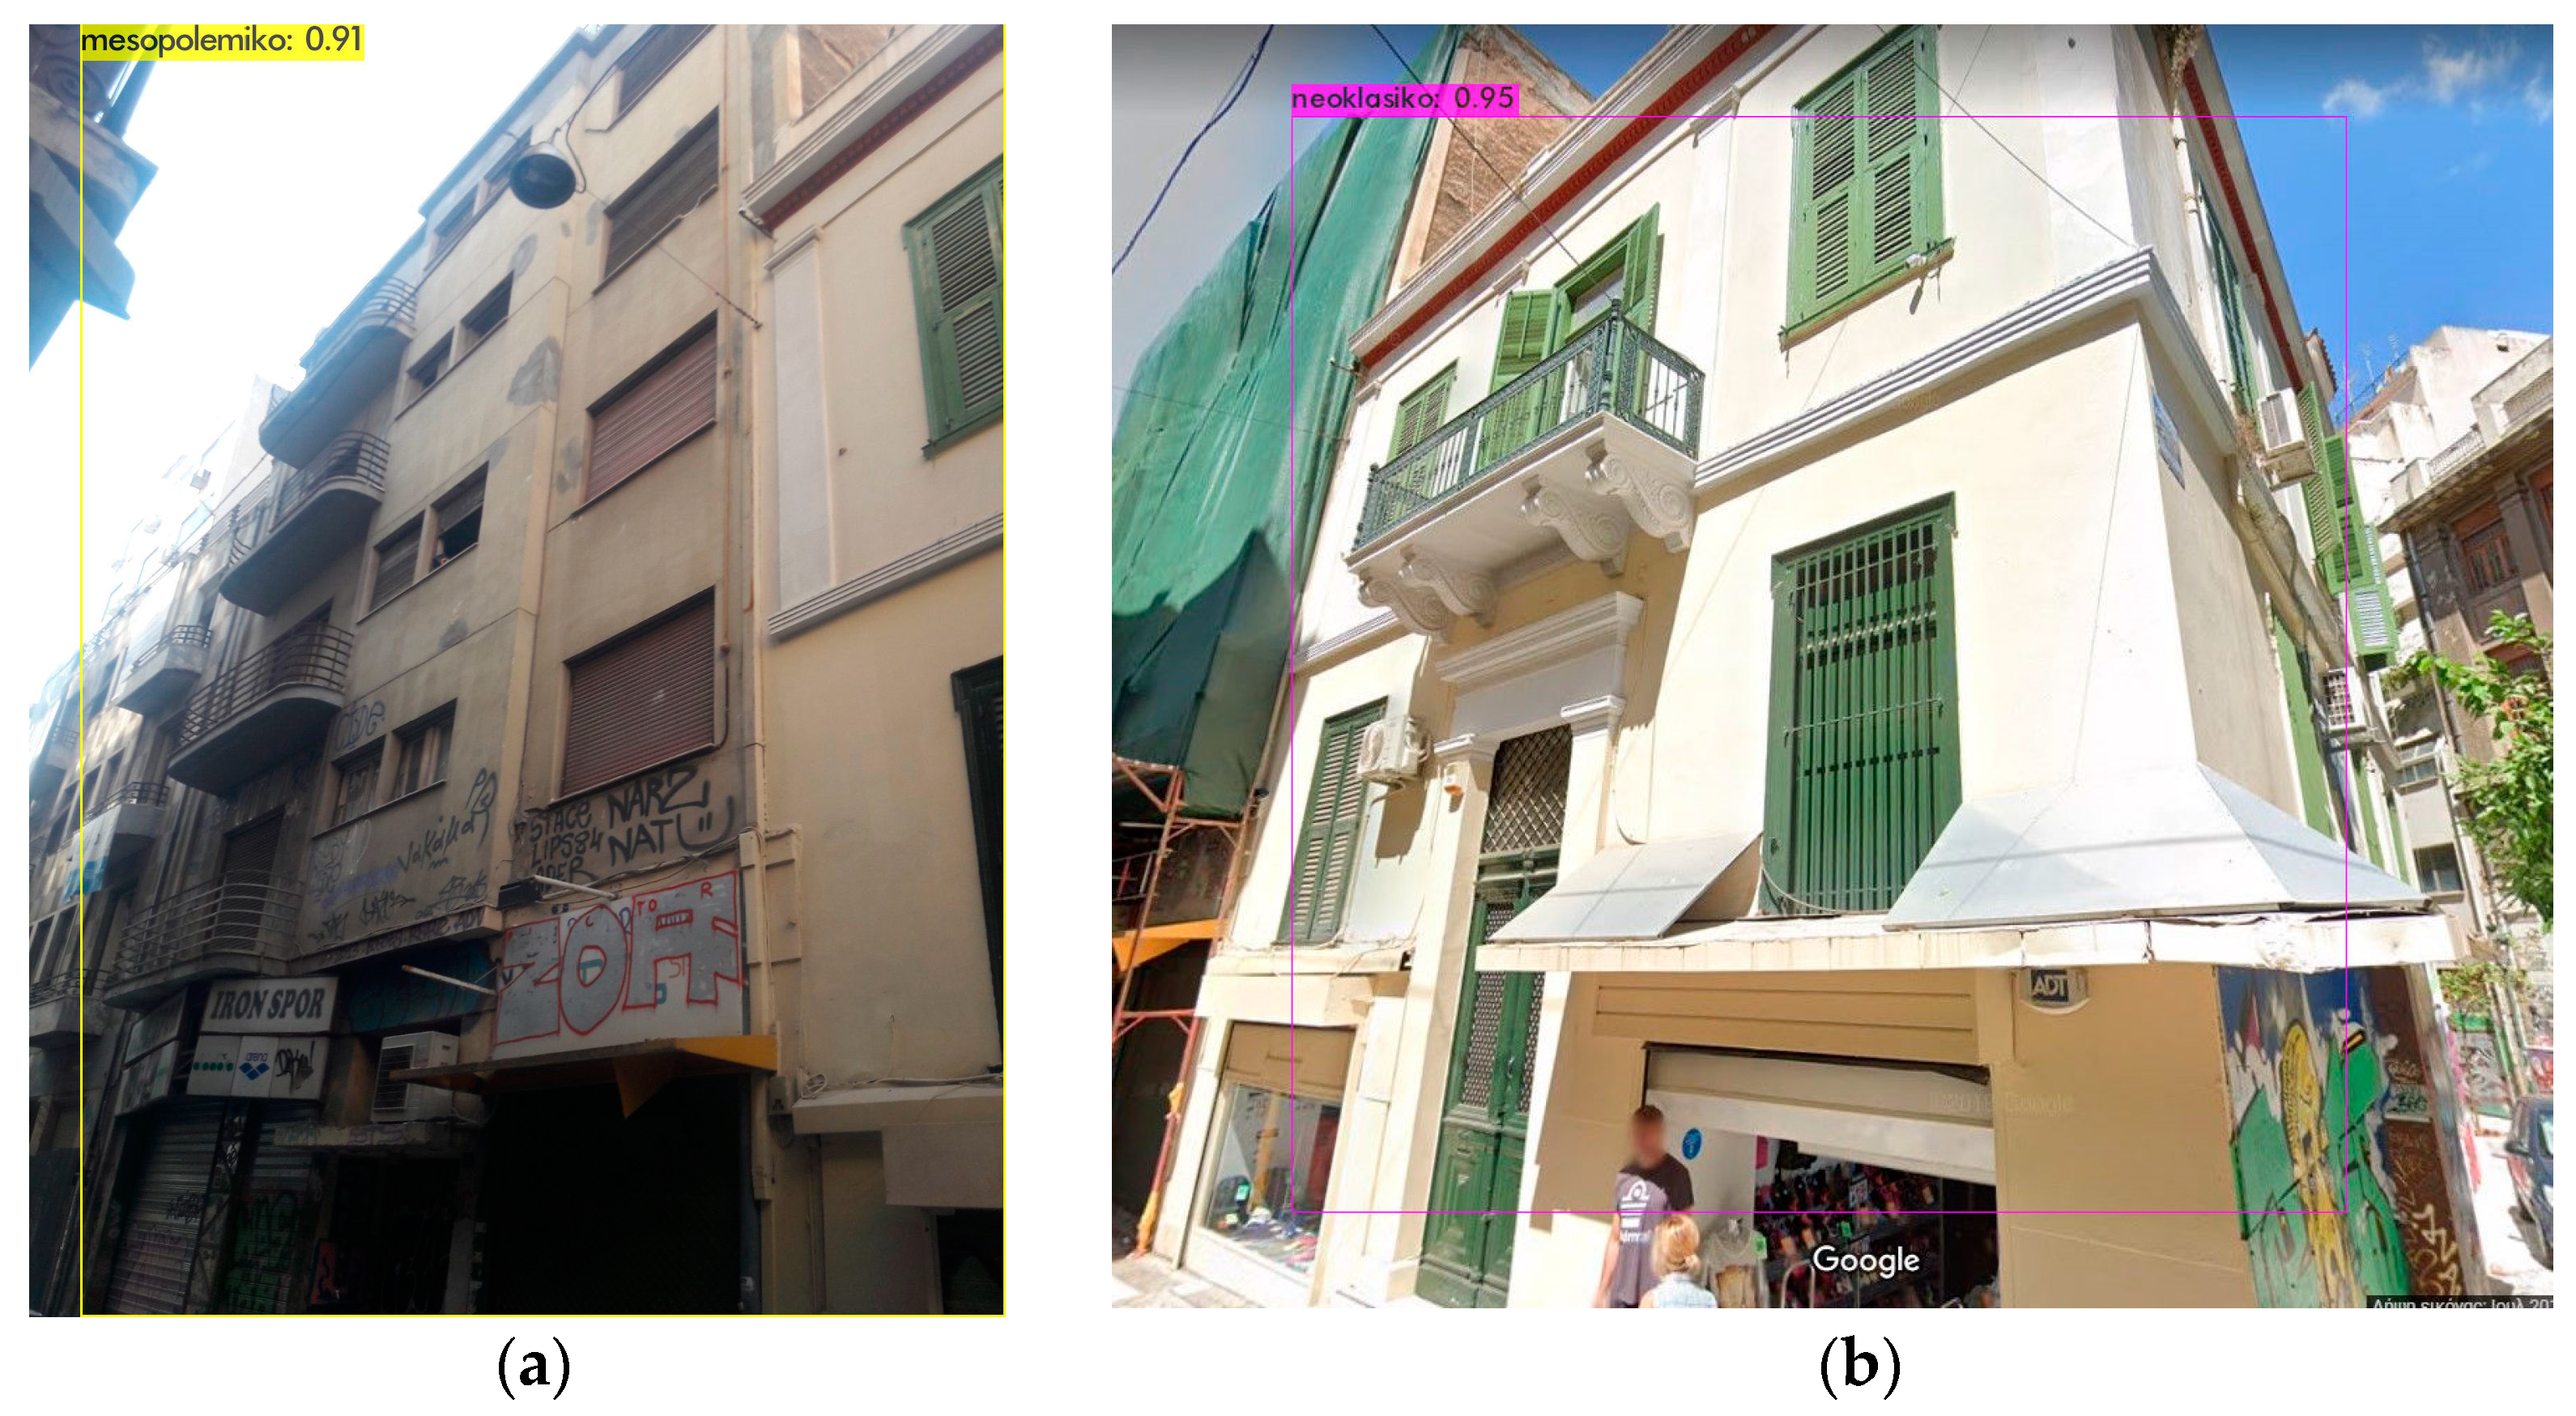
The establishment of the Greek state in 1830 led to increased investment in infrastructure and public buildings. After 1834, Athens experienced a period of rapid modernization and urbanization so that the city could in the following years meet the needs of the administrative and commercial center it was to become, as, before it was chosen as the capital, it had been a village of 4000 inhabitants [53]. In addition to public buildings, Athens subsequently saw the construction of a number of private residences.
The architectural styles of house buildings in Athens can be divided into the following categories:
  • Neoclassical architecture:
    This style, which emerged in Europe in the 18th century, is characterized by plasticity, harmony in volumes, and elaborate decoration. It is often associated with the classical Greek and Roman styles. The capital of the early 19th century adopted this style as a reference to its ancient past. One of the key features of neoclassical architecture is its use of classical motifs and elements so as to create a sense of order and grandeur [54]. The characteristics of the Athenian neoclassical style were symmetrical and balanced design, with a focus on clean lines and geometric shapes; decoration with columns and pilasters, pediments, and friezes; balconies with corbels; railings with elaborate designs; etc. [23]. In the first period, which dates to the reign of Otto, many Bavarian engineers, craftsmen, and German architects arrived in the country, and their works influenced the Greek engineers and craftsmen. Until the late 19th century, the architects Stamatis Kleanthis, Panagis Kalkos, Friedrich Wilhelm von Gartner, the Hansen brothers, and Lysandros Kavtatzoglou were active, while in the late 19th and early 20th centuries, Ernst Ziller was responsible for the construction of hundreds of public and private buildings [55].
  • Eclecticism:
    This is a decorative and ornamental style that emerged in Athens in the late 19th and early 20th centuries (influenced by Art Nouveau, Viennese secession, the École des Beaux-Arts, etc.). It refers to the use of a variety of different styles and elements from different time periods and places in the design of a building or structure. This approach allows architects to create designs that incorporate elements from various historical styles, such as classicism, Baroque, etc. It is characterized by the excessive use of decorative elements, the use of organic and floral motifs, curved lines, and natural forms, as well as the use of modern materials such as steel and glass [23]. The main exponents of Greek eclecticism were Aristotle Zachos, who tried to combine eclecticism with German modernism, as well as Byzantine or neo-Byzantine elements; Vasilios Kouremenos, who used elements of the Parisian Beaux-Arts; Emmanouil Lazaridis; Vasileios Tsagris; and Sοtirios Mayasis, who tried to express Art Nouveau in an eclectic way [56].
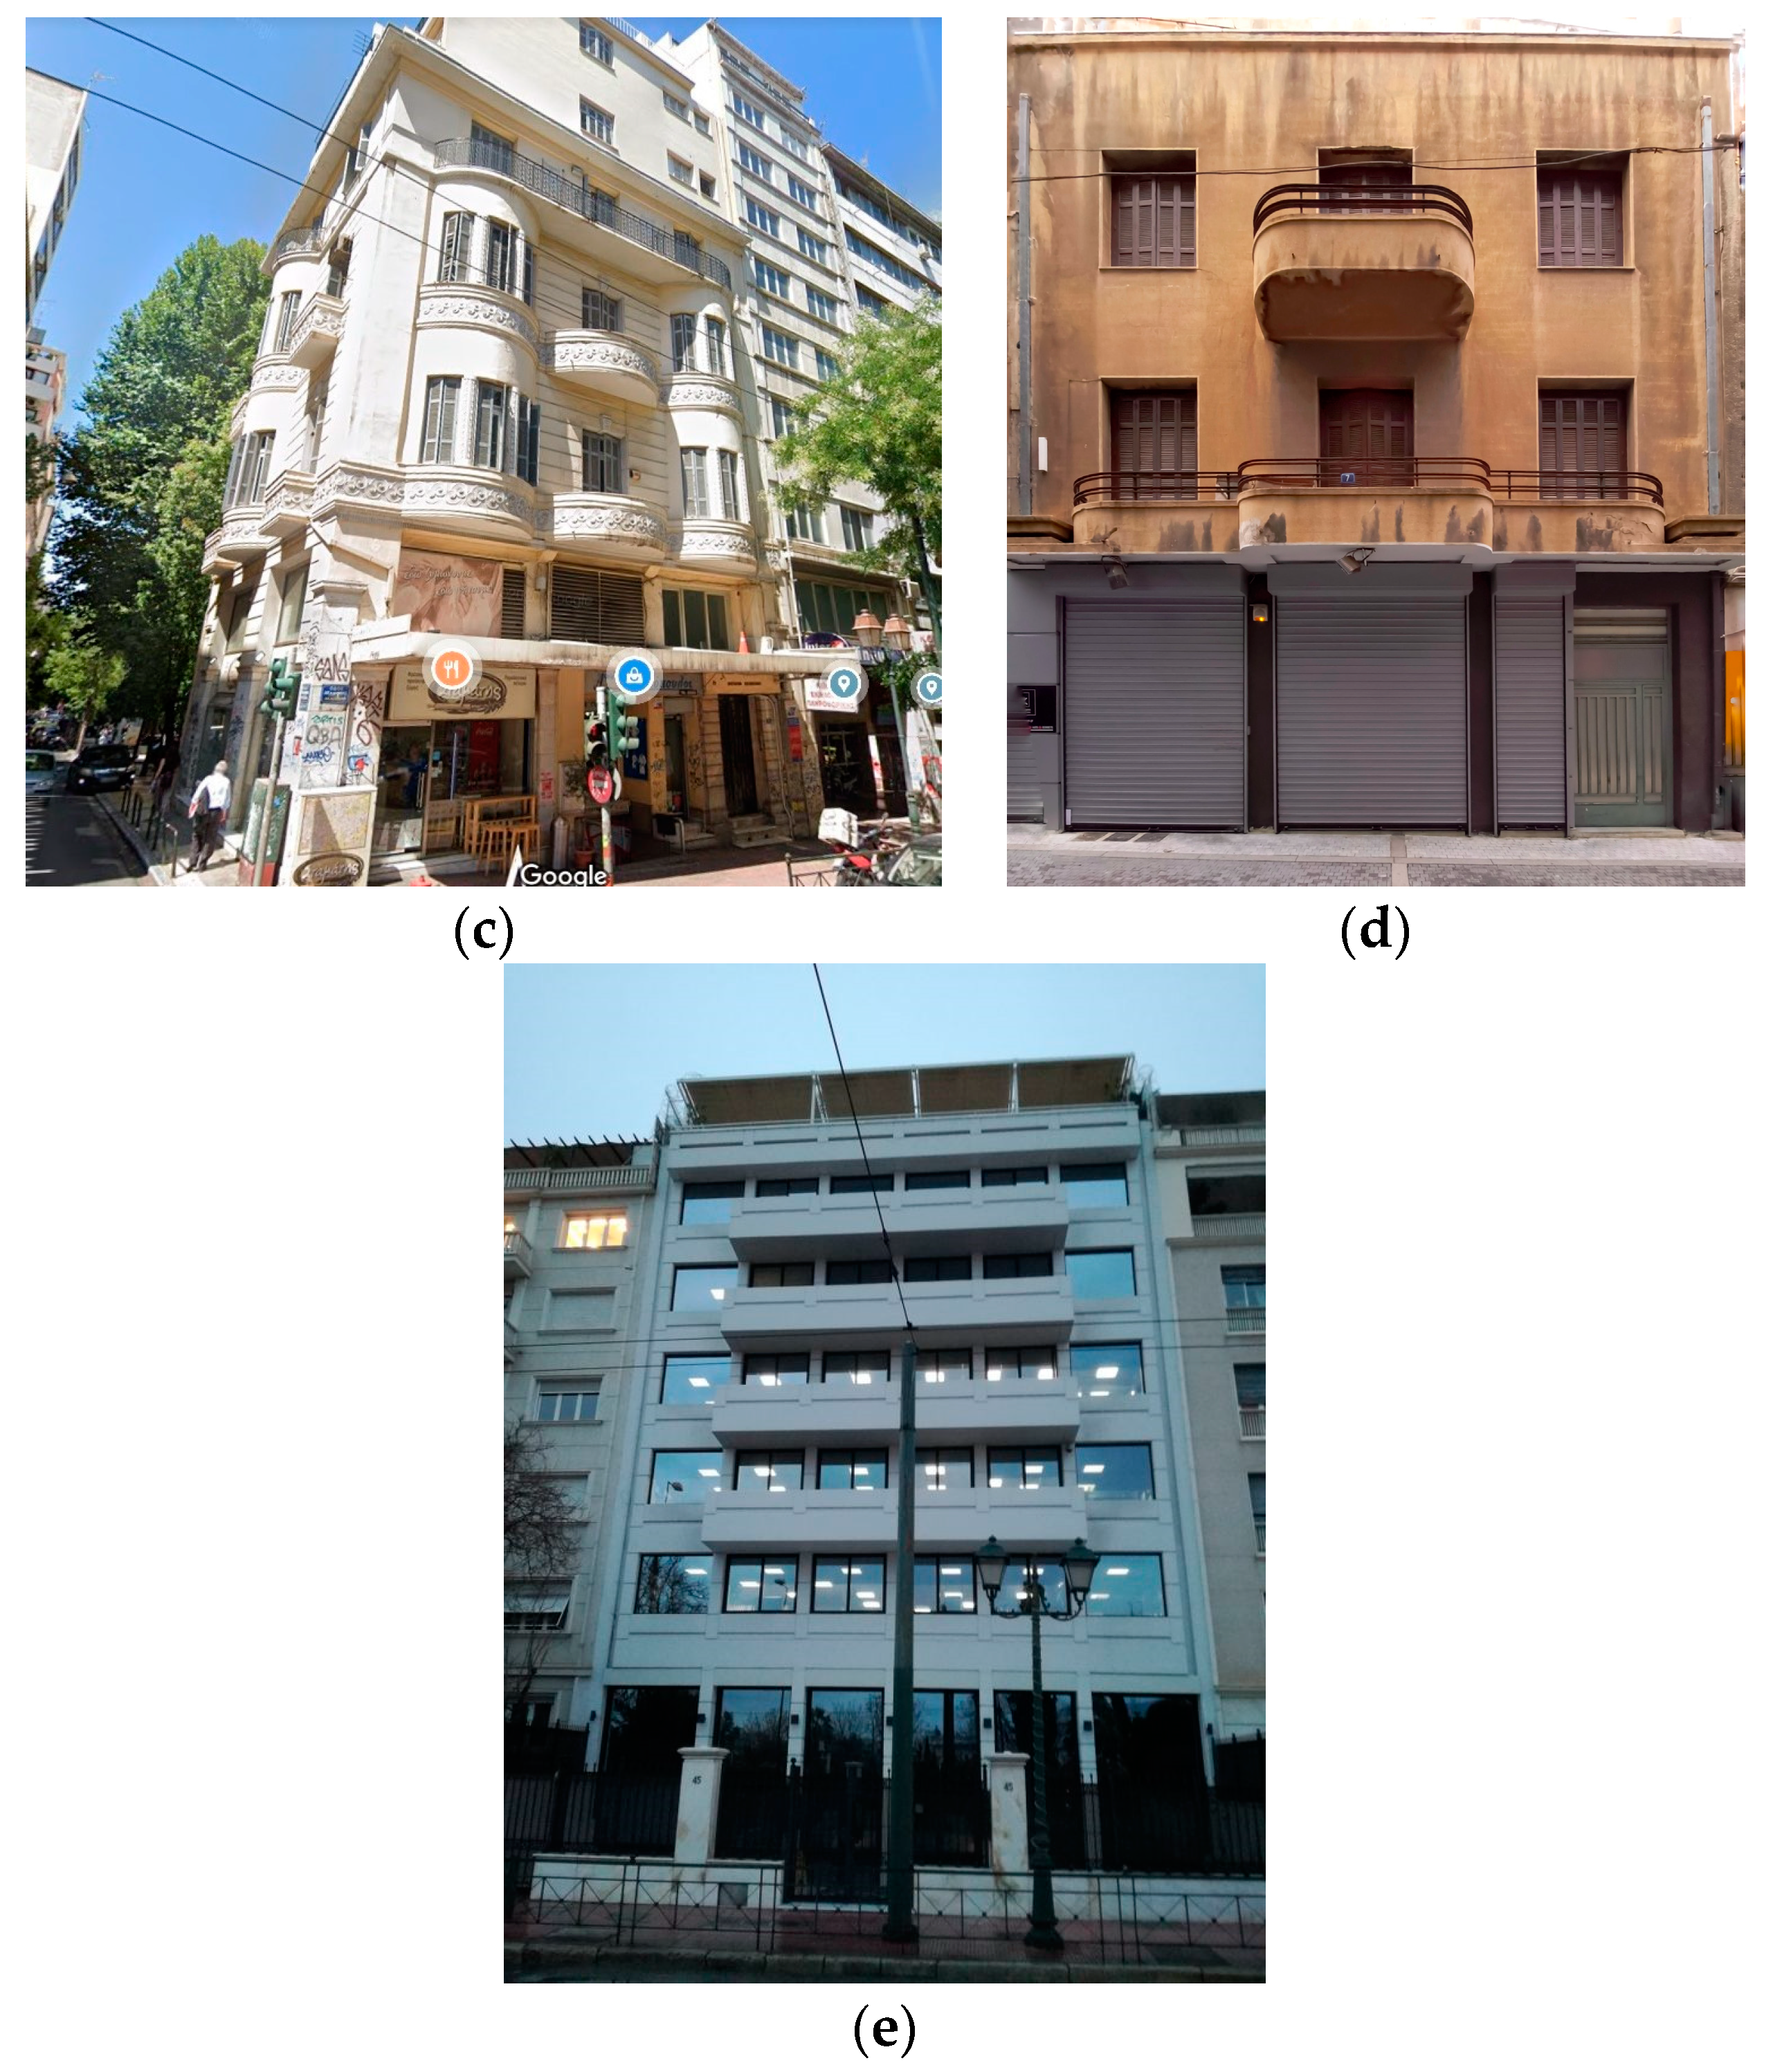
  • Interwar architecture:
    This style emerged in the early 20th century, during the period between the end of World War I and the beginning of World War II (in Athens, after the catastrophe of Asia Minor in 1922). It is characterized by its emphasis on simplicity, functionality, and a lack of ornamentation [22]. It was actually a shift away from the ornate and grandiose styles of the 19th century towards more practical designs. It is often associated with the International Style and Bauhaus movements, which focused on minimalist designs that prioritized form and function over decorative elements. Its characteristics are the use of new materials such as iron and concrete, the polygonal structures, bay windows, artificial coatings, etc. Nikolaos Mitsakis, Kyriakoulis Panagiotakos, Patroklos Karantinos, Vasilios Douras, Georgios Kontoleon, and Polyvios Michaelidis are some of the important representatives of the architectural generation of the 1930s—the generation of the Modern Movement [57].
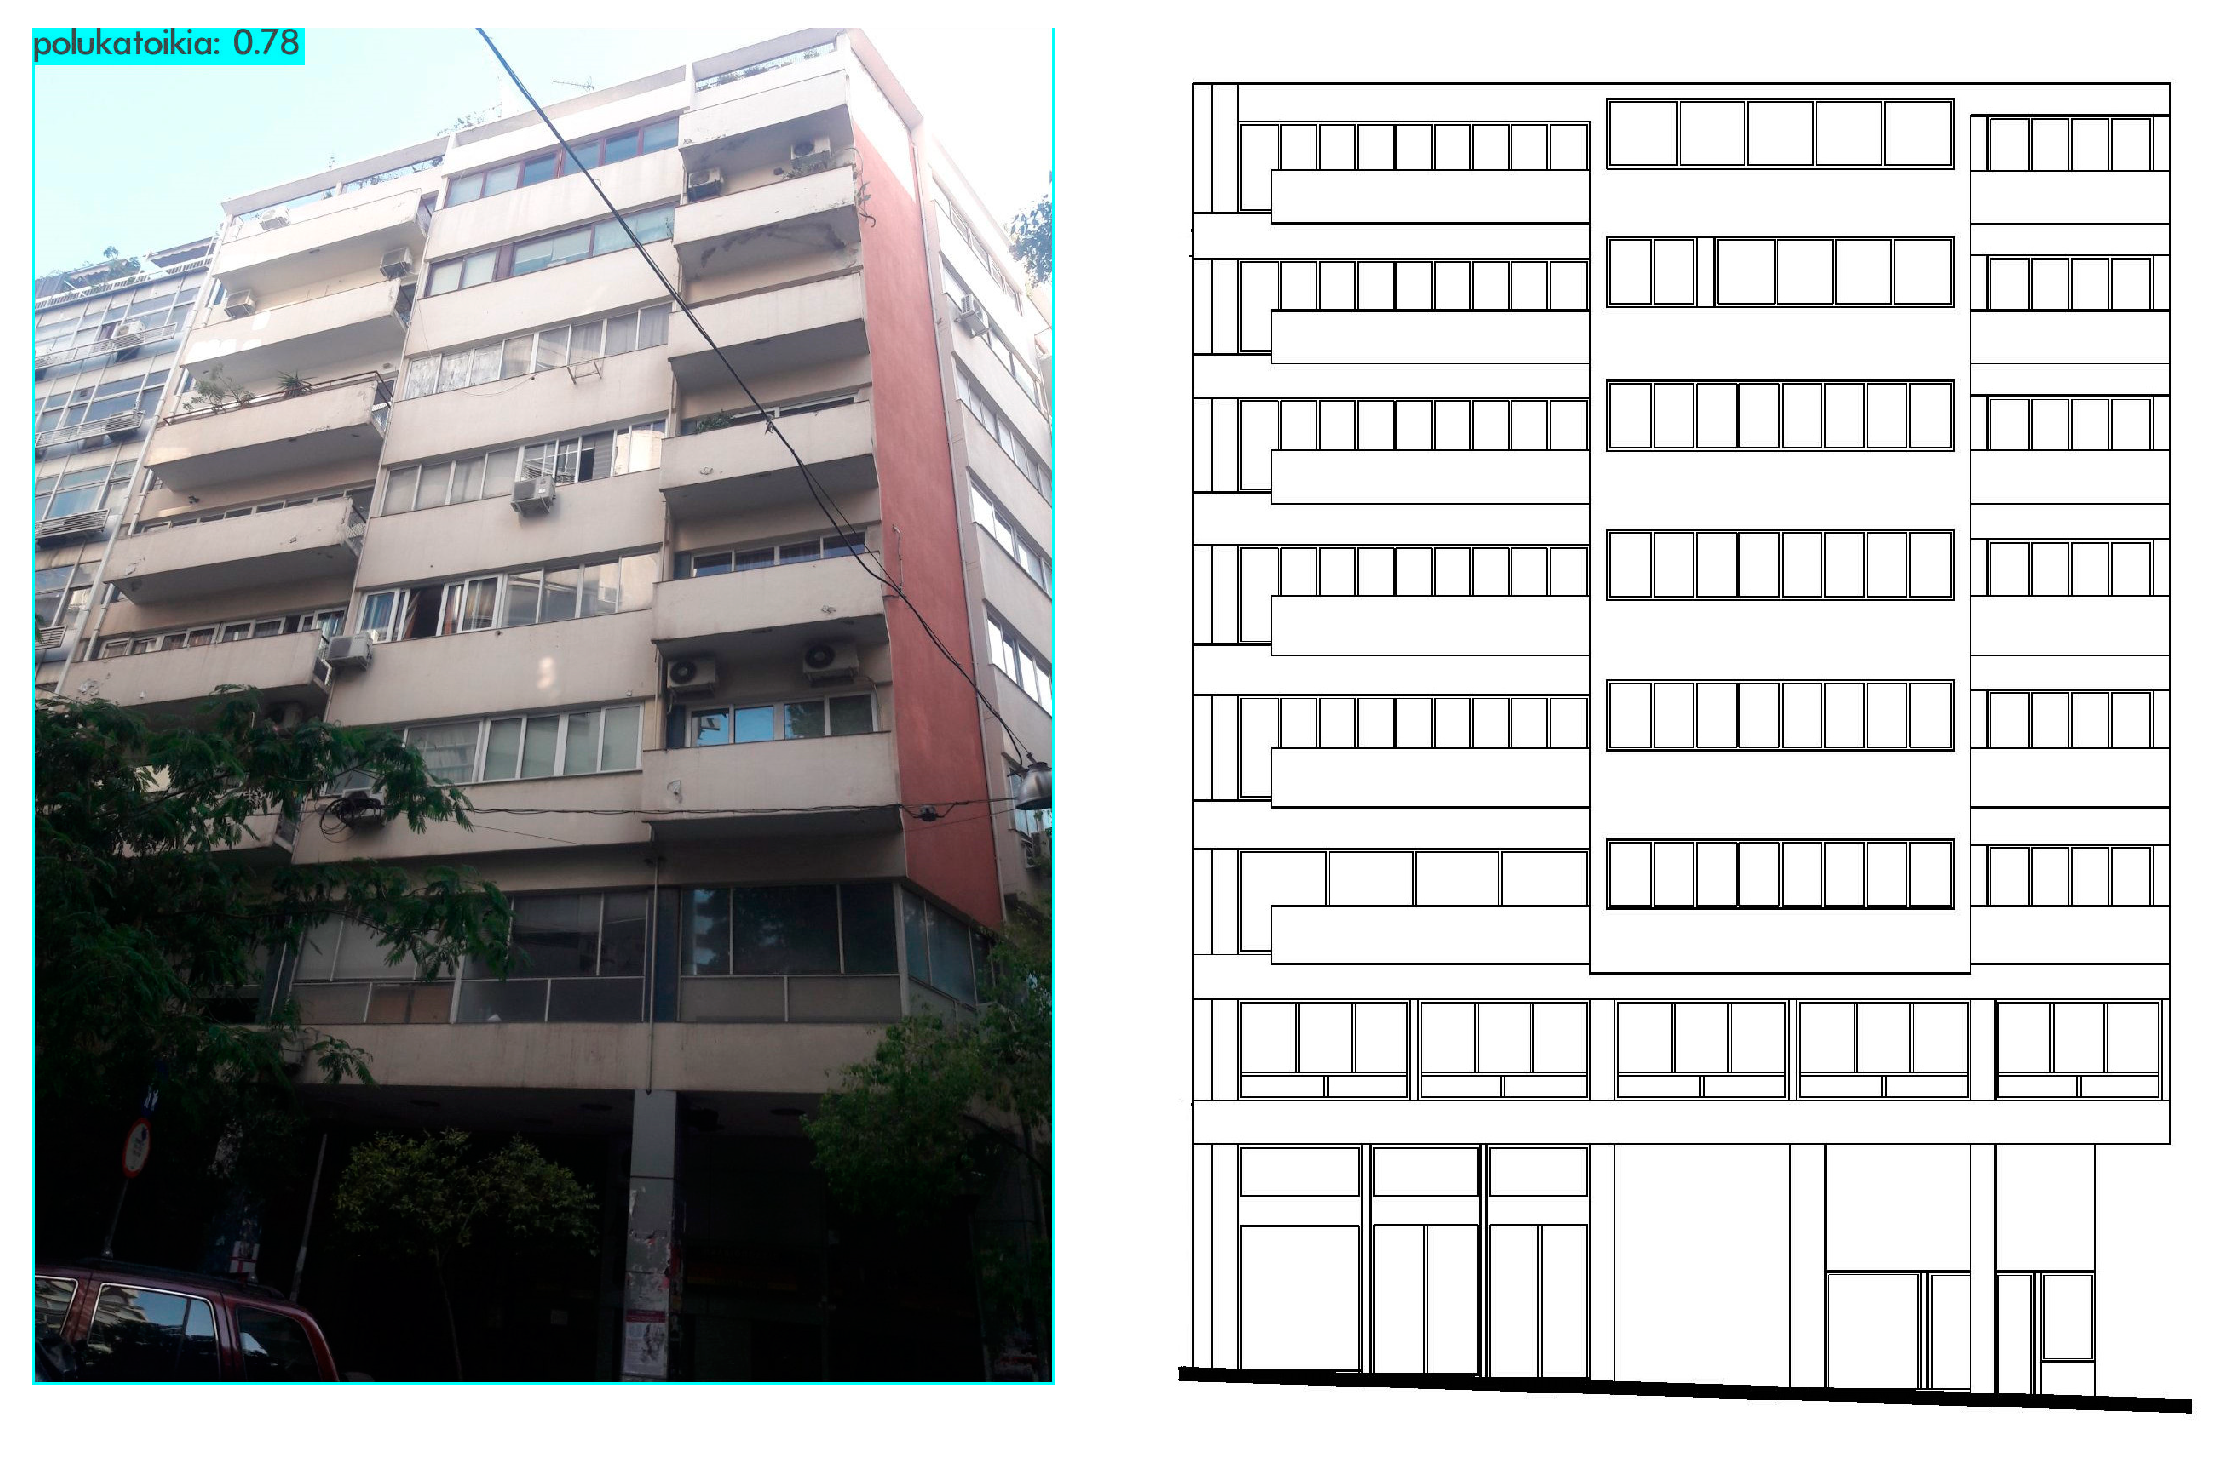
  • Postwar architecture:
    Postwar architecture in Athens is characterized by concrete multistory apartment buildings that became the trademark of the city. This style emerged in the aftermath of World War II, as the city sought to expand and modernize in the face of significant internal migration from the rural areas to the capital [58]. The multistory apartment building (polykatoikia) typically consists of a number of units stacked on top of each other and is a common building type in the urban areas of Athens. On the ground floors, the building’s use is often commercial, while the upper floors house apartments and offices [59]. From the war onwards, anonymous architecture dominates in Athens, without any distinguished major representatives of the time. This fact does not mean that in the years that followed there were no important architects who worked and produced great architecture, but the architects of that period did not exert a wider influence on the mass construction of the building stock of the Greek capital.
In the periods of transition from one type to another of the above architectural types, there are tendencies that lead to a mixture of more than one morphological style. For example, late neoclassical buildings show more elements of decoration and lean to eclecticism. In addition, in the interwar period, many architects were reluctant to adopt the strict directions of the Modern Movement and the Bauhaus and designed buildings with elements of eclecticism, despite the fact that they adopted new materials, modified the volume of structures, and enlarged the dimensions of the openings [60].
Taking into account that eclecticism in most cases is combined with neoclassicism or the interwar movement, for the purposes of the research, we distinguish our classes in five groups: (i) the neoclassical, (ii) the neoclassical-eclectic, (iii) the interwar-eclectic, (iv) the interwar, and (v) the postwar buildings (Figure 1).

4.2. Data Set

A data set of images is a collection of digital images that are organized and structured for a specific purpose, such as machine learning or image recognition. These data sets typically include a large number of images, each with associated labels or metadata, and are used to train and evaluate the performance of image processing algorithms [61]. As we have already mentioned, the model uses the data set to learn the underlying patterns and features present in the images, which it can then use to make accurate predictions on unseen data. A high-quality data set of images ensures that the model is well-trained and can make accurate predictions. It also helps the model to generalize well, meaning it can make predictions on new data.
For this research work, the images of the buildings were retrieved following three methods. Firstly, the buildings were photographed using a camera with an emphasis on acquiring the images of the object from various angles, in order to examine the reliability of the results in relation to the tagging and classification of the building in the correct class. The photographs concerned the whole facade of the structure and in many cases additionally a part of it, such as, e.g., part of the ground floor, its superstructure, or characteristic elements, such as openings or decoration.
Secondly, screen shots of Google Street View images were also used so as to obtain a variety in the quality of pictures, as the internet offers low resolution. We also captured depictions of the same building from a different viewing angle to verify the results but also to enrich artificially the data set by increasing the sample with new elements. Additionally, the shots in many cases intentionally included more than one building (showing buildings in an array, or one building in the foreground and the rest in the background) so as to test the ability of the algorithm to render the correct result in less ideal conditions than those of the direct projection of the object. In addition, the photos that allowed only a partial view of the building due to obstacles such as, e.g., parked cars, traffic lights, signs, or trees were used in the data set in order to test the performance of the algorithm. Finally, buildings that have been altered due to their current use (e.g., commercial use on the ground floor, changes of the dimensions of the openings, bad condition of conservation, or different construction phases) were used in the data collection so as to test whether we could identify the original typology despite the subsequent changes.
Thirdly, images were obtained (a) from online crowdsourcing databases that collect material regarding Athenian architectural heritage (e.g., ModMov, the Listed Buildings Archive, etc.) and (b) from social media, e.g., the Facebook page of Athenian Modernism. This collection of data allowed us to have even more differentiation in image quality (e.g., faded Β&W images) as well as aerial shots to test the algorithm on a different capture level other than that of street level.
From the above process, a data set of more than 6000 images was gradually created (Table 1), which was divided into classes according to the progress of the research implementation. In the first period, the shots were categorized based on selected architectural elements, mainly οn neoclassical and eclectic buildings. In the second period of the research, the classes were divided into neoclassical, interwar, and postwar constructions. In the third period, the number of photographs increased and was again divided into neoclassical, neoclassical-eclectic, eclectic-interwar, interwar, and postwar buildings. As a study case, the algorithm was tested at the neighborhood level in the center of Athens, which includes all the aforementioned classes of buildings.

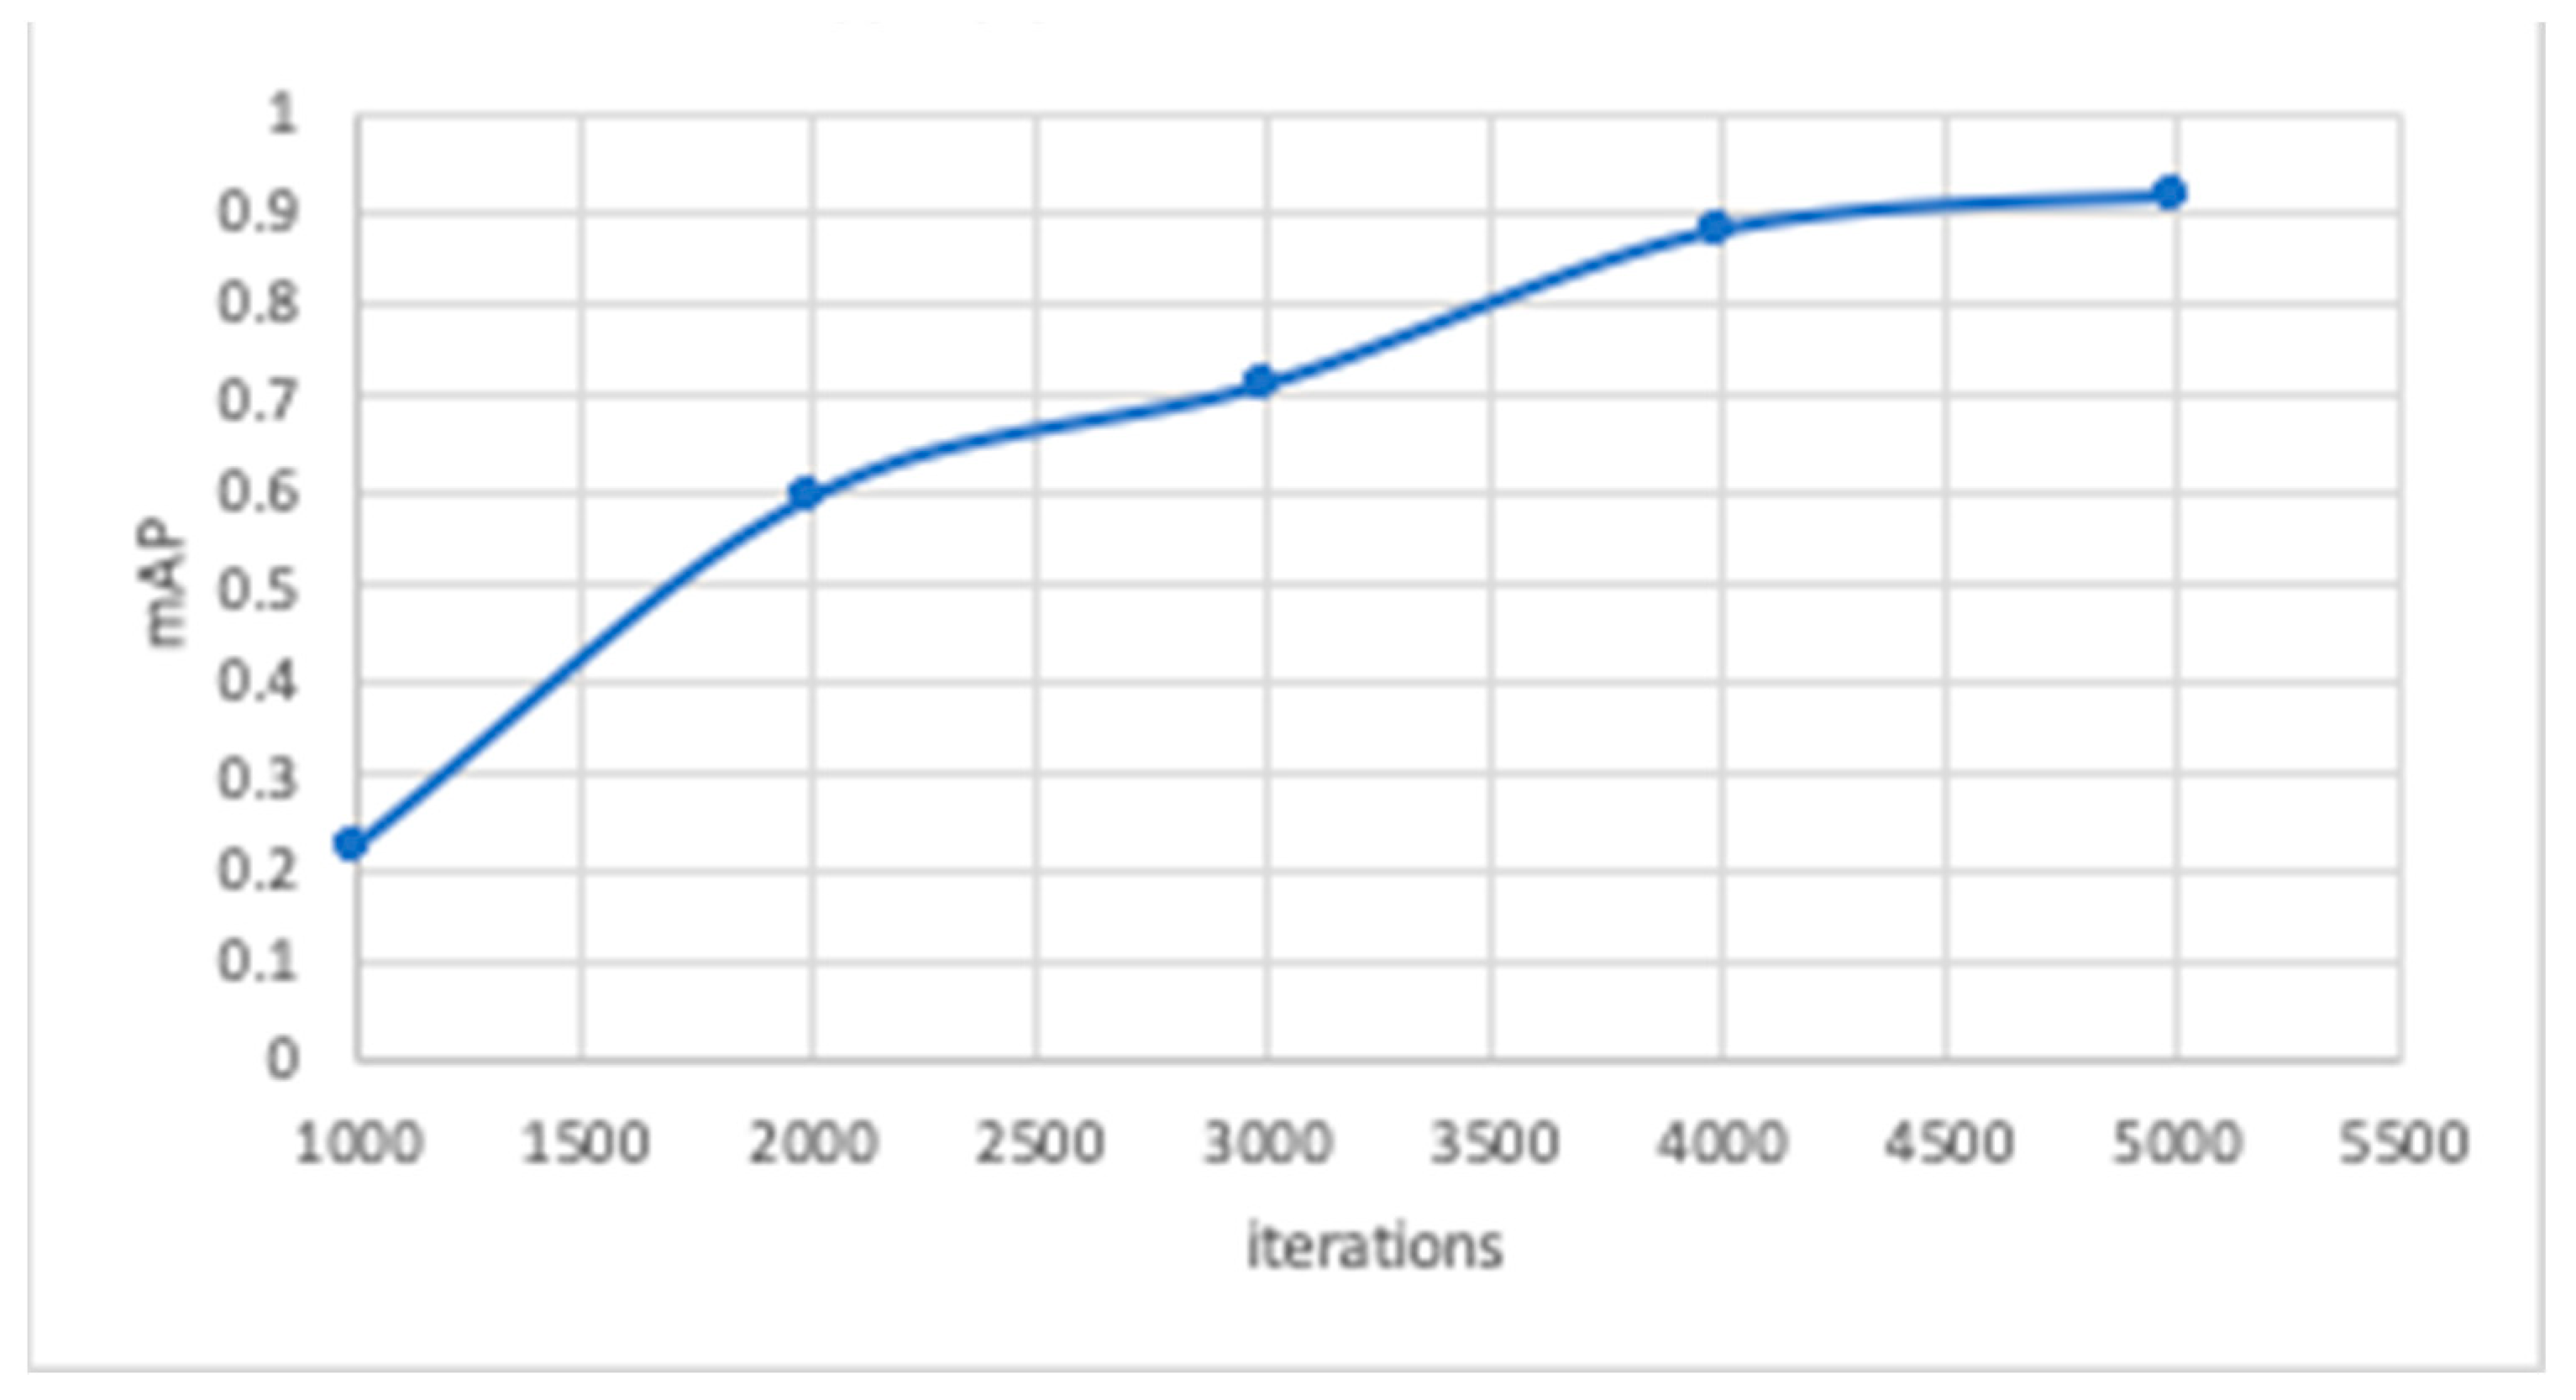
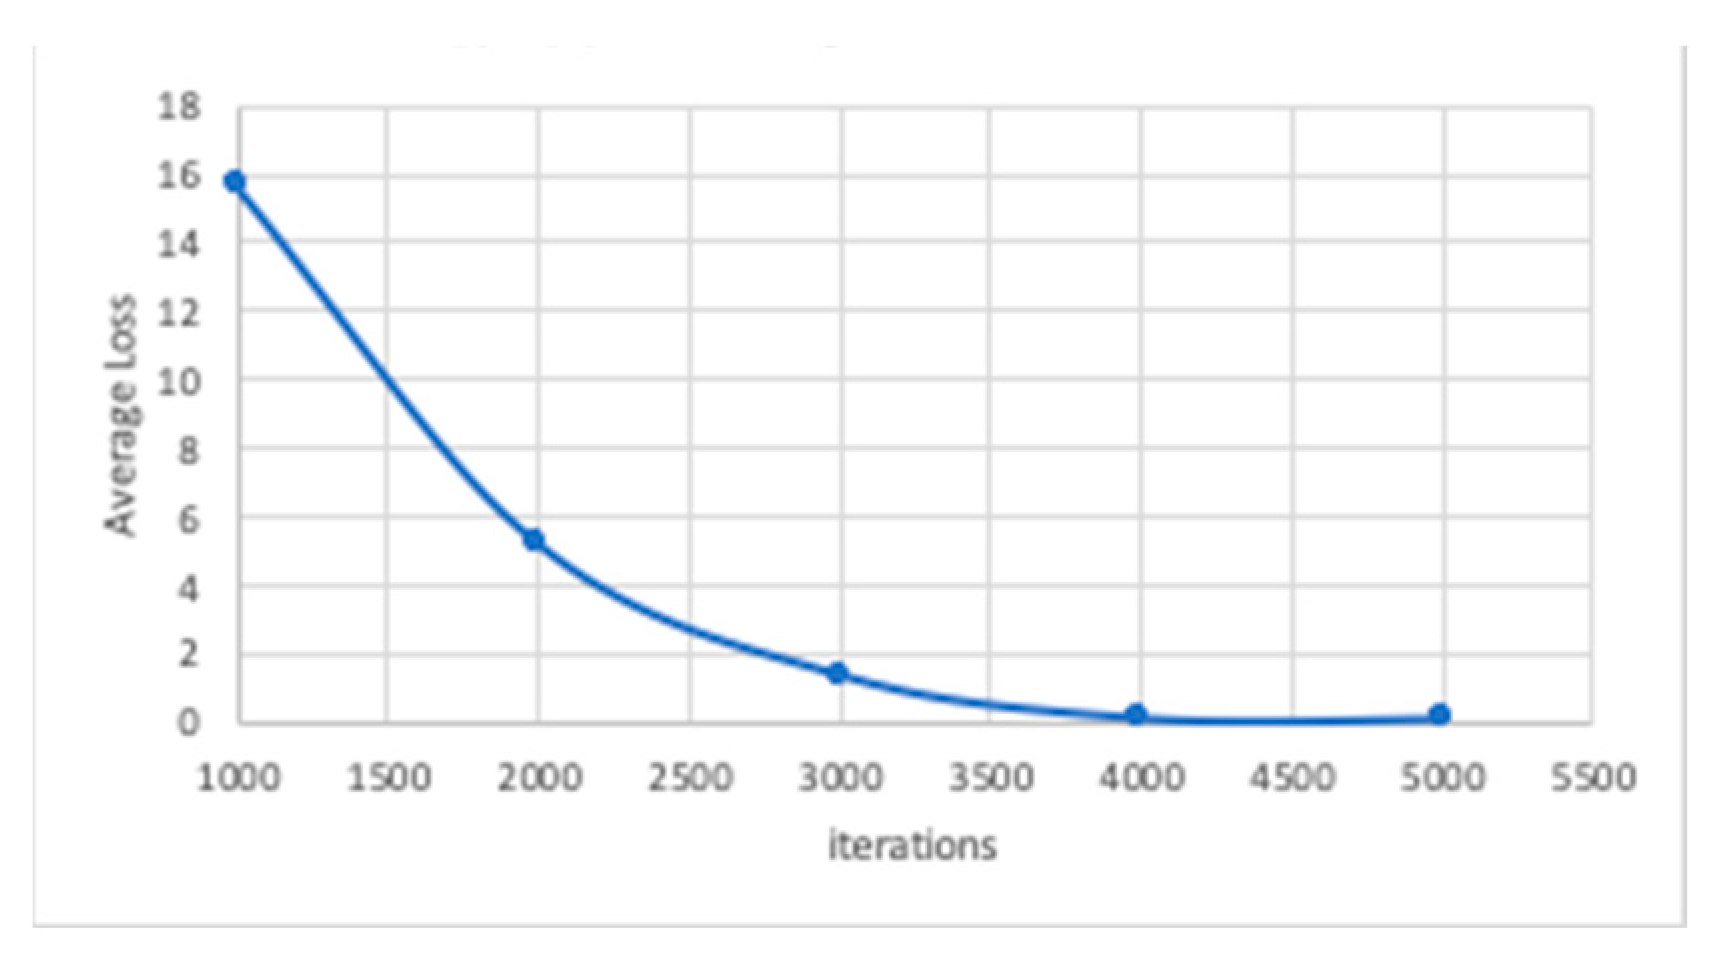
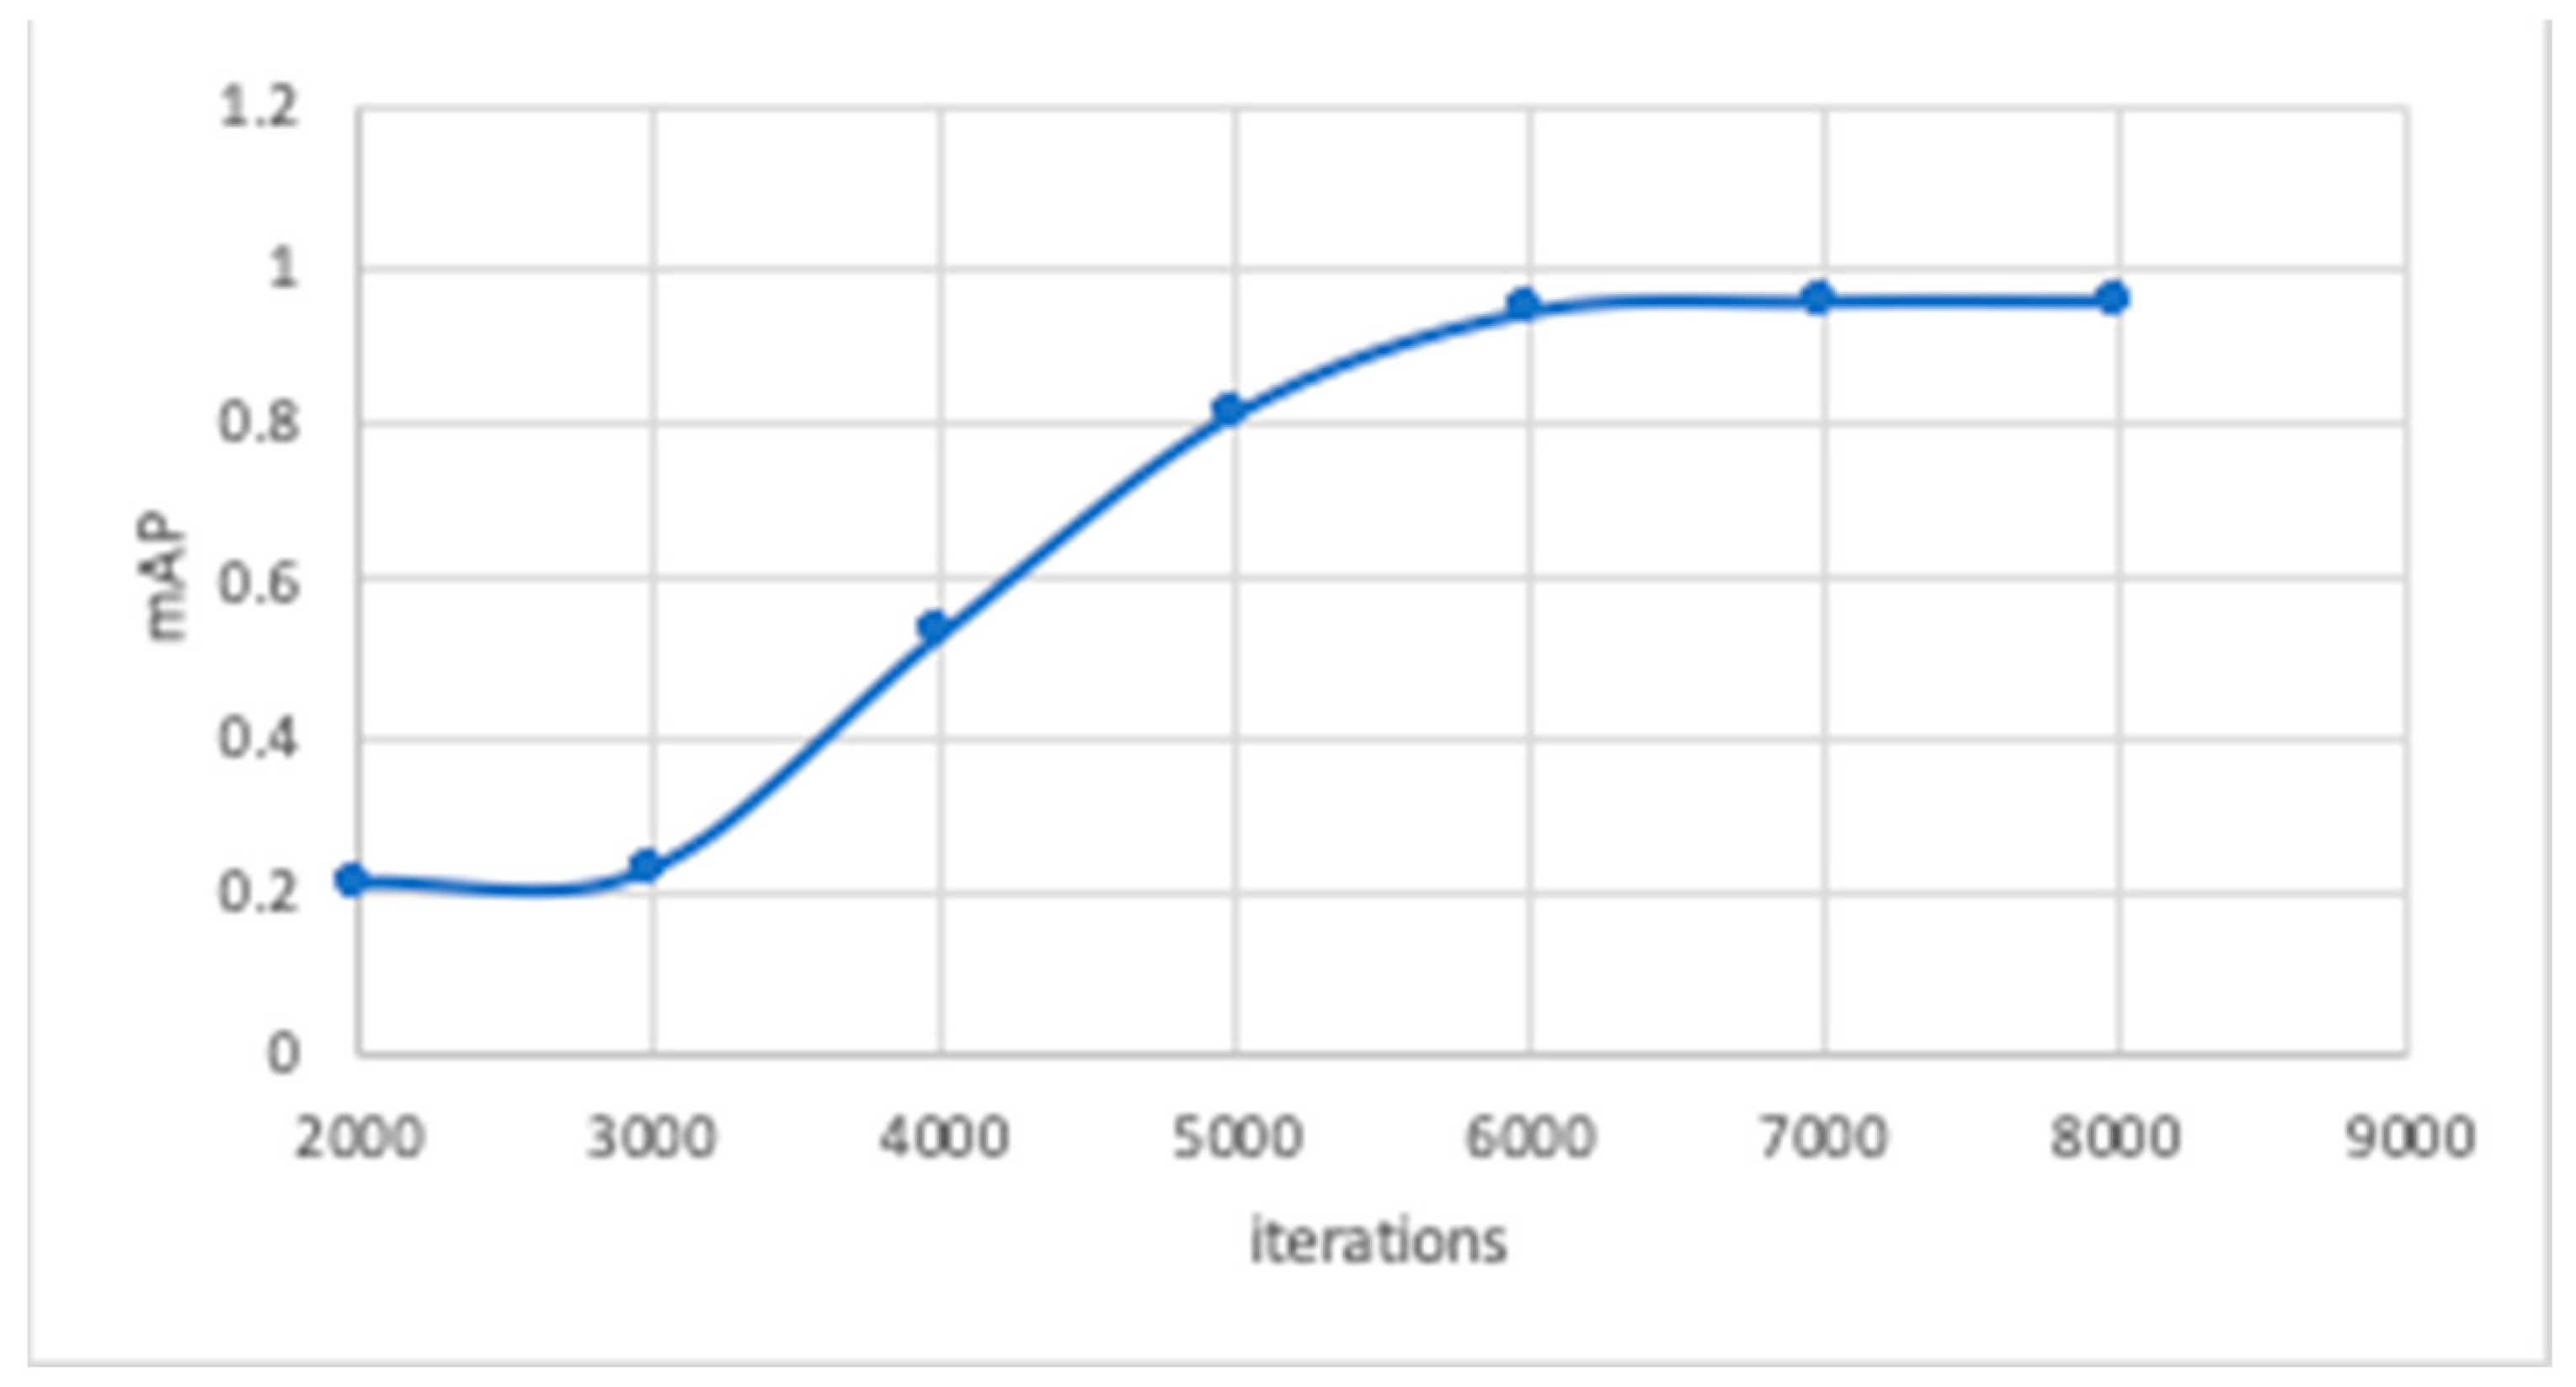
4.3. The YOLO Training

For this research work, the implementation of the CUDA (Compute Unified Device Architecture) programming language required an RTX 2080 SUPER 8 GB Nvidia graphics card for faster results. An Open-CV module enabled faster data augmentations to expand the size of the training set and to achieve better performance. As far as the configuration file (batch size, height, width, subdivision, momentum, and learning rate) is concerned, the following parameters were established: (i) to avoid lack of memory issues, the batch size and the subdivisions were set to 64; (ii) the momentum rate acquired the value 0.494; (iii) the learning rate was set to a small value of 0.001; (iv) the dimensions of images (width and height) were resized to 608 × 608 multiplied by 3 channels. Thus, the detector input size was 608 × 608 × 3 or better detection and more accurate results, and the output before the YOLO layer was 19 × 19 × 30 . For the purpose of this paper, 161 layers were used (routes and shortcuts, and convolutions), while the number of the YOLO layers according to the classes in each phase was given by f i l t e r s = c l a s s e s + 5 × 3 [62]. Table 2 describes the first 20 layers of the custom multilayer YOLO configuration.
The YOLO algorithm is characterized as supervised, since during training both input and target data are provided. So, in each case of classes, the software is called to determine the object/target, its location, and the class it belongs to.
Successful training and accuracy in finding points of interest presupposes that the object has been studied in every possible manifestation. For example, a “door” class is called to be determined from images that contain the specific object in various positions, with different distance from the lens, different brightness, etc. It is worth mentioning that, for generalization purposes, the dataset must include not only images that contain exclusively cropped images of the specific targets (points of interests), but rather larger images containing those targets. For example, consider the case that the model is trained to detect doors and the training set contains images representing exclusively doors. It is very likely that, during the operation, if the model encounters a door in a wider view (e.g., on a building facade), it may not recognize it or may recognize it with a low percentage of accuracy. As a rule of thumb, when the target occupies a great extent of the image, the appropriate bounding boxes are not calculated effectively by the algorithm.
It is considered appropriate for the trained model to produce results on unknown data sets that it comes across for the first time [63]. In addition, the images must be carefully collected to fully correspond to the targets of interest (points of interest) to be identified. Consequently, many images from the original data set are obsolete and should not be part of the training process. For the training purposes, the data set is divided into training data and validation data, with a percentage of 80% and 20%, respectively. On the validation data, the model tests its accuracy in unknown images.
A frequent question that arises when training neural networks [63] is the definition of the stopping criteria (i.e., when to stop the process). Based on the experiments carried out to train the classes of the Athenian buildings problem, it appears that 2000 iterations for each class is satisfactory. Another factor that is considered is the average loss. The smaller this number is, the more efficient the model and the fewer errors.
In neural networks, an overfitting phenomenon of the weights is often observed after many iterations on the same data set. As a result, a model is created that recognizes entities only from the trained data set. Thus, it loses the ability to generalize and to find application in data foreign to it [63]. In our research work, overfitting scenarios were limited by stopping each training process at an early point. In deep learning, the loss metric (also called loss function or objective function) is a mathematical function that measures the difference between the predicted output of a neural network and the actual output (i.e., ground truth). The goal of training a neural network is to minimize the value of the loss function, which indicates how well the network is performing on the task it has been trained for.
For our classification task, where the goal is to assign a label to each input sample, the cross-entropy loss is used as a loss function. The cross-entropy loss measures the difference between the predicted probability distribution and the true distribution of class labels. It penalizes the model heavily for assigning a high probability to the wrong class.
Specifically, let us denote by p i , j the predicted probability that sample i belongs to class j . The cross-entropy loss for a single sample i is then defined as:
L i = ( i = 1 N y ( i , j ) log ( p ( i , j ) )
where y ( i , j ) is the j -th element of the one-hot vector representation of the true label y ( i ) .
The cross-entropy loss measures the difference between the predicted probability distribution p , i and the true distribution y , i . It penalizes the model heavily for assigning a high probability to the wrong class. The overall cross-entropy loss for a batch of samples is then the average of the individual cross-entropy losses:
L = 1 N ( i = 1 N y i log ( L i )
where N is the number of samples in the batch.

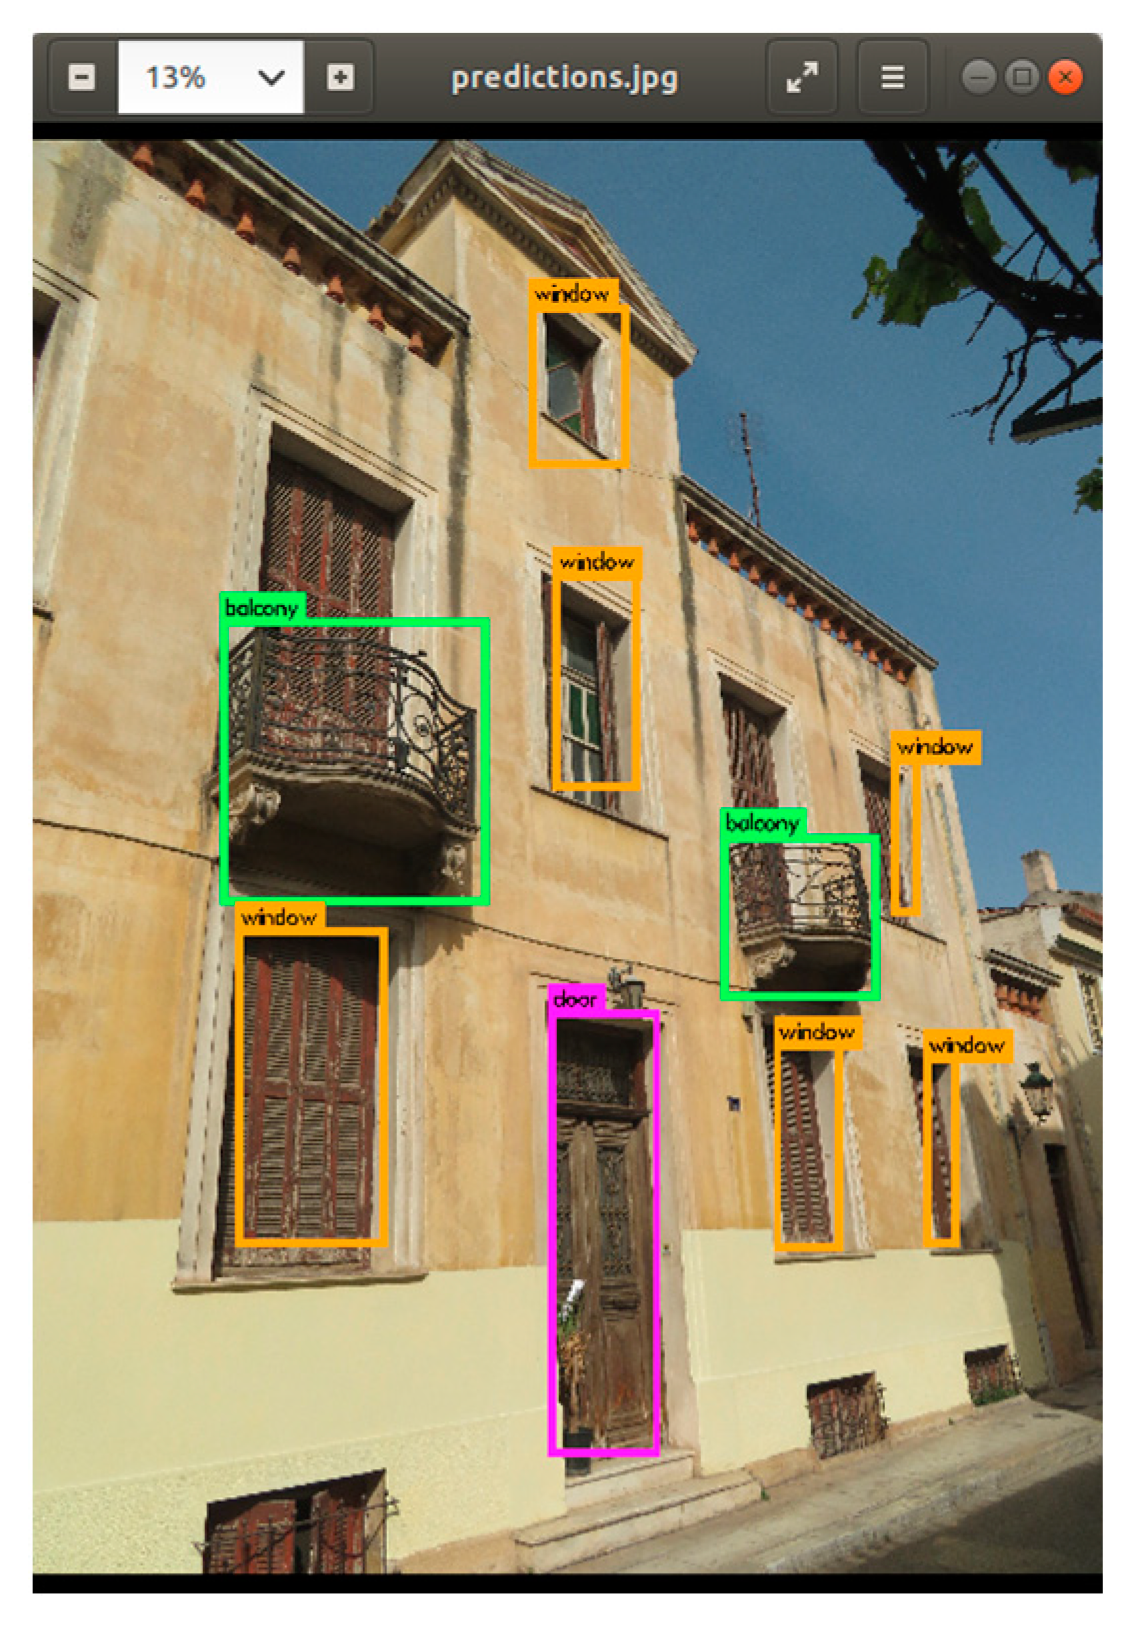
4.3.1. Training Phase 1: Identifying Doors, Windows, Balconies, Corbels

In the first training phase, the neoclassical buildings were examined in more detail in terms of the individual elements that distinguish them. The doors, the windows, and the balconies were the parts that were firstly intensively investigated in our research. Therefore, the initial motive was to begin experimenting with the aforementioned elements individually, as separate classes, then combine them, and gradually add other basic characteristics of neoclassical architecture such as corbels, friezes, pediments, etc.
The basic classes on which entity detection was firstly implemented were the doors, windows, and balconies of a neoclassical building. The data set initially consisted of 977 images, of which the 782 constituted the training data set and 195 the test data set (Table 3).
More specifically, all the classes needed to be displayed either alone (e.g., input data where the windows are the main characters) or in all their possible combinations (e.g., input data where they simultaneously display a balcony, windows, and a door). The differences between the samples were related to the shooting angle, the distance, the combination of all the 3 above elements, the lighting, etc.
The left diagram (Figure 2) shows the relationship of the mAP metric in relation to the increase in the training repetitions of the above classes. As can be seen in the diagram above, over the iterations, the model adapts to the training data and produces more satisfactory predictions on the validation data. From 1000 to 6000 iterations, a rapid increase in mAP is observed. From 5000 to 7000 iterations, the mAP changes little, resulting in training being stopped.
This right chart (Figure 3) shows the average loss of predictions with increasing iterations and over time. From the first 1000 to even 3000 iterations, a huge decrease in average loss is observed. From 4000 iterations onwards, the model approaches almost zero loss. At 6000 iterations and beyond, the loss changes little, so the training is stopped.
However, the identification of the specific building parts in a photograph does not guarantee the differentiation of a neoclassical building from an apartment building. For example, a door may be detected in both types of building without making any distinction. In addition, the balconies and windows are not also distinctive characteristics between both types of classes. For that reason, a fourth class, “corbels”, is introduced. This element can be found mainly (in 99% of cases) on the neoclassical buildings.
Therefore, a new data set of 582 images depicting “corbels” (Figure 4) was added to the training set of the YOLO network. Firstly, the model was trained to detect this architectural element with the help of 18 filters before every YOLO layer. The changes at the hyperparameters of the configuration file were not applied in this training process. The new data set included different scenarios of the new point of interest with different distances from the camera. For example, the corbel may be part of the facade of the building or zoomed in on to describe more analytically its unique features. Furthermore, the data set includes images with multiple balconies in the same facade. Additionally, different illumination is applied in the images. As a result, a larger number of corbels support balconies. The 80–20% split in train and test images establishes more than 1400 ground truth bounding boxes to provide an accurate training process. In order to avoid overfitting scenarios, the training is interrupted after 2100 iterations. The final average loss on the corbel data set is 0.224. Based on the following results, the final weights of the algorithm can successfully detect the pair of corbels that support the balconies from different points of view and distances from the camera. Consequently, the detected objects may provide sufficient results in the classification of a specific building stock. Moreover, a detected pair of corbels denotes the probable existence of a balcony.
The classification of corbels as independent entities was successful. However, corbels were included in the initial training of balconies (Figure 5), and, for that reason, we realized that we would have to decide all the elements of the categorization and all the final classes from the beginning of the study. The fact that, (a) from a parallel study, it was apparent that the set of elements that affect the classification of a building in 3 classes (neoclassical, eclectic, and interwar) reaches the number 42 and that, (b) along the way, we may have wanted to increase the classes (as we finally did) led us to the idea of testing YOLO’s ability on the whole face of the building being examined.
Additionally, as the elements to be recognized increase, so does the number of images used as training data for the convolutional neural network. Therefore, the whole procedure was becoming more and more difficult to implement. A large amount of input data entails covering all possible occurrences of the elements of interest.
Finally, as the confidence score was already quite high (>80%), Training Phase 1 inspired us to be more demanding and try to achieve the classification by using images of the whole of facades and not of separate morphological elements of the buildings (Training Phase 2).

4.3.2. Training Phase 2: Identifying Neoclassical, Interwar, and Postwar Buildings

The second phase of the training examined the direct separation of two classes (neoclassical and interwar buildings) without the use of the individual elements that define them. Thus, a shift of points of interest from the individual elements of a building to the whole building was carried out. Firstly, a separation of the buildings into neoclassical and interwar buildings was carried out to test the accuracy and reliability of this technique. The new data set included the data set used in Training Phase 1 augmented by 657 new images (a total of 1634 images—Table 4) assigned into those 2 classes.
The following results were obtained:
The left diagram (Figure 6) shows the relationship of the mAP metric in relation to the increase in the training repetitions of the above classes. As can be seen in the diagram above, over the iterations, the model adapts to the training data and produces more satisfactory predictions on the validation data. From 1000 to 4000 training epochs (iterations) a rapid increase in mAP is observed. From 4000 to 5000 iterations the mAP does not change significantly, resulting in the termination of training.
The right chart (Figure 7) shows the average loss of predictions with increasing iterations in the outlier class. From the first 1000 to 3500 iterations, a huge reduction in average loss is observed. From 4000 iterations onwards, the model approaches almost zero loss, and therefore the training is stopped.
As the results were promising, a new class, “Postwar buildings” (apartment buildings), was added to neoclassical and interwar buildings, increasing the number of classes to three.
The new data set was augmented with 887 new images (total 2521 images) assigned to the 3 new classes (neoclassical buildings, the buildings of the interwar period, and postwar buildings (apartment buildings)).
The following diagram (Figure 8) shows the relationship of the mAP metric in relation to the increase in the training epochs of those 3 classes. As can be seen in the diagram above, over the iterations, the model adapts to the training data and produces more satisfactory predictions on the validation data. From 2000 to 6000 iterations, a rapid increase in mAP is observed. From 6000 to 8000 iterations, the mAP does not change, ending the training procedure.
The successful training on these three classes—neoclassical (Figure 9), interwar, and apartment (postwar) buildings (Figure 10)—involving different types of buildings and the appropriate identification of distinctive features, to such a level that an interwar building can be differentiated from a postwar apartment building, permitted the extension of our research with the addition of new classes.

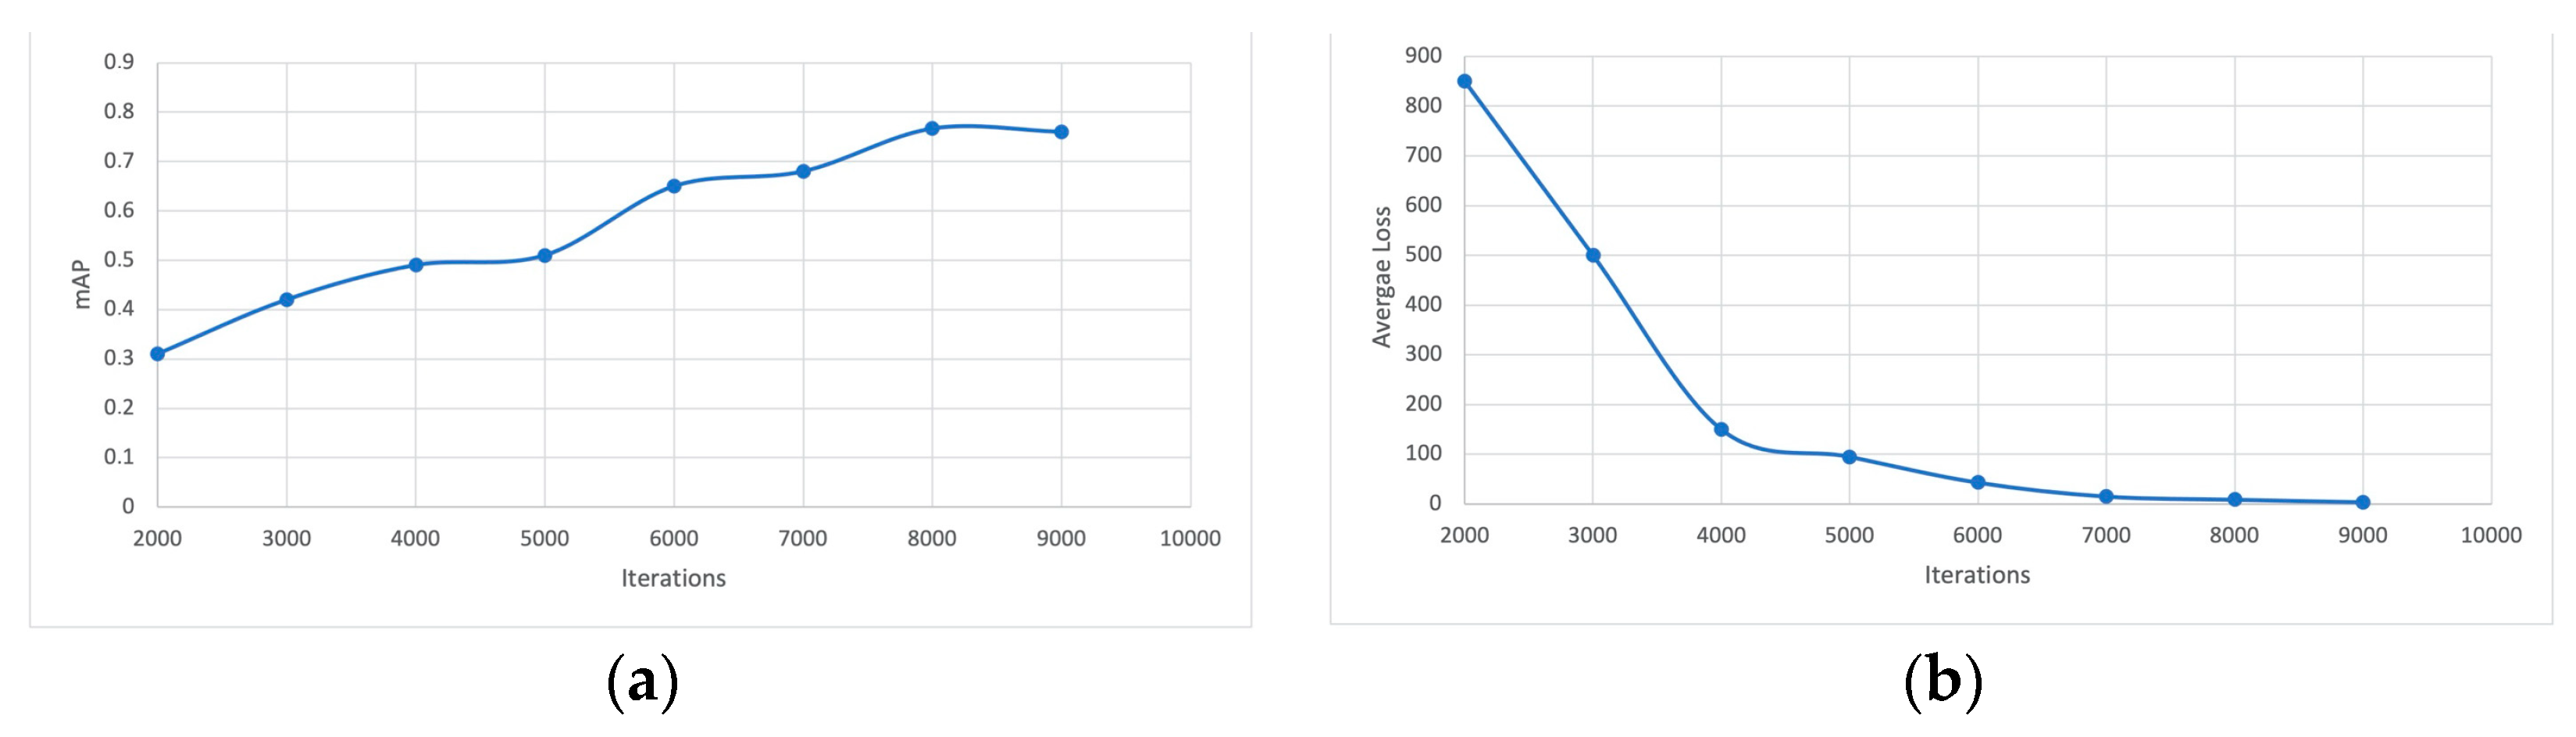
4.3.3. Training Phase 3: Identifying Neoclassical, Interwar, Postwar, Neoclassical-Eclectic, and Interwar-Eclectic Buildings

Despite the successful detection of the 3-class problem (neoclassical, interwar, and postwar) described earlier, the different types of buildings in Athens cannot be sufficiently described only by these three categories. Eclectic buildings coexist with late-neoclassical buildings, and, with the subsequent introduction of the Modern Movement, the Athenian architecture was enriched with interwar buildings that still preserve morphological elements of eclecticism (transitional periods).
For that reason, in our research work, and for a more precise approach to the classification problem, two (2) new classes are now added. Neoclassical buildings are differentiated into 2 subcategories, namely, neoclassical and neoclassical eclecticism), while interwar buildings are differentiated into interwar and interwar eclecticism, respectively. The postwar building (apartment) class does not undergo any change in this particular case. The new classes may offer more specialization in the identification of the building type by extracting new characteristics that differentiate on a deeper level the neoclassical from the neoclassical-eclectic and the interwar from the interwar-eclectic types. Moreover, in the specific scenario, the buildings from the test set constructed in Training Phases 1 and 2 are separated again with more strict architectural criteria.
The original data set used in the three classes is reassigned, as many neoclassical-eclectic buildings have been classified as neoclassical. The same problem applies for interwar buildings. As a result, the total number of samples for the initial classes is significantly reduced. This problem was tackled by introducing new images of neoclassical or interwar buildings, images of buildings that already exist in the data set but now appear in different manifestations with different facades, various distances from the camera lens, and different points of view. In total, 1120 images were added to establish the final data set (a total number of 3641 images—Table 4).
The left diagram (Figure 11) shows the relationship of the mAP metric in relation to the increase in the training repetitions of the above classes. As can be seen in the diagram above, over the iterations, the model adapts to the training data and produces more satisfactory predictions on the validation data. From 2000 to 6000 iterations, a rapid increase in mAP is observed. From 6000, the mAP converges slowly to the upper limit, and at 8000 iterations, the training reaches the maximum value.
Similarly, the right chart (Figure 11) shows the average loss of predictions with increasing iterations in the outlier class. From 2000 up to 7000 iterations, a significant decrease in average loss is observed, while from 7000 iterations onwards, the model approaches almost zero loss. At 9000 iterations and beyond, the loss does not change, and the training is terminated.
In Figure 12, the architecture diagram of the model is presented. In addition to the diagram, the parameters for the YOLO model are described in Table 5.

5. Study Cases for Generalization Assessment

After the completion of the three training phases, three validation tests were performed from sets of unseen data that were mainly obtained from the internet. These were intentionally selected for testing the algorithm on images of low-resolution B&W photographs or images taken from multiple photo shooting points and heights.
The first test was carried out with 500 photos of the interwar-eclectic and the interwar building classes that are mentioned mainly in the ModMov (Modern Movement) database It can be removed that is dedicated to the examination of the interwar period [17], and 100% were retrieved from Google Street View. The success was 76.8% (Table 6 and Table 7).
According to the results, 8.75% of the interwar buildings are predicted as interwar-eclectic and 9.25% as apartment buildings. These classification errors are expected, taking into consideration the similarities that are found in these three classes. Respectively, 18% of the class of interwar-eclectic buildings are predicted as interwar properties. However, in this case, if we do not strictly take into account the morphological criteria, but rather consider the general period of construction of the objects of study, the error is reduced.
The second test concerned a data set of 1000 photos from the 5 classes, achieving an average prediction success rate of 75.5% (Table 8 and Table 9).
As seen in Table 6, the highest success rate is presented in neoclassical buildings (92%). This is followed by interwar buildings (77.8%) and apartment buildings (71%). The lowest performance appears in the neoclassical-eclectic and interwar-eclectic classes (66% and 65% respectively). However, analyzing in greater depth the misclassifications, we note that (a) the neoclassical-eclectic are classified by 20% in the neoclassical period and (b) the interwar-eclectic are also classified by 19% in the interwar buildings. If this fact is examined with a broader and more lenient analysis of the construction period prediction, then the classification error is mitigated by about 8% (83.5% on average).
Under further analysis, 13% of the apartment buildings are confused with the interwar buildings, (in cases where the constructions are characterized by simplicity), 7% are misclassified as the neoclassical-eclectic class, and 5% with the interwar-eclectic buildings. The latter happens when the examined buildings lean towards postmodern architecture that is more pluralistic and combines different styles.
To further evaluate the generalization ability of the model, we proceed to the third test. A completely unknown data set of images is collected from buildings in the area (Figure 13) between the church of Zoodochos Pigi and Kaningos Square in the center of Athens (i.e., Katakouzinou St., Nikitara St., Mavrokordatou St. and the perpendicular Themistokleous St., Emm. Benaki St., and Zoodohou Pigis St.).
The area under consideration is currently located in the heart of the capital between two main roads of the city, Panepistimiou St. and Acadimias St. The area began to develop in 1870–1880, as until 1855, the wider area around Omonia Square was still completely unbuilt.
This district was intentionally selected, since buildings from all five periods (neoclassical, neoclassical-eclectic, eclectic-interwar, interwar, and postwar) are present (Figure 14). However, this region demonstrates some additional challenges.
The first challenge is that the intense commercial use of the area has altered the appearance of many buildings in relation to their original morphology. Another challenge is the narrow width of the road, which does not allow many ortho-photos of the buildings to be taken. A third obstacle is the existence of many trees (occlusions) on the pavements, which intensifies the above problem. Finally, there are abandoned buildings in the district that are in a dilapidated state and in very bad condition. The data set was composed (a) of images photographed in situ, (b) of screenshots from Google Street View, and (c) of images retrieved from the web.
The classification results were similar to the percentages of the previous validation tests. Out of the 41 buildings under examination, the model correctly predicted 31 (75.6%), and out of 120 photos, correct classification was achieved in 91 of them (75.8% success) (Table 10 and Table 11) (Figure 15, Figure 16 and Figure 17).
The photos that were misclassified were of poor quality or represented only a small part of the building due to their size and the sharp shooting angle, or the significant part of the building was occluded (e.g., by tree foliage).

6. Discussion of the Results

In this research, the number of the collected images as shown in Table 12, combined with the appropriate computational resources, created a classification model for building recognition providing satisfactory results. The recognition of the individual construction elements of neoclassical buildings was successfully performed as the trained model recognized doors, windows, and balconies of neoclassical buildings. Nevertheless, the problem that was immediately noticed was that any door, from any type of building, was recognized as a neoclassical door. A first solution was the introduction of new features found only in neoclassical buildings, such as corbels. However, if the number of classes is increased from {doors, windows, corbels} to {friezes, columns, etc.}, so the number of images containing the necessary entities increases significantly too. Additionally, during training, the average loss never decreased, while after a certain number of iterations it remained almost constant. This model was not considered sufficient, and the research focused on the entire building as a field of interest.
Subsequently, the new classes that were created consisted of neoclassical buildings, interwar buildings, and postwar (apartment) buildings. A first test contained only two of the three classes, i.e., neoclassical and interwar buildings. After stopping the training with a sufficient number of images, the results were encouraging for the generalization of the model. However, the satisfactory results in feature extraction in these types prompted the need for further specialization of the problem. The interwar buildings were divided into interwar and interwar-eclectic, while at the same time the neoclassical buildings were divided into neoclassical and neoclassical-eclectic. The data set until that point included only 20% of images that were retrieved from the internet.
Since the data set was constructed sufficiently (Figure 18), the training results were fully satisfactory. Consequently, it was concluded that a data set with a large number of photographs covering many cases from the object or objects of each study, in combination with the appropriate parameterization of the learning mechanisms, is able to extract features, and recognize and locate entities in space, such as buildings.
More specifically, the model performed sufficiently in cases:
  • with buildings with changed use (e.g., the ground floor had been converted into a commercial shop, so the original dimensions of the openings were now altered and signs had been placed);
  • with severe occlusions of the buildings (e.g., from trees, signs, vehicles, etc.);
  • where buildings appeared in bad condition (they showed damage or interventions, e.g., graffiti, or they were abandoned or in a dilapidated state);
  • where postwar buildings were constructed with morphological elements that referred to a previous historical period.
As far as the classification errors are concerned, they are most likely due to (a) low photo resolution, (b) an indirect shooting angle of the building, and (c) cases where buildings present rare morphological peculiarities.
Finally, three facts that were observed during the experiments that should be discussed are as follows:
(1)
In each validation process there was always a relatively small but noteworthy number of photos for which the algorithm could not make a prediction at all;
(2)
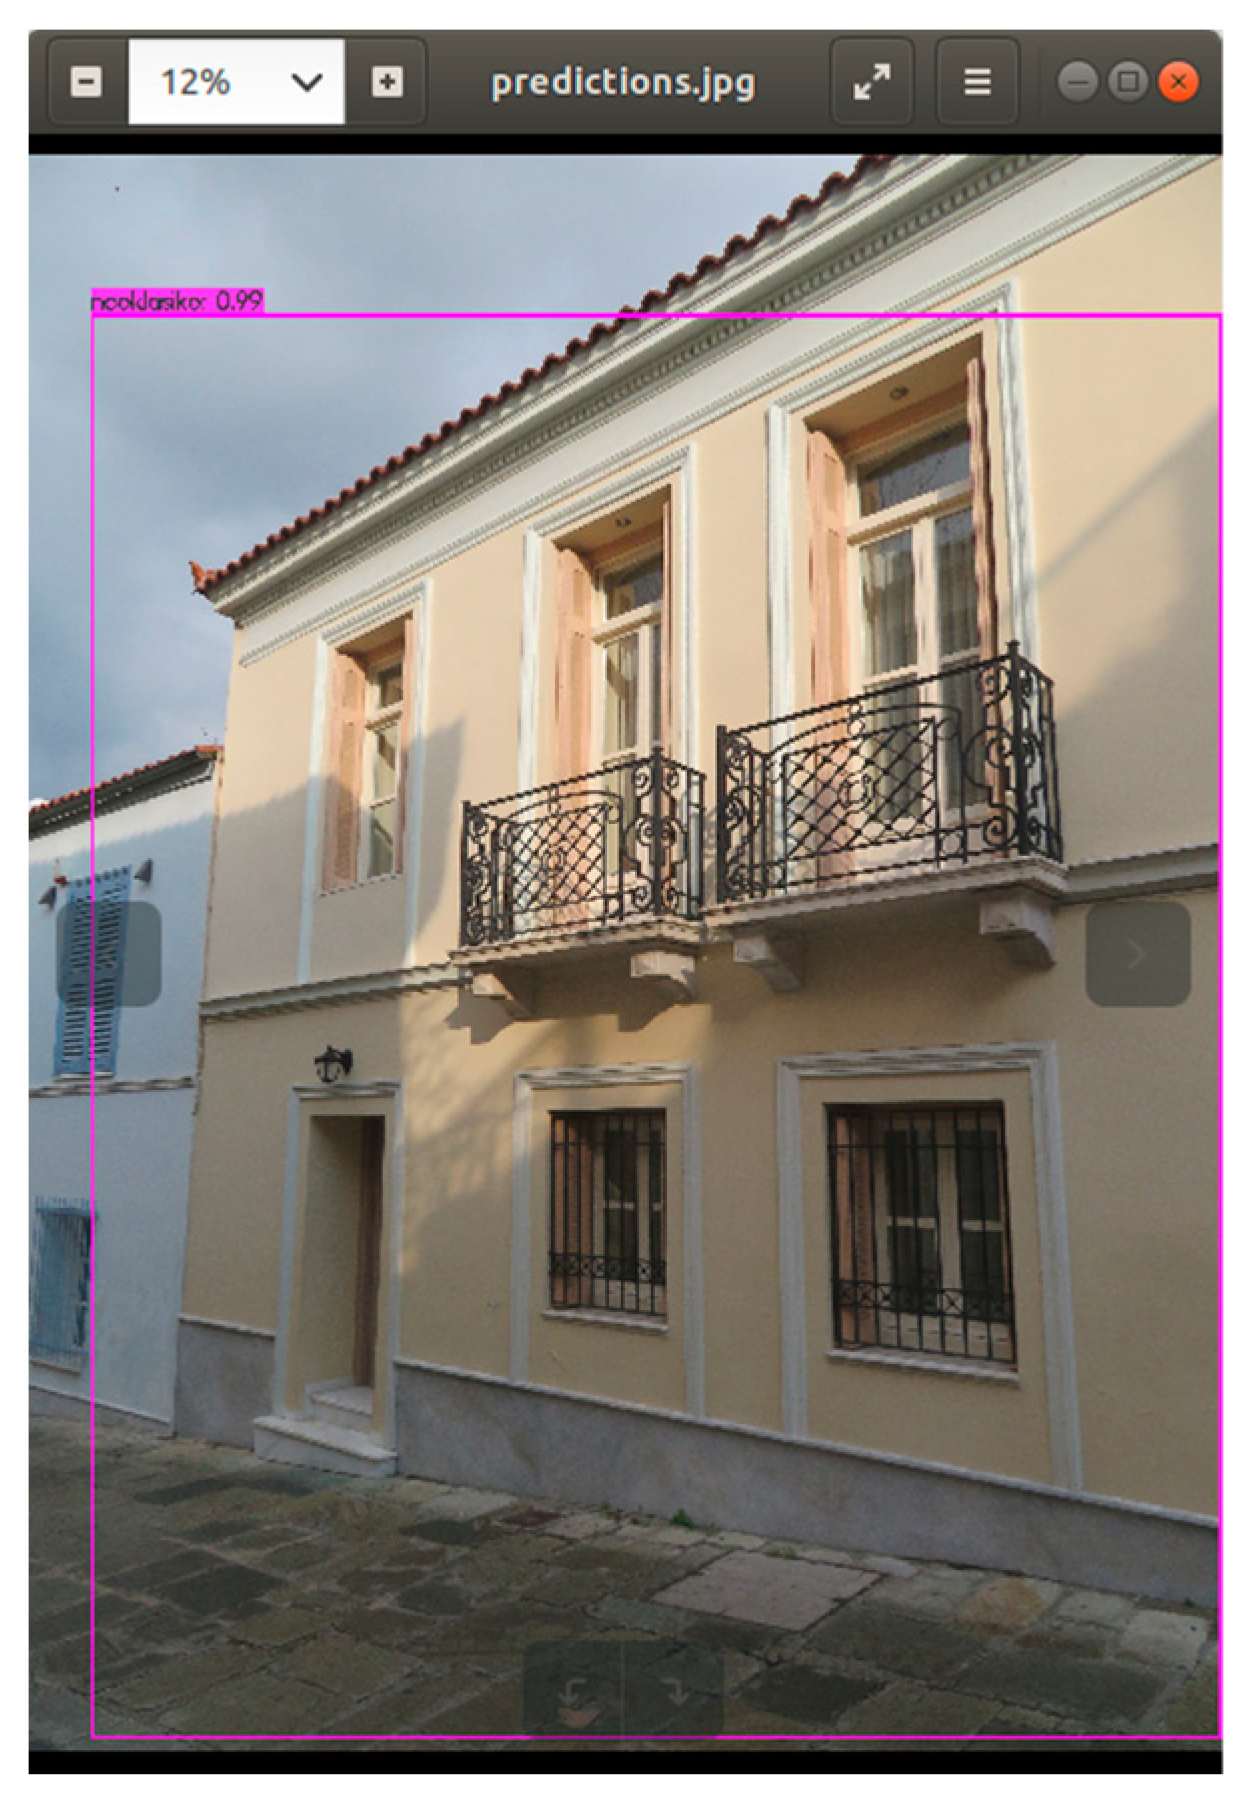
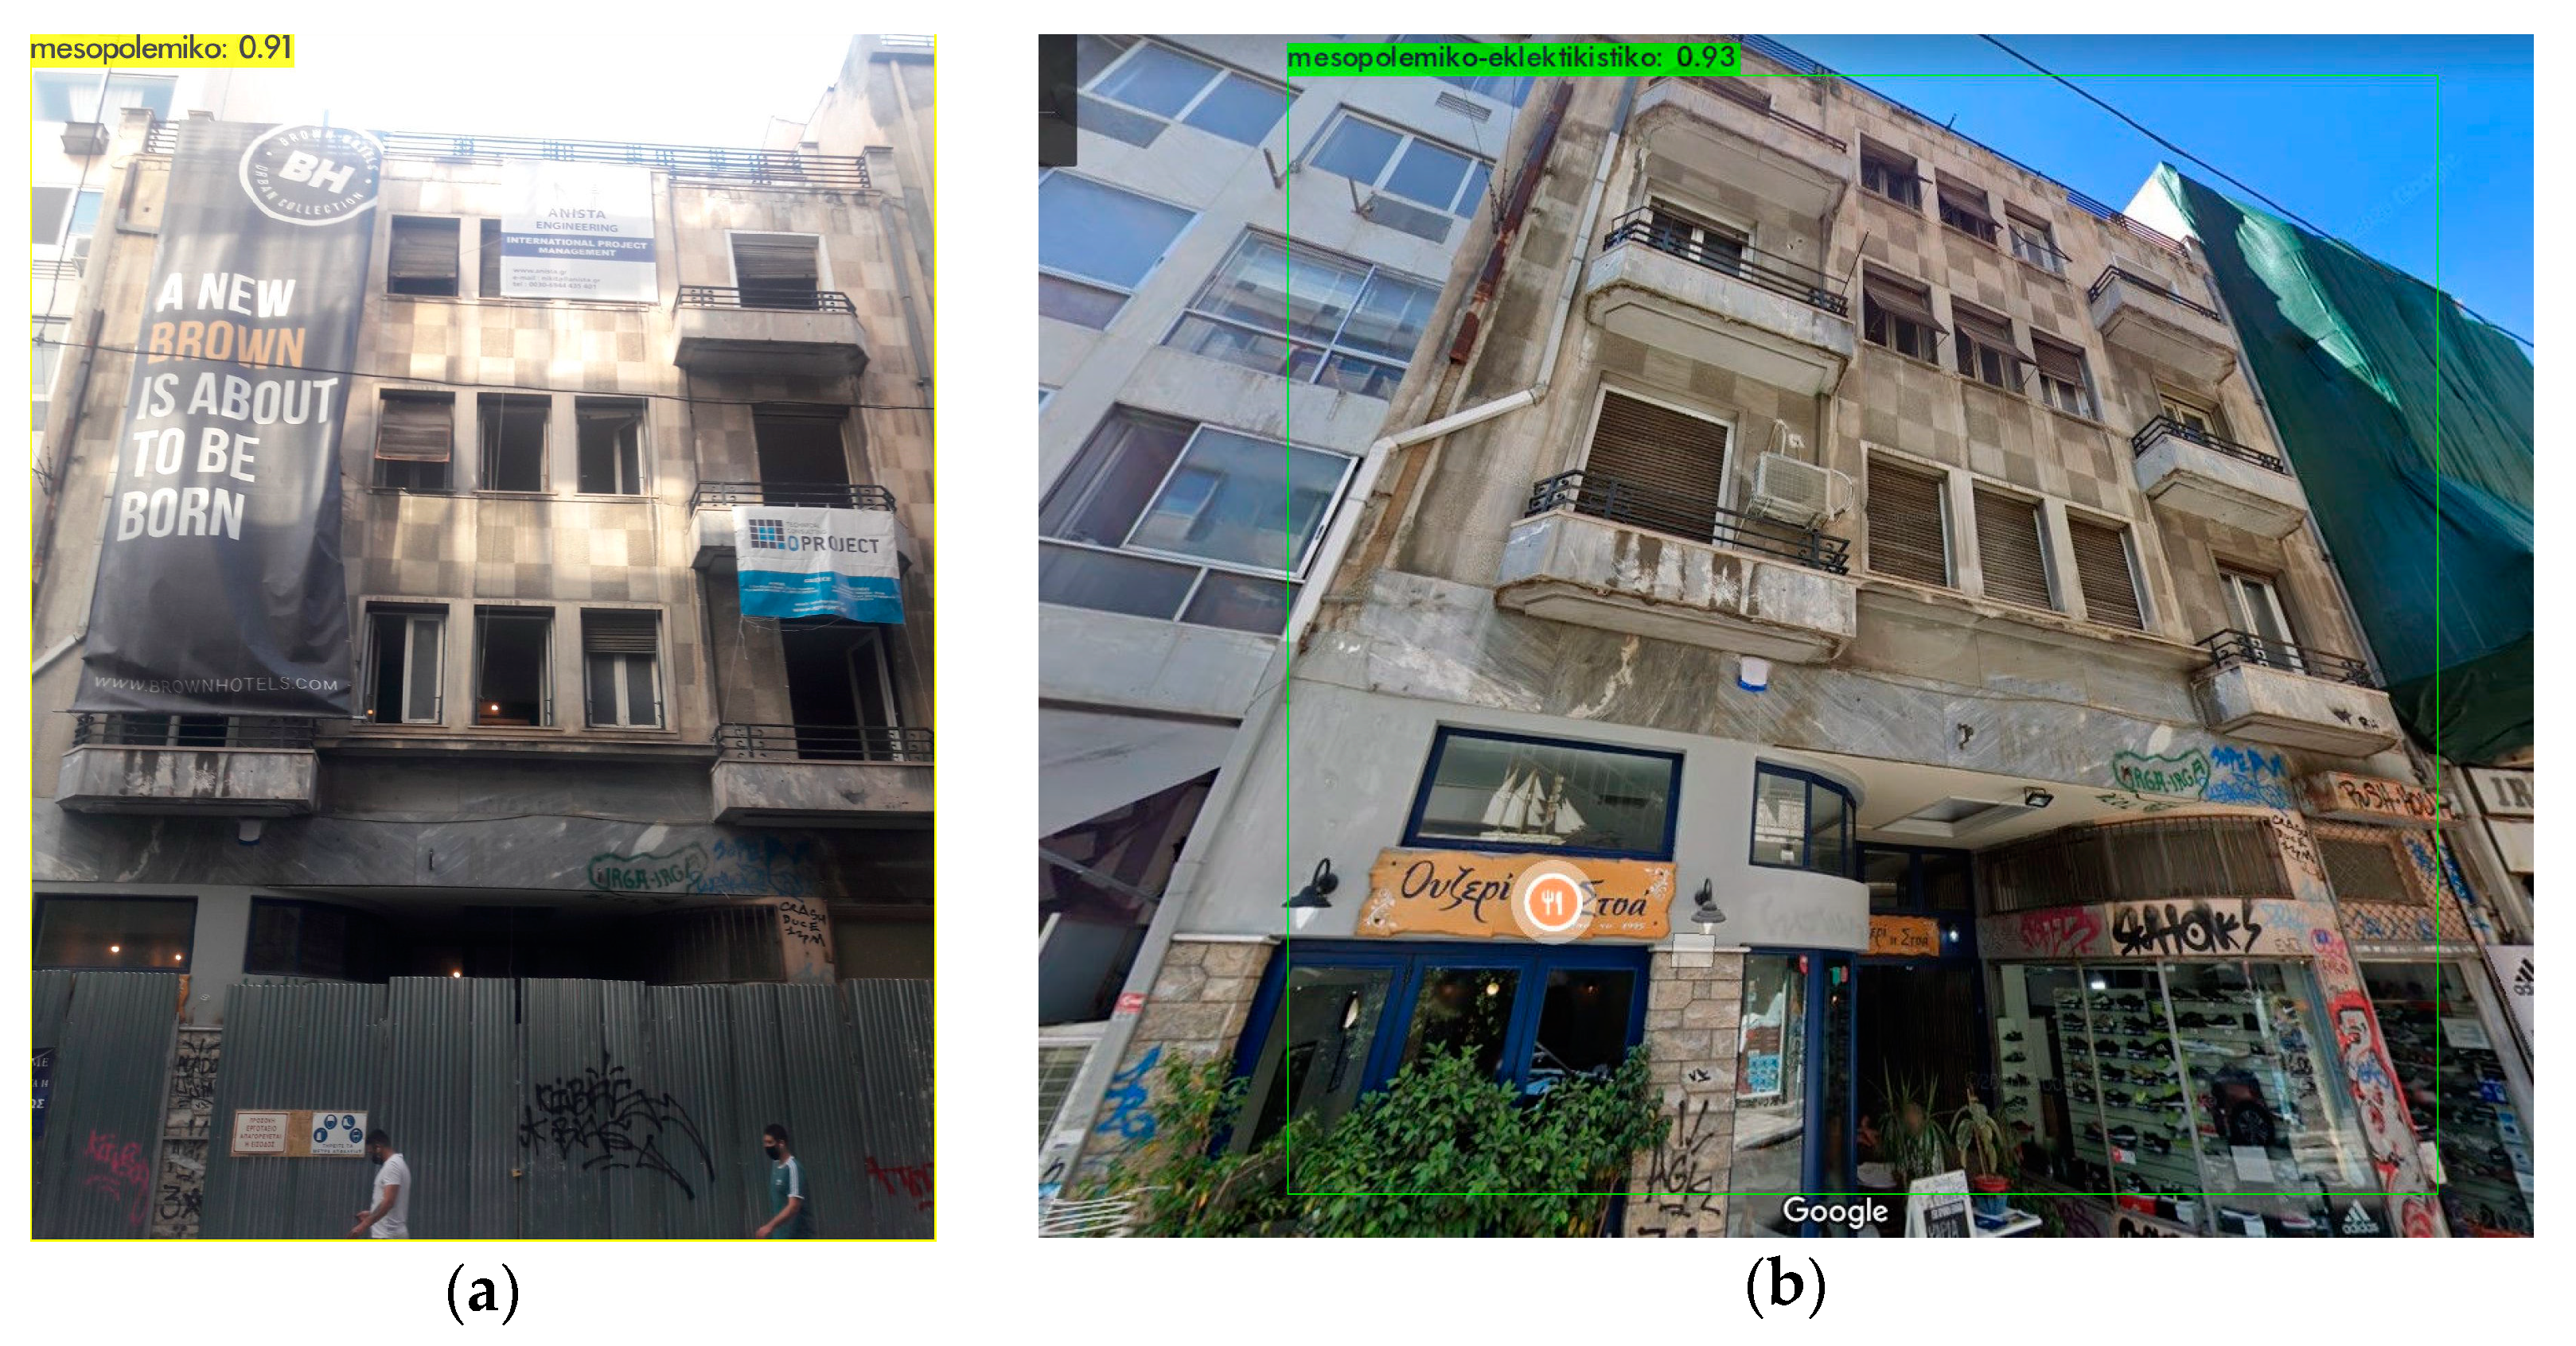
In some cases, photographs of the same building from different angles or shot at different time periods or in different illumination conditions were classified in different classes (Figure 19);
(3)
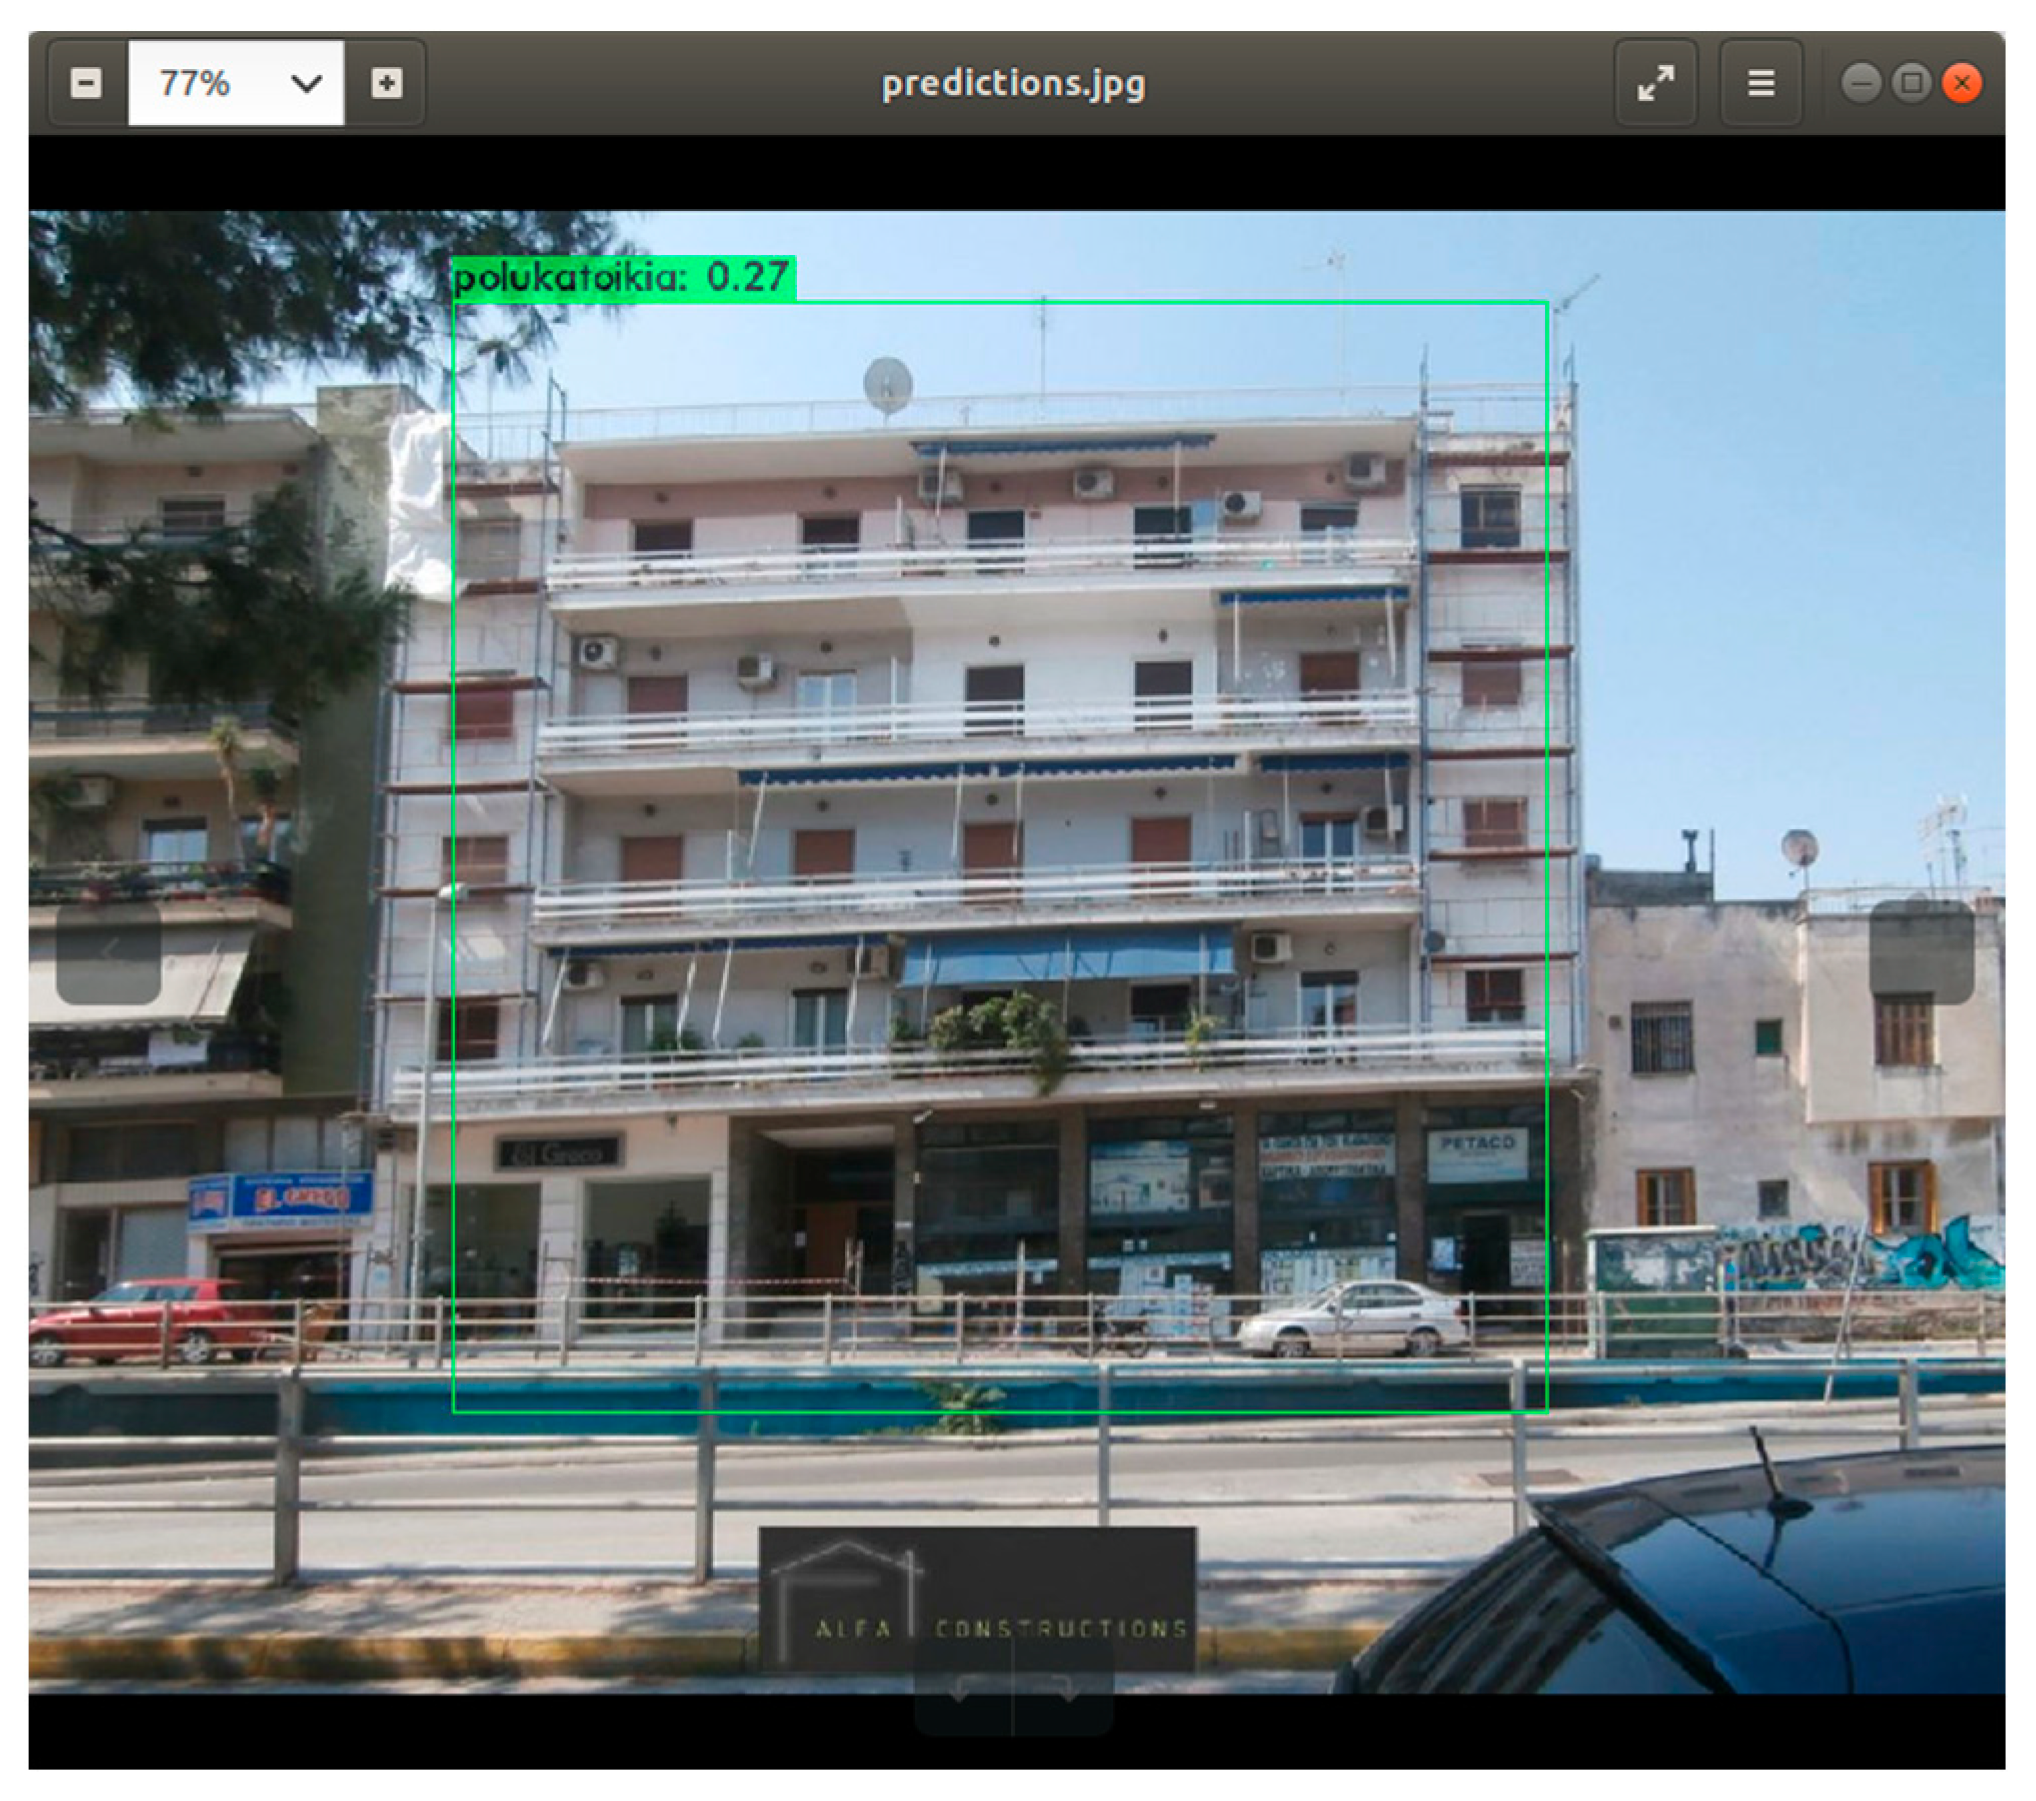
The transitional periods of the neoclassical-eclectic and the interwar-eclectic classes present the lowest prediction scores. On the contrary, the classes of neoclassical, interwar, and apartment buildings, which appear to have more distinctive characteristics, are more easy to classify.
Those three facts confirm the complexity of the classification problem and lead us to the conclusion that, in order to get more accurate results, more building images are needed in the data set to minimize the possibility of misclassifications.
All the above results were further tested in the third case study that was implemented on an area at the scale of a neighborhood where the results were to a greater extent under control.
The indirect shooting angle was highlighted as the main reason for misclassification, followed by the low photo resolution combined with occlusions caused by tree foliage.
In general, we can conclude that, with the model we implemented, we can successfully identify 3/4 of the urban building stock of Athens. In this way, we can locate concentrations of historic urban buildings and have a first general assessment of the image of the city and its structural condition, especially from the perspective of the Historic Urban Landscapes (HUL) approach, which emphasizes the need to reconnect heritage to the urban landscape (cultural and natural) [64].
However, the results are more encouraging and the prediction rates more promising (a) if we take into account the wrong predictions that classify the buildings in periods related to those they belong to; (b) if we have more than two images of each building (preferably an odd number), as the success rate for prediction of the right class is significantly increased; and (c) if we have the right in situ shots, e.g., with the help of a UAV drone that can scan buildings at the level of the first floor or above in a few minutes and deliver a multitude of georeferenced images [65].

7. Conclusions

Deep learning allows for the incorporation of large amounts of data and diverse input sources, allowing for a more comprehensive analysis of architectural styles. As discussed in the related literature section, deep learning algorithms can utilize not only images of buildings but also other data sources, such as historical records and architectural plans, providing a more holistic view of the style being classified.
Supporters of deep learning for architectural style classification argue that this method allows for more accurate and efficient identification of styles. For example, deep learning algorithms were able to classify architectural styles with a high degree of accuracy, even when faced with variations in lighting, camera angle, and other factors that can affect image quality.
One advantage of the YOLO algorithm is its ability to make predictions on multiple objects in an image simultaneously, making it well suited for detecting cultural heritage buildings in a single image. Additionally, its real-time performance allows for the quick and efficient classification of CH buildings in large data sets.
However, critics argue that analyses of architectural style classification using data extracted from the internet can perpetuate biases and inaccuracies [10]. For that reason, deep learning algorithms trained on biased data sets can result in incorrect classifications, particularly for styles that are underrepresented in the training data. Additionally, deep learning algorithms may not be able to accurately classify styles that are not well defined or that blend elements from multiple styles, leading to confusion and errors.
Nonetheless, the constant discussion and research of the optimal digital management of cultural heritage through new original methods, techniques, tools, and accessible technologies proves the need for, and the importance of, classification and recording of the evolution of historical buildings as a first step in evaluating their importance and therefore in ensuring their protection and preservation.
With deep learning, a new scientific cooperation is defined, which is in a process of continuous development and is a challenge for modern researchers. This research work contributes to the advancement of the digital management of tangible CH and reconsiders the outcomes below:
  • The classification of buildings’ typologies is an extremely complex issue, especially when it comes to the study of characteristics that change over time, due to their possibly different construction phases and different architectural interventions;
  • There is a strong need to limit through modeling the variables that describe the evolution and change of building typology in order to evaluate the importance of AI in comparison to manual methods;
  • The imperative need for a multidisciplinary approach and research that requires the development of new methodologies, multicriteria models, and tools, and that requires cooperation and the convergence of the expertise of researchers from different scientific disciplines (an interdisciplinary and transdisciplinary approach) is not disputed;
  • The recent literature highlights the importance of new technologies, and especially information technology, as a catalyst for the development of research in the specific cognitive area of culture, and the acceleration and promotion of research with new original methods is considered imperative today.
Considering the above, the proposed method of implementing the YOLO object detection system contributes to saving time compared to traditional manual techniques of CH classification and gives us the motivation to expand our study area to more classes and cities, as the capital, Athens, influenced over time the architecture of the entire Greek region. Moreover, neoclassicism, eclecticism, and the Modern Movement are pan-European architectural styles. Additionally, in order to extend our work in the future, we intend to use photographs taken by UAVs, as with the use of drones, the evaluation of an area can be executed in a limited period of time. In this way, we can identify the building infrastructure of the building blocks under consideration and give approximate results that show the trends that follow the adoption of specific strategic decisions. This cannot in any case concern final decisions, e.g., demolition, on specific buildings, especially the historical ones, as it is known that each monument is a special case that requires an individual and in-depth examination. The generalization and classification can serve large-scale supervision, which is deemed necessary for the formulation of policies that favor holistic urban studies and the finding of incentives and financial tools for conservation and renovation, etc., both at the level of the municipality as well as at regional and national levels. Nevertheless, the intervention in each individual unit remains always in accordance with the principles of restoration and the relevant legislation, which is an issue that requires specialized scientific study.

Author Contributions

Conceptualization, K.S.; methodology, K.S. and C.-N.A. Anagnostopoulos.; validation, K.S. and C.-N.A. Anagnostopoulos.; formal analysis, K.S.; investigation, K.S.; resources, K.S.; data curation, K.S.; writing—original draft preparation, K.S.; writing—review and editing, K.S. and C.-N.A. Anagnostopoulos.; supervision, C.-N.A. Anagnostopoulos. All authors have read and agreed to the published version of the manuscript.

Funding

This research has been partly supported by the MSc Digital Culture, Smart Cities, IoT & ADT, University of Piraeus.

Data Availability Statement

The full data set can be made available upon request to the authors of the article. A sample data set is available in the following link: https://doi.org/10.5281/zenodo.7781691 (accessed on 11 April 2023).

Acknowledgments

The publication of this paper has been partly supported by the University of Piraeus Research Center (UPRC).

Conflicts of Interest

The authors declare no conflict of interest.

References

  1. Sun, M.; Zhang, F.; Duarte, F.; Ratti, C. Understanding architecture age and style through deep learning. Cities 2022, 128, 103787. [Google Scholar] [CrossRef]
  2. Kremmyda, A.; Siountri, K.; Anagnostopoulos, I. Vra Core 4.0 Metadata Standard for the Facades of the Historic Houses of Athens (19th–Early 20th Century). In TMM_CH 2021: Trandisciplinary Multispectral Modelling and Cooperation for the Preservation of Cultural Heritage; Moropoulou, A., Georgopoulos, A., Doulamis, A., Ioannides, M., Ronchi, A., Eds.; Springer: Cham, Switzerland, 2022; pp. 66–78. [Google Scholar]
  3. Chaidas, K.; Tataris, G.; Soulakellis, N. Post-earthquake 3D building model (LOD2) generation from UAS imagery: The case of Vrisa traditional settlement, Lesvos, Greece. Int. Arch. Photogramm. Remote Sens. Spat. Inf. Sci. 2020, 44, 165–172. [Google Scholar] [CrossRef]
  4. Triantafylopoulos, N. Preserved Buildings: The Legal and Economic Basis of the Obligation to Provide State aid for Their Restoration and Reuse, Research Series, TMXPPA-PH. 2017, 23, 89–120. Available online: https://pithos.okeanos.grnet.gr/public/rFxt4KcVH0vXmjicOiSlK6 (accessed on 15 January 2023).
  5. A Renovation Wave for Europe—Greening our Buildings, Creating Jobs, Improving Lives (2020). Available online: https://eur-lex.europa.eu/legal-content/EN/TXT/?qid=1603122220757&uri=CELEX:52020DC0662 (accessed on 15 January 2023).
  6. New European Bauhaus, (2021). Available online: https://europa.eu/new-european-bauhaus/about/about-initiative_en (accessed on 15 January 2023).
  7. Foster, G. Circular economy strategies for adaptive reuse of cultural heritage buildings to reduce environmental impacts. Resour. Conserv. Recycl. 2020, 152, 104507. [Google Scholar] [CrossRef]
  8. Pendlebury, J.; Mark, S.; Loes, V.; Wout van der Toorn, V.; Declan, R. After the Crash: The Conservation-Planning Assemblage in an Era of Austerity. Eur. Plan. Stud. 2020, 28, 672–690. [Google Scholar] [CrossRef]
  9. Veldpaus, L.; Pendlebury, J. Heritage as a Vehicle for Development: The Case of Bigg Market, Newcastle upon Tyne. Plan. Pract. Res. 2019, 1–15. [Google Scholar] [CrossRef]
  10. Ginzarly, P.; Roders, A.; Teller, J. Mapping historic urban landscape values through social media. J. Cult. Herit. 2019, 36, 1–11. [Google Scholar] [CrossRef]
  11. Vassi, A.; Siountri, K.; Papadaki, K.; Iliadi, A.; Ypsilanti, A.; Bakogiannis, E. The Greek Urban Policy Reform through the Local Urban Plans (LUPs) and the Special Urban Plans (SUPs), Funded by Recovery and Resilience Facility (RRF). Land 2022, 11, 1231. [Google Scholar] [CrossRef]
  12. A European Green Deal (2020). Available online: https://commission.europa.eu/strategy-and-policy/priorities-2019-2024/european-green-deal_el (accessed on 15 March 2023).
  13. Buildings Inventory, (2011), Greek Statistical Authority. Available online: https://www.statistics.gr/el/2021-buildings-census (accessed on 15 January 2023).
  14. Archaeological Land Register. Available online: https://www.arxaiologikoktimatologio.gov.gr/ (accessed on 15 January 2023).
  15. Archive of Traditional Settlements and Listed Buildings. Available online: http://estia.minenv.gr/ (accessed on 15 January 2023).
  16. Available online: https://www.monumenta.org/article.php?IssueID=4&perm=1&ArticleID=1024&CategoryID=23&lang=gr (accessed on 15 January 2023).
  17. ModMovAthens. Available online: https://www.kolofotias.com/portfolio/mod-mov-athens/ (accessed on 15 January 2023).
  18. Listed Buildings Archive. Available online: https://diathrhtea.blogspot.com/?fbclid=IwAR3vNDbVKJgQOrEQ_CjlgEHJ8BA4QgFfJKcbWIzCnUPi8kUGsYkHQmC7cdo (accessed on 15 January 2023).
  19. Interesting Architecture of Athens. Available online: http://www.zee.gr/architecture/ (accessed on 15 January 2023).
  20. Summerson, J. The Classical Language of Architecture; The MIT Press: Cambridge, MA, USA, 1992. [Google Scholar]
  21. Balafoutis, T.; Zerefos, S. A database of architectural details: The case of neoclassical façades elements. In Proceedings of the International Conference—BRAU4, Biennial of Architectural and Urban Restoration, Athens, Greece, 15–30 April 2018; pp. 15–30. [Google Scholar]
  22. Katsibokis, G. Ktiriothiki: The architectural heritage of Athens, 1830–1950. J. Mod. Greek Stud. 2013, 31, 133–149. [Google Scholar] [CrossRef]
  23. Biris, M. Athinaiki Arhitektoniki 1875–1925 [Athenian Architecture 1875–1925]; Melissa: Athens, Greece, 2003. [Google Scholar]
  24. Vaiou, D. Milestones in the urban history of Athens. Treb. De La Soc. Catalana De Geogr. 2002, 53, 209–226. [Google Scholar]
  25. McCulloch, W.S.; Pitts, W. A logical calculus of the ideas immanent in nervous activity. Bull. Math. Biophys. 1943, 5, 115–133. [Google Scholar] [CrossRef]
  26. Voulodimos, A.; Doulamis, N.; Doulamis, A.; Protopapadakis, E. Deep Learning for Computer Vision: A Brief Review. Comput. Intell. Neurosci. 2018, 2018, 7068349. [Google Scholar] [CrossRef] [PubMed]
  27. Deng, L. Artificial intelligence in the rising wave of deep learning: The historical path and future outlook [perspectives]. IEEE Signal. Process. Mag. 2018, 35, 177–180. [Google Scholar] [CrossRef]
  28. Feldman, M. 10 Real-World Examples of Machine Learning and AI. 2018. Available online: https://omdena.com/blog/machine-learning-examples/ (accessed on 15 January 2023).
  29. Redmon, J.; Divvala, S.; Girshick, R.; Farhadi, A. You look only once: Unified real-time object detection. arXiv 2015, arXiv:1506.02640. [Google Scholar]
  30. Li, M.; Zhang, Z.; Lei, L.; Wang, X.; Guo, X. Agricultural greenhouses detection in high-resolution satellite images based on convolutional neural networks: Comparison of faster R-CNN, YOLO v3 and SSD. Sensors 2020, 20, 4938. [Google Scholar] [CrossRef] [PubMed]
  31. Girshick, R.; Donahue, J.; Darrell, T.; Malik, J. Rich Feature Hierarchies for Accurate Object Detection and Semantic Segmentation. In Proceedings of the 2014 IEEE Conference on Computer Vision and Pattern Recognition, Columbus, OH, USA, 23–28 June 2014; pp. 580–587. [Google Scholar] [CrossRef] [Green Version]
  32. Ren, S.; He, K.; Girshick, R.B.; Sun, J. Faster R-CNN: Towards Real-Time Object Detection with Region Proposal Networks. IEEE Trans. Pattern Anal. Mach. Intell. 2015, 39, 1137–1149. [Google Scholar] [CrossRef] [Green Version]
  33. Redmon, J.A.; Farhadi, A. YOLO9000: Better, Faster, Stronger. In Proceedings of the 2017 IEEE Conference on Computer Vision and Pattern Recognition (CVPR), Honolulu, HI, USA, 21–26 July 2017; pp. 6517–6525. [Google Scholar] [CrossRef] [Green Version]
  34. Bochkovskiy, A.; Wang, C.; Liao, H.M. YOLOv4: Optimal Speed and Accuracy of Object Detection. arXiv 2020, arXiv:2004.10934. [Google Scholar]
  35. Redmon, J.; Farhadi, A. Yolov3: An incremental improvement. arXiv 2018, arXiv:1804.02767. [Google Scholar]
  36. Xue, J.; Zheng, Y.; Dong-Ye, C.; Wang, P.; Yasir, M. Improved YOLOv5 network method for remote sensing image-based ground objects recognition. Soft Comput. 2022, 26, 10879–10889. [Google Scholar] [CrossRef]
  37. Kioussi, A.; Karoglou, M.; Protopapadakis, E.; Doulamis, A.; Ksinopoulou, E.; Bakolas, A.; Moropoulou, A. A computationally assisted cultural heritage conservation method. J. Cult. Herit. 2021, 48, 119–128. [Google Scholar] [CrossRef]
  38. Mathias, M.; Martinovic, A.; Weissenberg, J.; Haegler, S.; Van Gool, L. Automatic architectural style recognition. ISPRS-Int. Arch. Photogramm. Remote Sens. Spat. Inf. Sci. 2011, 3816, 171–176. [Google Scholar] [CrossRef] [Green Version]
  39. Shalunts, G.; Haxhimusa, Y.; Sablatnig, R. Architectural style classification of building facade windows. In International Symposium on Visual Computing; Springer: Berlin/Heidelberg, Germany, 2011; pp. 280–289. [Google Scholar]
  40. Shalunts, G.; Haxhimusa, Y.; Sablatnig, R. Classification of gothic and baroque architectural elements. In Proceedings of the 19th International Conference on Systems, Signals and Image Processing (IWSSIP), Vienna, Austria, 11–13 April 2012; IEEE: New York, NY, USA, 2012; pp. 316–319. [Google Scholar]
  41. Shalunts, G.; Cerman, M.; Albertini, D. Detection of sculpted faces on building facades. In Proceedings of the Asia-Pacific Signal. and Information Processing Association Annual Summit and Conference (APSIPA ASC), Kuala Lumpur, Malaysia, 12–15 December 2017; IEEE: New York, NY, USA, 2017; pp. 677–685. [Google Scholar]
  42. Mercioni, M.A.; Holban, S. The recognition of the architectural style using Data Mining techniques. In Proceedings of the IEEE 12th International Symposium on Applied Computational Intelligence and Informatics (SACI), Timisoara, Romania, 17–19 May 2018; IEEE: New York, NY, USA, 2018; pp. 000331–000338. [Google Scholar]
  43. Llamas, J.; Lerones, P.M.; Zalama, E.; Gómez-García-Bermejo, J. Applying deep learning techniques to cultural heritage images within the inception project. In Digital Heritage. Progress in Cultural Heritage: Documentation, Preservation, and Protection, Proceedings of the Euro-Mediterranean Conference, Nicosia, Cyprus, 31 October–5 November 2016; Springer: Cham, Switzerland, 2016; pp. 25–32. [Google Scholar]
  44. Schmitz, M.; Mayer, H. A convolutional network for semantic facade segmentation and interpretation. Int. Arch. Photogramm. Remote. Sens. Spat. Inf. Sci. 2016, 41, 709. [Google Scholar] [CrossRef] [Green Version]
  45. Pesto, C. Classifying US Houses by Architectural Style Using Convolutional Neural Networks. 2017. Available online: http://cs231n.stanford.edu/reports/2017/pdfs/126.pdf (accessed on 15 January 2023).
  46. Guo, K.; Li, N. Research on classification of architectural style image based on new cognitive area network. In Proceedings of the IEEE 3rd Information Technology and Mechatronics Engineering Conference (ITOEC), Chongqing, China, 3–5 October 2017; IEEE: New York, NY, USA, 2017; pp. 1062–1066. [Google Scholar]
  47. Laupheimer, D.; Haala, N. Deep Learning for the Classification of Building Facades, Publikationen der DGPF, Band 27, 2018, pp. 701–709. Available online: https://www.dgpf.de/src/tagung/jt2018/proceedings/proceedings/papers/28_PFGK18_KKN_01_Laupheimer_Haala.pdf (accessed on 15 January 2023).
  48. Li, Y.; Chen, Y.; Rajabifard, A.; Khoshelham, K.; Aleksandrov, M. Estimating building age from Google Street View images using deep learning (short paper). In Proceedings of the 10th International Conference on Geographic Information Science (GIScience), Melbourne, Australia, 28–31 August 2018; Schloss Dagstuhl-Leibniz-Zentrum fuer Informatik: Wadern, Germany, 2018. [Google Scholar]
  49. Zou, Z.; Zhao, X.; Zhao, P.; Qi, F.; Wang, N. CNN-based statistics and location estimation of missing components in routine inspection of historic buildings. J. Cult. Herit. 2019, 38, 221–230. [Google Scholar] [CrossRef]
  50. Dautov, E.; Astafeva, N. Convolutional Neural Network in the Classification of Architectural Styles of Buildings. In Proceedings of the IEEE Conference of Russian Young Researchers in Electrical and Electronic Engineering (ElConRus), St. Petersburg, Russia, 26–29 January 2021; IEEE: New York, NY, USA, 2021; pp. 274–277. [Google Scholar]
  51. Ji, S.Y.; Jun, H.J. Deep learning model for form recognition and structural member classification of east asian traditional buildings. Sustainability 2020, 12, 5292. [Google Scholar] [CrossRef]
  52. Kioussi, A.; Doulamis, A.; Karoglou, M.; Moropoulou, A.I. Cultural Intelligence-Investigation of Different Systems for Heritage Sustainable Preservation. Int. J. Art Cult. Des. Technol. (IJACDT) 2020, 9, 15. [Google Scholar] [CrossRef]
  53. Kallibretakis, L Athens in the 19th Century: From a Provincial City of the Ottoman Empire to the Capital of the Hellenic Kingdom. Available online: https://archaeologia.eie.gr/archaeologia/gr/chapter_more_9.aspx (accessed on 15 January 2023).
  54. Mpirēs, M.G.; Birēs, M.G.; Kardamitsi-Adami, M.; Kardamitsē-Adamē, M. Neoclassical Architecture in Greece; Getty Publications: Los Angeles, CA, USA, 2004. [Google Scholar]
  55. Kydoniatis, S. Greek Architectural Renaissance and Its Maltreatment; The Academy of Athens Press: Athina, Athens, 1980. [Google Scholar]
  56. Lavvas, G. A Brief History of Architecture with an Emphasis on the 19th and 20th Centuries; University Studio Press: Thessaloniki, Greece, 2008. [Google Scholar]
  57. Athanassiou, E.; Dima, V.; Karali, K.; Belli, G.; Capano, F.; Pascariello, M.I. Modern Architectural Encounters and Greek Antiquity in the Thirties. In La Citta, Il Viaggio, Il Tourismo: Percezione, Produzione e Transformazione. The City, the Travel, the Tourism: Perception, Production and Processing; FedOA-Federico II University Press: Naples, Italy‎, 2017; pp. 347–354. Available online: https://scholar.google.com/scholar?hl=el&as_sdt=0%2C5&q=Athanassiou%2C+E.%3B+Dima%2C+V.%3B+Karali%2C+K.%3B+Belli%2C+G.%3B+Capano%2C+F.%3B+Pascariello%2C+M.I.+Modern+architectural+encounters+and+Greek+an-tiquity+in+the+thirties.+In+La+Citta%2C+Il+Viaggio% (accessed on 15 January 2023).
  58. Fessas–Emmanouil, H. The Role and Work of Architects in Athens in the Second Half of the 20th Century: A Brief Outline. In BALKAN CAPITALS from the 19th to the 21st Century; p. 90. Available online: https://d1wqtxts1xzle7.cloudfront.net/53017870/BALKAN_CAPITALS_edu-libre.pdf?1494058447=&response-content-disposition=inline%3B+filename%3DBALKAN_CAPITALS_FROM_THE_19th_TO_THE_21s.pdf&Expires=1681296277&Signature=Dq7wlRXhf~C-qB~~Dk2lVyZY8l4i~zPSF20v0DhKGUjzPGO1OfGMENu-14k~hoWY37tbVC0PDSJGz-AOcs2HTQ7Tg3wafTi0hloaZ909rzU4fuSyk5clUM5OGOQN1~JiEIu1S5ENj9Gmg8Z0ZbsnPEwjP2HyECc743i3zQNBuwQ1WyL5JTp7RdmkuTz7mt4ZoxZJDFXU~ic81BGCqAAX9FZQSzITIUwjQ2LD~0WVh841DJmbf~A3wrwBMr52YctZGiSOzYYyFcAV3Mr3J8u7ed-21dSoltFOjSstgwU~0xSZdkeJB-9CnWvItExqi0gg8OeCL4Vj1OGqu1TXUmxd5A__&Key-Pair-Id=APKAJLOHF5GGSLRBV4ZA#page=91 (accessed on 15 January 2023).
  59. Woditsch, R. Τhe Public Private House: Modern and Its Polykatoikia; Park. Books: Zurich, Switzerland, 2018. [Google Scholar]
  60. Filippides, D. 1984 Neo-Hellenic Architecture; Melissa: Athens, Greece, 2003. [Google Scholar]
  61. Ćosović, M.; Janković, R. CNN Classification of the Cultural Heritage Images. In Proceedings of the 2020 19th International Symposium INFOTEH-JAHORINA (INFOTEH), East Sarajevo, Bosnia and Herzegovina, 18–20 March 2020; IEEE: New York, NY, USA, 2020; pp. 1–6. [Google Scholar] [CrossRef]
  62. Laroca, R.; Severo, E.; Zanlorensi, L.A.; Oliveira, L.S.; Gonçalves, G.R.; Schwartz, W.R.; Menotti, D. A robust real-time automatic license plate recognition based on the YOLO detector. In Proceedings of the International Joint Conference on Neural Networks (IJCNN), Rio de Janeiro, Brazil, 8–13 July 2018; IEEE: New York, NY, USA, 2018; pp. 1–10. [Google Scholar]
  63. Available online: https://github.com/AlexeyAB/darknet (accessed on 10 December 2020).
  64. Palaiologou, G.; Fouseki, K. New Perspectives in Urban Heritage—Theory, Policy and Practice. Hist. Environ. Policy Pract. 2018, 9, 175–179. [Google Scholar] [CrossRef]
  65. Skondras, E.; Siountri, K.; Michalas, A.; Vergados, D.D. A route selection scheme for supporting virtual tours in sites with cultural interest using drones. In Proceedings of the 2018 9th International Conference on Information, Intelligence, Systems and Applications (IISA), Zakynthos, Greece, 23–25 July 2018; IEEE: New York, NY, USA, 2018; pp. 1–6. [Google Scholar]
Figure 1. (a) Neoclassical architecture; (b) neoclassical-eclectic building; (c) eclectic-interwar building; (d) interwar architecture; (e) postwar architecture. by Google Street View.
Heritage 06 00195 g001aHeritage 06 00195 g001b
Figure 2. Mean average precision diagram.
Heritage 06 00195 g002
Figure 3. Average loss diagram.
Heritage 06 00195 g003
Figure 4. Image of neoclassical building with corbels.
Heritage 06 00195 g004
Figure 5. Image with multiple elements.
Heritage 06 00195 g005
Figure 6. mAP diagram.
Heritage 06 00195 g006
Figure 7. Diagram of average loss.
Heritage 06 00195 g007
Figure 8. The mAP metric in relation to the increase in the training repetitions of the three classes.
Heritage 06 00195 g008
Figure 9. Building labeled as neoclassical.
Heritage 06 00195 g009
Figure 10. Apartment (postwar) building.
Heritage 06 00195 g010
Figure 11. (a) mAP and (b) average loss diagrams.
Heritage 06 00195 g011
Figure 12. Architecture diagram of the model.
Heritage 06 00195 g012
Figure 13. (a) Top satellite view and of the case study area (b) topographical map of the case study area, in the center of Athens.
Heritage 06 00195 g013
Figure 14. The classification of the typology of the buildings in the examined area.
Heritage 06 00195 g014
Figure 15. The apartment building in Mavrokordatou St.
Heritage 06 00195 g015
Figure 16. Two buildings, an interwar (a) and a neoclassical (b) in Theomistokleous St. by Google Street View.
Heritage 06 00195 g016
Figure 17. The two buildings of Figure 16 in Theomistokleous St., fully represented in CAD design.
Heritage 06 00195 g017
Figure 18. Sample of images of the main classes.
Heritage 06 00195 g018
Figure 19. (a) The interwar building is labeled correctly on the left in situ image, despite being partly covered (b) The same interwar building is labeled wrongly in the right image by Google Street View.
Heritage 06 00195 g019
Table 1. The source of the data set.
Source:
Social Media
Source:
Camera
Source:
Google Street View
Available
Data Set Images
2100185025506500
Table 2. Layers of the custom multilayer YOLO configuration.
LayerFiltersSizeInputOutput
1Conv643 × 3/2608 × 608 × 64304 × 304 × 64
2Conv641 × 1/1304 × 304 × 64304 × 304 × 64
3Route1 304 × 304 × 64
4Conv641 × 1/1304 × 304 × 64304 × 304 × 64
5Conv321 × 1/1304 × 304 × 64304 × 304 × 32
6Conv643 × 3/1304 × 304 × 32304 × 304 × 64
7Shortcut Layer: 4 304 × 304 × 64
8Conv641 x1/1304 × 304 × 64304 × 304 × 64
9Route8 2 304 × 304 × 128
10Conv641 × 1/1304 × 304 × 128304 × 304 × 64
11Conv1283 × 3/2304 × 304 × 64152 × 152 × 128
12Conv641 × 1/1152 × 152 × 128152 × 152 × 64
13Route11 152 × 152 × 128
14Conv641 × 1/1152 × 152 × 128152 × 152 × 64
15Conv641 × 1/1152 × 152 × 64152 × 152 × 64
16Conv643 × 3/1152 × 152 × 64152 × 152 × 64
17Shortcut Layer: 14 152 × 152 × 64
18Conv641 × 1/1152 × 152 × 64152 × 152 × 64
19Conv643 × 3/1152 × 152 × 64152 × 152 × 64
20Shortcut Layer: 17 152 × 152 × 64
Table 3. The architecture of the data set.
ClassImages of TrainingValidation ImagesSum
{door}13634170
{balcony}20248250
{window}17644220
{corbels}466116582
{door, window, balcony}782195977
Table 4. The architecture of the data set.
ClassImages of TrainingValidation ImagesSum
{neoclassical, interwar}13073271634
{neoclassical, interwar, apartment building}20175042521
{neoclassical,
neoclassical-eclectic, interwar,
interwar-eclectic, apartment building}
29127283641
Table 5. Parameters for the YOLO model.
Input resolution: 416 × 416 pixels
Number of classes: According to our experiment on the whole facade (not the architectural elements), our classes consisted of 2, 3, and 5 categories.
Number of detection layers: 3 detection layers, each responsible for detecting objects at different scales.
Confidence threshold: The parameter is set to 0.5, which indicates the minimum confidence score required for an object belonging to a class to be detected.
Non-max suppression threshold:0.45
Learning rate:0.001
Table 6. Confusion matrix 1.
ClassesNeoclassicalInterwarApartment BuildingsNeoclassical-EclecticInterwar-EclecticData Set (Photos)
Interwar631637635400
Interwar-Eclectic3184768100
Table 7. F1 metrics for confusion matrix 1.
ClassesNeoclassicalInterwarApartment BuildingsNeoclassical-EclecticInterwar-Eclectic
Precision0.9461078n/an/an/a0.660194
Recall0.79n/an/an/a0.68
F10.8610354n/an/an/a0.669951
Table 8. Confusion Matrix 2.
ClassesNeoclassicalInterwarApartment BuildingsNeoclassical-EclecticInterwar-EclecticData Set (Photos)
Neoclassical2037442220
Interwar217921325230
Apartment Buildings9291561511220
Neoclassical-Eclectic4210813911210
Interwar-Eclectic5235978120
Table 9. F1 metrics for confusion matrix 2.
ClassesNeoclassicalInterwarApartment BuildingsNeoclassical-EclecticInterwar-Eclectic
Precision 0.7777780.7217740.8041240.8176470.614173
Recall0.9227270.7782610.7090910.6619050.65
F10.8440750.7489540.7536230.7315790.631579
Table 10. Confusion Matrix 3.
ClassesNeoclassicalInterwarApartment BuildingsNeoclassical-EclecticInterwar-EclecticData Set (Photos)
Neoclassical500106
Interwar080019
Apartment Buildings4558101380
Neoclassical-Eclectic30012015
Interwar-Eclectic0002810
Table 11. F1 metrics for confusion matrix 3.
ClassesNeoclassicalInterwarApartment BuildingsNeoclassical-EclecticInterwar-Eclectic
Precision 0.4166670.61538510.480.363636
Recall0.8333330.8888890.6444440.80.8
F10.5555560.7272730.7837840.60.5
Table 12. The architecture of the data set.
ClassImages of TrainingValidation ImagesSum
{neoclassical,
neoclassical-eclectic, interwar,
interwar-eclectic, apartment building}
29127283641
{interwar}
(interwar-eclectic)
500500
{neoclassical,
neoclassical-eclectic, interwar,
interwar-eclectic, apartment building}
10001000
Total set of images 5141
Disclaimer/Publisher’s Note: The statements, opinions and data contained in all publications are solely those of the individual author(s) and contributor(s) and not of MDPI and/or the editor(s). MDPI and/or the editor(s) disclaim responsibility for any injury to people or property resulting from any ideas, methods, instructions or products referred to in the content.

