Article

Inside the Scriptorium: Non-Invasive In Situ Identification of Dyes in Illuminated Manuscripts by Microspectrofluorimetry and Multivariate Analysis: The Crescenzago Choir Books (End 15th Century) as a Case Study

1
Dipartimento di Chimica, Università degli Studi di Milano, 20133 Milano, Italy
2
Archivio Capitolare della Basilica di Sant’Ambrogio, 20123 Milano, Italy
3
Dipartimento di Studi Medioevali, Umanistici e Rinascimentali, Università Cattolica del Sacro Cuore, 20123 Milano, Italy
*
Author to whom correspondence should be addressed.
Heritage 2023, 6(2), 2006-2019; https://doi.org/10.3390/heritage6020108
Submission received: 30 December 2022 / Revised: 9 February 2023 / Accepted: 13 February 2023 / Published: 15 February 2023

Abstract

:
In the present work, a method is proposed that combines spectrofluorimetry with multivariate analysis (cluster and principal components) to non-invasively investigate natural dyes used, mainly in the form of lakes, in illuminations. First, a consistent number of mock-up samples of red and purple lakes (from brazilwood, madder, kermes, cochineal, lac dye, folium and orcein) were prepared following the recipes reported in ancient treatises, then the experimental conditions for their non-invasive investigation were optimized by benchtop instrumentation and transferred to a portable microprobe suitable for in situ analyses. For all the coloring materials examined, it was thus possible to obtain a satisfactory grouping of samples containing the same dye. The analytical protocol was finally extended to the characterization of dyes in the Crescenzago choir books, illuminated manuscripts dating back to the end of the 15th century.

1. Introduction

The analysis of colors in illuminated manuscripts represents a topic of great interest in the field of diagnostics and conservation of cultural heritage. Their knowledge, in fact, in addition to providing interesting information that can guide a restoration intervention, can help to deeply understand the illuminator’s artistic technique and cultural context, as well as to date the artifacts. Within this framework, a key role is played by natural organic dyes, which have been used to paint illuminations in association with traditional inorganic pigments. These natural substances were obtained from vegetable or animal sources and then often transformed into lakes, i.e., precipitated and absorbed on an inorganic substrate (alum is the most common) to be applied on parchment after dispersing it in a binder, typically egg white or gum arabic. Among the most popular dyes were brazilwood, madder, kermes, carmine or cochineal and lac dye, which were used to obtain red shades, and orcein, folium and indigo, which give purple and blue colors respectively and, unlike the previous ones, were used commonly as such and not in the form of lakes. Brazilwood, madder, orcein, folium and indigo were obtained from vegetable parts, while kermes, carmine (whose introduction into Europe followed to the discovery of America) and lac dye were extracted from insects belonging to different species. From these raw materials, a wide variety of recipes were then used to produce lakes with different hues, as documented in several ancient treatises. The use of dye mixture was also a common practice to obtain particular tints, e.g., purple could be a mixture of a red dye and a blue colorant, organic or inorganic. The glazing technique was also used, which involves spreading a thin layer of lake over an area that has already been painted with an inorganic pigment.
It is therefore evident that the matter of identifying dyes in illuminations is far from an easy subject. Furthermore, the spectroscopic techniques conventionally adopted for non-invasive analysis of pigments are not applicable. In fact, X-ray fluorescence (XRF) is an elemental technique suitable for the detection of elements with medium-to-high atomic numbers. Similarly, Fourier transform infrared spectroscopy (FTIR) is affected by the presence of the binder and the inorganic substrate of the lake, the signals of which are predominant over those of any dye, while Raman spectroscopy suffers from the problem of fluorescence emission associated with organic molecules. Also, since illuminated manuscripts are extremely delicate artifacts, it is discouraged (and generally prohibited by conservators) to take a sample that can be fully characterized by laboratory techniques widely used for dye identification, such as liquid chromatography combined with mass spectrometry (HPLC-MS) and SERS (surface-enhanced Raman spectroscopy), although these techniques have also been applied in some cases to the identification of dyes used in illuminated manuscripts [1,2,3,4,5]. As a non-invasive analytical method for this purpose, fiber optics reflectance spectroscopy (FORS) has been widely used [6,7,8,9], although this technique, based on electronic spectra, lacks the specificity typical, for example, of vibrational spectroscopy [10]. In this scenario, spectrofluorimetry represents a valuable method to non-invasively study dyes in illuminations. The chemical structure of these molecules, rich in double bonds and aromatic rings, favors their fluorescence emission and allows their characterization without interference from the inorganic matrix of the lake. Furthermore, although the fluorescence bands are also quite broad, being based on electronic transitions, the possibility of choosing different excitation wavelengths and the independence of the emission observed from the presence of other non-fluorescent coloring substances (unlike FORS) make the technique more specific. For this reason, spectrofluorimetry has already been successfully applied to the study of illuminated manuscripts [5,11,12,13,14,15,16]. However, most of these studies involve samples analyzed in the laboratory and, to our knowledge, only a few experiments directly on manuscripts have been reported [7,8,17,18].
Furthermore, the application of multivariate analysis methods, in particular cluster analysis, to differentiate historically accurate samples obtained with different recipes based on the same dye [12], as well as to discriminate different organic coloring substances [11], is reported. In fact, the use of multivariate analysis is a powerful strategy to interpret emission spectra—as already demonstrated for dyes in ancient textiles [19]—characterized by broad bands and variable emission maxima, which can be similar for lakes obtained from different dyes but slightly shifted for samples prepared with the same dye. However, once again, it is worth noting that most of these studies were performed on micro-samples of illuminated parchment exploiting benchtop instrumentation.
The aim of the present work is to develop a protocol based on spectrofluorimetry and multivariate analysis (principal component analysis [PCA] and cluster analysis [CA]) for the identification of natural dyes in situ, directly on ancient manuscripts by the use of a portable prototypal microprobe. Initially, the best conditions to excite the fluorescence emission of red and purple dyes were set by means of a benchtop spectrofluorimeter, and subsequently they were transferred to the probe by choosing suitable optical filters. Next, a large number of historically accurate mock-up samples of lakes spread on parchment, prepared according to different ancient recipes, were analyzed, and the spectral data were processed by mathematical processing (Kubelka–Munk correction and second derivative) and multivariate analysis. The Kubelka–Munk correction was applied to take into account the possibly different concentrations of the coloring substances [20,21], while the second derivative was calculated to enhance the differences between emission spectra. To our knowledge, this is the first example of the application of this procedure to a large series of lakes used in ancient illuminations, examined by portable instrumentation. The approach first proved to be promising for distinguishing the different dyes in the reference samples. Thus it was finally applied to the study of the colorants in two illuminated manuscripts from the end of the 15th century, the so-called Crescenzago choir books, allowing the identification of the dyes used to obtain red, fuchsia and purple hues. A graphical flowchart describing the protocol is reported in the Supplementary Materials (Figure S1).

2. Materials and Methods

2.1. Historically Accurate Samples

The samples analyzed were red or purple lakes spread on parchment using egg white or gum arabic as a binder. The recipes have been adapted from those reported in ancient treatises. In this regard, it is important to bear in mind that these procedures, in addition to being difficult to find in many cases, are not always easily understood; the quantities indicated are often hard to interpret and the composition of some ingredients can often be omitted. For these reasons, starting from an original recipe, several parameters were varied in the preparation process of the same lake, as described in Table S1 (Supplementary Materials). The dyes considered were cochineal, madder, brazilwood, lac dye and kermes for red, and orcein and folium for purple. Indeed, the use of all these colorants in illuminations is amply documented in ancient texts and has also been verified in the recent scientific studies cited above. In particular, most of them were precipitated on alum and applied on parchment with a suitable binder. Exceptions are represented by folium and orcein [5,22]. Folium, in particular, was commonly extracted from a cloth soaked in Chrozophora tinctoria seed juice and was used to paint as is, dissolved in water or mixed with egg white. [23] It was also common practice to mix this dye with burnt umber to obtain a darker purplish color or to apply it as a glaze over a layer painted with azurite or ultramarine [23]. Orcein, extracted from lichens such as Roccella tinctoria, has been most widely used as a textile dye but, to a lesser extent, also in painting [24,25].
Table 1 is a summary table of the lakes investigated in this work, reporting the historical sources of the recipe, as well as the acronyms that identify each sample in the data that will be presented. The corresponding color coordinates are listed in Table S2 (Supplementary Materials).

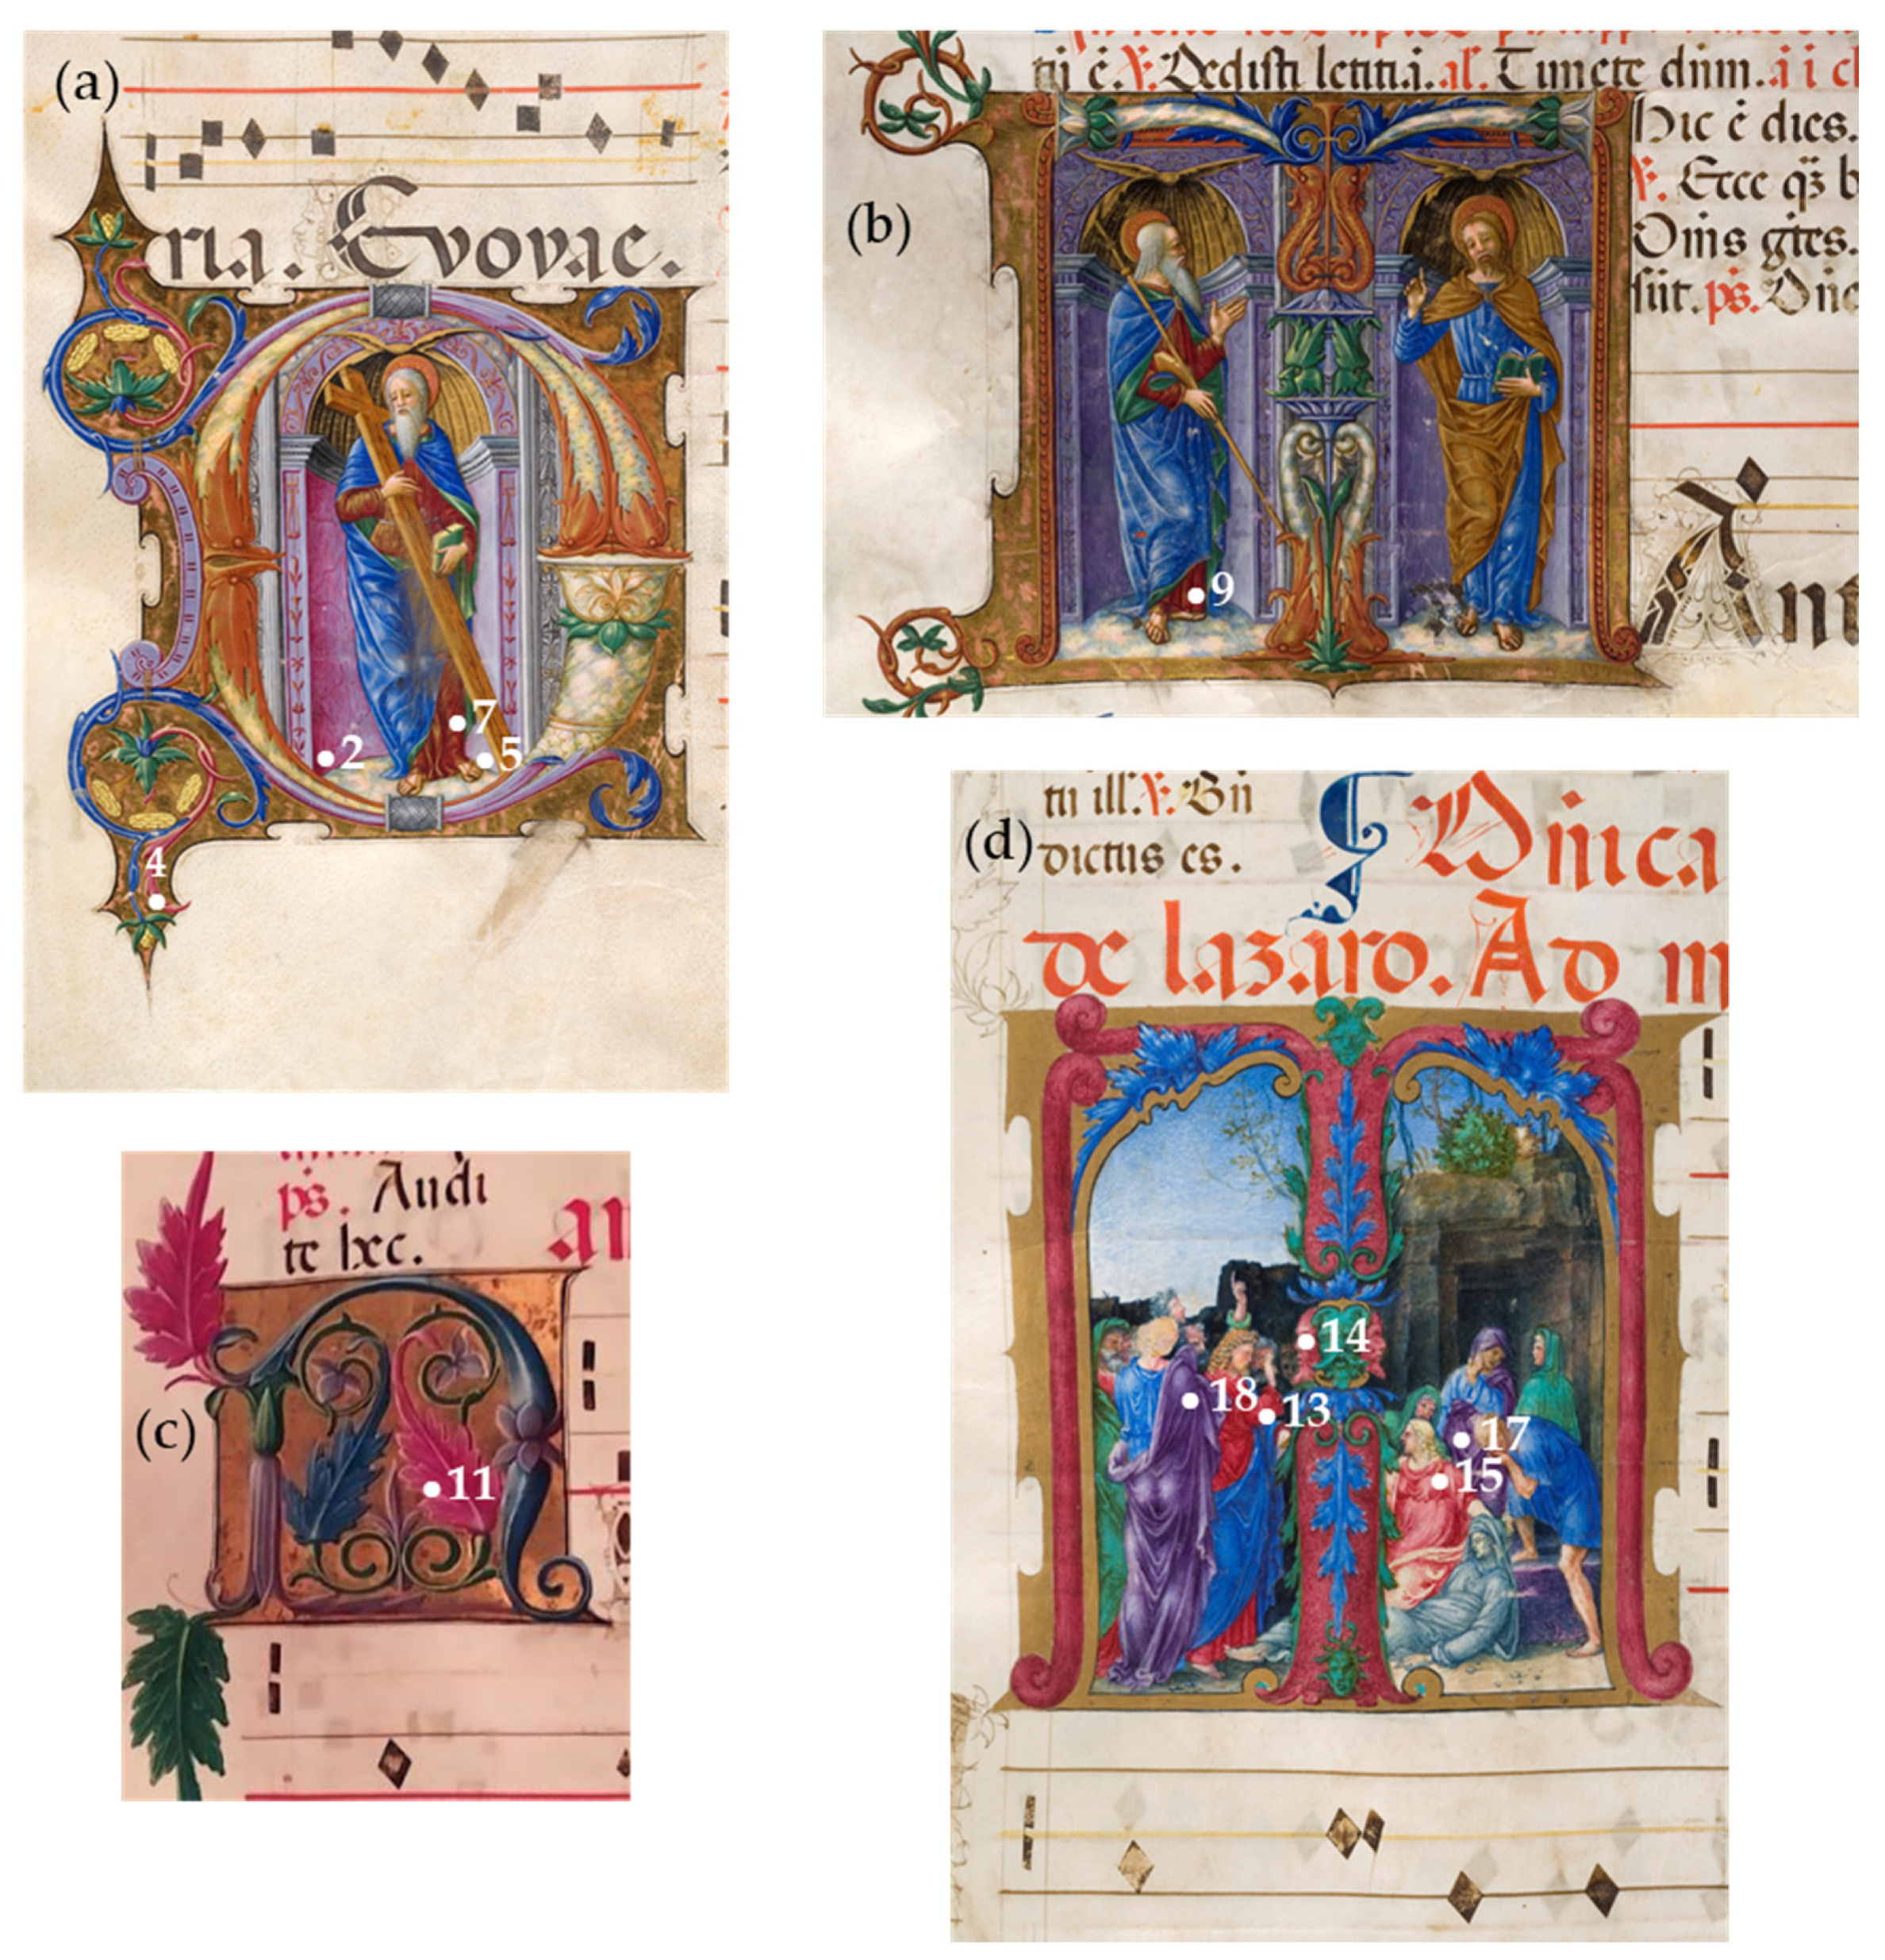
2.2. The Crescenzago Choir Books

A set of six beautiful liturgical manuscripts in Ambrosian rite, the so-called Crescenzago choir books (shelfmarks M 45–50), is kept from the 17th century in the Chapter Archive of the Basilica of Sant’Ambrogio in Milan. They are dated to the end of the 15th century and are enriched by an impressive decoration [35,36,37,38]. Specifically, these are two ingressaria (M 49, pars hiemalis + M 45 pars aestiva) and four antiphonaries for the divine office (M 48, pars hiemalis + M 50, pars aestiva + M 46, for Lent, the feasts of Eastern time and per annum + M 47, Proper of Saints and Common of Saints) [39]. The presence of subscriptions and of the coat of arms of the patrons allows us to reconstruct the full history of these choir books.
The two ingressaria (M 49 + M 45) were commissioned by Giacomo Marliani, provost of the Milanese church of Santa Maria Rossa in Crescenzago; the emblem of the Marliani family is depicted on M 49, fol. 1r, and on M 45, fol. 1r, flanked by the initials I and A (Iacobus). Moreover, the last manuscript, fol. 208v, shows the following statement dating to 1491: «[…] Iacobus Marlianus Carsenzagi prepositus […] hunc librum devotissimus dicavit MCCCCXCI».
The four antiphonaries were all copied in 1487, as stated by a subscription written on M 50, fol. 150v, bearing the name of the scribe, Antonio da Lampugnano, and that belonging to the author of the musical notation, Cristoforo di Abbiate, a canon of Santa Maria della Scala church. Manuscript M 46 is also dated to 1487 (fol. 1r). The decorative project was taken up again by Federico Sanseverino, who since June 1492 was appointed provost of Santa Maria Rossa in Crescenzago after Giacomo Marliani; as of July 1492 he also became a cardinal of the Roman Church. His coat of arms is depicted on M 47, fol. 1r (with a black hat), and on M 46, fol. 1v (with a cardinal hat).
These four large books (approximately 590 × 410 mm), still preserving the original binding with wooden boards covered by leather and metal furnishings, comprise nearly one thousand pages [40] and show an impressive number of miniatures, painted by at least four illuminators. The most important is the so-called Master of Crescenzago, who worked in about 1492–1493 both in illuminating M 49 and M 45 and the four antiphonaries, and in sketching the drawings of M 50. Some other illuminators have been identified: the Carmelite friar Biagio di Grancino da Melegnano, who painted the filigree initials and left his name (frater Blaxius carmelita) and the date 1490 on ms. M 46, fol. 133r-v; Master B.F., who was the author of a single miniature at fol. 81r in ms. M 50, for the feast of the Dedication of the cathedral (he has been identified with Bernardino Butinone [41]); and Giovanni Giacomo Decio, who later on, in about 1530, resumed the interrupted decoration of the antiphonaries M 48, M 50, and M 46. The illumination cycle of the Crescenzago choir books is remarkable for its high quality, especially for those scenes painted by the Master of Crescenzago. This master, who had previously been engaged at Certosa in Pavia, showed with his exuberant and precious art the desire to take on the canons of contemporary paintings. This extraordinary set of six liturgical manuscripts must be considered a masterpiece of late 15th-century Lombard illumination [42].
In the present work, some illuminations of two of the four antiphonaries, M 47 and M 46, have been analyzed. In particular, areas with red, fuchsia and pink shades have been selected for measurements, together with some purple details. The examined illuminations and the measurement areas are shown in Figure 1.

2.3. Instrumental Methods

For the optimization of the experimental conditions, a JASCO FP-777 benchtop spectrofluorimeter, equipped with a photomultiplier detector, was used. The scan rate was set to 200 nm/min and the data pitch was 0.5 nm. Different excitation wavelengths were used, namely 365, 435 and 500 nm, with a bandpass of 10 nm. For each wavelength a glass longpass filter, placed between the sample and the emission monochromator, was used in order to cut the exciting radiation and measure only the fluorescence emission of the sample. For each excitation wavelength, the cut-on wavelengths of the filters were respectively 380, 480 and 520 nm.
In situ spectrofluorimetric analyses were performed using a portable microprobe (Figure S2, Supplementary Materials), suitable for both visible reflectance and fluorescence measurements. The microprobe, provided with an Olympus 20× objective, is connected by optical fibers to a Lot Oriel MS125 spectrometer (grid 400 lines/mm) equipped with an Andor CCD detector iDus420-OE (1024 × 128 pixel, quantum efficiency curve shown in Figure S3d, Supplementary Materials), cooled by means of a Peltier device. The wavelength calibration was based on the emission spectrum of a neon lamp.
For fluorescence analyses the microprobe is equipped with an interference filter to select the excitation wavelength and a dichroic filter to eliminate from the spectrum the component due to the exciting radiation. In the present work, the best combination proved to be the use of an interference filter centered at 482.5 nm (bandwidth 31 nm) and a dichroic filter with a cut-on wavelength of 516 nm (transmission range 520–850 nm). The transmission curves of the two filters are shown in Figure S3a,b, Supplementary Materials. The radiation source is a halogen lamp (maximum power 150 W, spectral radiance curve shown in Figure S3c, Supplementary Materials) connected to the probe by optical fibers. Fluorescence spectra were collected as a sum of 30 scans with an exposure time of 2 s, and the analyses were preceded by the acquisition of a background spectrum in the absence of the incident radiation.
For visible reflectance analyses a beam splitter 30/70 for the spectral range 400–700 nm is assembled into the probe. The same halogen source described above is used and the radiation is sent along a direction perpendicular to the microscope objective. Reflectance spectra were acquired as a sum of 30 scans with an exposure time of 0.01 s. The analyses were preceded by the acquisition of background and reference spectra in the absence of the incident radiation and on a Mylar tablet respectively.

2.4. Kubelka–Munk Correction for Self-Absorption of Fluorescence Emission

To take into account fluorescence self-absorption and remission in the solid state, a model based on the Kubelka–Munk theory of diffuse reflectance was applied [20,21]. According to this theory, it is possible to obtain true emission spectra dividing the experimental data by a function γ (λ, λ0), defined by Equation (1):
γ λ , λ 0 = 1 / 1 + Rem R λ / Rem R λ + 2 × 1 / 1 + Rem R λ Rem R λ + 2 / Rem R λ 0 Rem R λ 0 + 2
where λ and λ0 are the emission and excitation wavelength and Rem[R(λ)] is the total remission function defined by the following Equation (2):
R e m R λ = k λ / s λ = 1 R λ 2 / 2 R λ
where s(λ) and k(λ) are respectively the scattering and the absorption coefficient and R(λ) is the diffuse reflectance at the corresponding wavelength λ.
It should be remembered that the Kubelka–Munk theory can be rigorously applied to optically thick layers [21].
The self-absorption correction was performed by means of GRAMS/AI software.

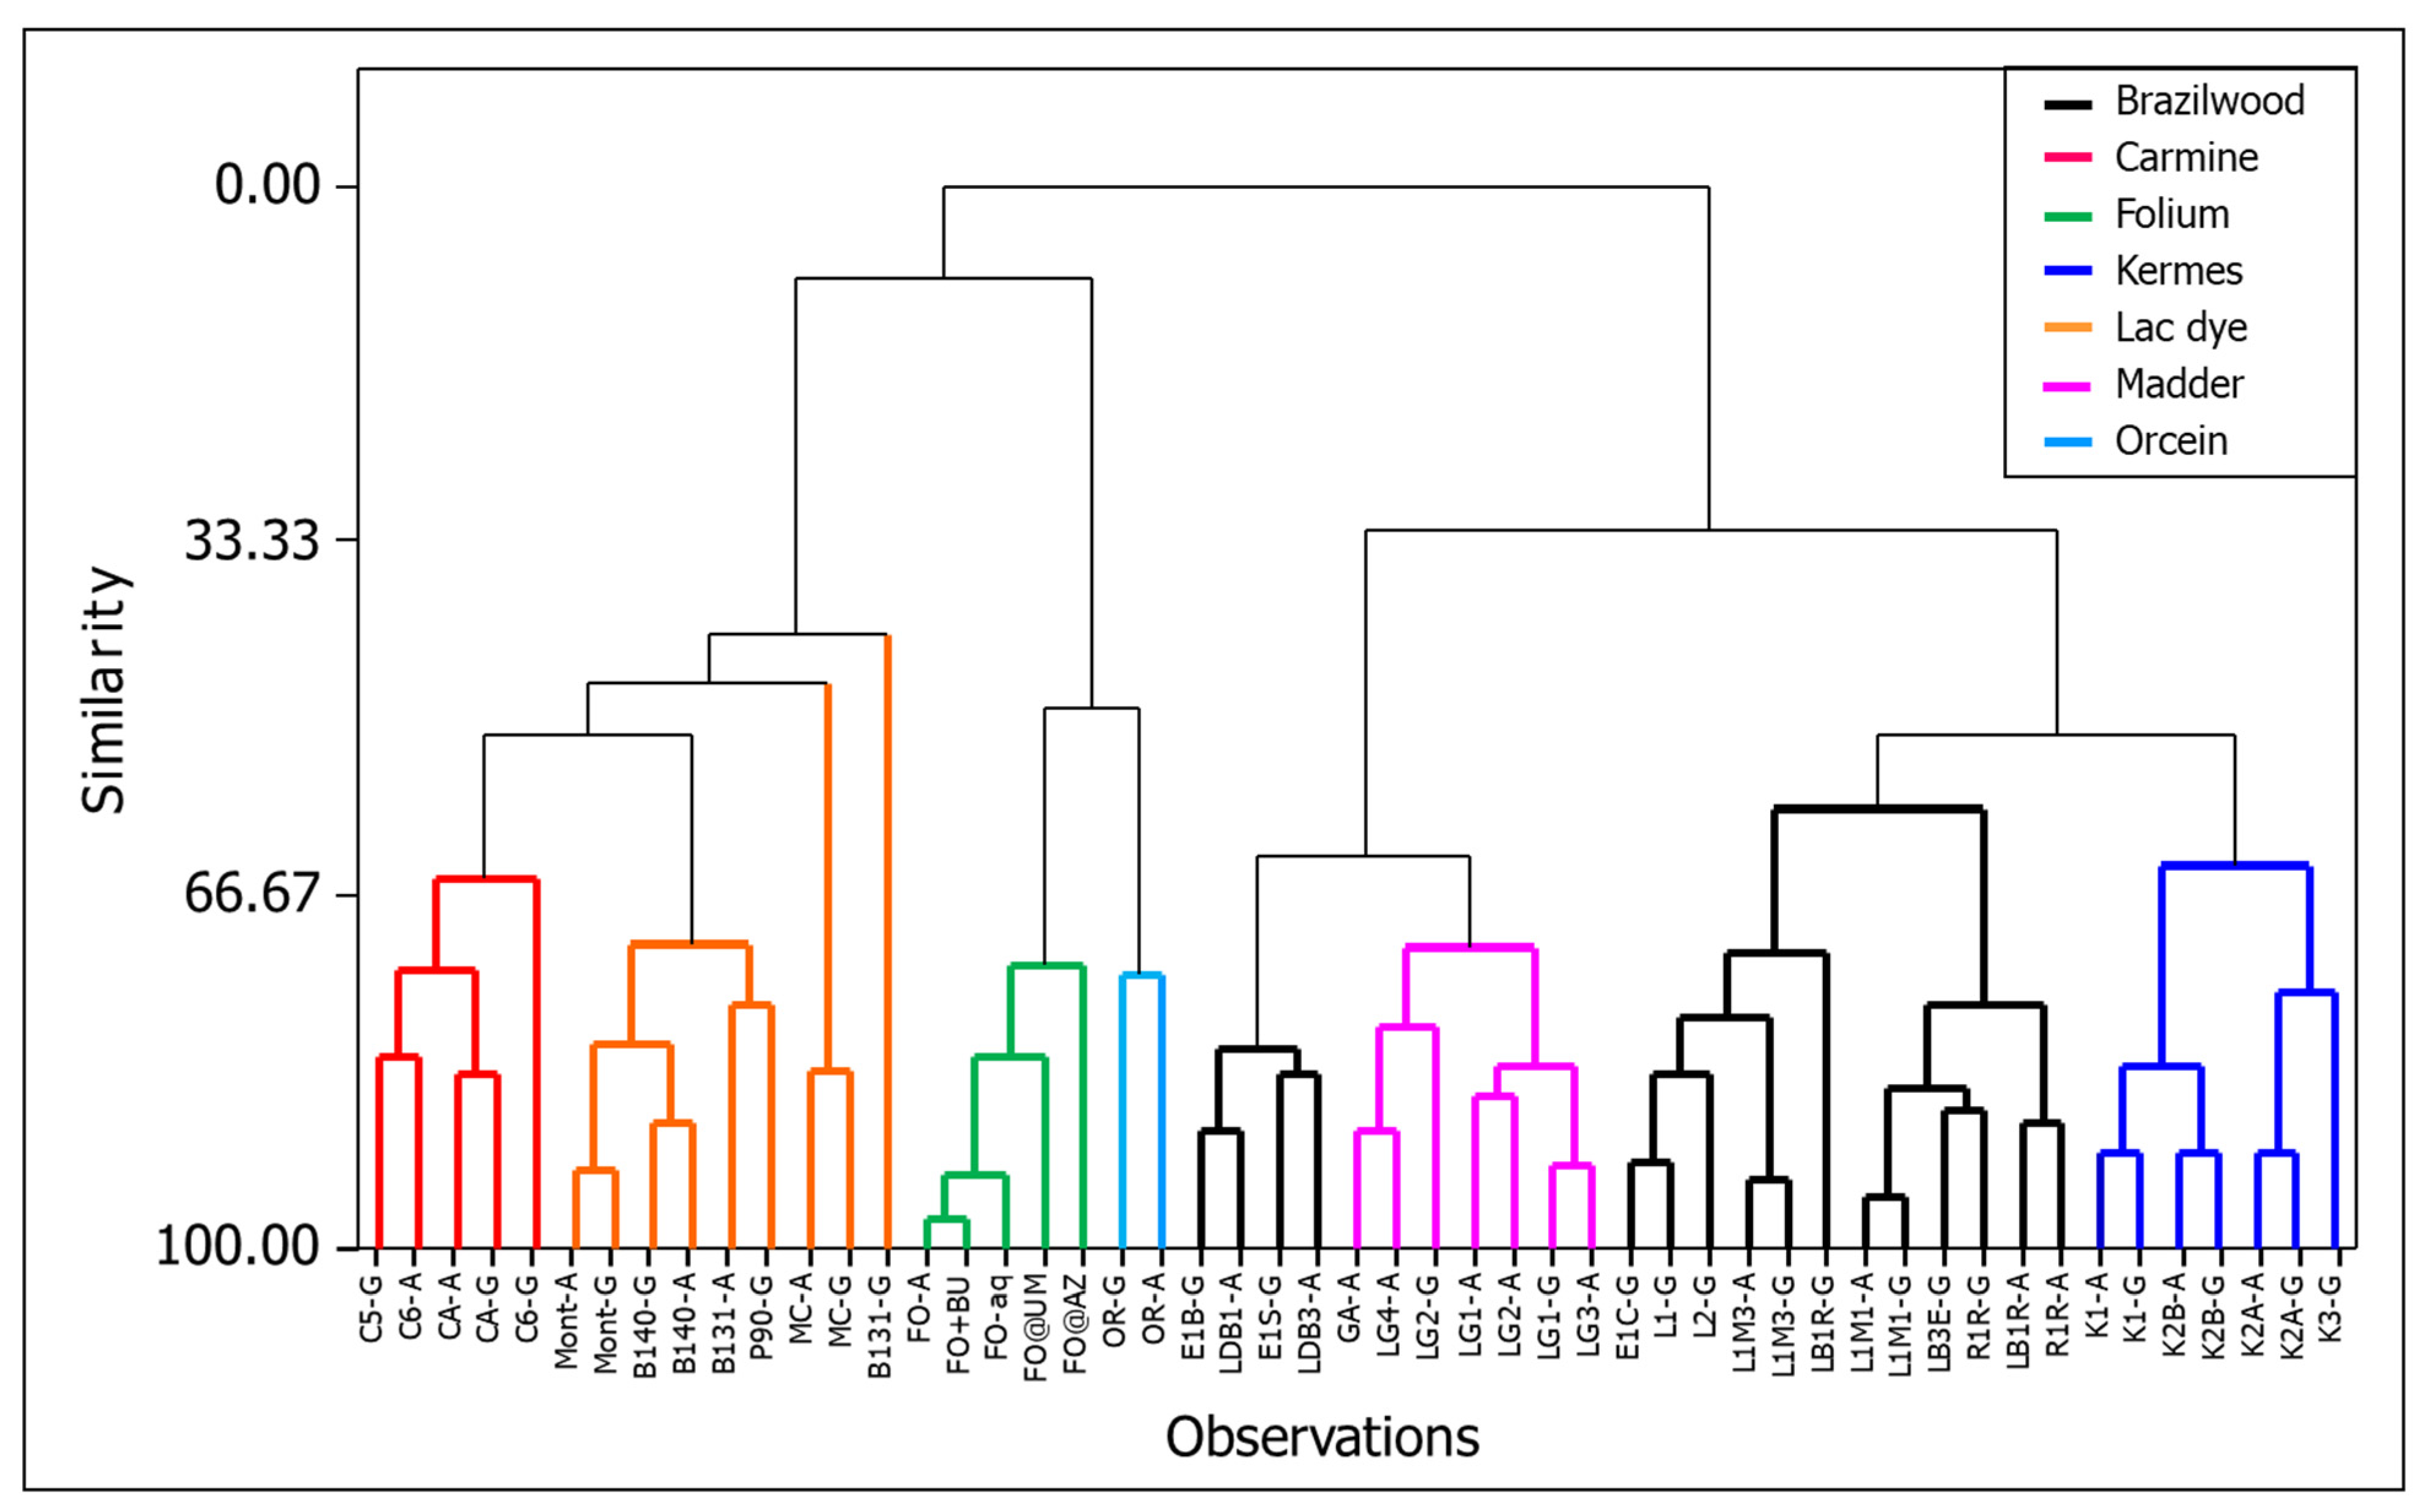
2.5. Multivariate Analysis of Data

Reflectance and emission spectra were processed by principal component analysis (PCA) and cluster analysis (CA), performed by the statistical software Minitab ver. 14.
Fluorescence spectra were first corrected for self-absorption as described above and, when necessary, the fluorescence component due to the parchment (previously acquired on the bare support and shown in Figure S4, Supplementary Materials) was subtracted using the Grams/AI software.
Using the same software, all the spectra were then transformed in the corresponding second derivative (gap algorithm, 20 points). It was chosen to calculate the second derivative of the spectra in consideration of their great similarity and of the fact that, as demonstrated in the literature [43,44,45], higher-order derivatives help highlight the differences and thus identify the compounds responsible for the spectral features. The use of the second derivative represents a good compromise with respect to the slight worsening of the signal/noise ratio and proved to be effective, for example, in a previous study dedicated to the identification of synthetic organic pigments based on their luminescence spectra [46].
To avoid the possible variability due to the emission intensity, the data were then normalized using the Minitab software and the standard normal variate (SNV) method, which consists of subtracting each spectrum by its own mean and dividing it by its own standard deviation. To perform PCA, the covariance matrix was selected to reduce the baseline contribution. For CA, the complete linkage method was chosen and the distance between the objects was Euclidean.

3. Results

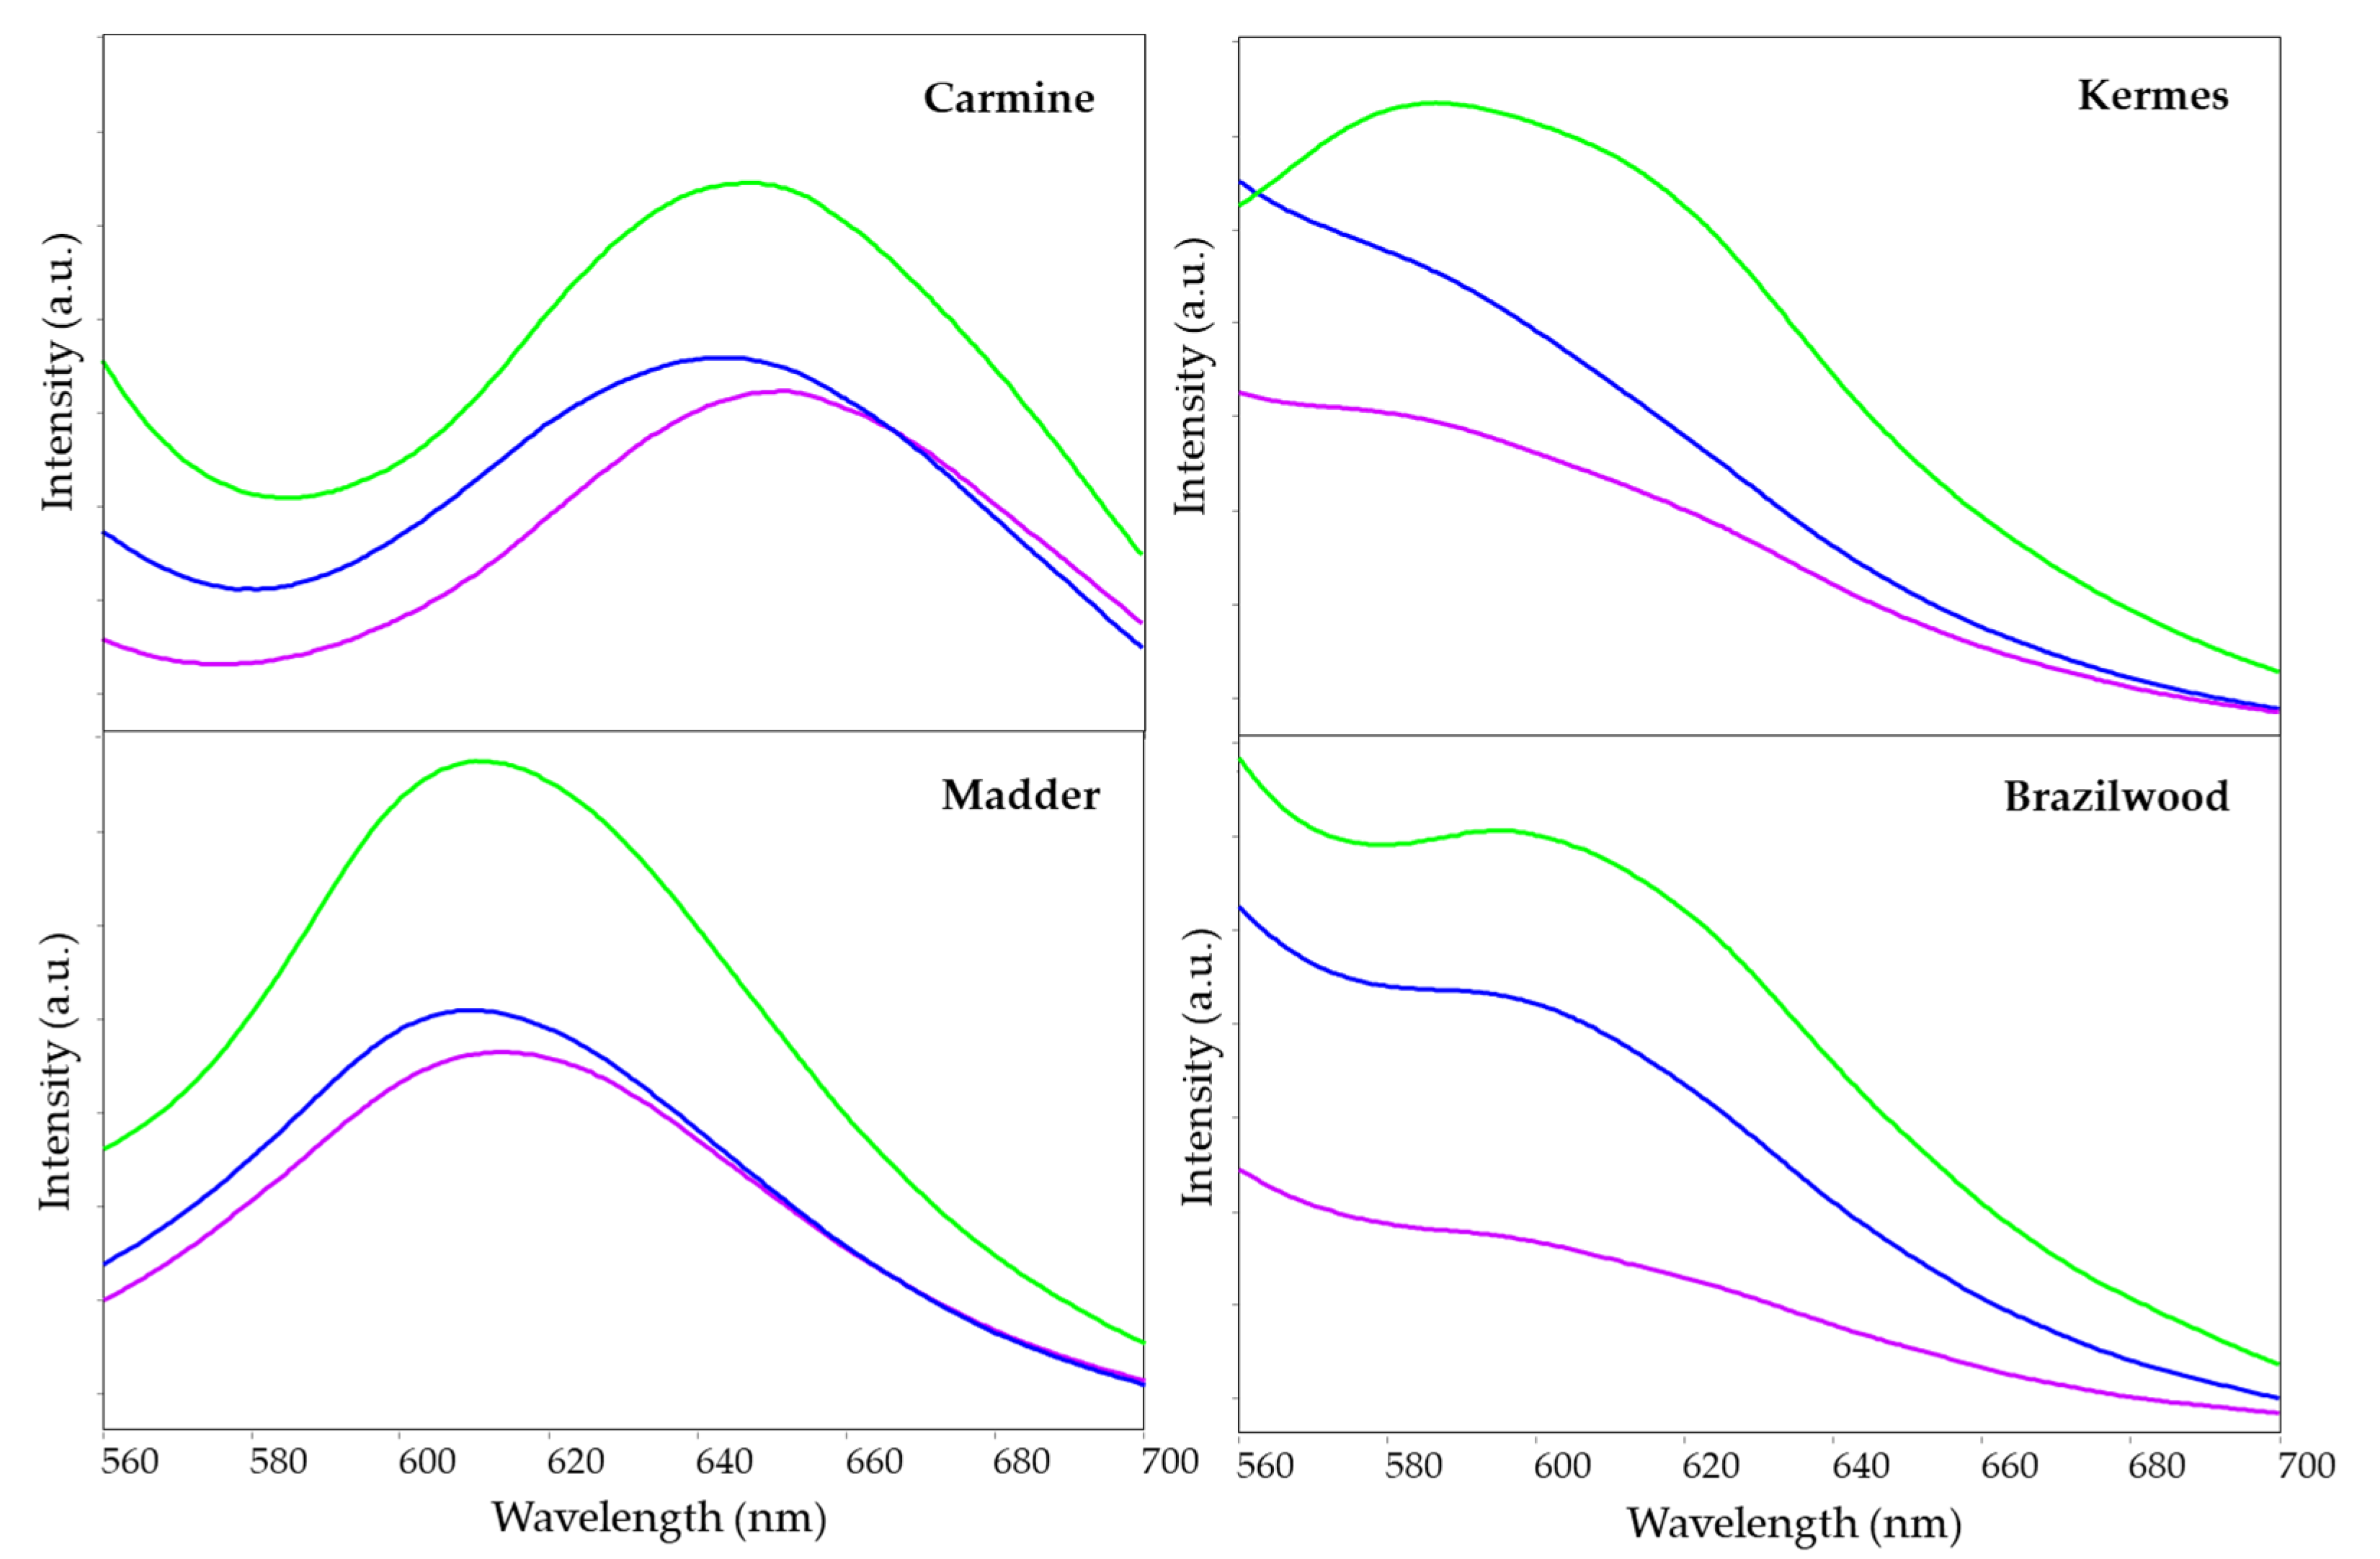
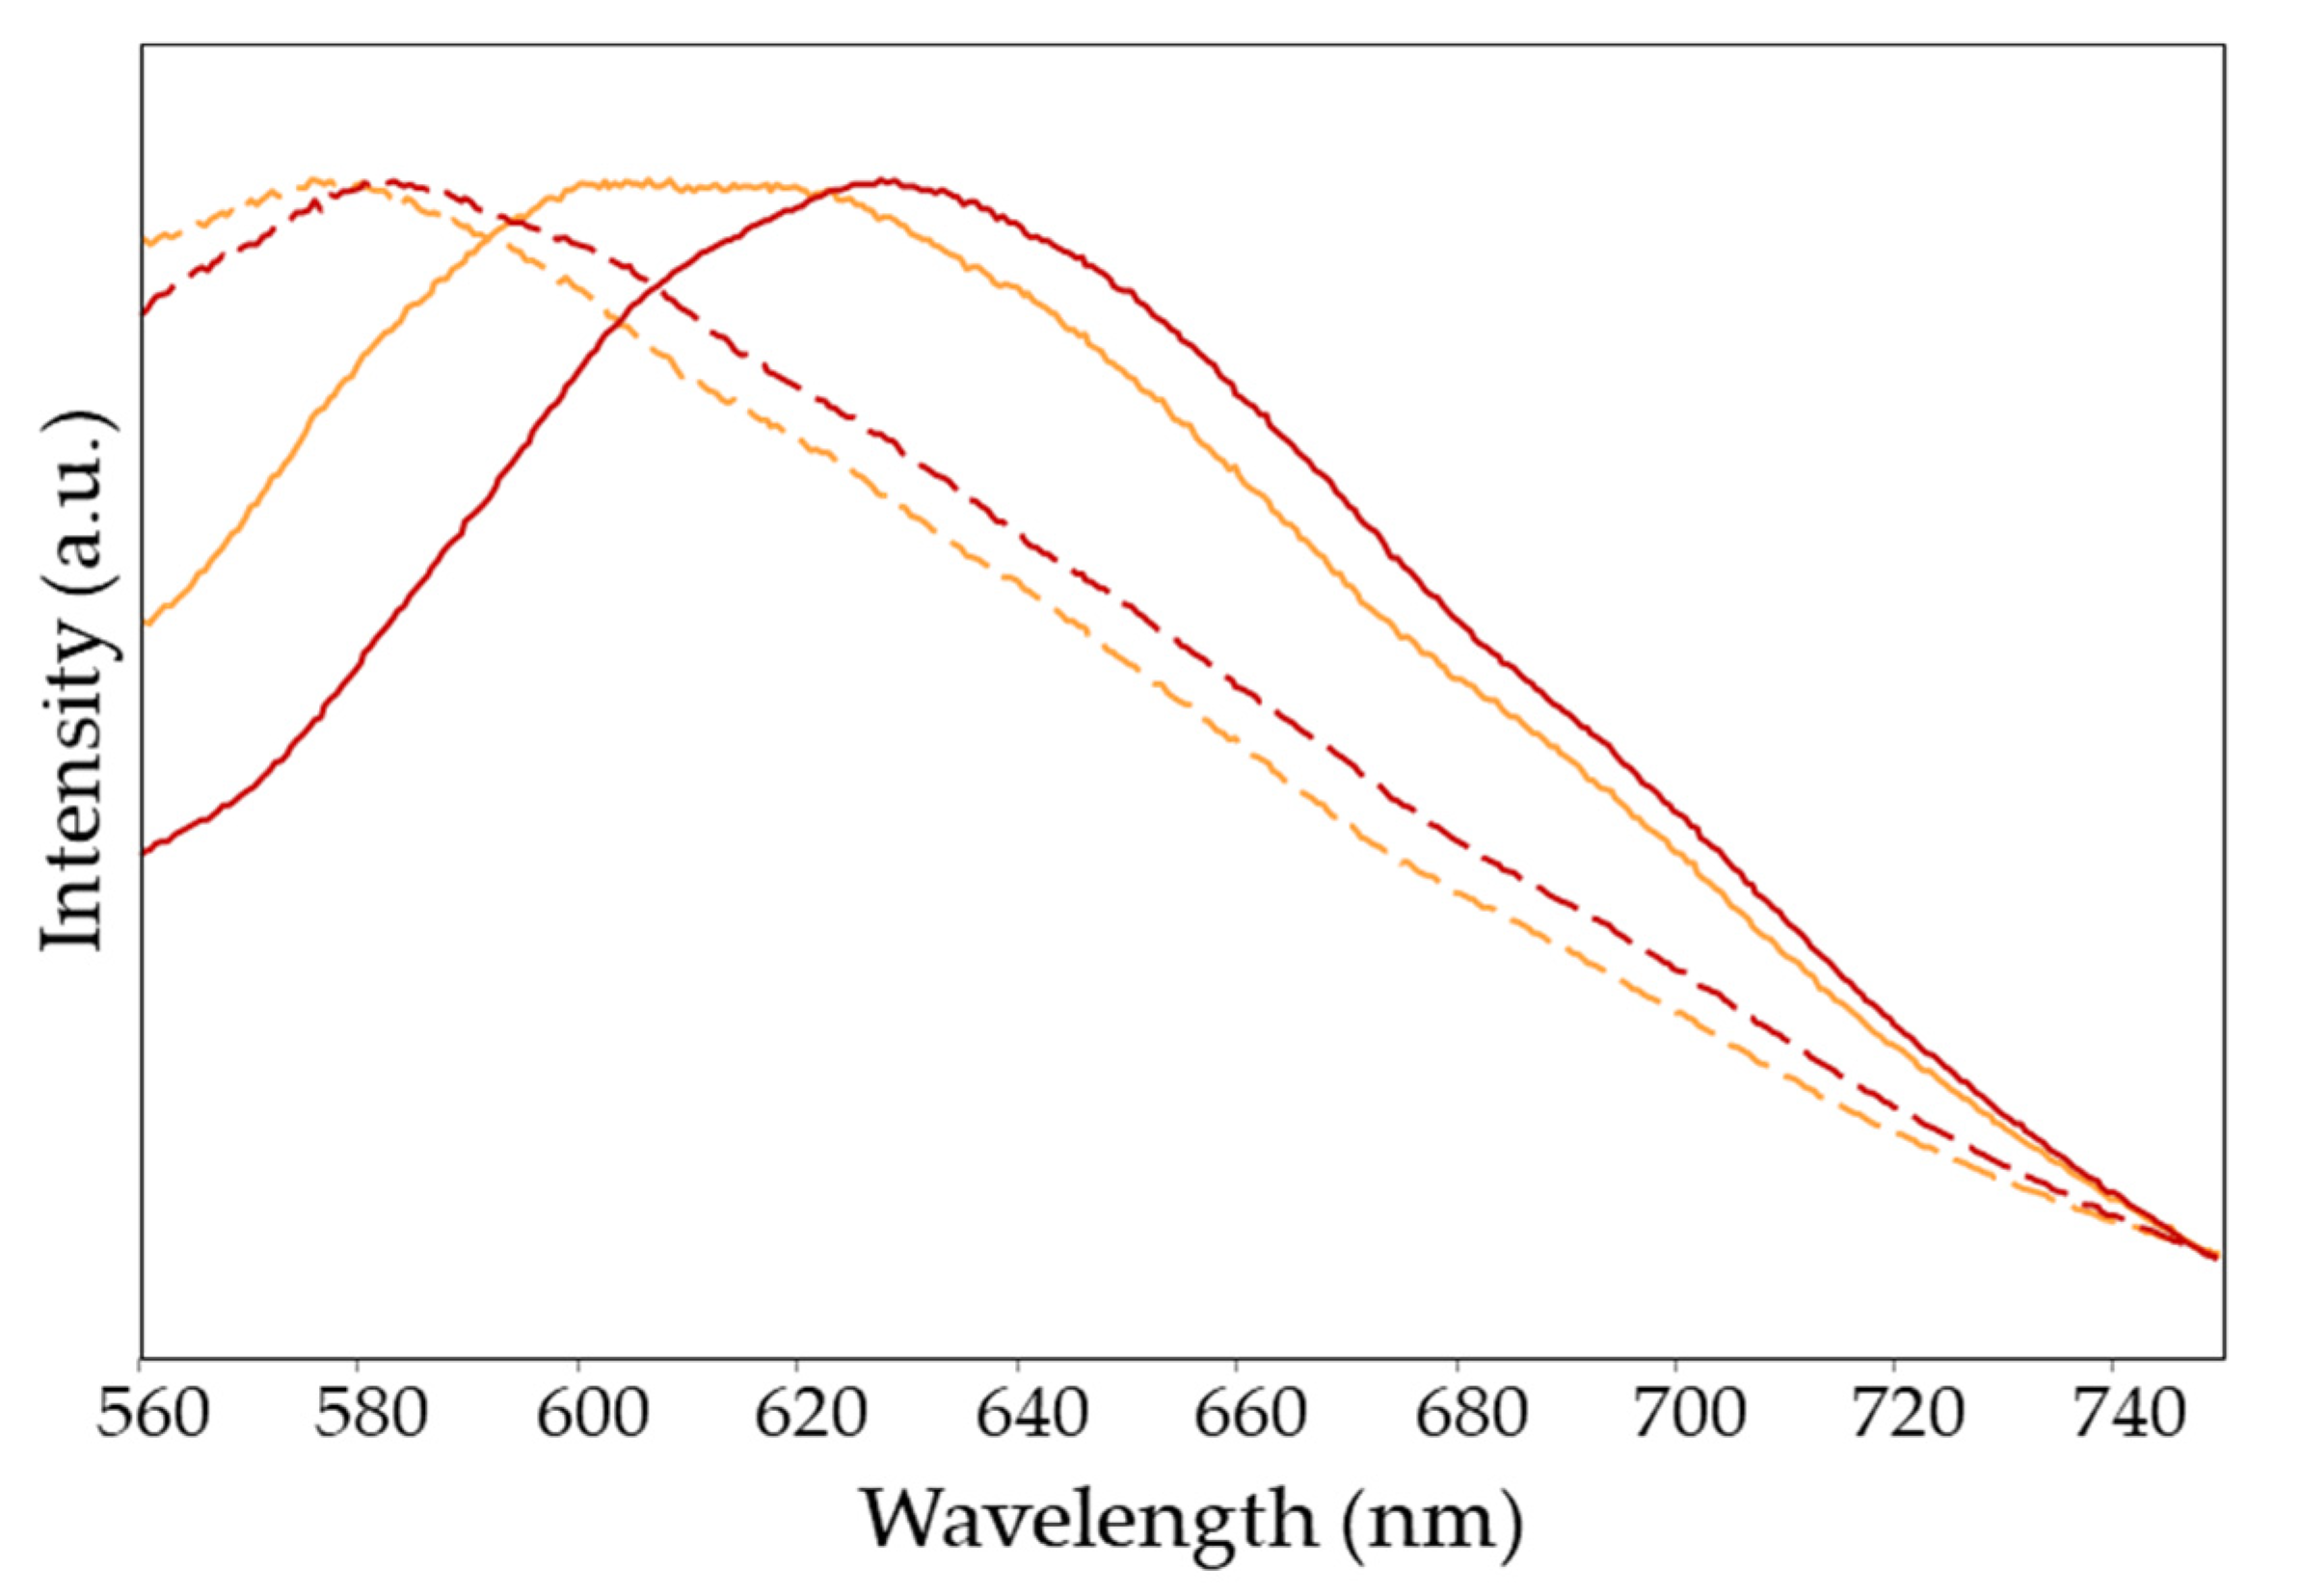
3.1. Optimization of the Experimental Conditions

As previously mentioned, a preliminary study was carried out using benchtop instrumentation, which allowed the excitation wavelength to be varied continuously, in order to select the best combination of optical filters with which to equip the microprobe for in situ analyses. In particular, the aim of the experiment was the choice of an interference filter, which influences the intensity of the fluorescence emission of the dyes since it determines the excitation wavelength, and a dichroic one, which, ideally, should cut the excitation radiation without influencing the fluorescence signal.
The results of these analyses are shown for some of the reference samples in Figure 2, which illustrates the comparison between the fluorescence spectra acquired on the same mock-up of lake spread on parchment at three different excitation wavelengths: 365 nm, 435 nm and 500 nm. From this comparison it is evident that the best results have been obtained for the fluorescence spectra excited at 500 nm: the bands due to the dyes are in fact enhanced, and the contribution of the binder and the parchment is limited, since their absorption maxima do not lie in the visible region [47].
Consequently, these experimental conditions were transferred to the microprobe by selecting the closest commercially available combination of interference and dichroic filters, respectively centered at 482.5 nm and with a cut-on wavelength of 516 nm.

3.2. Spectrofluorimetric Analyses by Portable Instrumentation

As described in Section 2.3, the microprobe used in the present work allows for the performance of both reflectance and fluorescence analyses. Since FORS spectroscopy has been widely exploited for the recognition of dyes in illuminated manuscripts (as mentioned above), it was first investigated whether reflectance spectra could actually lead to the identification of the different coloring substances in such a large number of lakes obtained with different dyes and following several recipes. The reflectance data (Figure S5, Supplementary Materials) were then subjected to PCA, but, as demonstrated by the score plot shown in Figure S6 (Supplementary Materials), they were not characteristic enough for the recognition of groups corresponding to the individual dyes. The reflectance data of the mock-up samples of the lakes containing the same dye are in fact randomly distributed throughout the multivariate space, and different lakes partially overlap one another. Similarly, the dendrogram obtained from CA shows clusters each containing lakes of different dyes (Figure S7, Supplementary Materials). In this regard, it should be remembered that the reflectance spectra of substances of similar color have comparable spectral patterns, just as, for the same substance, there may be variations in the spectral pattern as a function of concentration. Furthermore, referring to the specific case of illuminated manuscripts, the practice of glazing was widespread, consisting of a thin layer of a lake applied on an opaquer layer made with another lake or with an inorganic pigment, to give particular nuances. In this case, the resulting spectrum would be due to both the underlying pigment and the lake applied over it, further complicating the interpretation of the reflectance data for identification purposes [48].
Multivariate analysis was therefore applied to the fluorescence spectra acquired on the lake mock-up samples. Before processing, the contribution due to parchment was, if necessary, subtracted and the correction for self-absorption phenomena based on the Kubelka–Munk theory was applied, as described in Section 2.4. The Kubelka–Munk correction shifts the fluorescence spectra toward shorter wavelengths, indicating that the emitted light is partially reabsorbed by the colorant itself. As an example, Figure 3 shows two emission spectra obtained from two different mock-up samples of brazilwood lakes before and after correction: the corrected spectra become much more similar and, consequently, easier to interpret for identification purposes. Emission spectra, before and after the correction, and the corresponding maxima are reported in the Supplementary Materials (Figure S8 and Table S3). Furthermore, to improve the result, the emission spectra thus elaborated were transformed into the corresponding second derivative. In this way it is in fact possible to further highlight the differences between them.
CA and PCA were therefore applied to the reference samples obtained from red lakes and to those made with purple dyes (folium and orcein).
The dendrogram in Figure 4 shows how, in general, it is possible to distinguish a cluster corresponding to each dye regardless of the recipe and the binder. Furthermore, in the case of folium, the emission response of the dye allows its identification even when it is spread on, or mixed with, inorganic pigments. Only in the case of brazilwood, two different clusters were observed. The former (cluster 1) houses most of the samples, while the latter (cluster 2) consists of samples characterized by a darker shade, as demonstrated by the intensity values of their reflectance spectra (Figure S9, Supplementary Materials), as well as the visual observation. In this regard, it could be hypothesized that the correction was not able to fully compensate for the large difference in dye concentration of these samples. The information provided by CA is consistent with PCA results, as demonstrated by the three-dimensional score plot reported in the Supplementary Materials (Figure S10).
By virtue of the good results obtained on the reference samples, the same multivariate approach was extended to the interpretation of the spectra acquired during the campaign of in situ analyses on the Crescenzago choir books (Figure S11a,b, Supplementary Materials). The aim was, in fact, to identify the dyes used by the illuminators Maestro di Crescenzago in the choir book M 47 and Giovanni Giacomo Decio in the choir book M 46. The emission spectra subjected to multivariate analysis were again previously corrected for self-absorption and derived, but the subtraction of the contribution due to the parchment, on the other hand, did not prove to be necessary, since the signal of the dye was predominant in all cases (this is certainly due to the unequivocally better quality of the pictorial layer, opaquer than that of the mock-up samples).
Referring to the red and fuchsia areas analyzed in the manuscripts, the use of lac dye is demonstrated by CA (Figure 5) and PCA (Figure S12, Supplementary Materials) in most parts for both manuscripts, and only in one lighter pink detail of M 46 was the use of a brazilwood lake detected.
Finally, regarding the emission spectra obtained from three purple areas, these were compared with those of both red and purple mock-up samples. It should in fact be remembered, as already described, that the purple color was not always obtained from a single dye, but it could also be a mixture of a red and a blue. Again, in both manuscripts, the use of folium dye was detected. Indeed, there is a perfect match in the dendrogram (Figure 6) and in the score plot (Figure S13, Supplementary Materials) with the group of the reference samples prepared with this colorant.

4. Conclusions

In the present work, the potentiality of a protocol combining spectrofluorimetry and multivariate analysis has been demonstrated for the non-invasive investigation of red and purple dyes in illuminated manuscripts. Spectrofluorimetry, thanks to its specificity toward the molecules of the dyes, is not markedly affected by the presence of the inorganic matrix that forms a lake, providing selective information on the colorant itself. In particular, the best analytical conditions for a portable microprobe have been individuated, involving an excitation wavelength selected by an interference filter around 500 nm, i.e., a wavelength close to the absorption maxima of most red and purple dyes and, at the same time, distant enough from the emission maxima, combined with a dichroic filter centered around 520 nm. The combination with multivariate analysis methods, in particular cluster analysis, proved successful in discriminating mock-up samples on parchment of lakes prepared with different dyes following a large variety of recipes from ancient treatises, whose emission spectra were acquired with portable equipment. The collection of the obtained spectral patterns was also presented, to provide a reference set that could possibly be used in other investigations for at least a qualitative comparison.
The method was then successfully applied to the study of illuminated manuscripts dated to the end of the 15th century, leading to the recognition of the use of folium to obtain purple color and lac dye to paint red and fuchsia areas. The use of these dyes, extensively documented in the literature, is consistent with the illumination technique in the historical period considered and is common to both artists, the Maestro di Crescenzago and Giovanni Giacomo Decio, involved in the decoration of the two volumes of the Crescenzago choir books. Thus, the possibility of combining the excellent performance of microspectrofluorimetry for the identification of organic dyes and their lakes with a complete non-invasiveness of the measurement technique was demonstrated.

Supplementary Materials

The following supporting information can be downloaded at: https://www.mdpi.com/article/10.3390/heritage6020108/s1. Figure S1: Flowchart of the experimental protocol; Figure S2: Scheme of the instrumental setup used for in situ fluorescence measurements; Figure S3: Transmission curves of the interference and dichroic filters, spectral radiance curve of the halogen source and quantum efficiency curve of the CCD detector; Figure S4: Emission spectrum of parchment; Figure S5: Reflectance spectra of the lake mock-up samples analyzed in the present work; Figure S6: Score plots of the first two principal components of the reflectance spectra of the reference lake samples as R, log(1/R) and second derivative of R; Figure S7: Dendrogram generated by CA applied to the second-derivative reflectance spectra of the reference lake samples; Figure S8: Emission spectra of the lake mock-up samples analyzed in the present work and after the Kubelka–Munk correction; Figure S9: Reflectance spectra of brazilwood lake mock-up samples; Figure S10: Score plot of the first three principal components of the second-derivative emission spectra of the reference lake samples and dendrogram from the cluster analysis of the same components; Figure S11: Emission and visible reflectance spectra acquired from illuminated details of the Crescenzago choir books; Figure S12: Score plot of the first three principal components of the second-derivative emission spectra of the reference lake samples and those obtained from red and fuchsia areas of the Crescenzago choir books; Figure S13: Score plot of the first three principal components of the second-derivative emission spectra of the reference lake samples and those obtained from purple areas of the Crescenzago choir books; Table S1: Summary of the recipes followed to prepare the historically accurate mock-up samples of the different lakes; Table S2: L*a*b* color coordinates and chroma (C*) values for the paint mock-ups. Table S3: Emission maxima (λexc 482.5 nm) of the mock-ups of lakes on parchment.

Author Contributions

Conceptualization, M.L. and S.B.; methodology, M.L. and S.B.; formal analysis, M.L., N.H. and S.B.; investigation, M.L., N.H., S.B., M.R.T., M.P. and F.R.; resources, M.P., M.R.T. and S.B.; data curation, M.L., N.H., F.R. and S.B.; writing—original draft preparation, M.L., M.P. and M.R.T.; writing—review and editing, S.B., M.L., M.P. and M.R.T.; visualization, M.L., M.P. and M.R.T.; supervision, S.B. All authors have read and agreed to the published version of the manuscript.

Funding

This research received no external funding.

Institutional Review Board Statement

Not applicable.

Informed Consent Statement

Not applicable.

Data Availability Statement

Not applicable.

Acknowledgments

Miriam Bertagna, Angela Dibenedetto and Chiara Fucina are acknowledged for having prepared part of the historically accurate painting mock-ups examined in the present work. The authors also thank the architect Carlo Capponi for suggesting the investigation on the Crescenzago choir books.

Conflicts of Interest

The authors declare no conflict of interest.

References

  1. Aceto, M.; Calà, E.; Arrais, A.; Clericuzio, M.; Marsano, F.; Idone, A.; Davit, P.; Menghini, L.; Gulmini, M. On the identification of folium by SERS: From crude extracts to illuminated codices. J. Raman Spectrosc. 2017, 48, 530–537. [Google Scholar] [CrossRef]
  2. Aceto, M.; Arrais, A.; Marsano, F.; Agostino, A.; Fenoglio, G.; Idone, A.; Gulmini, M. A diagnostic study on folium and orchil dyes with non-invasive and micro-destructive methods. Spectrochim. Acta Part A Mol. Biomol. Spectrosc. 2015, 142, 159–168. [Google Scholar] [CrossRef]
  3. Calà, E.; Salis, A.; Damonte, G.; Signorello, S.; Brenner, E.; Carey, J.; Aceto, M. Identification of aloe and other dyes by means of SERS and HPLC-DAD-MS in the embroidery of a 15th century English folded almanac. Dye. Pigment. 2021, 194, 109578. [Google Scholar] [CrossRef]
  4. Castro, R.; Pozzi, F.; Leona, M.; Melo, M.J. Combining SERS and microspectrofluorimetry with historically accurate reconstructions for the characterization of lac dye paints in medieval manuscript illuminations. J. Raman Spectrosc. 2014, 45, 1172–1179. [Google Scholar] [CrossRef]
  5. Melo, M.J.; Nabais, P.; Guimarães, M.; Araújo, R.; Castro, R.; Oliveira, M.C.; Whitworth, I. Organic dyes in illuminated manuscripts: A unique cultural and historic record. Philos. Trans. R. Soc. A Math. Phys. Eng. Sci. 2016, 374, 50. [Google Scholar] [CrossRef] [PubMed] [Green Version]
  6. Aceto, M.; Agostino, A.; Fenoglio, G.; Idone, A.; Gulmini, M.; Picollo, M.; Ricciardi, P.; Delaney, J.K. Characterisation of colourants on illuminated manuscripts by portable fibre optic UV-visible-NIR reflectance spectrophotometry. Anal. Methods 2014, 6, 1488–1500. [Google Scholar] [CrossRef]
  7. Aceto, M.; Idone, A.; Agostino, A.; Fenoglio, G.; Gulmini, M.; Baraldi, P.; Crivello, F. Non-invasive investigation on a VI century purple codex from Brescia, Italy. Spectrochim. Acta—Part A Mol. Biomol. Spectrosc. 2014, 117, 34–41. [Google Scholar] [CrossRef]
  8. Aceto, M.; Calà, E.; Agostino, A.; Fenoglio, G.; Labate, M.; Förstel, C.; Denoël, C.; Quandt, A. Non-invasive study on the sinope gospels. Heritage 2020, 3, 1269–1278. [Google Scholar] [CrossRef]
  9. Aceto, M.; Agostino, A.; Fenoglio, G.; Baraldi, P.; Zannini, P.; Hofmann, C.; Gamillscheg, E. First analytical evidences of precious colourants on Mediterranean illuminated manuscripts. Spectrochim. Acta—Part A Mol. Biomol. Spectrosc. 2012, 95, 235–245. [Google Scholar] [CrossRef]
  10. Gulmini, M.; Idone, A.; Diana, E.; Gastaldi, D.; Vaudan, D.; Aceto, M. Identification of dyestuffs in historical textiles: Strong and weak points of a non-invasive approach. Dye. Pigment. 2013, 98, 136–145. [Google Scholar] [CrossRef]
  11. Nabais, P.; Melo, M.J.; Lopes, J.A.; Vitorino, T.; Neves, A.; Castro, R. Microspectrofluorimetry and chemometrics for the identification of medieval lake pigments. Herit. Sci. 2018, 6, 13. [Google Scholar] [CrossRef] [Green Version]
  12. Nabais, P.; Melo, M.J.; Lopes, J.A.; Vieira, M.; Castro, R.; Romani, A. Organic colorants based on lac dye and brazilwood as markers for a chronology and geography of medieval scriptoria: A chemometrics approach. Herit. Sci. 2021, 9, 32. [Google Scholar] [CrossRef]
  13. Vitorino, T.; Melo, M.J.; Carlyle, L.; Otero, V. New insights into brazilwood lake pigments manufacture through the use of historically accurate reconstructions. Stud. Conserv. 2016, 61, 255–273. [Google Scholar] [CrossRef]
  14. Melo, M.J.; Otero, V.; Vitorino, T.; Araújo, R.; Muralha, V.S.F.; Lemos, A.; Picollo, M. A spectroscopic study of Brazilwood paints in medieval books of hours. Appl. Spectrosc. 2014, 68, 434–443. [Google Scholar] [CrossRef] [PubMed]
  15. Nabais, P.; Castro, R.; Lopes, G.V.; de Sousa, L.C.; Melo, M.J. Singing with light: An interdisciplinary study on the medieval Ajuda Songbook. J. Mediev. Iber. Stud. 2016, 8, 283–312. [Google Scholar] [CrossRef]
  16. Castro, R.; Miranda, A.; Melo, M.J. Interpreting lac dye in medieval written sources: New knowledge from the reconstruction of recipes relating to illuminations in Portuguese manuscripts. Sources Art Technol. Back Basics 2016, 1918, 88–99. [Google Scholar]
  17. Aceto, M.; Calà, E.; Agostino, A.; Fenoglio, G.; Idone, A.; Porter, C.; Gulmini, M. On the identification of folium and orchil on illuminated manuscripts. Spectrochim. Acta Part A Mol. Biomol. Spectrosc. 2017, 171, 461–469. [Google Scholar] [CrossRef]
  18. Ricciardi, P.; Delaney, J.K.; Glinsman, L.; Thoury, M.; Facini, M.; de la Rie, E.R. Use of visible and infrared reflectance and luminescence imaging spectroscopy to study illuminated manuscripts: Pigment identification and visualization of underdrawings. Proc. SPIE 2009, 7391, 739106. [Google Scholar]
  19. Zaffino, C.; Bertagna, M.; Guglielmi, V.; Dozzi, M.V.; Bruni, S. In-situ spectrofluorimetric identification of natural red dyestuffs in ancient tapestries. Microchem. J. 2017, 132, 77–82. [Google Scholar] [CrossRef]
  20. Clementi, C.; Miliani, C.; Verri, G.; Sotiropoulou, S.; Romani, A.; Brunetti, B.G.; Sgamellotti, A. Application of the Kubelka-Munk correction for self-absorption of fluorescence emission in carmine lake paint layers. Appl. Spectrosc. 2009, 63, 1323–1330. [Google Scholar] [CrossRef]
  21. Verri, G.; Clementi, C.; Comelli, D.; Cather, S.; Piqué, F. Correction of ultraviolet-induced fluorescence spectra for the examination of polychromy. Appl. Spectrosc. 2008, 62, 1295–1302. [Google Scholar] [CrossRef]
  22. Orna, M.V.; Fontani, M. The Modernity of Ancient Pigments: A Historical Approach. Colorants 2022, 1, 307–346. [Google Scholar] [CrossRef]
  23. Brunello, F. De Arte Illuminandi: E Altri Trattati sulla Tecnica della Miniatura Medievale; Neri Pozza Editore: Vicenza, Italy, 1975. [Google Scholar]
  24. Baraldi, P.; Fagnano, C.; Bensi, P. Raman study of a ‘Tabula Colorum Physiologica’ in a 1686 printed journal. J. Raman Spectrosc. 2006, 37, 1104–1110. [Google Scholar] [CrossRef]
  25. Harley, R.D. Artist’s Pigments c. 1600–1835. A Study in English Documentary Sources; Butterworth Scientific: London, UK, 1982. [Google Scholar]
  26. Melo, M.J.; Castro, R. O Livro de Como se Fazem as Cores: Medieval Colours for Practitioners. Online Edition. 2016. Available online: https://www.dcr.fct.unl.pt/LivComoFazemCores (accessed on 18 December 2022).
  27. Merrifield, M.P. Medieval and Renaissance Treatises on the Arts of Painting: Original Texts with English Translations; Dover Publications: New York, NY, USA, 1967. [Google Scholar]
  28. Hofenk de Graaf, J.H. The Colourful Past. Origins, Chemistry and Identification of Natural Dyestuffs; Archetype Publications: London, UK, 2004. [Google Scholar]
  29. Schweppe, H.; Winter, J. Madder and Alizarin. In Artists’s Pigments; West Fitzhugh, E., Ed.; National Gallery of Art: Washington, DC, USA, 1997; Volume 3, pp. 109–142. [Google Scholar]
  30. Kirby, J.; Spring, M.; Higgitt, C. The technology of eighteenth- and nineteenth-century red lake pigments. Natl. Gall. Tech. Bull. 2007, 28, 69–95. [Google Scholar]
  31. Grazia, C.; Clementi, C.; Miliani, C.; Romani, A. Photophysical properties of alizarin and purpurin Al(iii) complexes in solution and in solid state. Photochem. Photobiol. Sci. 2011, 10, 1249–1254. [Google Scholar] [CrossRef]
  32. Clarke, M. Mediaeval Painters’ Materials and Techniques The Montpellier Liber Diversarum Arcium; Archetype Publications: London, UK, 2011. [Google Scholar]
  33. Smith, C.S.; Hawthorne, J.G. Mappae Clavicula: A Little Key to the World of Medieval Techniques; Transactio. Am. Philos. Soc. 1974, 64, 1–128. [Google Scholar] [CrossRef]
  34. Schweppe, H.; Roosen-Runge, H. Carmine—Cochineal Carmine and Kermes Carmine. In Artists’ Pigments: A Handbook of Their History and Characteristics; Feller, R.L., Ed.; National Gallery of Art: Washington, DC, USA, 1986; Volume 1, pp. 255–283. [Google Scholar]
  35. Galli, P. A proposito del cosiddetto ‘Maestro di Crescenzago. Riv. Stor. Miniat. 2003, 8, 129–134. [Google Scholar]
  36. Mellini, R. I corali di Santa Maria Rossa di Crescenzago e la miniatura lombarda rinascimentale. Paragone. Arte 1996, 47, 127–143. [Google Scholar]
  37. Mulas, P.L. Six antiphonaires ambrosiens enluminés. Art Enluminure 2010, 23, 2–65. [Google Scholar]
  38. Mulas, P.L. I Corali di Crescenzago. Tesori della Biblioteca Capitolare di Sant’Ambrogio; Iconograf: Bergamo, Italy, 2016. [Google Scholar]
  39. Baroffio, G. Iter Liturgicum Ambrosianum. Inventario sommario di libri liturgici ambrosiani. Aevum 2000, 74, 583–603. [Google Scholar]
  40. Celora, E. I corali ambrosiani di Crescenzago: Indagine paleografica. Vox Antiq. 2020, 16, 157–186. [Google Scholar]
  41. Galli, P. A proposito di Bernardino Butinone miniatore. Arte Lomb. 2003, 107, 18–23. [Google Scholar]
  42. Mulas, P.L. La Miniatura Lombarda nell’Ultimo Quarto del Quattrocento. In Il Libro d’ore Torriani. Volume di Commento; Panini: Modena, Italy, 2009; pp. 11–83. [Google Scholar]
  43. Talsky, G.; Ristić-Šolajić, M. High-resolution/higher-order derivative spectrophotometry for identification and estimation of synthetic organic pigments in artists’ paints. Anal. Chim. Acta 1987, 196, 123–134. [Google Scholar] [CrossRef]
  44. Talsky, G.; Mayring, L.; Kreuzer, H. High-Resolution, Higher-Order UV/VIS Derivative Spectrophotometry. Angew. Chem. 1978, 17, 785–799. [Google Scholar] [CrossRef]
  45. Green, G.L.; O’Haver, T.C. Derivative Luminescence Spectrometry. Anal. Chem. 1974, 46, 2191–2196. [Google Scholar] [CrossRef]
  46. Longoni, M.; Freschi, A.; Cicala, N.; Bruni, S. Non-invasive identification of synthetic organic pigments in contemporary art paints by visible–excited spectrofluorimetry and visible reflectance spectroscopy. Spectrochim. Acta Part A Mol. Biomol. Spectrosc. 2020, 229, 117907. [Google Scholar] [CrossRef]
  47. Longoni, M.; Cacciola, E.S.; Bruni, S. UV-Excited Fluorescence as a Basis for the In-Situ Identification of Natural Binders in Historical Painting: A Critical Study on Model Samples. Chemosensors 2022, 10, 256. [Google Scholar] [CrossRef]
  48. Bisulca, C.; Picollo, M.; Bacci, M.; Kunzelman, D. Uv-Vis-Nir Reflectance Spectroscopy of Red Lakes in Paintings. In Proceedings of the 9th International Conference on NDT of Art, Jerusalem, Israel, 25–30 May 2008; pp. 1–7. [Google Scholar]
Figure 1. Illuminations examined in the Crescenzago choir books: (a) M 47–fol. 15v, Maestro di Crescenzago, St. Andrew [letter D]; (b) M 47–fol. 68v Maestro di Crescenzago, St. James and St. Philip [letter T]; (c) M 47–fol. 152v, Maestro di Crescenzago; (d) M 46–fol. 65r, Giovanni Giacomo Decio, Resurrection of Lazarus [letter T]. The measurement areas are also indicated with their corresponding numbers.
Heritage 06 00108 g001
Figure 2. Comparison between the emission spectra of four reference lakes (carmine, kermes, madder and brazilwood) spread in egg white upon different excitation wavelengths: 365 nm (purple line), 435 nm (blue line) and 500 nm (green line).
Heritage 06 00108 g002
Figure 3. Emission spectra of two brazilwood lakes before (solid lines) and after (dashed lines) the self-absorption correction. After the correction, the emission maxima of the two samples become more similar.
Heritage 06 00108 g003
Figure 4. Dendrogram generated by CA applied to the second-derivative emission spectra of the reference lake samples.
Heritage 06 00108 g004
Figure 5. Dendrogram generated by CA applied to the second-derivative emission spectra of the reference lake samples and those obtained from fuchsia and red areas in the Crescenzago choir books.
Heritage 06 00108 g005
Figure 6. Dendrogram generated by CA applied to the second-derivative emission spectra of the reference lake samples and those obtained from purple areas in the Crescenzago choir books.
Heritage 06 00108 g006
Table 1. Summary of the mock-up samples of lakes and their recipes.
DyeReferenceBinderSample
BrazilwoodO Libro de komo se fazen as kores, 15th century, Chapter 9 [26]gum arabicL1-G
gum arabicL2-G
egg whiteL1M1-A
gum arabicL1M1-G
egg whiteL1M3-A
gum arabicL1M3-G
Bolognese manuscript, 15th centuryRecipe 136 [27]egg whiteLDB1-A
gum arabicE1B-G
“Haarlem” Manuscript [28]gum arabicE1S-G
egg whiteLDB3-A
O Libro de komo se fazen as kores, 15th century,Chapter 9 [26]egg whiteR1R-A
gum arabicR1R-G
egg whiteLB1R-A
gum arabicLB1R-G
MadderB. De Puyster, Use of organic dyestuffs in the manufacture of lakes, 1920 [29] egg whiteGA-A
L. Marcucci, Saggio analitico-chimico sopra i colori minerali e mezzi di procurarsi gli artefatti gli smalti e le vernici, 1816 [30]egg whiteLG1-A
gum arabicLG1-G
egg whiteLG2-A
gum arabicLG2-G
egg whiteLG3-A
egg whiteLG4-A
CarmineAdapted from [31]egg whiteCA-A
gum arabicCA-G
Paduan manuscript, late 16th–17th century [27]gum arabicC5-G
egg whiteC6-A
gum arabicC6-G
gum arabicLG2-G
egg whiteLG3-A
egg whiteLG4-A
Lac dyeBolognese manuscript, 15th centuryRecipe 131 [27]egg whiteB131-A
gum arabicB131-G
Bolognese manuscript, 15th centuryRecipe 140 [27]egg whiteB140-A
gum arabicB140-G
Paduan manuscript, late 16th–17th century [27]gum arabicP90-G
Montpellier manuscript, 15th century [32]gum arabicMont-G
egg whiteMont-A
Mappae Clavicula, 12th century [33]egg whiteMC-A
gum arabicMC-G
KermesManuscripts of Jehan Le Bégues (Experimenta de Coloribus), 15th centuryRecipe 11 [34]egg whiteK1-A
gum arabicK1-G
egg whiteK2a-A
gum arabicK2a-G
egg whiteK2B-A
gum arabicK2B-G
Bolognese Manuscript, 15th centuryRecipe 110 [27]gum arabicK3-G
OrceinAdapted from [2]gum arabicOR-G
egg whiteOR-A
FoliumDe Arte Illuminandi, 14th century [23]egg whiteFO-A
waterFO-Aq
mixed with burnt umberFO+BU
on azuriteFO@AZ
on ultramarineFO@UL
Disclaimer/Publisher’s Note: The statements, opinions and data contained in all publications are solely those of the individual author(s) and contributor(s) and not of MDPI and/or the editor(s). MDPI and/or the editor(s) disclaim responsibility for any injury to people or property resulting from any ideas, methods, instructions or products referred to in the content.

