
Using Palaeomagnetic Techniques to Date Indigenous Archaeological Sites in New Zealand


Abstract
:1. Introduction
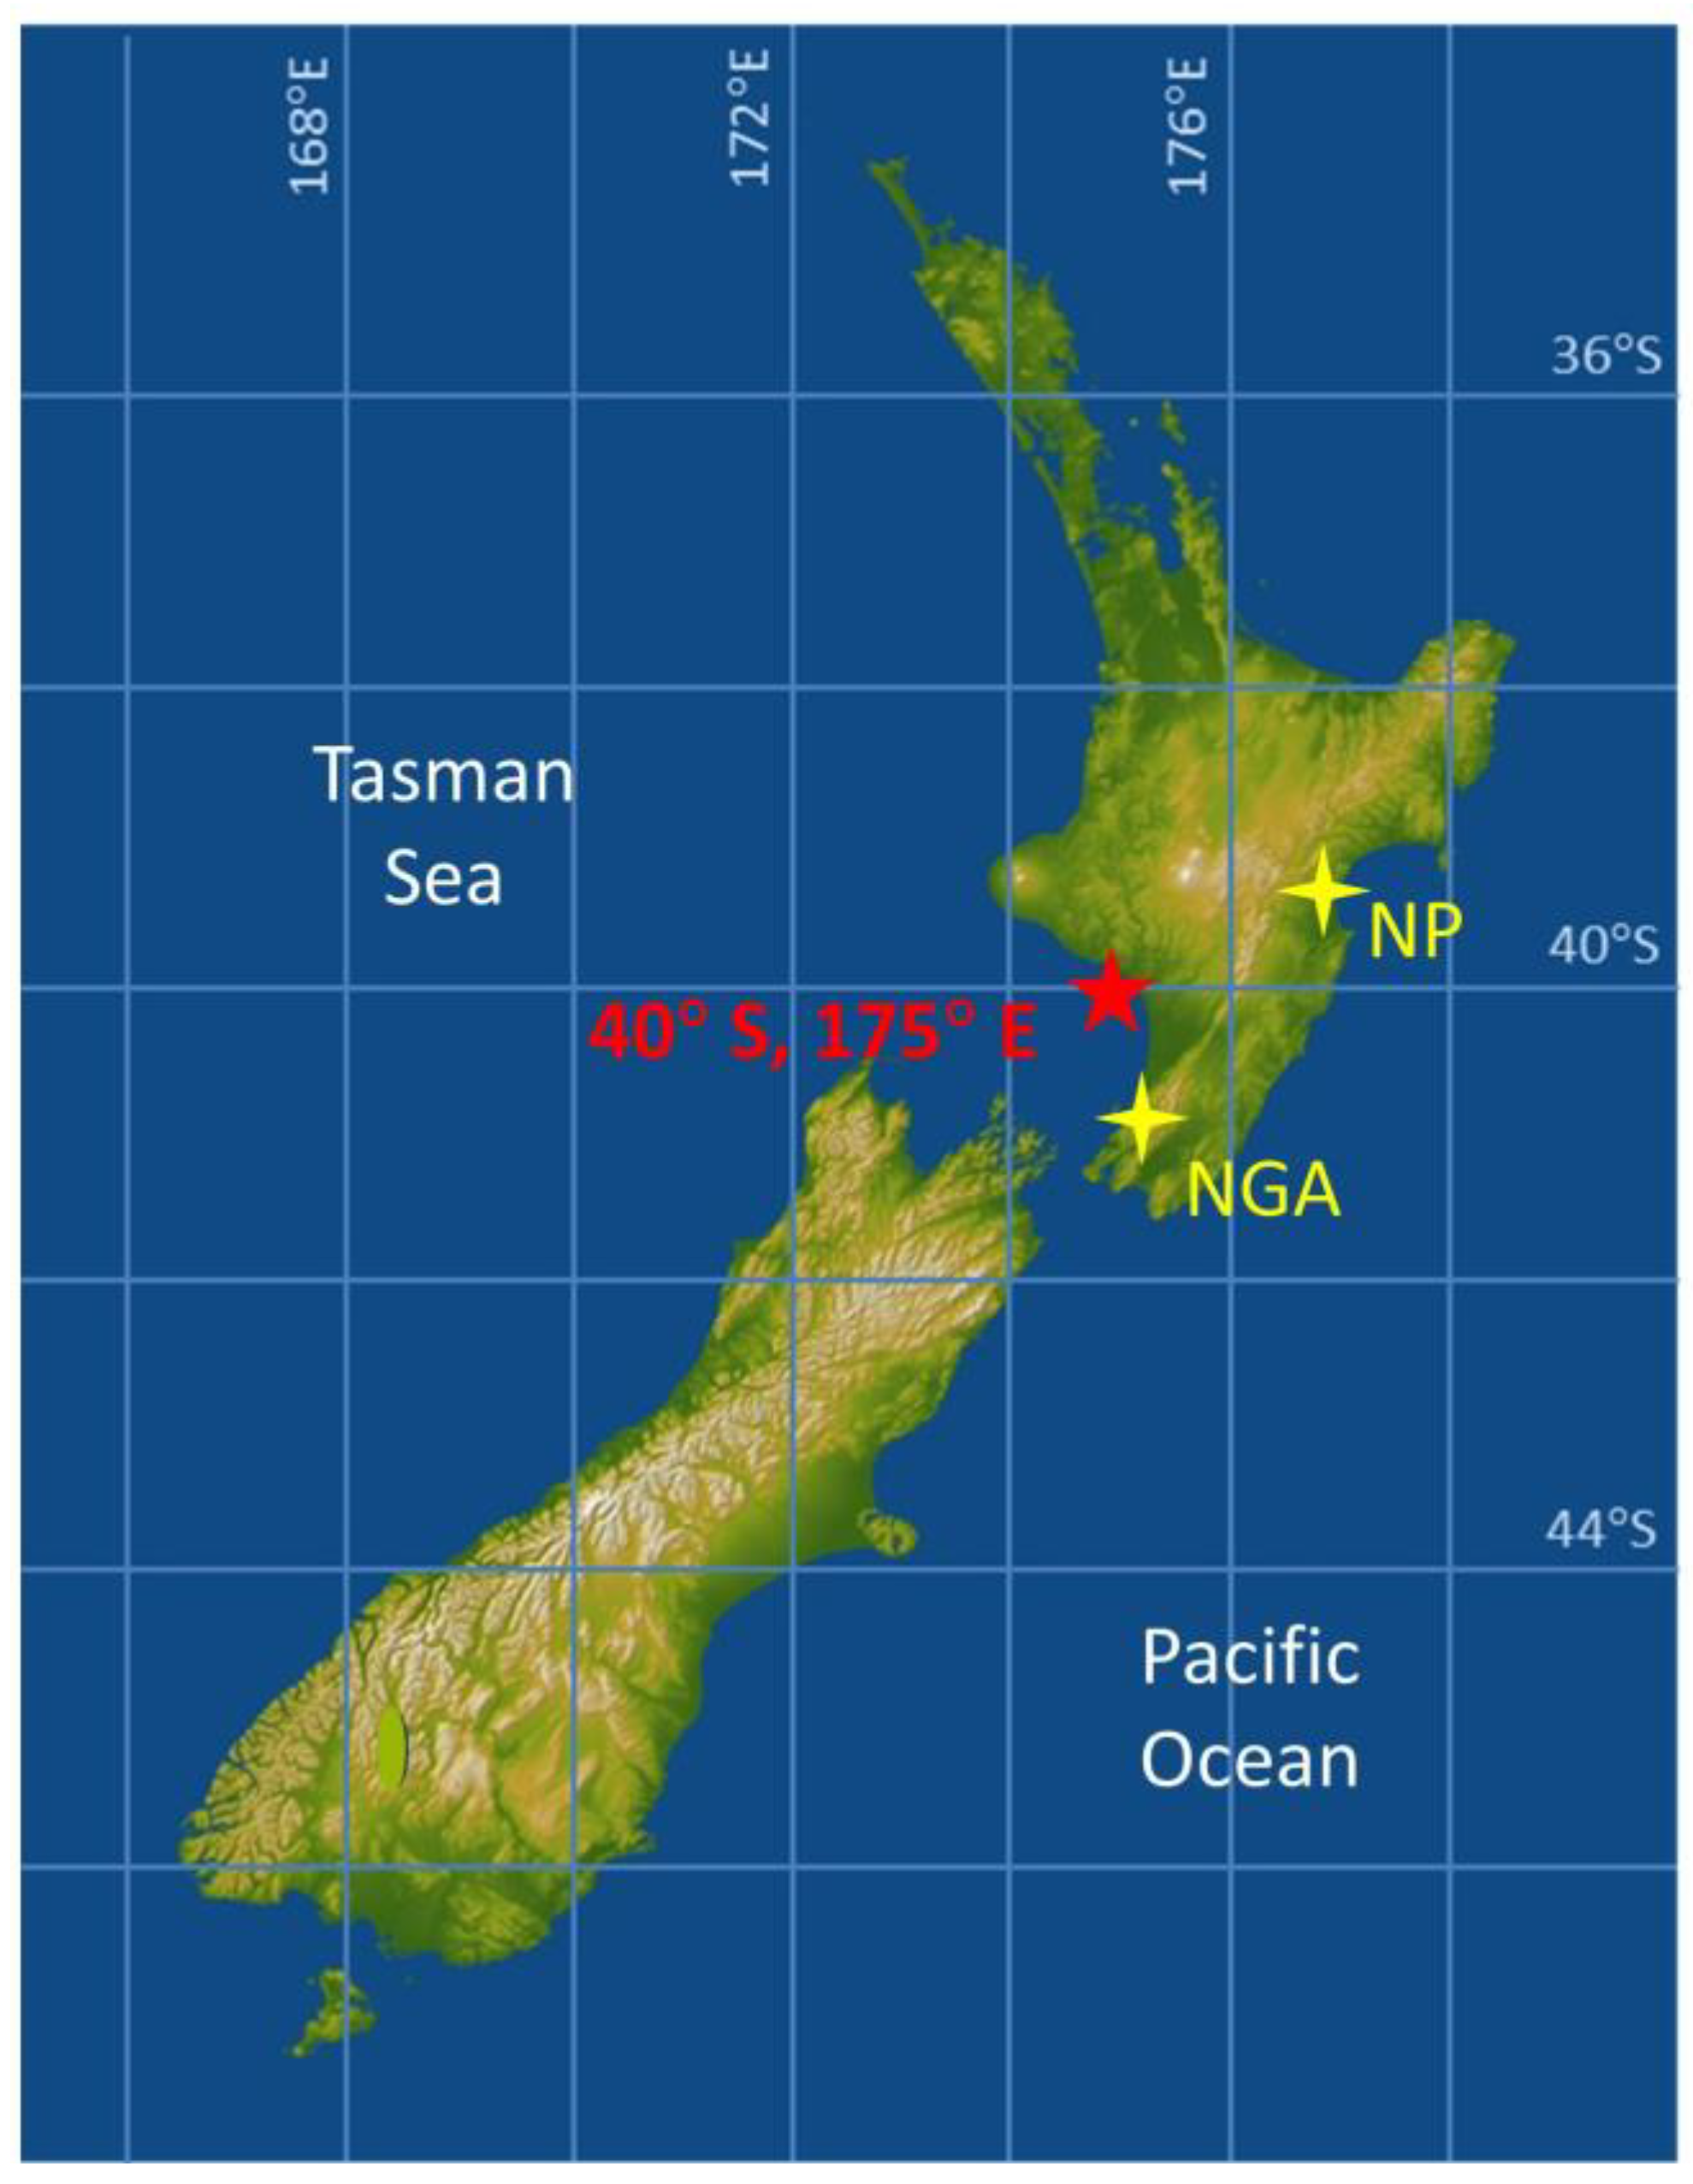
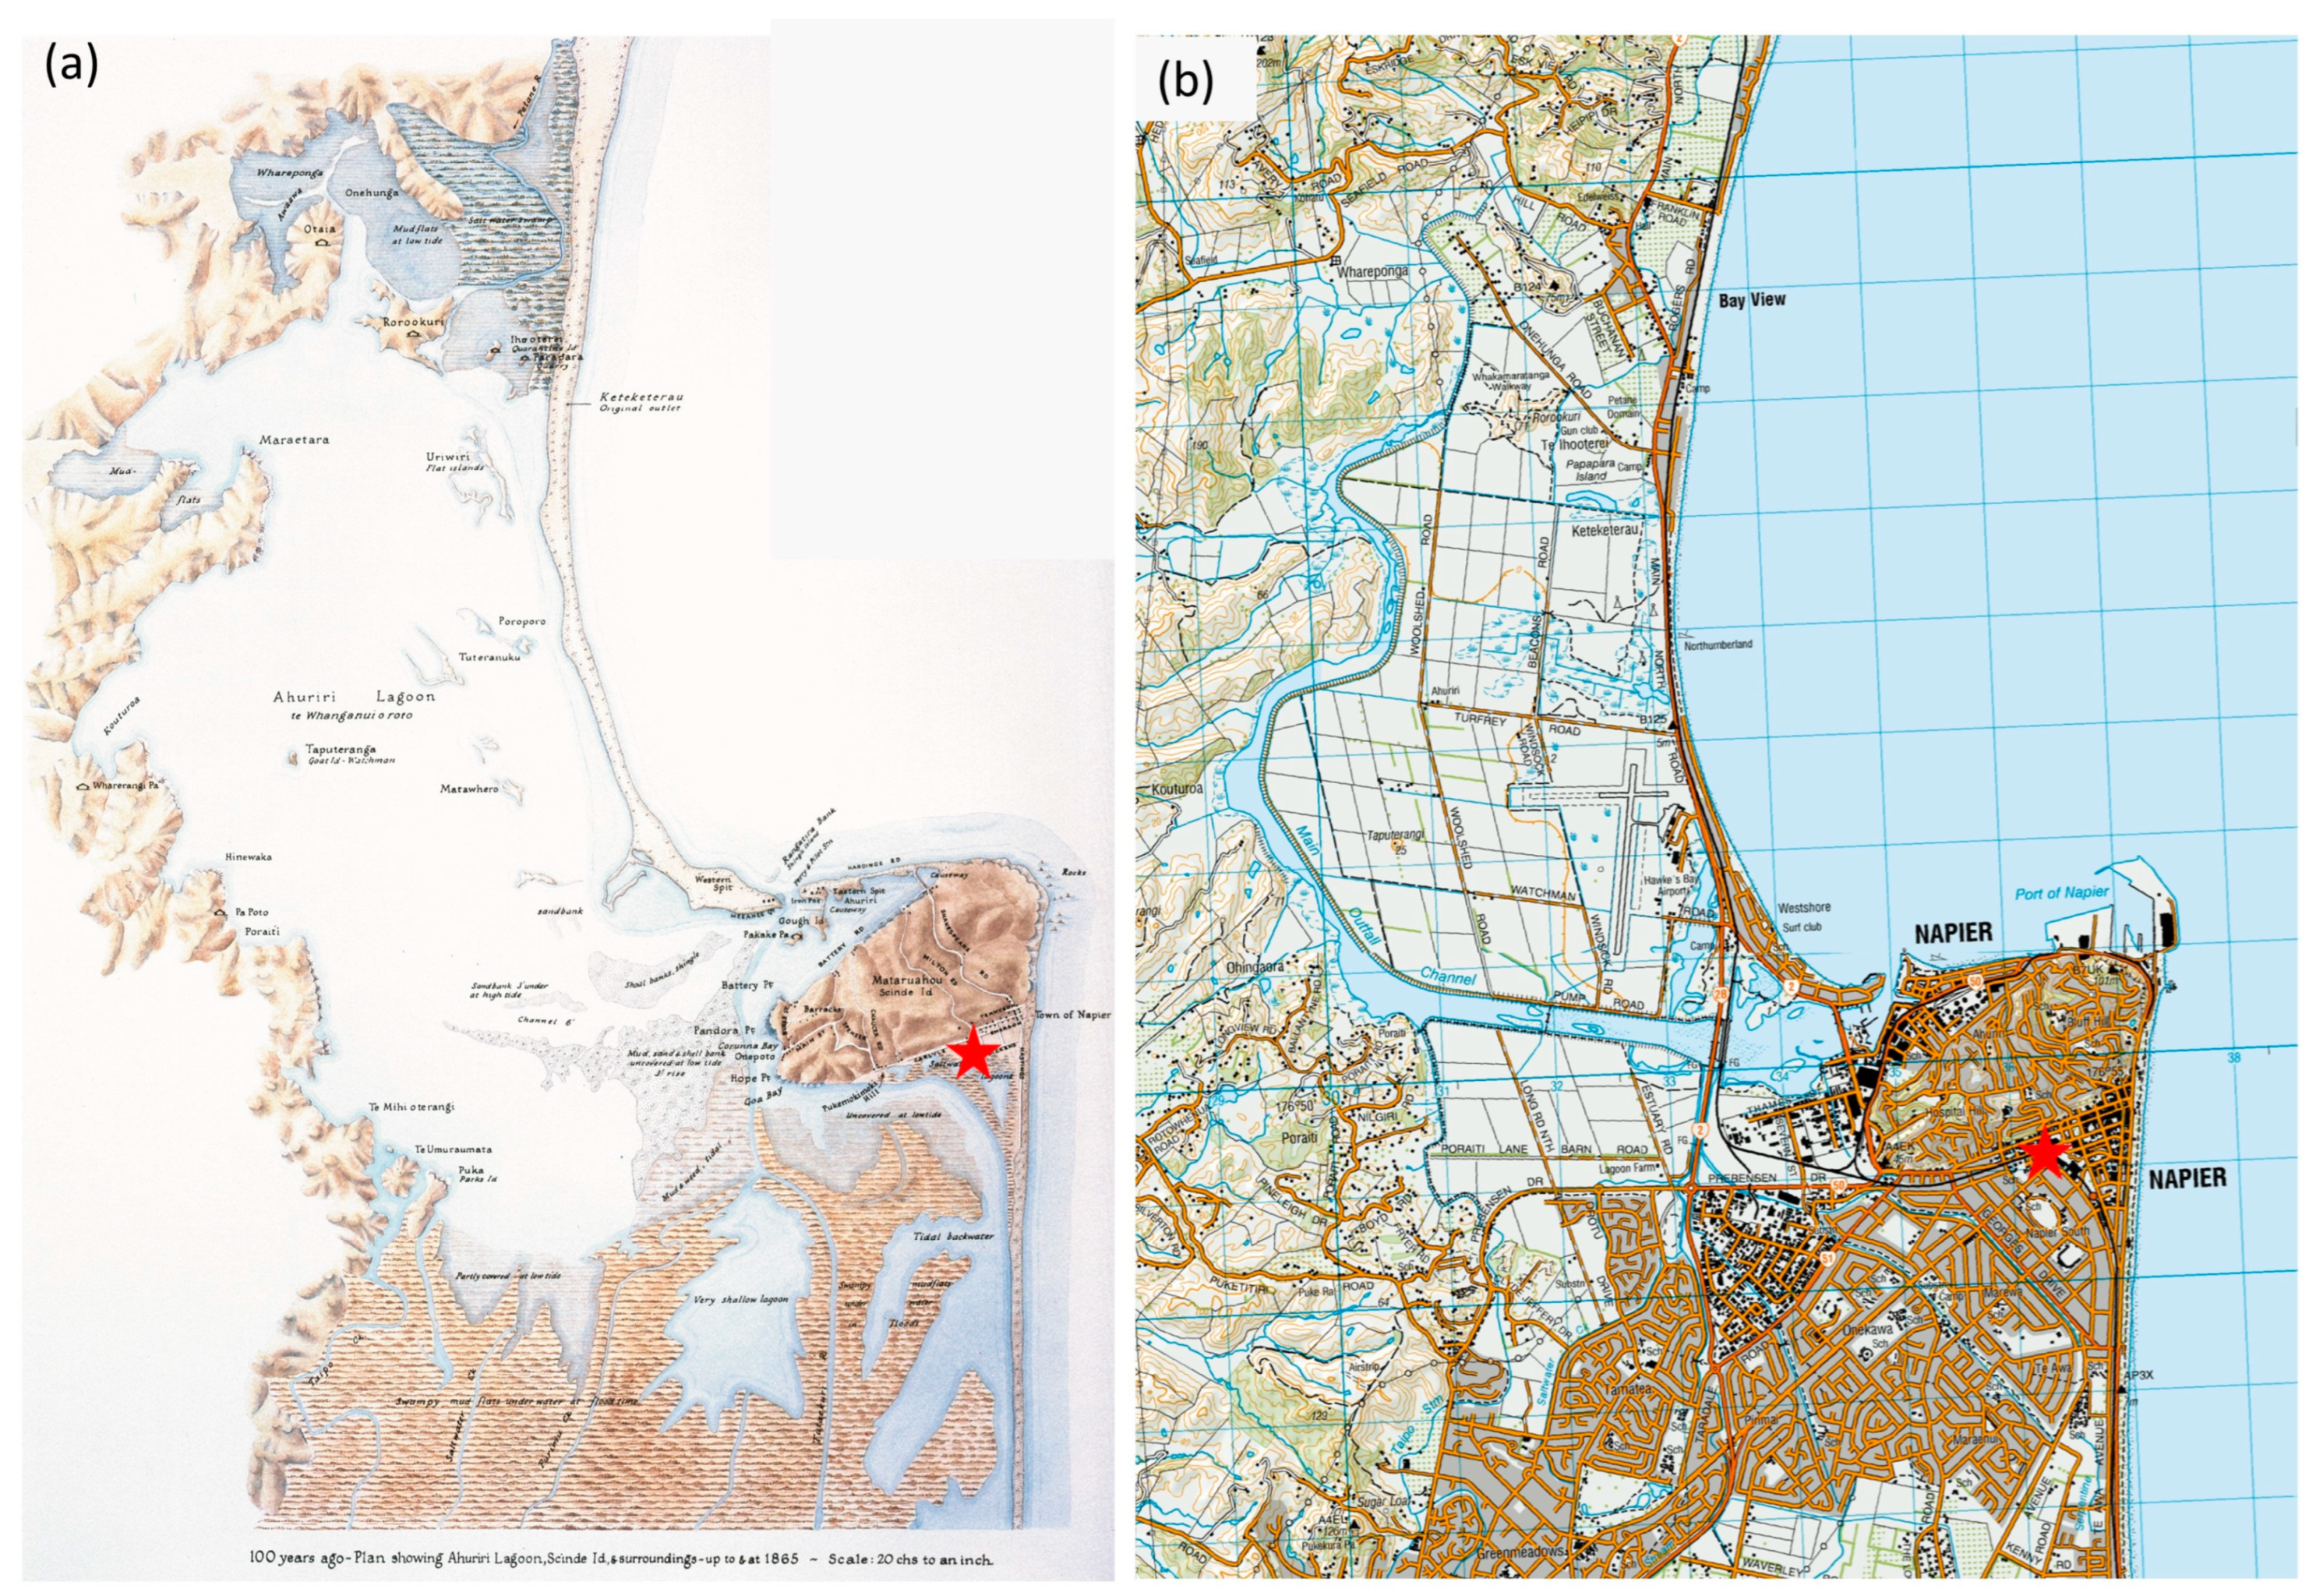
1.1. Ahuriri/Napier
1.2. Ngārara, Kapiti Coast
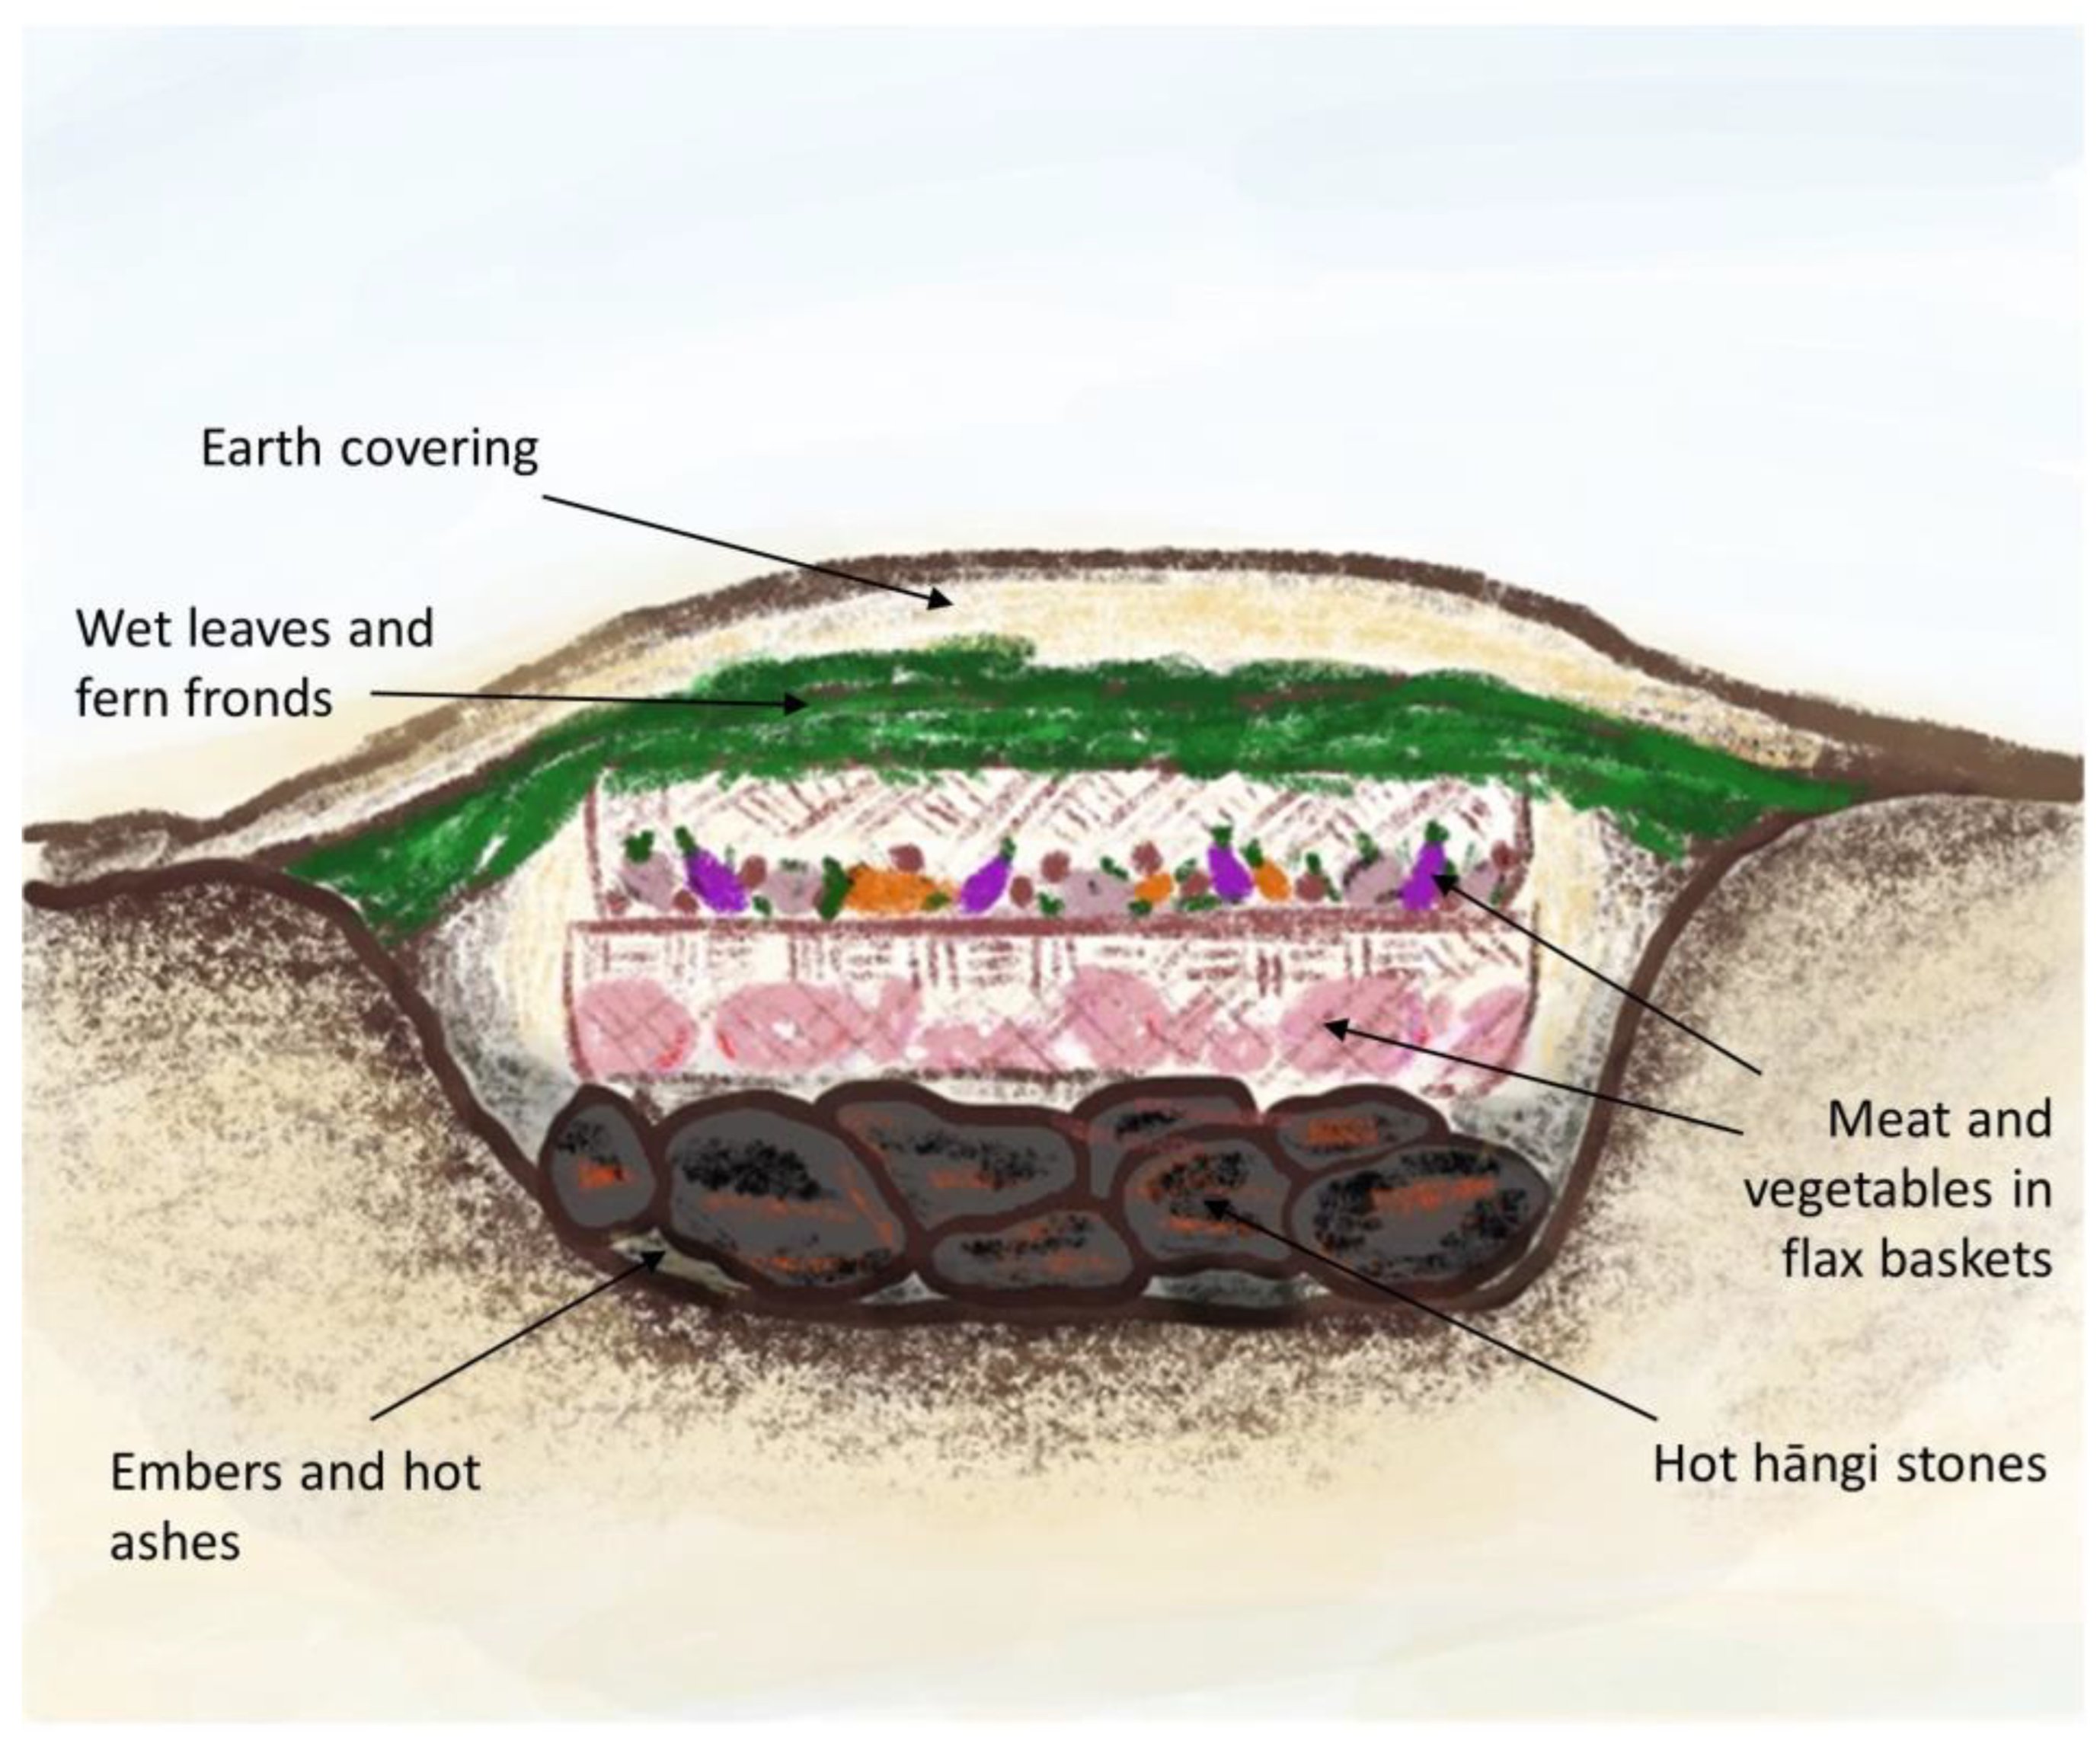
1.3. Māori Hāngī Practice
2. Methods
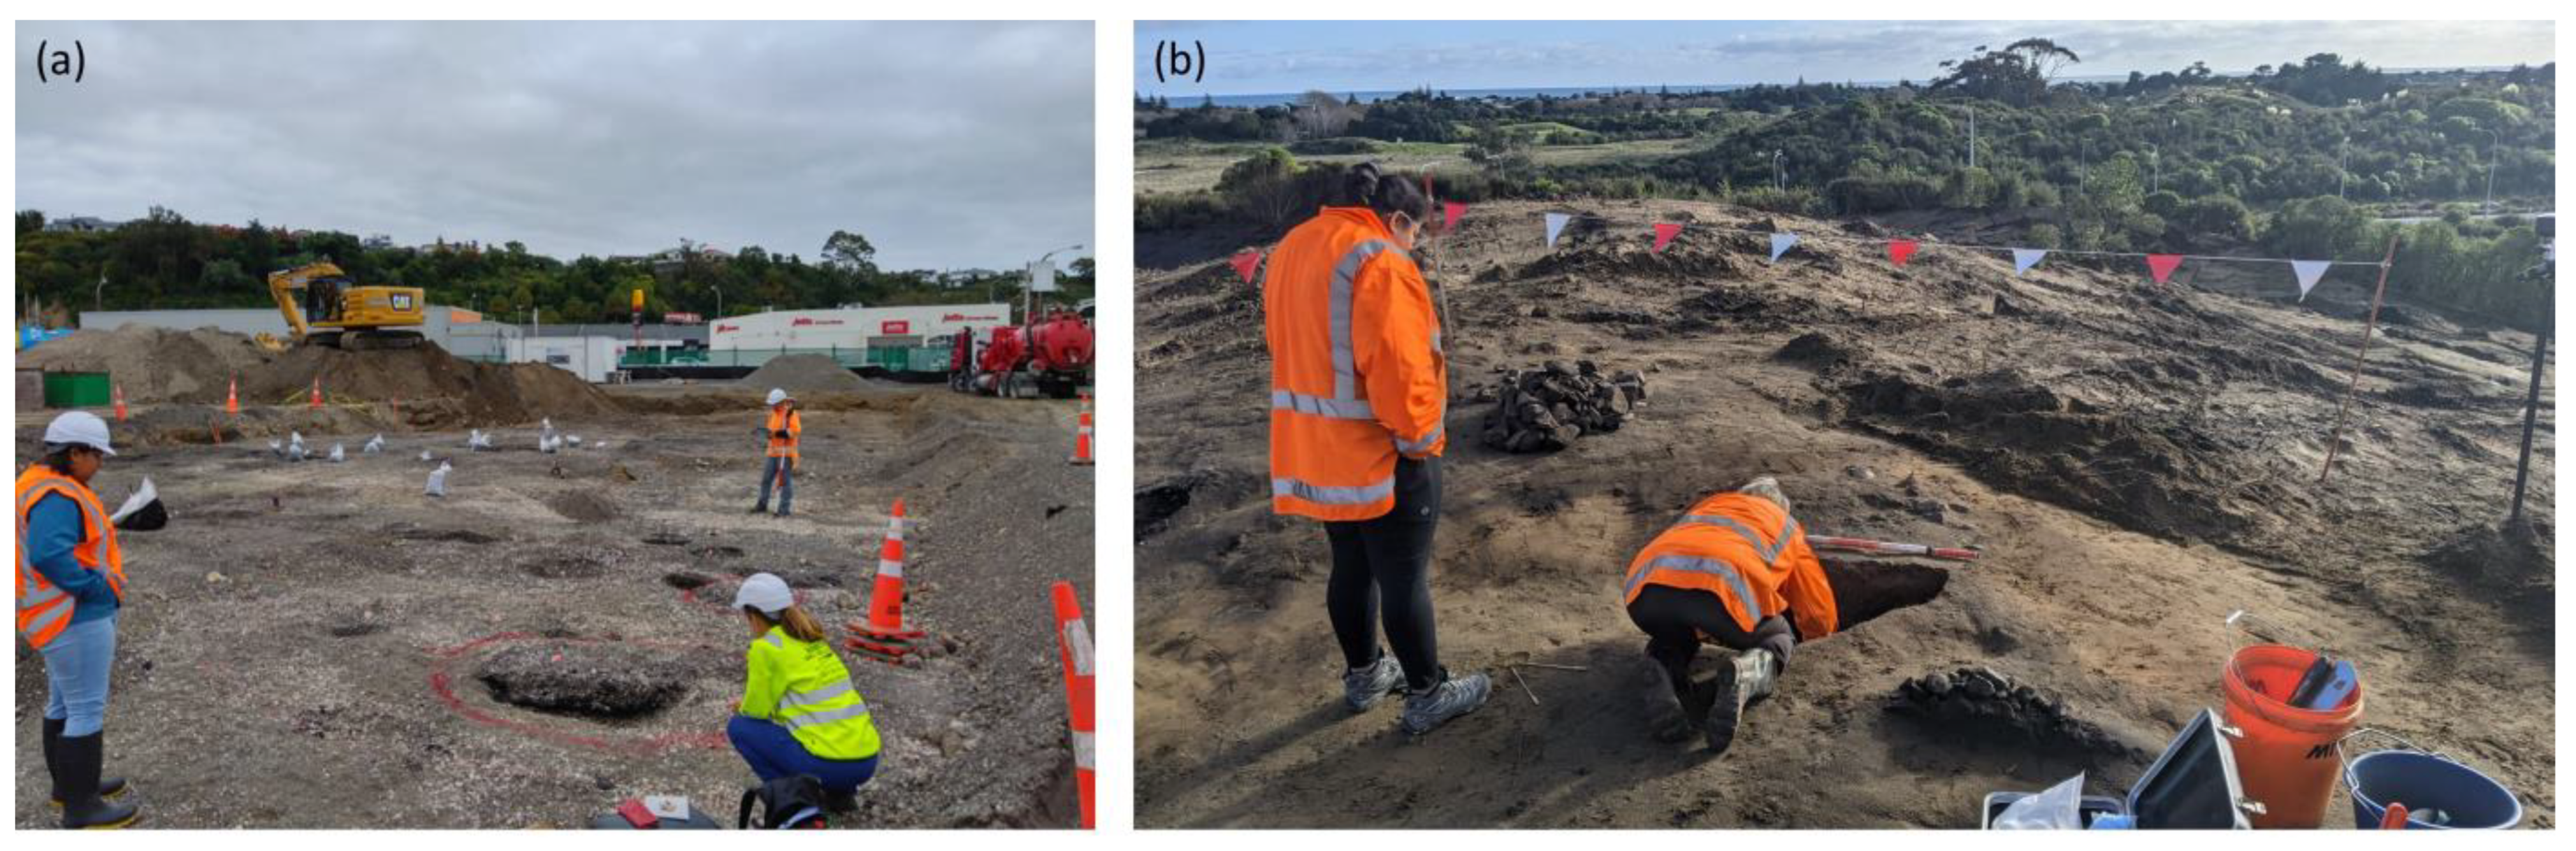
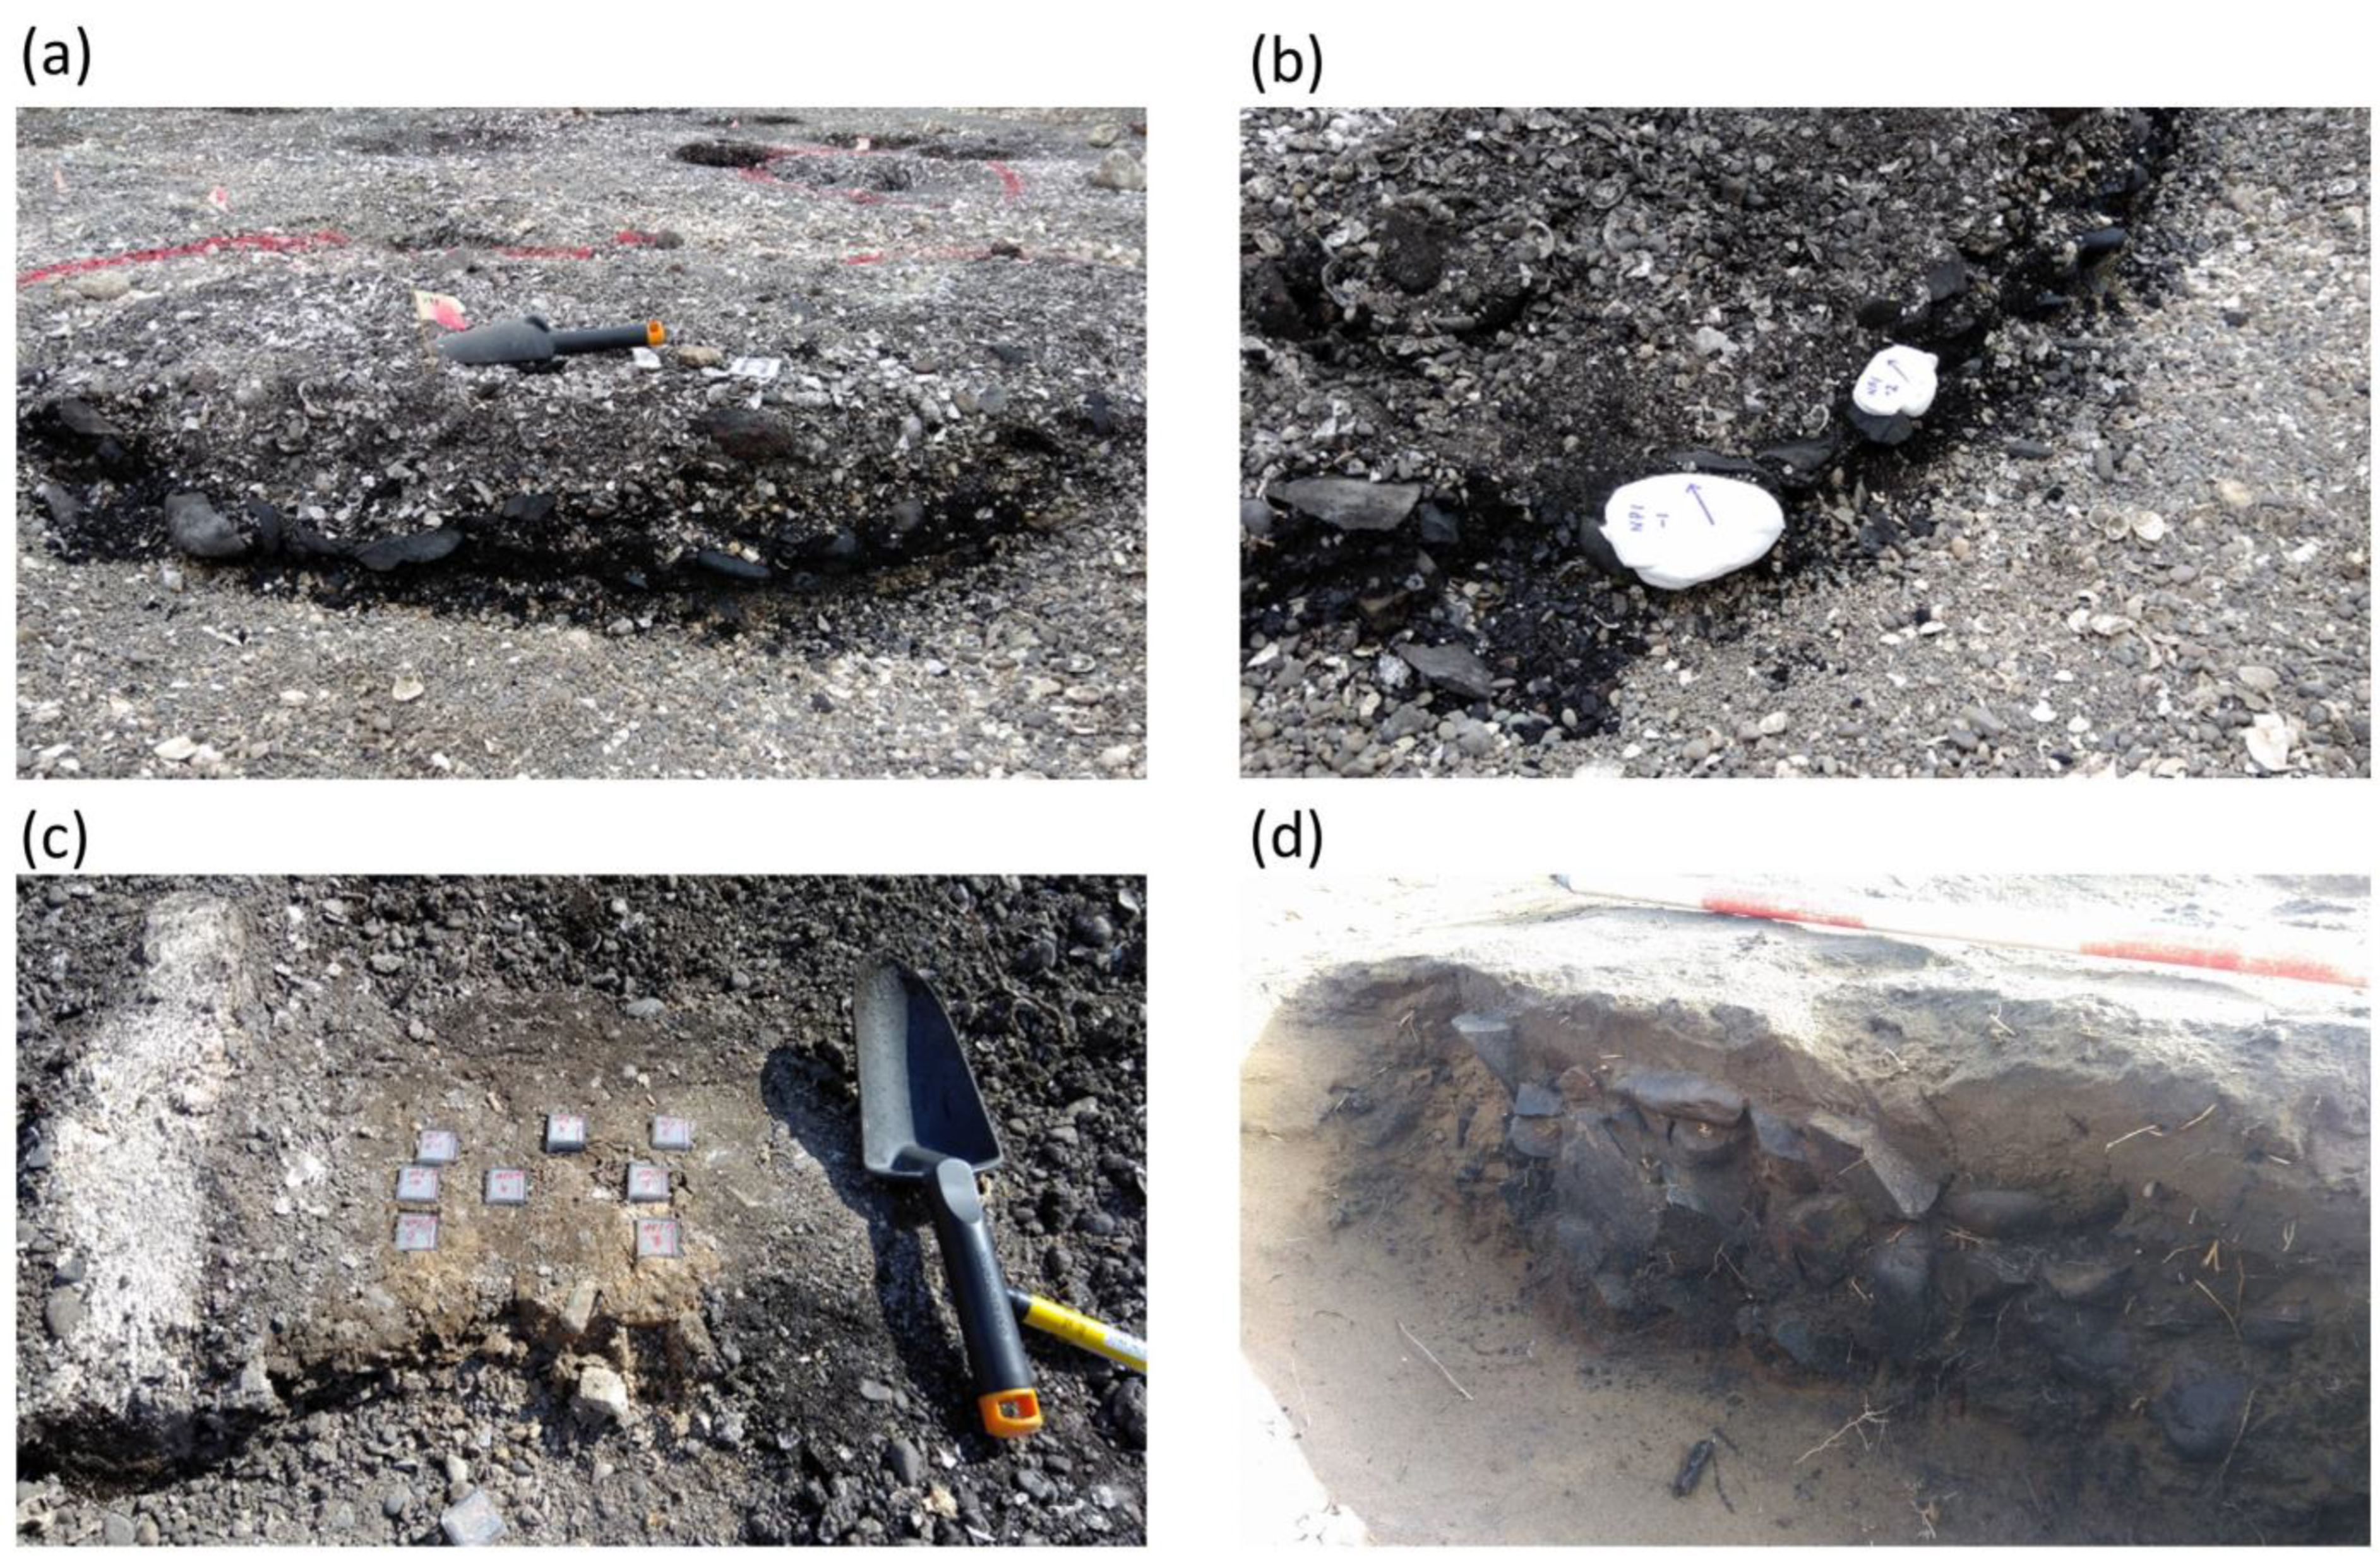
2.1. Sampling
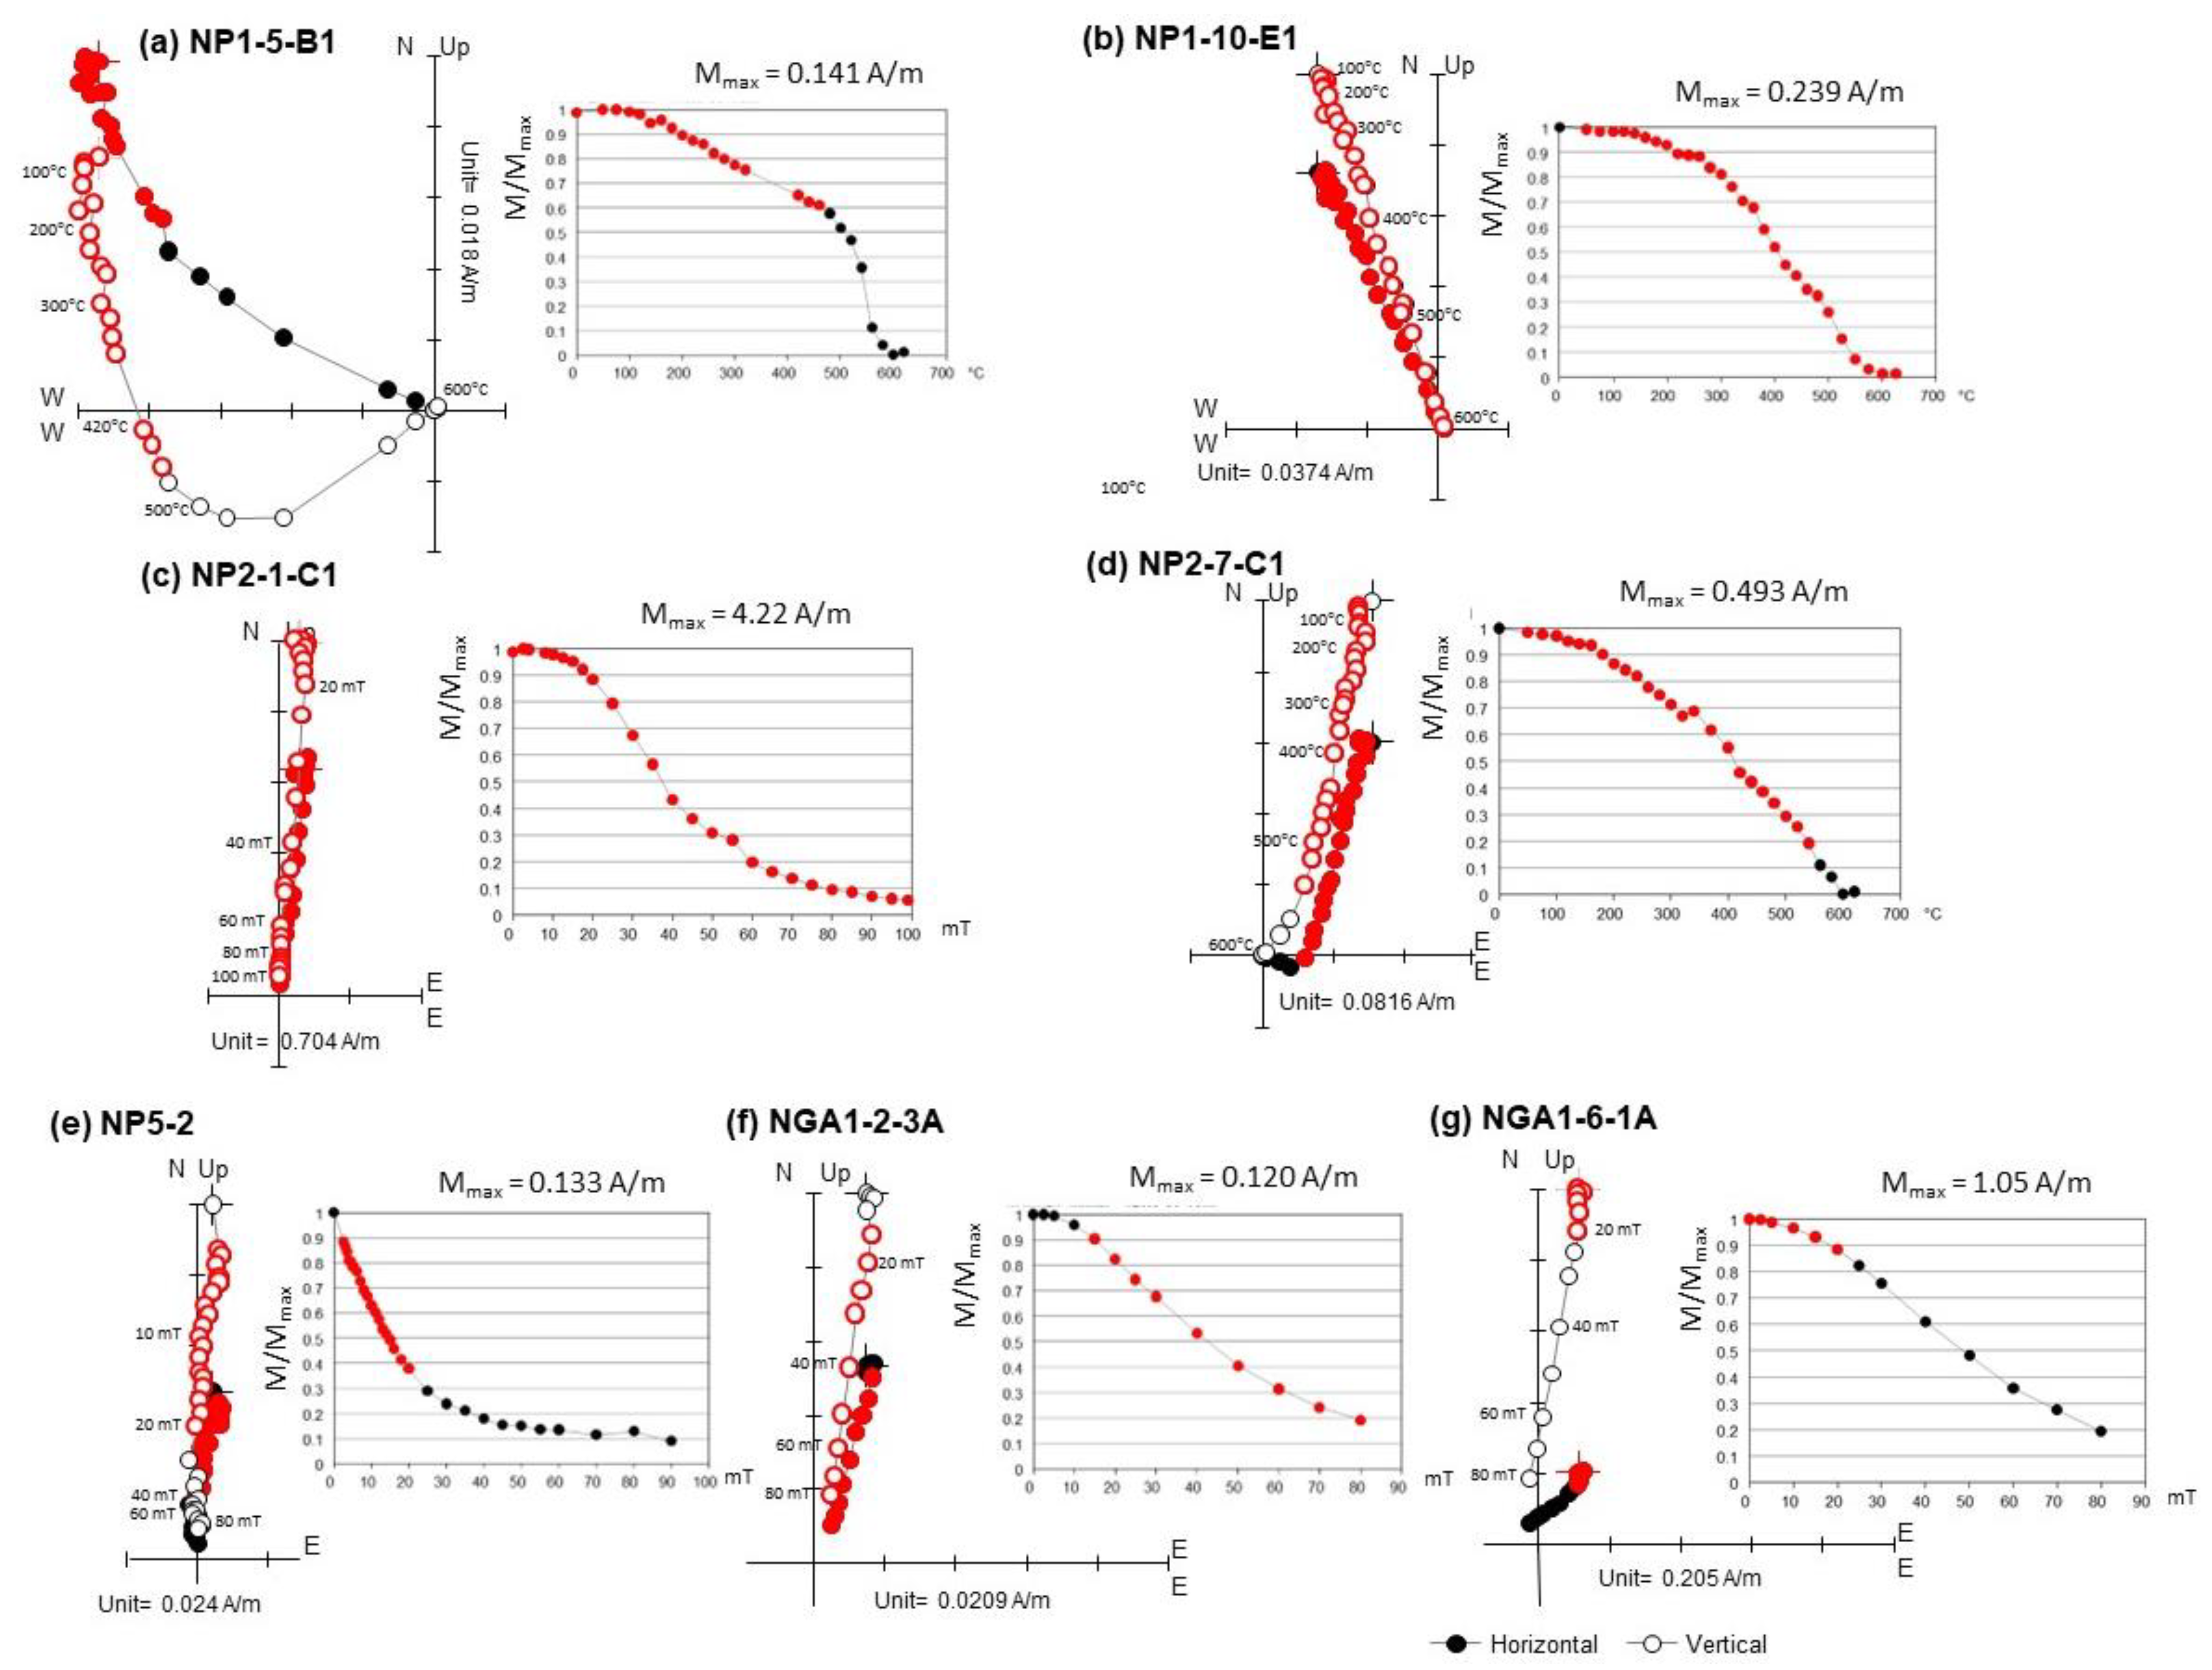
2.2. Magnetic Measurements
2.3. Archaeomagnetic Dating
3. Results
3.1. Napier
3.2. Ngārara
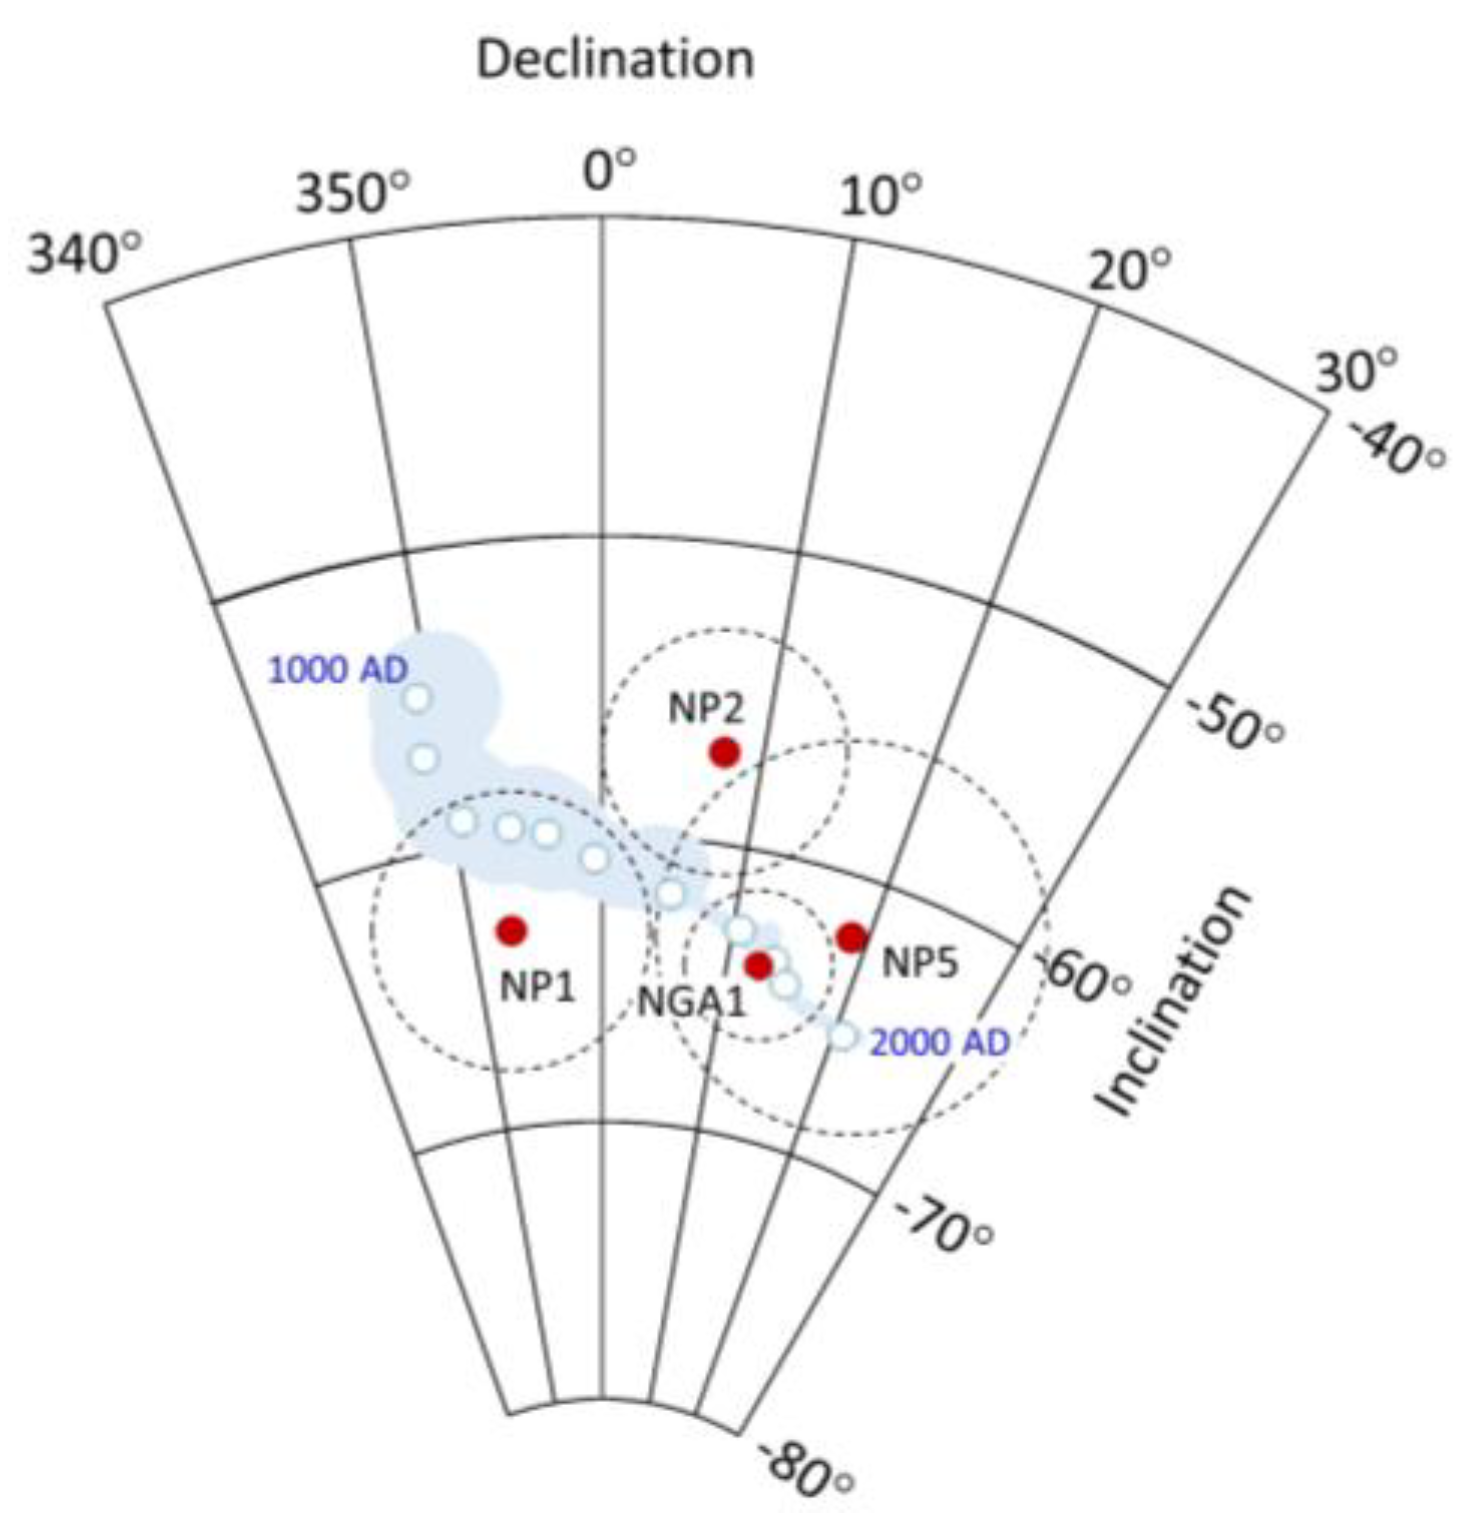
3.3. Archaeomagnetic Dating
4. Discussion
5. Conclusions
Author Contributions
Funding
Data Availability Statement
Conflicts of Interest
Appendix A
| NGA1 | |||||||
| Specimen ID | Demagnetization Procedure | ChRM Range | n (Demag Steps) | Dec (°) | Inc (°) | MAD (°) | Angle between Specimen and Overall (13 Specimen) Mean ChRM (°) |
| NGA1-1-1A | AFD (2.5–80 mT) | 20–70 mT | 7 | 15.1 | −62.2 | 1.7 | 1.6 |
| NGA1-1-1B | AFD (2.5–80 mT) | 2.5–70 mT | 11 | 10.7 | −63.3 | 1.7 | 0.74 |
| NGA1-1-1C | AFD (2.5–80 mT) | 2.5–70 mT | 11 | 9.6 | −66.3 | 1.3 | 3.64 |
| NGA1-2-1A | AFD (2.5–80 mT) | 2.5–80 mT | 12 | 17.4 | −66.2 | 1.3 | 4.14 |
| NGA1-2-3A | AFD (2.5–80 mT) | 15–80 mT | 9 | 16.1 | −59.9 | 1.6 | 3.53 |
| NGA1-2-4A | AFD (2.5–80 mT) | 15–80 mT | 9 | 5.6 | −65.0 | 1.2 | 3.54 |
| NGA1-4-1B | AFD (2.5–80 mT) | 2.5–60 mT | 10 | 191.6 | −82.8 | 1.6 | 34.4 |
| NGA1-4-2B | AFD (2.5–80 mT) | 5–70 mT | 10 | 41.9 | −81.6 | 1.4 | 20.3 |
| NGA1-4-3B | AFD (2.5–80 mT) | 2.5–60 mT | 10 | 183.1 | −85.3 | 1.9 | 31.85 |
| NGA1-5-2A | AFD (2.5–80 mT) | 15–80 mT | 9 | 10.3 | −53.0 | 1.3 | 9.84 |
| NGA1-6-1A | AFD (2.5–80 mT) | 0–20 mT | 6 | 6.7 | −74.8 | 9.0 | 12.14 |
| NGA1-7-2B | AFD (2.5–90 mT) | 15–90 mT | 10 | 31.2 | −58.6 | 2.4 | 10.29 |
| NGA1-8-2A | AFD (2.5–80 mT) | 25–80 mT | 7 | 335.8 | −67.9 | 1.1 | 15.63 |
| NGA1-8A-1B | AFD (2.5–80 mT) | 5–70 mT | 10 | 353.5 | −66.8 | 1.1 | 8.85 |
| NGA1-9-1A | AFD (2.5–90 mT) | 40–90 mT | 6 | 211.7 | −67.8 | 4.5 | 48.62 |
| NGA1-10-1A | AFD (2.5–80 mT) | 30–80 mT | 6 | 30.8 | −50.0 | 2.1 | 16.4 |
| NGA1-11-2A | AFD (2.5–90 mT) | 25–80 mT | 7 | 10.0 | −53.6 | 2.6 | 9.25 |
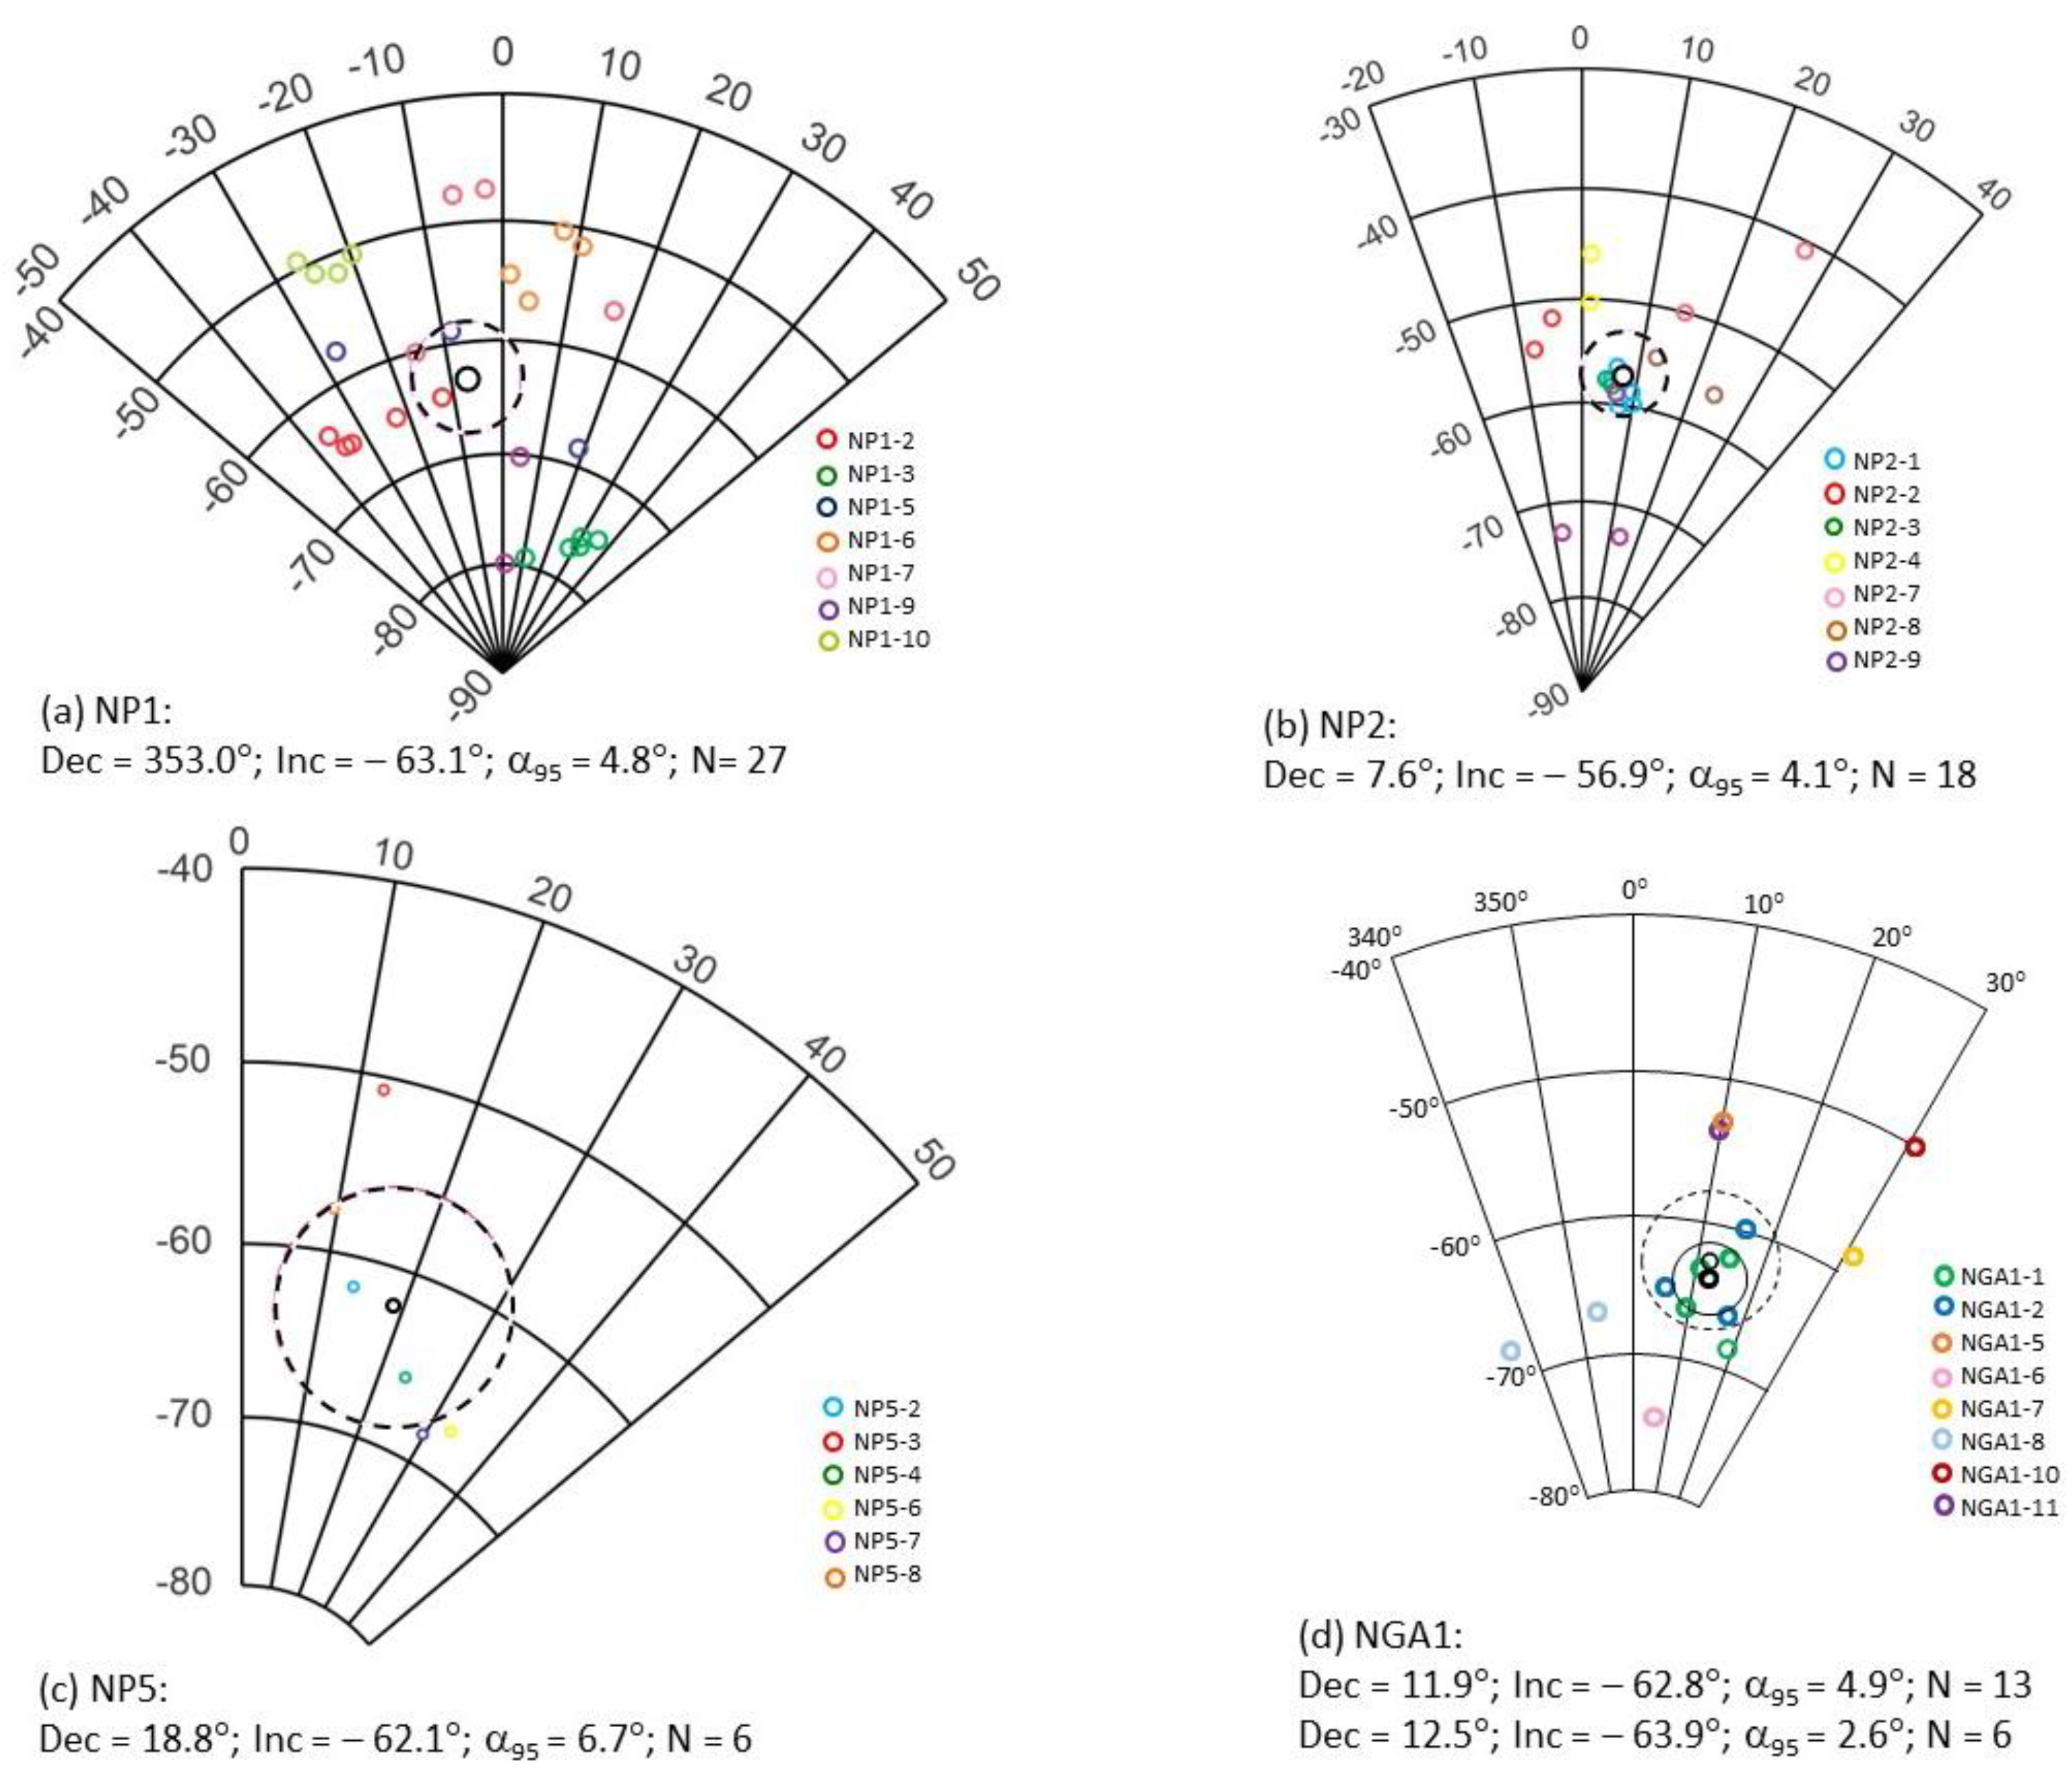
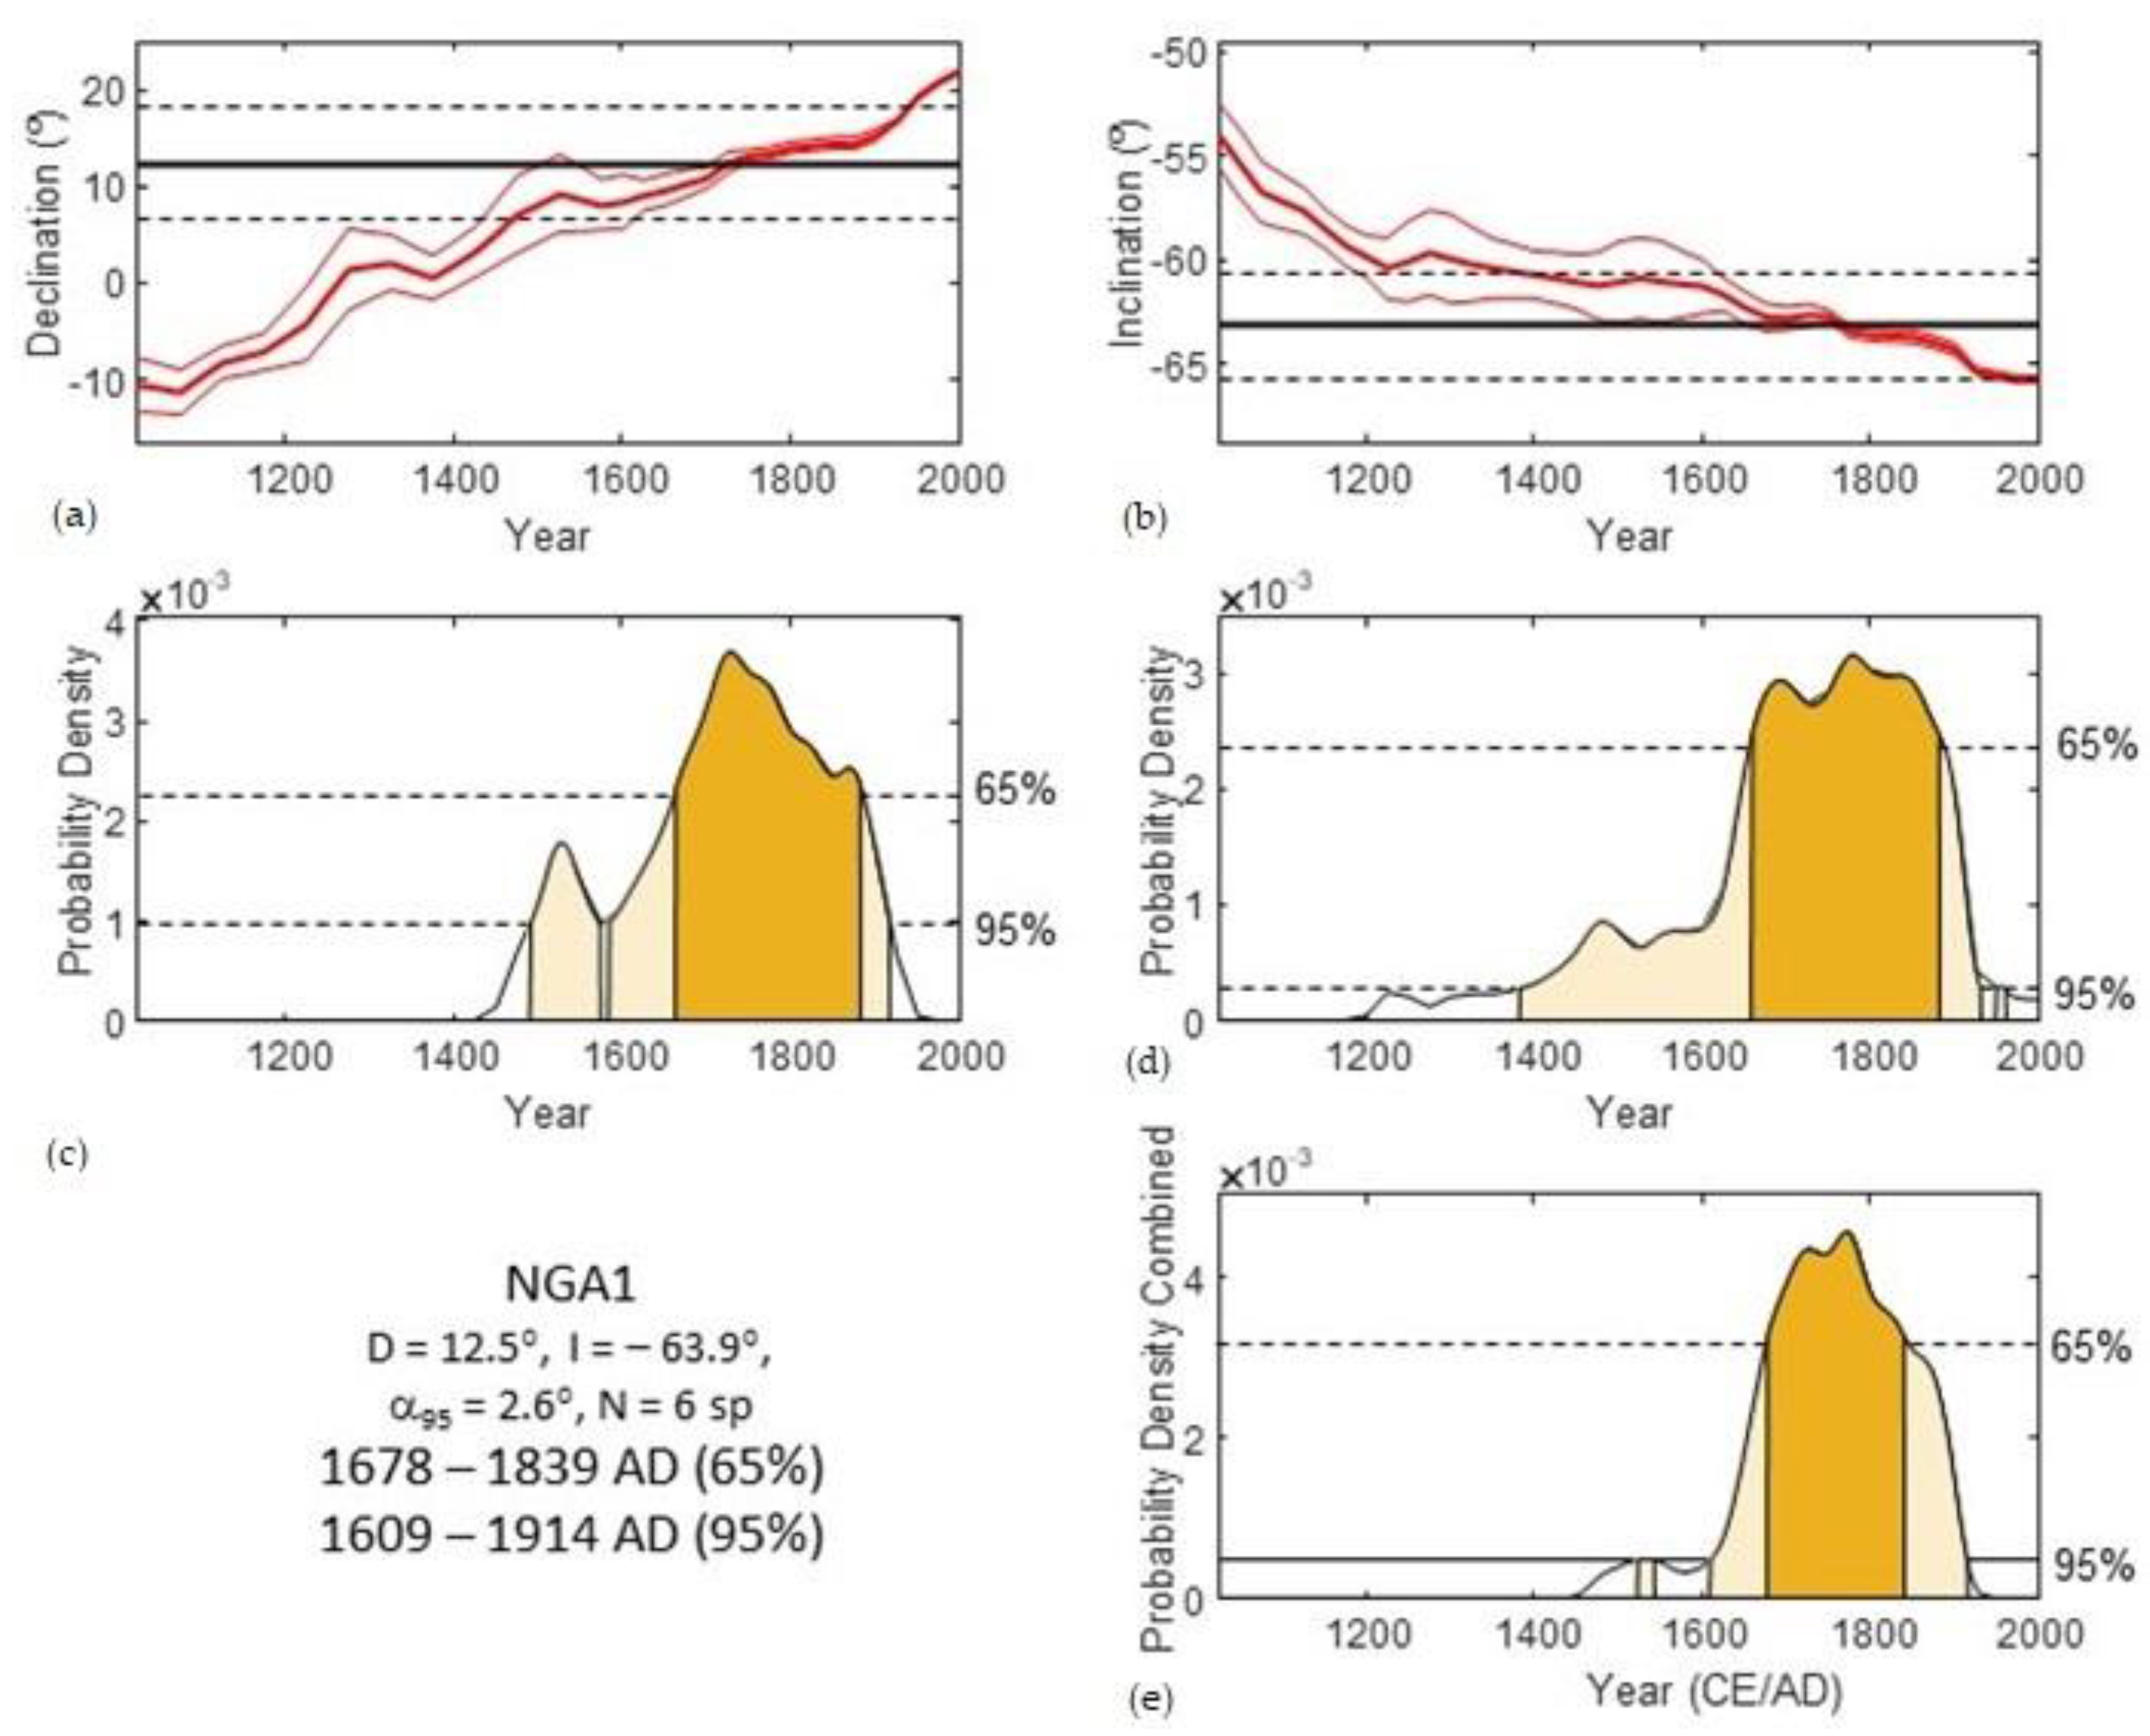
| NGA1 Mean ChRM: Dec = 11.9°, Inc = −62.8°, N = 13 specimens from 8 stones, α95 = 4.9°, 2θ63 = 19.0° | |||||||
| NGA1 Mean ChRM: Dec = 12.5°, Inc = −63.9°, N = 6 specimens from 2 stones, α95 = 2.6°, 2θ63 = 6.84° | |||||||
| NP1 | |||||||
| Specimen ID | Demagnetization Procedure | ChRM Range | n (Demag Steps) | Dec (°) | Inc (°) | MAD (°) | Angle between Specimen and Stone Mean ChRM (°) |
| NP1-1-A1 | AFD (2.5–99 mT) THD (300–600 °C) | 2.5–99 mT 300-600 °C | 25 | 314.2 | −43.3 | 0.9 | 5.3 |
| NP1-1-A2 | THD-P (100–600 °C) | 100–600 °C | 18 | 315.0 | −44.9 | 1.0 | 4.8 |
| NP1-1-B1 | THD (50–640 °C) | 50–640 °C | 19 | 297.4 | −45.5 | 0.8 | 8.0 |
| NP1-1-B2 | THD-P (100–600 °C) | 200–600 °C | 17 | 304.0 | −56.4 | 1.8 | 9.8 |
| NP1-1-C1 | THD (50–620 °C) | 50–620 °C | 28 | 298.8 | −45.9 | 0.8 | 7.0 |
| NP1-1-D1 | THD (50–620 °C) | 50–620 °C | 28 | 312.6 | −46.1 | 0.8 | 2.8 |
| NP1-1-E1 | AFD (2.5–99 mT) THD (300–600 °C) | 10–99 mT 300–600 °C | 28 | 318.2 | −49.5 | 0.7 | 6.7 |
| NP1-1-F1 | THD (50–640 °C) | 50–640 °C | 19 | 307.6 | −47.1 | 0.8 | 0.8 |
| NP1-1-H1 | THD (50–620 °C) | 50–620 °C | 28 | 308.2 | −44.7 | 0.9 | 2.3 |
| NP1-1-H2 | AFD (2.5–99 mT) THD (300–600 °C) | 3.0–99 mT 300–600 °C | 32 | 311.0 | −45.2 | 0.7 | 2.4 |
| Mean ChRM, stone NP1-1: Dec = 308.8°, Inc = −47.0°, N = 10 specimens, α95 = 3.6°, 2θ63 = 12.0°; angle between stone mean and overall NP1 mean ChRM = 29.14° | |||||||
| NP1-2-A1 | AFD (2.5–99 mT) THD (300–600 °C) | 18–99 mT 300-–600 °C | 27 | 325.3 | −65.0 | 1.1 | 2.9 |
| NP1-2-B1 | THD (50–640 °C) | 100–640 °C | 18 | 326.7 | −65.1 | 1.1 | 2.3 |
| NP1-2-C1 | THD (50–620 °C) | 120–620 °C | 25 | 344.0 | −47.2 | 1.2 | 18.7 |
| NP1-2-D1 | THD (50–640 °C) | 50–640 °C | 19 | 337.4 | −64.9 | 1.1 | 2.3 |
| NP1-2-E1 | THD-P (100-600 °C) | 100–600 °C | 18 | 347.6 | −64.4 | 1.1 | 6.6 |
| NP1-2-E1 | AFD (2.5–99 mT) THD (300–600 °C) | 10–99 mT 300–600 °C | 26 | 323.7 | −63.4 | 0.9 | 3.9 |
| Mean ChRM, stone NP1-2: Dec = 332.1°, Inc = −64.8°, N = 5 specimens, α95 = 4.2°, 2θ63 = 8.8°; angle between stone mean and overall NP1 mean ChRM = 9.29° | |||||||
| NP1-3-A1 | AFD (2.5–99 mT) THD (300–600 °C) | 18–99 mT 300–600 °C | 27 | 11.0 | −79.2 | 0.8 | 4.2 |
| NP1-3-B1 | THD (50–660 °C) | 50–640 °C | 30 | 28.1 | −77.0 | 1.1 | 0.2 |
| NP1-3-C1 | THD (50–640 °C) | 50–640 °C | 19 | 30.2 | −75.6 | 1.1 | 1.3 |
| NP1-3-C2 | THD-P (100–600 °C) | 150–600 °C | 17 | 35.7 | −75.0 | 1.1 | 2.6 |
| NP1-3-E1 | AFD (2.5–99 mT) THD (300–600 °C) | 10–99 mT 300–600 °C | 28 | 31.4 | −76.4 | 0.7 | 0.9 |
| Mean ChRM, stone NP1-3: Dec = 28.2°, Inc = −76.8°, N = 5 specimens, α95 = 2.5°, 2θ63 = 5.2°; angle between stone mean and overall NP1 mean ChRM = 17.70° | |||||||
| NP1-4-B1 | THD (50–640 °C) | 50–640 °C | 30 | 209.4 | −71.6 | 1.6 | 19.5 |
| NP1-4-C1 | AFD (2.5–99 mT) THD (300–600 °C) | 30–99 mT 300-600 °C | 24 | 278.5 | −71.0 | 0.6 | 1.7 |
| NP1-4-D1 | THD (50–640 °C) | 50–640 °C | 19 | 274.3 | −70.1 | 0.7 | 1.1 |
| NP1-4-E1 | THD-P (100–600 °C) | 100–600 °C | 18 | 266.9 | −72.4 | 0.8 | 2.4 |
| Mean ChRM, stone NP1-4: Dec = 273.4°, Inc = −71.2°, N = 3 specimens, α95 = 3.3°, 2θ63 = 4.4°; angle between stone mean and overall NP1 mean ChRM = 29.48° | |||||||
| NP1-5-A1 | AFD (2.5–99 mT) THD (300–600 °C) | 2.5–99 mT 300-600 °C | 26 | 332.9 | −31.4 | 1.0 | 33.5 |
| NP1-5-A2 | THD-P (100–625 °C) | 100–325 °C | 9 | 18.6 | −68.4 | 5.6 | 12.5 |
| NP1-5-B1 | THD (50–620 °C) | 50–460 °C | 17 | 332.6 | −57.5 | 2.6 | 10.6 |
| NP1-5-C1 | THD (50–640 °C) | 50–420 °C | 8 | 351.4 | −58.9 | 5.5 | 3.9 |
| Mean ChRM, stone NP1-5: Dec = 351.2°, Inc = −62.8°, N = 3 specimens, α95 = 18.3°, 2θ63 = 23.8°; angle between stone mean and overall NP1 mean ChRM = 0.87° | |||||||
| NP1-6-A1 | AFD (2.5–99 mT) THD (300–600 °C) | 2.5–99 mT 300–600 °C | 34 | 10.6 | −51.5 | 0.9 | 3.3 |
| NP1-6-A2 | THD (50–660 °C) | 50–580 °C | 27 | 7.9 | −50.5 | 1.0 | 3.0 |
| NP1-6-B1 | THD (50–640 °C) | R.T.-460 °C | 11 | 4.0 | −56.6 | 7.5 | 3.5 |
| NP1-6-B2 | THD-P (100–625 °C) | R.T.-400 °C | 11 | 1.1 | −54.4 | 8.8 | 3.1 |
| Mean ChRM, stone NP1-6: Dec = 6.0°, Inc = −53.3°, N = 4 specimens, α95 = 4.3°, 2θ63 = 7.5°; angle between stone mean and overall NP1 mean ChRM = 11.91° | |||||||
| NP1-7-A1 | THD (50–640 °C) | 50–640 °C | 19 | 357.9 | −47.4 | 0.8 | 5.9 |
| NP1-7-B1 | THD (50–640 °C) | 50–420 °C | 19 | 354.0 | −47.7 | 2.8 | 6.3 |
| NP1-7-C1 | THD-P (100-600 °C) | 100–500 °C | 18 | 17.1 | −56.1 | 2.9 | 11.1 |
| NP1-7-C2 | THD (50–620 °C) | 50–320 °C | 14 | 344.8 | −60.1 | 3.9 | 10.1 |
| Mean ChRM, stone NP1-7: Dec = 358.5°, Inc = −53.3°, N = 4 specimens, α95 = 11.4°, 2θ63 = 19.9°; angle between stone mean and overall NP1 mean ChRM = 10.21° | |||||||
| NP1-8-A1 | AFD (2.5–99 mT) THD (300–600 °C) | 15–99 mT 300–600 °C | 28 | 50.2 | −46.2 | 1.4 | 0.8 |
| NP1-8-B1 | THD (50–620 °C) | 75–620 °C | 28 | 52.2 | −44.1 | 2.0 | 2.1 |
| NP1-8-B2 | THD-P (100–600 °C) | 150–600 °C | 18 | 48.0 | −45.8 | 2.2 | 1.6 |
| Mean ChRM, stone NP1-8: Dec = 50.2°, Inc = −45.4°, N = 3 specimens, α95 = 2.8°, 2θ63 = 3.7°;angle between stone mean and overall NP1 mean ChRM = 36.19° | |||||||
| NP1-9-A1 | THD (50–640 °C) | 50–175 °C | 3 | 306.3 | −60.4 | 10.6 | 24.6 |
| NP1-9-B1 | THD (50–620 °C) | 50–180 °C | 7 | 1.2 | −79.9 | 2.4 | 4.8 |
| NP1-9-C1 | THD-P (100–600 °C) | R.T.-225 °C | 5 | 4.6 | −70.2 | 4.7 | 4.9 |
| Mean ChRM, stone NP1-9: Dec = 3.4°, Inc = −75.1°, N = 2 specimens, α95 = 21.4°, 2θ63 = 13.8°; angle between stone mean and overall NP1 mean ChRM = 12.52° | |||||||
| NP1-10-A1 | THD (50–640 °C) | 50–640 °C | 19 | 333.4 | −49.4 | 1.4 | 2.4 |
| NP1-10-B1 | AFD (2.5–99 mT) THD (300–600 °C) | 2.5–99 mT 300–600 °C | 34 | 340.2 | −50.6 | 0.8 | 2.3 |
| NP1-10-D1 | THD-P (100–600 °C) | 100–600 °C | 18 | 337.6 | −51.6 | 1.6 | 1.1 |
| NP1-10-E1 | THD (50–625 °C) | 50–625 °C | 28 | 334.8 | −50.9 | 0.7 | 1.1 |
| Mean ChRM, stone NP1-10: Dec = 336.5°, Inc = −50.7°, N = 4 specimens, α95 = 2.4°, 2θ63 = 4.3°; angle between stone mean and overall NP1 mean ChRM = 15.23° | |||||||
| NP1-11-A1 | THD-P (100–600 °C) | 100-500 °C | 14 | 68.5 | 8.6 | 1.2 | 6.7 |
| NP1-11-B1 | THD (50–640 °C) | 50–480 °C | 22 | 55.1 | 6.8 | 2.9 | 6.7 |
| Mean ChRM, stone NP1-11: Dec = 61.8°, Inc = 7.8°, N = 2 specimens, α95 = 29.6°, 2θ63 = 18.3°; angle between stone mean and overall NP1 mean ChRM = 87.65° | |||||||
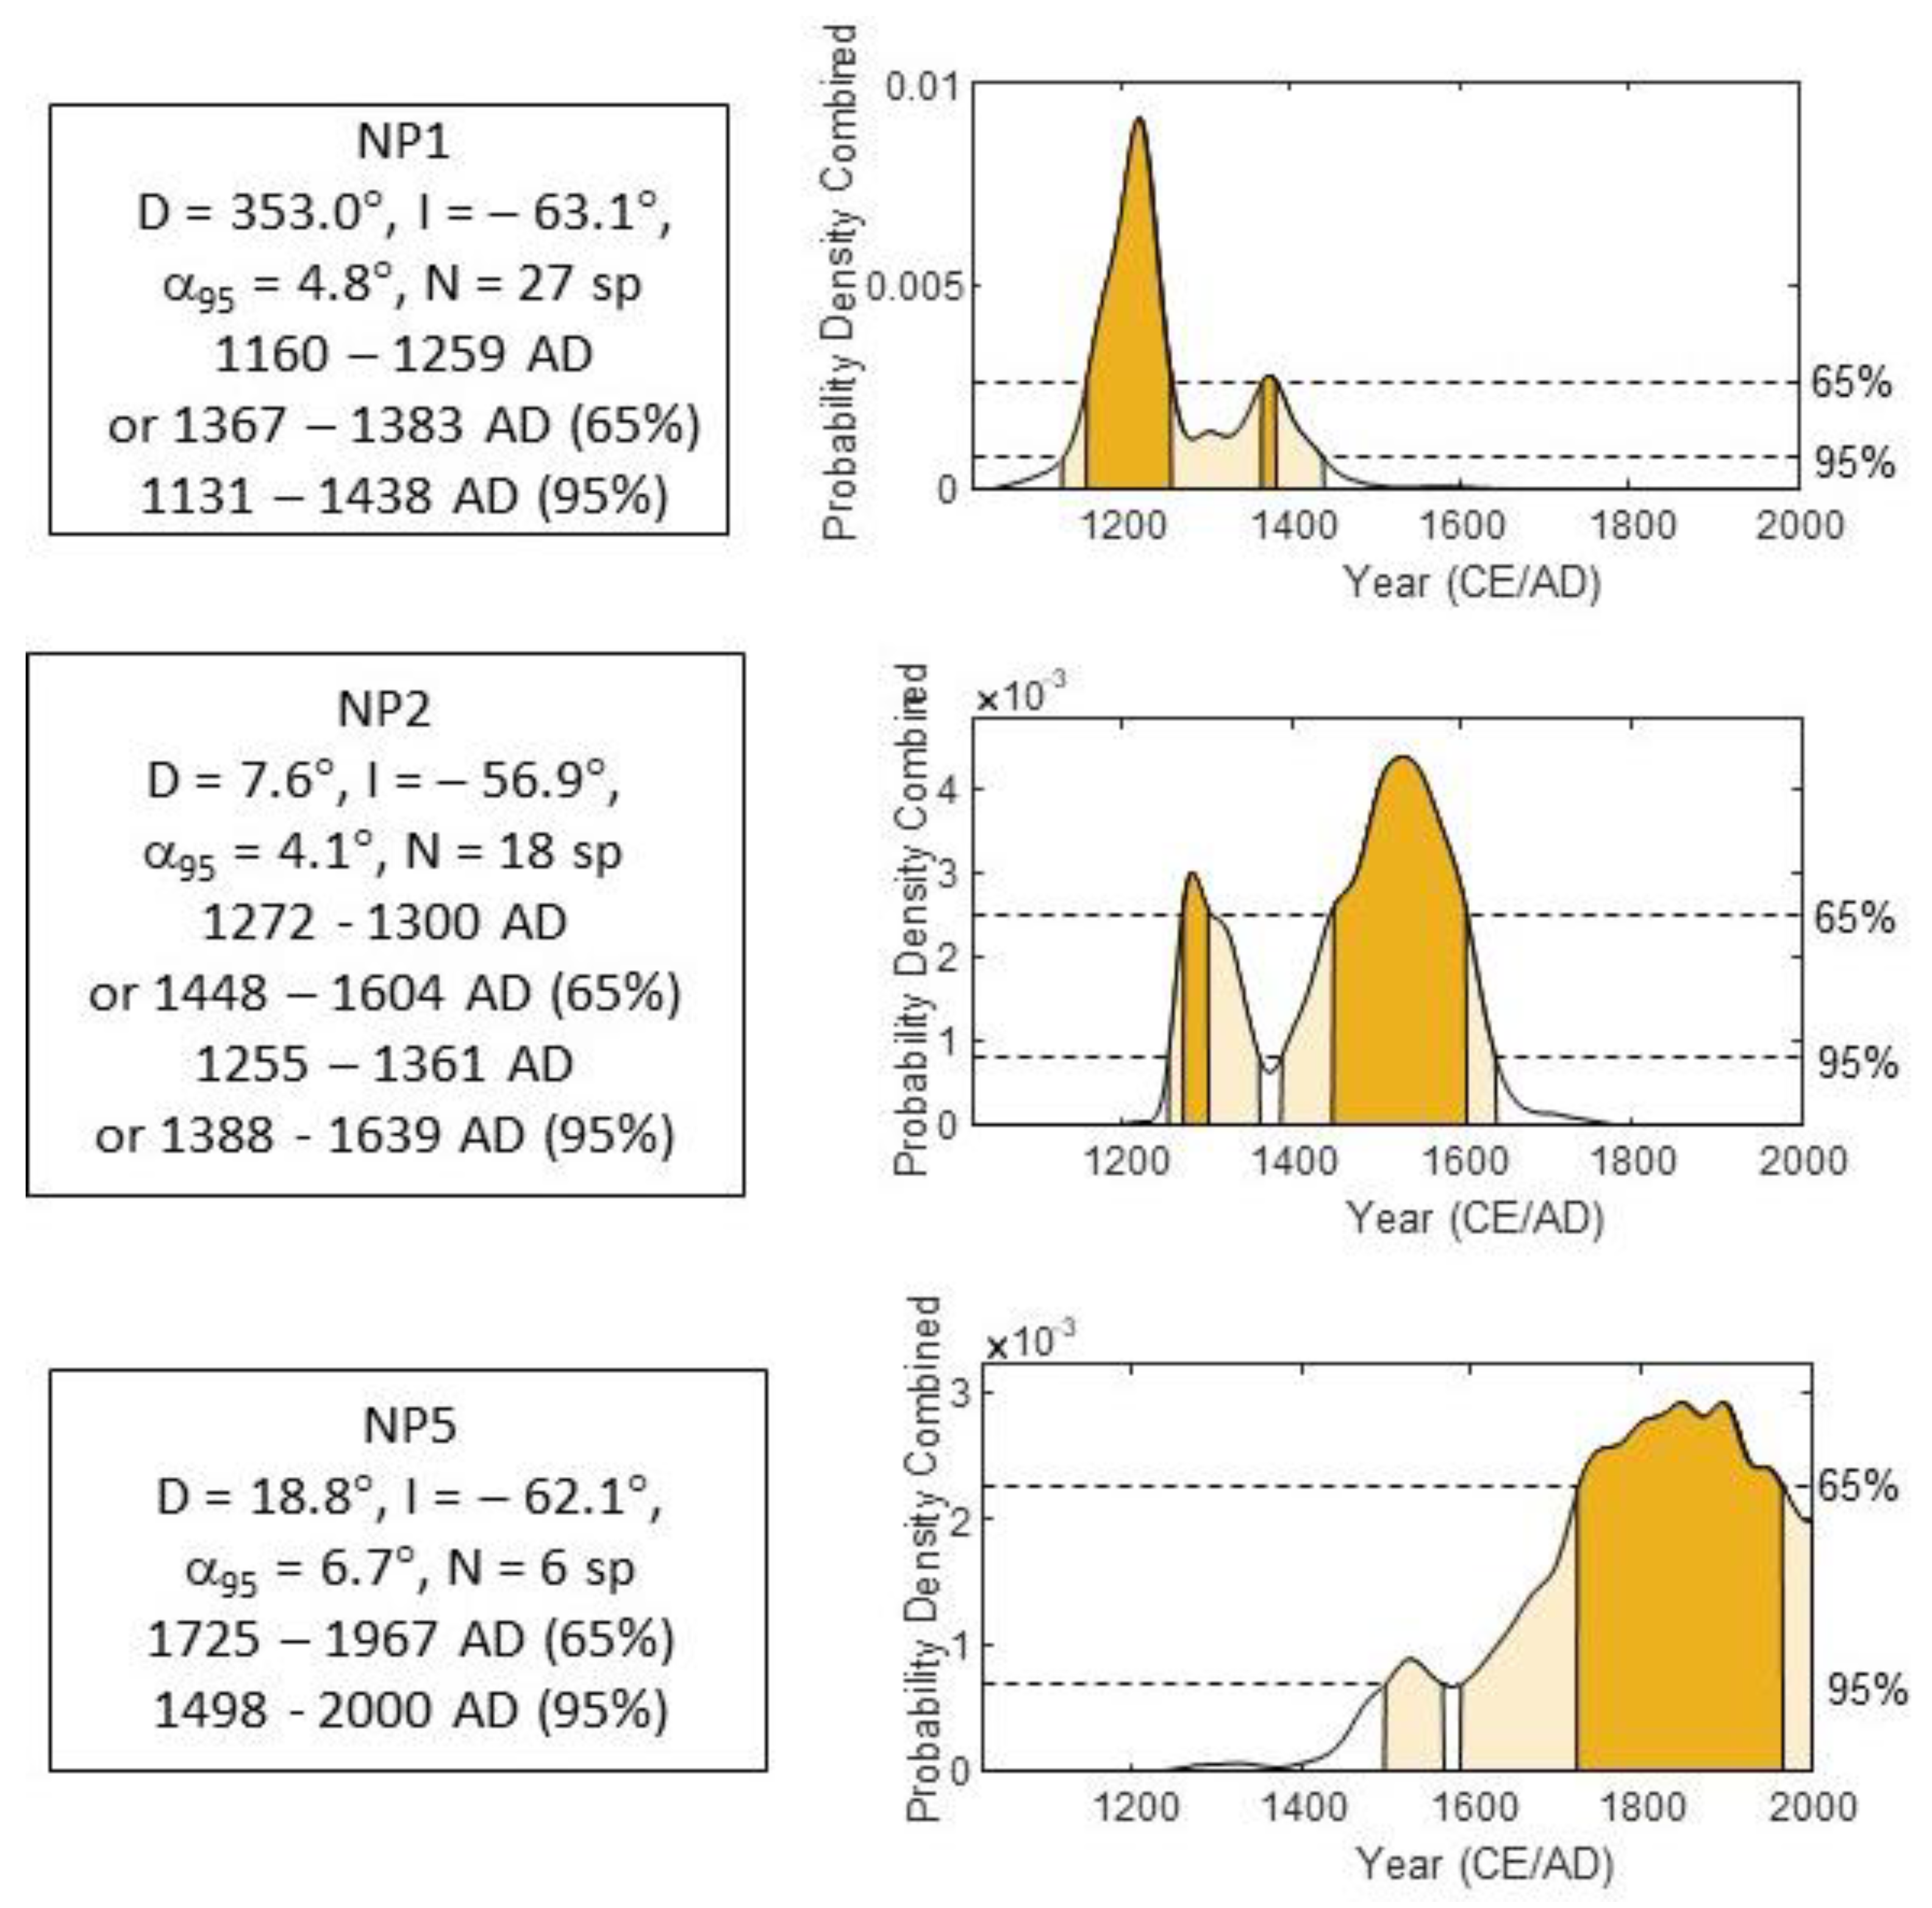
| NP1 Mean ChRM: Dec = 353.0°, Inc = −63.1°, N = 27 specimens from 7 stones, α95 = 4.8°, 2θ63 = 28.8° | |||||||
| NP2 | |||||||
| Specimen ID | Demagnetization Procedure | ChRM Range | n (Demag Steps) | Dec (°) | Inc (°) | MAD (°) | Angle between Specimen and Stone Mean ChRM (°) |
| NP2-1-A1 | THD (50–640 °C) | 50–640 °C | 19 | 5.3 | −57.7 | 0.5 | 1.5 |
| NP2-1-B1 | THD (50–660 °C) | 50–660 °C | 31 | 7.2 | −60.2 | 1.0 | 1.7 |
| NP2-1-B2 | THD-P (100–625 °C) | 100–625 °C | 19 | 10.1 | −59.8 | 1.0 | 1.8 |
| NP2-1-C1 | AFD (2.5–99 mT) | 2.5–99 mT | 24 | 6.2 | −56.3 | 1.0 | 2.3 |
| NP2-1-D1 | THD (50–660 °C) | 50–660 °C | 31 | 9.4 | −58.6 | 1.8 | 0.9 |
| NP2-1-E1 | AFD (2.5–99 mT) | 10–99 mT | 18 | 345.9 | −62.4 | 0.7 | 11.3 |
| Mean ChRM, stone NP2-1: Dec = 7.6°, Inc = −58.5°, N = 5 specimens, α95 = 1.8°, 2θ63 = 3.8°; angle between stone mean and overall NP2 mean ChRM = 1.6° | |||||||
| NP2-2-A1 | AFD (2.5–99 mT) | 2.5–15 mT | 4 | 339.2 | −35.1 | 2.0 | 20.7 |
| NP2-2-A2 | THD-P (100–625 °C) | 100–400 °C | 10 | 311.7 | −32.0 | 7.9 | 36.7 |
| NP2-2-B1 | THD (50–620 °C) | 50–400 °C | 15 | 352.1 | −54.5 | 4.6 | 1.7 |
| NP2-2-C1 | THD (50–640 °C) | 50–400 °C | 19 | 355.4 | −51.7 | 10.2 | 1.7 |
| Mean ChRM, stone NP2-2: Dec = 353.8°, Inc = −53.1°, N = 2 specimens, α95 = 7.5°, 2θ63 = 4.9°; angle between stone mean and overall NP2 mean ChRM = 8.76° | |||||||
| NP2-3-B1 | THD (50–620 °C) | 50–320 °C | 14 | 5.6 | −58.2 | 5.6 | 0.4 |
| NP2-3-B2 | THD-P (100–600 °C) | 100–325 °C | 7 | 4.4 | −57.6 | 3.7 | 0.4 |
| Mean ChRM, stone NP2-3: Dec = 5.0°, Inc = −57.9°, N = 2 specimens, α95 = 1.9°, 2θ63 = 1.2°; angle between stone mean and overall NP2 mean ChRM = 1.72° | |||||||
| NP2-4-A1 | THD (50–620 °C) | 160–460 °C | 14 | 1.2 | −50.3 | 3.2 | 2.2 |
| NP2-4-B1 | THD-P (100–600 °C) | 100–375 °C | 9 | 1.2 | −45.8 | 3.3 | 2.3 |
| Mean ChRM, stone NP2-4: Dec = 1.2°, Inc = −48.1°, N = 2 specimens, α95 = 9.8°, 2θ63 = 6.4°; angle between stone mean and overall NP2 mean ChRM = 9.61° | |||||||
| NP2-5-A1 | THD (50–620 °C) | 50–520 °C | 20 | 117.8 | −79.1 | 2.1 | 1.2 |
| NP2-5-B1 | THD-P (100–600 °C) | 100–425 °C | 11 | 105.4 | −79.3 | 5.3 | 1.2 |
| Mean ChRM, stone NP2-5: Dec = 111.7°, Inc = −79.3°, N = 2 specimens, α95 = 5.1°, 2θ63 = 3.3°; angle between stone mean and overall NP2 mean ChRM = 37.02° | |||||||
| NP2-6-A1 | THD (50–620 °C) | 50–200 °C | 8 | 47.0 | −20.4 | 5.0 | 1.1 |
| NP2-6-B1 | THD-P (100–600 °C) | 100–225 °C | 4 | 45.6 | −22.1 | 3.6 | 1.0 |
| Mean ChRM, stone NP2-6: Dec = 46.3°, Inc = −21.3°, N = 2 specimens, α95 = 4.7°, 2θ63 = 3.0°; angle between stone mean and overall NP2 mean ChRM = 45.46° | |||||||
| NP2-7-A1 | THD-P (100–625 °C) | 150–375 °C | 8 | 323.9 | −46.5 | 4.4 | 39.1 |
| NP2-7-B1 | THD (50–640 °C) | 50–500 °C | 12 | 26.8 | −40.8 | 1.2 | 6.1 |
| NP2-7-C1 | THD (50–620 °C) | 50–540 °C | 24 | 15.2 | −50.0 | 1.3 | 6.2 |
| Mean ChRM, stone NP2-7: Dec = 21.5°, Inc = −45.5°, N = 2 specimens, α95 = 27.0°, 2θ63 = 17.3°; angle between stone mean and overall NP2 mean ChRM = 14.29° | |||||||
| NP2-8-A1 | THD-P (100–600 °C) | R.T.-300 °C | 6 | 24.0 | −56.5 | 4.0 | 3.3 |
| NP2-8-B1 | THD (50–620 °C) | 50–320 °C | 14 | 12.6 | −54.8 | 10.3 | 3.3 |
| Mean ChRM, stone NP2-8: Dec = 18.2°, Inc = −55.8°, N = 2 specimens, α95 = 14.5°, 2θ63 = 9.4°; angle between stone mean and overall NP2 mean ChRM = 5.97° | |||||||
| NP2-9-A1 | THD (50–650 °C) | 50–240 °C | 10 | 13.6 | −73.2 | 8.8 | 5.4 |
| NP2-9-B1 | THD-P (100-600 °C) | R.T.-250 °C | 6 | 352.9 | −73.1 | 4.1 | 5.9 |
| NP2-9-C1 | THD (50–650 °C) | 50–260 °C | 11 | 6.5 | −58.9 | 9.3 | 9.7 |
| Mean ChRM, stone NP2-9: Dec = 4.8°, Inc = −68.6°, N = 3 specimens, α95 = 13.6°, 2θ63 = 17.8°; angle between stone mean and overall NP2 mean ChRM = 11.77° | |||||||
| NP2-10-A1 | THD (50–650 °C) | 50–220 °C | 9 | 54.3 | −48.1 | 5.3 | 1.3 |
| NP2-10-B1 | THD (50–640 °C) | 50–350 °C | 6 | 51.7 | −50.0 | 5.3 | 1.2 |
| NP2-10-D1 | THD-P (100–600 °C) | 100–250 °C | 5 | 89.2 | −36.4 | 8.0 | 29.1 |
| Mean ChRM, stone NP2-10: Dec = 53.0°, Inc = −49.1°, N = 2 specimens, α95 = 5.6°, 2θ63 = 36.1°; angle between stone mean and overall NP2 mean ChRM = 27.84° | |||||||
| NP2-11-A1 | THD (50–640 °C) | 50–640 °C | 19 | 5.8 | 34.4 | 1.1 | 12.3 |
| NP2-11-B1 | THD-P (100–600 °C) | 100–600 °C | 18 | 21.0 | 47.6 | 1.9 | 7.8 |
| NP2-11-B2 | THD (50–650 °C) | 50–650 °C | 29 | 9.5 | 33.0 | 0.7 | 10.7 |
| NP2-11-C1 | THD (50–650 °C) | 50–575 °C | 26 | 45.4 | 40.6 | 1.8 | 19.6 |
| Mean ChRM, stone NP2-11: Dec = 19.7°, Inc = 39.9°, N = 4 specimens, α95 = 17.7°, 2θ63 = 30.6°; angle between stone mean and overall NP2 mean ChRM = 97.34° | |||||||
| NP2 Mean ChRM: Dec = 7.6°, Inc = -56.9°, N = 18 specimens from 7 stones, α95 = 4.1°, 2θ63 = 20.2° | |||||||
| NP5 | |||||||
| Specimen ID | Demagnetization Procedure | ChRM Range | n (Demag Steps) | Dec (°) | Inc (°) | MAD (°) | Angle between Specimen and Stone Mean ChRM (°) |
| NP5-2 | AFD (2.5–90 mT) | 2.5–20 | 19 | 13.5 | −61.7 | 2.2 | 2.5 |
| NP5-3 | AFD (2.5–90 mT) | 2.5–12.5 | 5 | 12.1 | −50.7 | 3.1 | 12.0 |
| NP5-4 | AFD (2.5–90 mT) | 2.5–15 | 6 | 23.6 | −65.7 | 4.5 | 4.2 |
| NP5-6 | AFD (2.5–90 mT) | 5.0–25 | 9 | 33.2 | −67.2 | 4.2 | 8.0 |
| NP5-7 | AFD (2.5–90 mT) | 2.5–15 | 6 | 29.7 | −68.2 | 2.7 | 7.6 |
| NP5-8 | AFD (2.5–90 mT) | 5.0–20 | 17 | 9.6 | −57.6 | 4.3 | 6.4 |
| Mean ChRM, feature NP5: Dec = 18.8°, Inc = −62.1°, N = 6 specimens, α95 = 6.7°, 2θ63 = 16.2° | |||||||
References
- Anderson, A.; Binney, J.; Harris, A. Tangata Whenua, A History; Bridget Williams Books: Wellington, New Zealand, 2015; p. 536. [Google Scholar]
- Batt, C. Archaeomagnetic Dating. In Encyclopedia of Scientific Dating Methods; Springer: Berlin/Heidelberg, Germany, 2013. [Google Scholar] [CrossRef]
- Butler, R.F. Paleomagnetism: Magnetic Domains to Geologic Terranes; Blackwell: Oxford, UK, 1992; p. 318. [Google Scholar]
- Jordanova, N.; Petrovsky, E.; Kovacheva, M.; Jordanova, D. Factors determining magnetic enhancement of burnt clay from archaeological sites. J. Archaeol. Sci. 2001, 28, 1137–1148. [Google Scholar] [CrossRef]
- Batt, C.M. The British archaeomagnetic calibration curve: An objective treatment. Archaeometry 1997, 39, 153–168. [Google Scholar] [CrossRef]
- Schnepp, E.; Lanos, P. Archaeomagnetic secular variation in Germany during the past 2500 years. Geophys. J. Int. 2005, 163, 479–490. [Google Scholar] [CrossRef]
- Schnepp, E.; Thallner, D.; Arnietz, P.; Mauritsch, H.; Scholger, R.; Rolf, C.; Leonhardt, R. New archaeomagnetic secular variation data from Central Europe. I: Directions. Geophys. J. Int. 2020, 220, 1023–1044. [Google Scholar] [CrossRef]
- Tema, E. Archaeomagnetic Research in Italy: Recent Achievements and Future Perspectives. In The Earth’s Magnetic Interior; Petrovský, E., Ivers, D., Harinarayana, T., Herrero-Bervera, E., Eds.; IAGA Special Sopron Book Series; Springer: Dordrecht, The Netherlands, 2011; Volume 1. [Google Scholar] [CrossRef]
- Cai, S.; Tauxe, L.; Paterson, G.A.; Deng, C.; Pan, Y.; Qin, H.; Zhu, R. Recent Advances in Chinese Archaeomagnetism. Front. Earth Sci. 2017, 5, 92. [Google Scholar] [CrossRef]
- Di Chiara, A.; Pavón-Carrasco, F.J. A first regional model of the past Earth’s magnetic field from Africa for the last 4000 years. Phys. Earth Planet. Inter. 2022, 325, 106855. [Google Scholar] [CrossRef]
- Kinger, R. An Archaeomagnetic Study of Hāngi Stones in New Zealand. PhD Thesis, Te Herenga Waka–Victoria University of Wellington, Wellington, New Zealand, 2017. [Google Scholar] [CrossRef]
- Poojary, S. Using Palaeomagnetic Techniques to Uncover the History of an Archaeological Site in Napier, Hawkes Bay. Master’s Thesis, Te Herenga Waka–Victoria University of Wellington, Wellington, New Zealand, 2023. [Google Scholar] [CrossRef]
- Turner, G.M.; Kinger, R.; McFadgen, B.; Gevers, M. The first archaeointensity records from New Zealand: Evidence for a fifteenth century AD archaeomagnetic ‘spike’ in the SW Pacific Region? In Geomagnetic Field Variations in the Past: New Data, Applications and Recent Advances; Tema, E., Di Chiara, A., Herrero Bervera, E., Eds.; Geological Society: London, UK, 2020; Special Publications. [Google Scholar]
- Gose, W.A. Palaeomagnetic studies of burned rocks. J. Archaeol. Sci. 2000, 27, 409–421. [Google Scholar] [CrossRef]
- Ansell, R.; Taber, J. Caught in the Crunch: Earthquakes and Volcanoes in New Zealand; Harper Collins: Auckland, New Zealand, 1996; p. 188. [Google Scholar]
- McFadgen, B.G. Archaeology of the Wellington Conservancy: Kapiti Horowhenua: A Prehistoric and Palaeoenvironmental Study; Department of Conservation: Wellington, New Zealand, 1997.
- Davidson, J. The coming of Māori. In The Celebration History of the Kāpiti District: 100 Years Plus; Baldwin, O., Ed.; Kāpiti Borough Council: Paraparaumu, New Zealand, 1988. [Google Scholar]
- Dodd, A. Interim Report: Summerset Village; Archaeological Services; Subsurface Ltd.: Waikanae, New Zealand, 2020. [Google Scholar]
- Dodd, A. Archaeological Assessment: Summerset Village; Archaeological Services; Subsurface Ltd.: Waikanae, New Zealand, 2022. [Google Scholar]
- Hogg, A.G.; Heaton, T.J.; Hua, Q.; Palmer, J.G.; Turney, C.S.; Southon, J.; Bayliss, A.; Blackwell, P.G.; Boswijk, G.; Ramsey, C.B.; et al. SHCal20: Southern Hemisphere Calibration, 0-55,000 Years cal BP. Radiocarbon 2020, 62, 759–778. [Google Scholar] [CrossRef]
- Turner, G.M.; Kinger, R.; McFadgen, B.G.; Piispa, E.J. Hāngī magnetism: Archaeomagnetic dating of hāngī stones and fired archaeological materials. In Proceedings of the New Zealand Archaeological Association Conference, Blenheim, New Zealand, 22–25 June 2016; p. 23. [Google Scholar]
- Kirschvink, J.L. The least-squares line and plane and the analysis of palaeomagnetic data. Geophys. J. R. Astron. Soc. 1980, 62, 699–718. [Google Scholar] [CrossRef]
- Chadima, M.; Hrouda, F. Remasoft 3.0: A user-friendly paleomagnetic data browser and analyzer. Trav. Géophysiques 2006, 27, 20–21. [Google Scholar]
- Fisher, R.A. Dispersion on a sphere. Proc. R. Soc. A 1953, 217, 295–305. [Google Scholar] [CrossRef]
- Pavon-Carrasco, F.J.; Rodriguez-Gonzalez, J.; Osete, M.L.; Torta, J.M. A Matlab tool for archaeomagnetic dating. J. Archaeol. Sci. 2011, 38, 408–419. [Google Scholar] [CrossRef]
- Turner, G.M.; Howarth, J.D.; de Gelder, G.I.N.O.; Fitzsimons, S.J. A new high-resolution record of Holocene geomagnetic secular variation from New Zealand. Earth Planet. Sci. Lett. 2015, 430, 296–307. [Google Scholar] [CrossRef]
- Turner, G.M.; Corkill, R.M. NZPSV11k.2023 and NZPSV1k.2023: Holocene Palaeomagnetic Secular Variation Master Records for New Zealand. Phys. Earth Planet. Interiors 2023, 344, 107093. [Google Scholar] [CrossRef]
- Jackson, A.; Jonkers, A.R.T.; Walker, M.R. Four centuries of geomagnetic secular variation from historical records. Phil. Trans. R. Soc. A 2000, 358, 957–990. [Google Scholar] [CrossRef]
- Robinson, F. Archaeomagnetic Study and Dating of an Indigenous New Zealand Hāngī; Unpublished BSc Hons project report; Victoria University of Wellington: Wellington, New Zealand, 2023. [Google Scholar]
- McFadgen, B.G. Hostile Shores: Catastrophic Events in Prehistoric New Zealand and Their Impact on Māori Coastal Communities; Auckland University Press: Auckland, New Zealand, 2007. [Google Scholar]
- Petchey, F.; Schmid, M.M.E. Vital evidence: Change in the marine 14C reservoir around New Zealand (Aotearoa) and implications for the timing of Polynesian settlement. Sci. Rep. 2020, 10, 14266. [Google Scholar] [CrossRef] [PubMed]
- Schnepp, E.; Worm, K.; Scholger, R. Improved sampling techniques for baked clay and soft sediments. Phys. Chem. Earth 2008, 33, 407–413. [Google Scholar] [CrossRef]
- Lerner, G.A.; Cronin, S.J.; Turner, G.M.; Piispa, E.J. Recognizing long-runout pyroclastic flow deposits using paleomagnetism of ash. Geol. Soc. Am. Bull. 2019, 131, 1783–1793. [Google Scholar] [CrossRef]

| Site/Feature | Lat (°S), Long (°E) | Grid Ref (NZTM2000) | Arch-Site No. | Feature | Date Sampled | Samples Collected | Specimens Analysed |
|---|---|---|---|---|---|---|---|
| Napier | |||||||
| NP1 | 39.49, 176.91 | E1936301 N5621098 | V21/504 | hāngī/earth oven | 16/01/2020 | 11 oriented stones, NP1-1 to NP1-11 | 49 (most THD) |
| NP2 | 39.49, 176.91 | E1936301 N5621098 | V21/504 | hāngī/earth oven | 16/01/2020 | 11 oriented stones, NP2-1 to NP2-11 | 33 (most THD) |
| NP5 | 39.49, 176.91 | E1936301 N5621098 | V21/504 | baked floor of oven/fireplace | 16/01/2020 | 8 oriented samples in plastic boxes, NP5-1 to NP5-8 | 6 (AFD) |
| Ngarara | |||||||
| NGA1 | 40.87, 175.04 | E1772070 N5473987 | R26/849 | hāngī/earth oven | 30/06/2022 | 11 oriented stones, NGA1-1 to NGA1-11 | 17 (AFD) |
| Site/Feature | N/N0 (Specimens) | n/n0 (Stones) | Dec (°) | Inc(°) | α95 (°) | Archaeomagnetic Date (65%) | Archaeomagnetic Date (95%) |
|---|---|---|---|---|---|---|---|
| NP1 | 27/49 | 7/11 | 353.0 | −63.1 | 4.8 | 1160–1259 or 1367–1383 AD | 1131–1438 AD |
| NP2 | 18/32 | 7/11 | 7.6 | −56.9 | 4.1 | 1272–1300 or 1448–1604 AD | 1255–1361 or 1388–1639 AD |
| NP5 | 6/6 | n/a | 18.8 | −62.1 | 6.7 | 1725–1967 AD * | 1498–2000 AD * |
| NGA1 | 6/17 | 2/10 | 12.5 | −63.9 | 2.6 | 1678–1839 AD | 1609–1914 AD |
| 13/17 | 8/10 | 11.9 | −62.8 | 4.9 | 1592–1842 AD | 1441–1916 AD |
Disclaimer/Publisher’s Note: The statements, opinions and data contained in all publications are solely those of the individual author(s) and contributor(s) and not of MDPI and/or the editor(s). MDPI and/or the editor(s) disclaim responsibility for any injury to people or property resulting from any ideas, methods, instructions or products referred to in the content. |
© 2023 by the authors. Licensee MDPI, Basel, Switzerland. This article is an open access article distributed under the terms and conditions of the Creative Commons Attribution (CC BY) license (https://creativecommons.org/licenses/by/4.0/).
Share and Cite
Poojary, S.; Robinson, F.; Turner, G. Using Palaeomagnetic Techniques to Date Indigenous Archaeological Sites in New Zealand. Heritage 2023, 6, 6596-6615. https://doi.org/10.3390/heritage6100345
Poojary S, Robinson F, Turner G. Using Palaeomagnetic Techniques to Date Indigenous Archaeological Sites in New Zealand. Heritage. 2023; 6(10):6596-6615. https://doi.org/10.3390/heritage6100345
Chicago/Turabian StylePoojary, Shefali, Fergus Robinson, and Gillian Turner. 2023. "Using Palaeomagnetic Techniques to Date Indigenous Archaeological Sites in New Zealand" Heritage 6, no. 10: 6596-6615. https://doi.org/10.3390/heritage6100345
APA StylePoojary, S., Robinson, F., & Turner, G. (2023). Using Palaeomagnetic Techniques to Date Indigenous Archaeological Sites in New Zealand. Heritage, 6(10), 6596-6615. https://doi.org/10.3390/heritage6100345