Article

Integration of Non-Destructive Acoustic Imaging Investigation with Photogrammetric and Morphological Analysis to Study the “Graecia Vetus” in the Chigi Palace of Ariccia

1
Institute of Marine Engineering (INM), National Research Council, 00133 Rome, Italy
2
Institute for Microelectronics and Microsystems (IMM), National Research Council, 00133 Rome, Italy
3
Laboratory Chemical and Physical Technologies, ENEA Casaccia, 00123 Rome, Italy
4
Palazzo Chigi Ariccia, 00072 Ariccia, Italy
*
Author to whom correspondence should be addressed.
Heritage 2022, 5(4), 3762-3784; https://doi.org/10.3390/heritage5040195
Submission received: 30 October 2022 / Revised: 18 November 2022 / Accepted: 27 November 2022 / Published: 30 November 2022

Abstract

:
Integrating complementary information from many available technologies is a question of growing interest among the Cultural Heritage community, due to the complexity of the cultural assets under study and of their contexts. Recently, this need has pushed the development of appropriate data fusion procedures for this sector, among which the authors wish to propose their approach for treating multi-source data from image-based methodologies, experimented with in a representative case study. The Chigi Palace of Ariccia hosted our investigation campaign on a precious monochrome painting by Giuseppe Cades (1788), the Graecia Vetus. The study encompasses a photogrammetric survey and two acoustic diagnostic methods, the innovative Frequency Resolved Acoustic Imaging technique and the more traditional Acoustic Tomography. The photogrammetric survey allows reconstruction of the surface morphology of the painting, generating a 3D Digital Elevation Model, while the acoustic methods detect the structural damage beneath the surface due to detachments and flaws, generating 2D images. The output of this heterogeneous datasets fusion is a multi-layer map, each layer representing a type of dataset that clearly shows how some deformations of the surface morphology appear correlated with the presence of sub-surface anomalies, wide air cavities and more superficial detachments revealed by the acoustic diagnostic methods. Beside the exam of the conservation state of the Graecia Vetus, the proposed procedure effectively guarantees access to the integrated information, offering the possibility to understand the correlation between the causes and the effects of the decay process, as well as the retrieval of the single analysis in order to deepen one specific aspect.

1. Introduction

Nowadays, a growing awareness about the management of complexity is pushing research towards innovative and holistic approaches to diagnostic methodologies and to conservation/restoration protocols of Cultural Heritage (CH).
In the attempt at mitigating the damage to unique cultural sites of inestimable significance, where built structures host relevant collections of artworks, much attention is being paid to the correlation between the structural integrity of the historical building and the conservation of the artistic assets there present. Often, the stratification of a number of elements, from different historical periods, makes this task very complex, also considering the non-standardized knowledge of many traditional materials [1].
Accordingly, the integration of different analyses has been widely pursued in many projects aiming at a more accurate knowledge of the cultural assets and of their conservation state.
In recent years, great technological advancements in laser scanning and in photogrammetry have supported the integrated use of image-based methodologies. We speak of data fusion, which assumes a huge potential when multisource scientific data are dealt with, and where the 3D geometric documentation of the cultural asset often represents its base element [2]. Within this framework, a wide range of investigation purposes require different scales of 3D reconstruction, from landscape topography to small sites reconstruction down to the object scale, employing different sensors, and processing heterogeneous data [3]. Furthermore, multi-sensor data fusion may be accomplished at different levels (low–medium–high), considering that one may operate with raw data, or may extract and integrate the most significant features from the raw data [3], in many cases the Principal Component Analysis is included in the image-elaboration process. The integration of already processed data can be better referred to as “information fusion”, and in many applicative fields it is a suitable tool for decision makers [4]. With significant advancements in similar applicative sectors, such as in civil engineering disciplines, data fusion represents a relevant tool for monitoring complex industrial processes or great infrastructures security. The literature in this field reports a number of approaches and applications [5], among which the combination of material features information and shape information in visual data fusion optimizes the object recognition in defects analysis. In order to guarantee the accuracy of the output, often used is appropriate image processing, including the identification of rule-based criteria and thresholds, for extracting binary images from image-based inspections before data integration [6]. The possibility to detect at one time different kinds of defects, such as cracks, may be increased by the integration of many NDT techniques also giving evidence to the cause-and-effect relationship [7].
Despite the wide variety of applications, some common critical aspects have to be highlighted. Data from image-based methodologies are evidently heterogeneous, and different quantities constitute the indicators of different phenomena, such as the amount of a material or the presence of a defect; thus, before integrating multi-source scientific data, the researchers need to harmonize them. When superposing 2D images on 3D models, the alignment and the spatial resolution play a crucial role. Finally, the amount of data to be processed and saved is extremely important in the data fusion process, in relation to the duration of the analysis, to the memory requirements for data storage, to the final results visualization and to the data archives fruition. In the CH field, a further crucial aspect is the release of a final product, suitable for heritage restorers, conservators and managers in order to navigate the results by means of user-friendly platforms.
The purpose of the present paper is to describe the approach, the measurements and their results for a first attempt to integrate a 3D photogrammetric survey with 2D image-based acoustic diagnostic methodologies, in order to provide a set of simple and intelligible information to the end users. The novelty of this study lies in the integration of 2D maps deriving from two types of sensing data: morphological 3D analyses of the artifact and image-based acoustic methodologies. The 2D morphological maps derive from a digital representation (scalar field) which relates each point of the painting to a physical characteristic of the point itself (e.g., altitude, dip/direction). Consequently, the novelty of this approach derives from the integration of heterogeneous data, diagnostic data and morphological data, harmonized through the use of two-dimensional images.
Recently, in central Italy, the Technological District for Cultural Heritage of the Lazio Region (DTC Lazio) [8] has been addressing the development and use of innovative technologies for CH tailored to the priorities of the territory. Within this framework, the ADAMO Project (Technologies of Analysis, DIAgnostics and MOnitoring for the preservation and restoration of cultural heritage) [9] supported the dissemination of innovative non-destructive technologies to end users, conservation/restoration organizations and heritage owners/managers, realizing wide investigation campaigns and demo events in a number of important heritage sites.
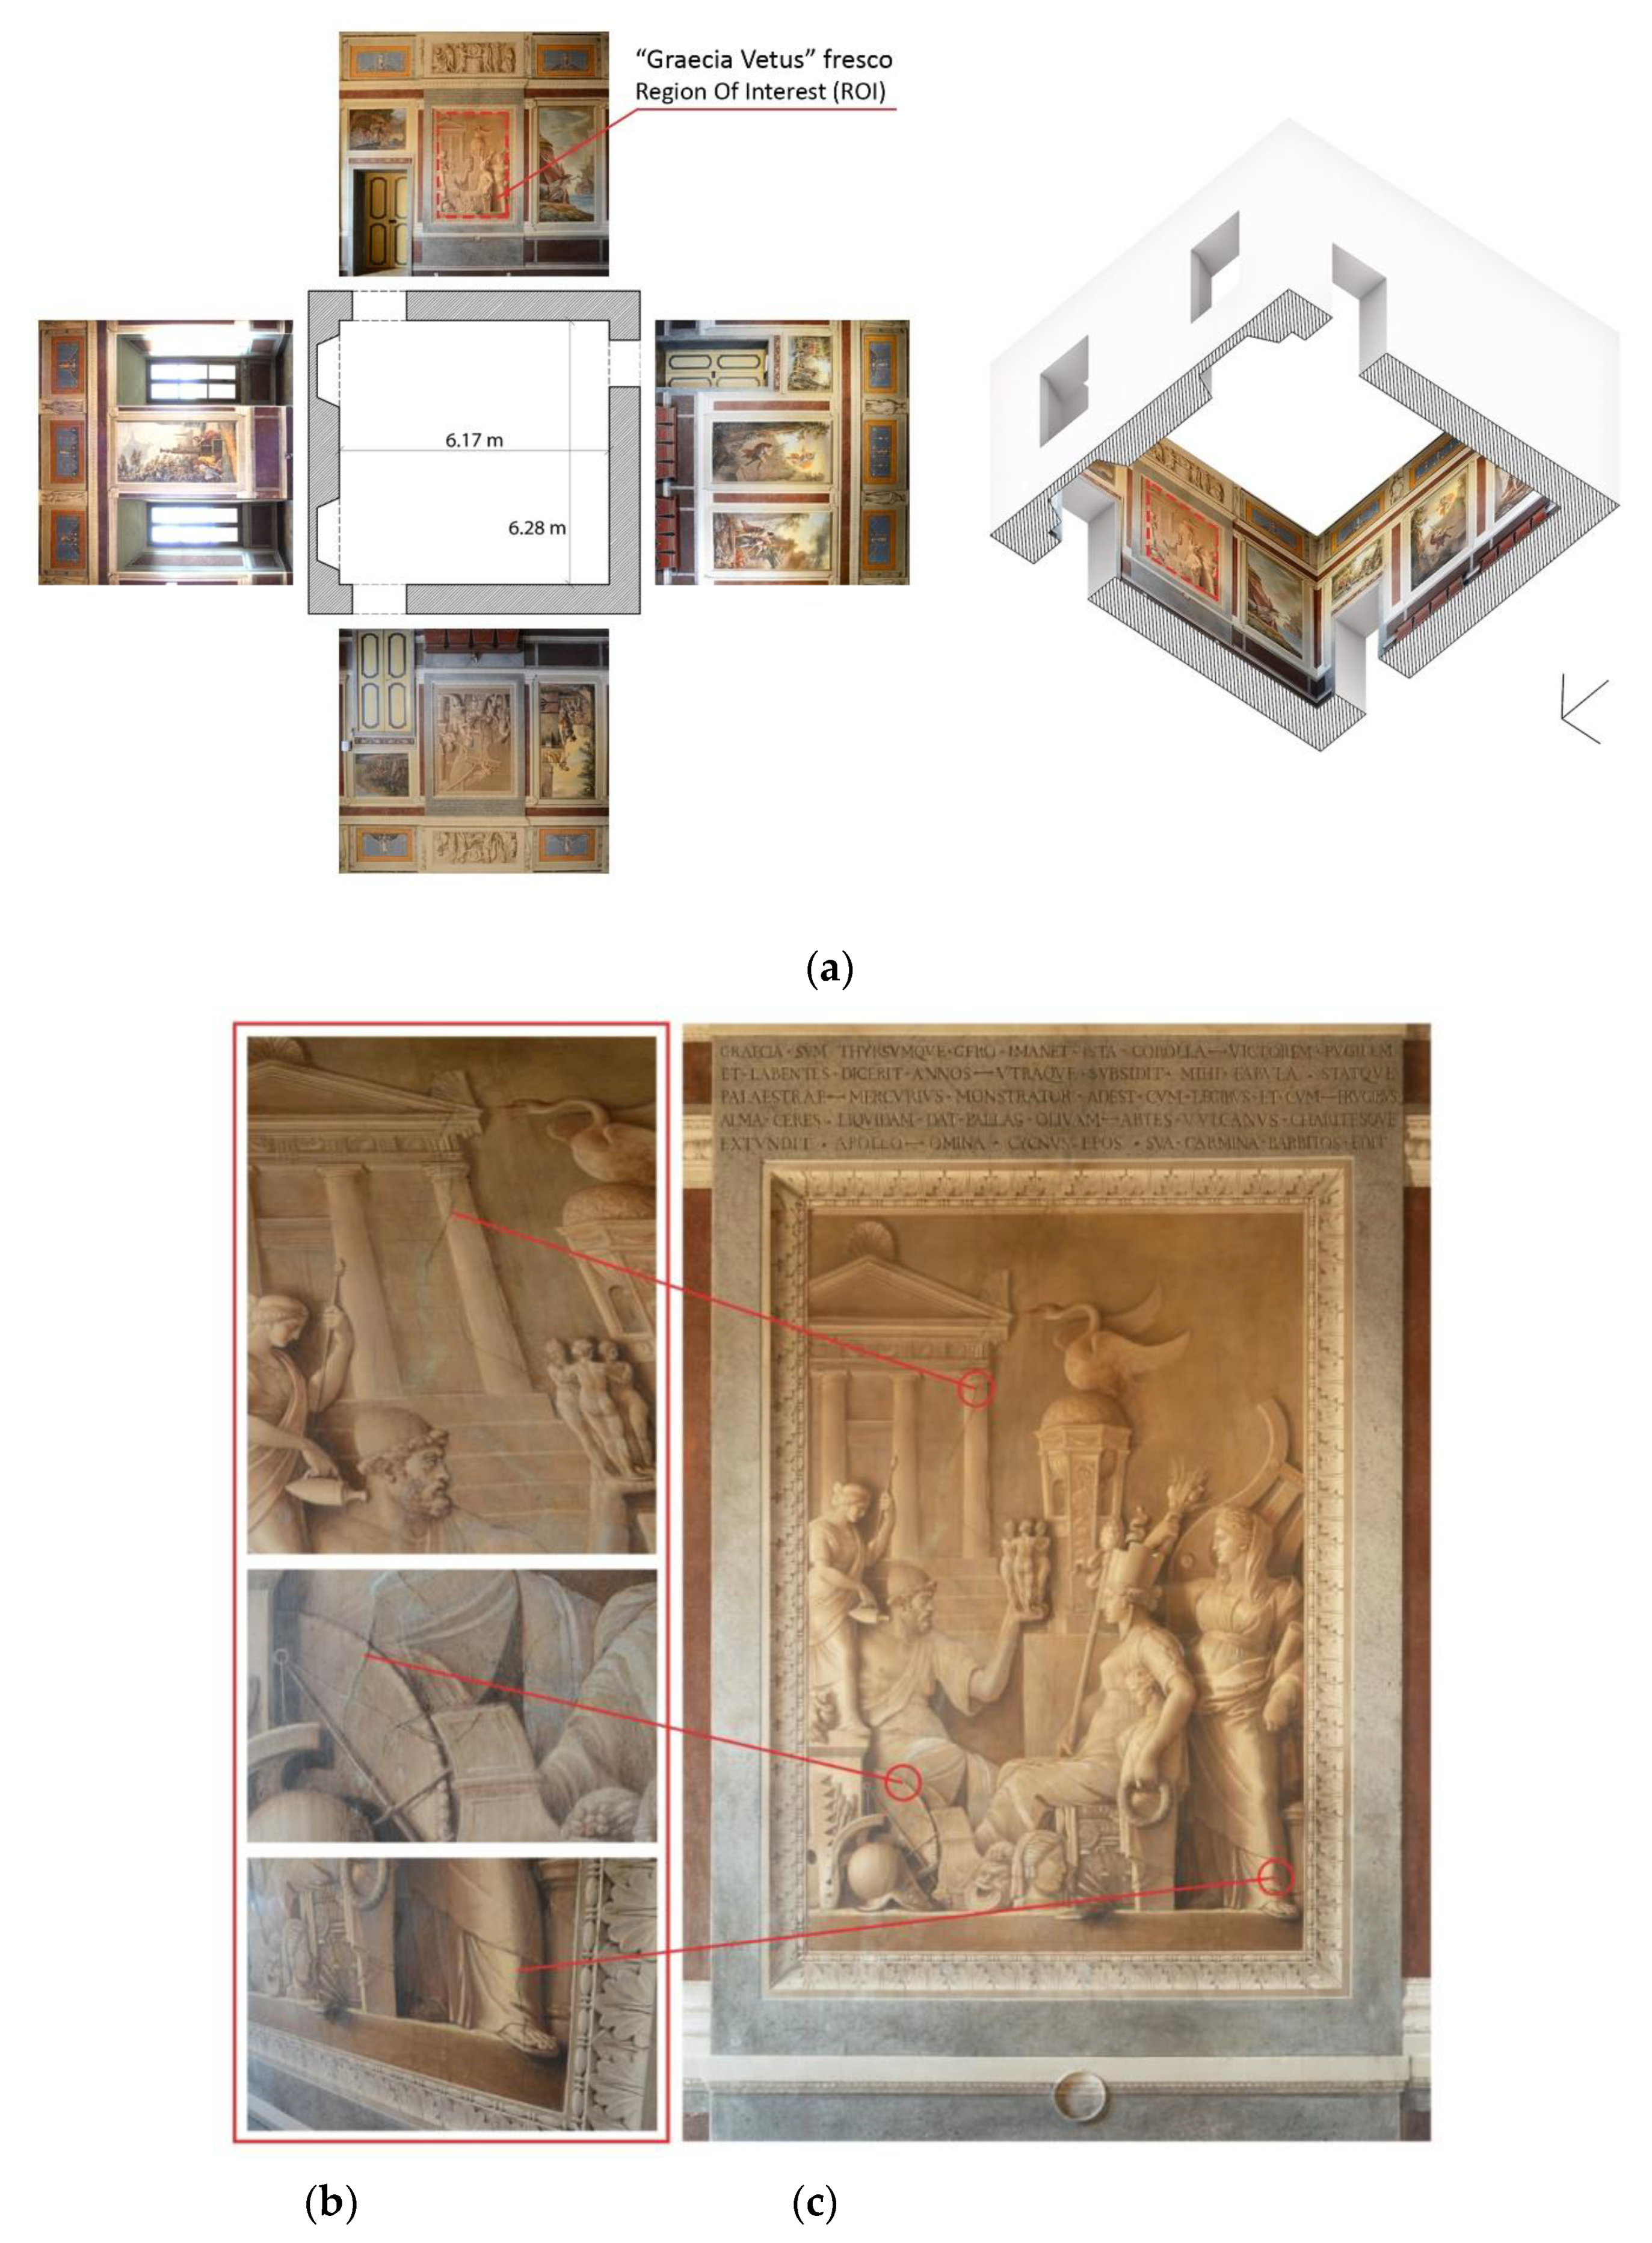
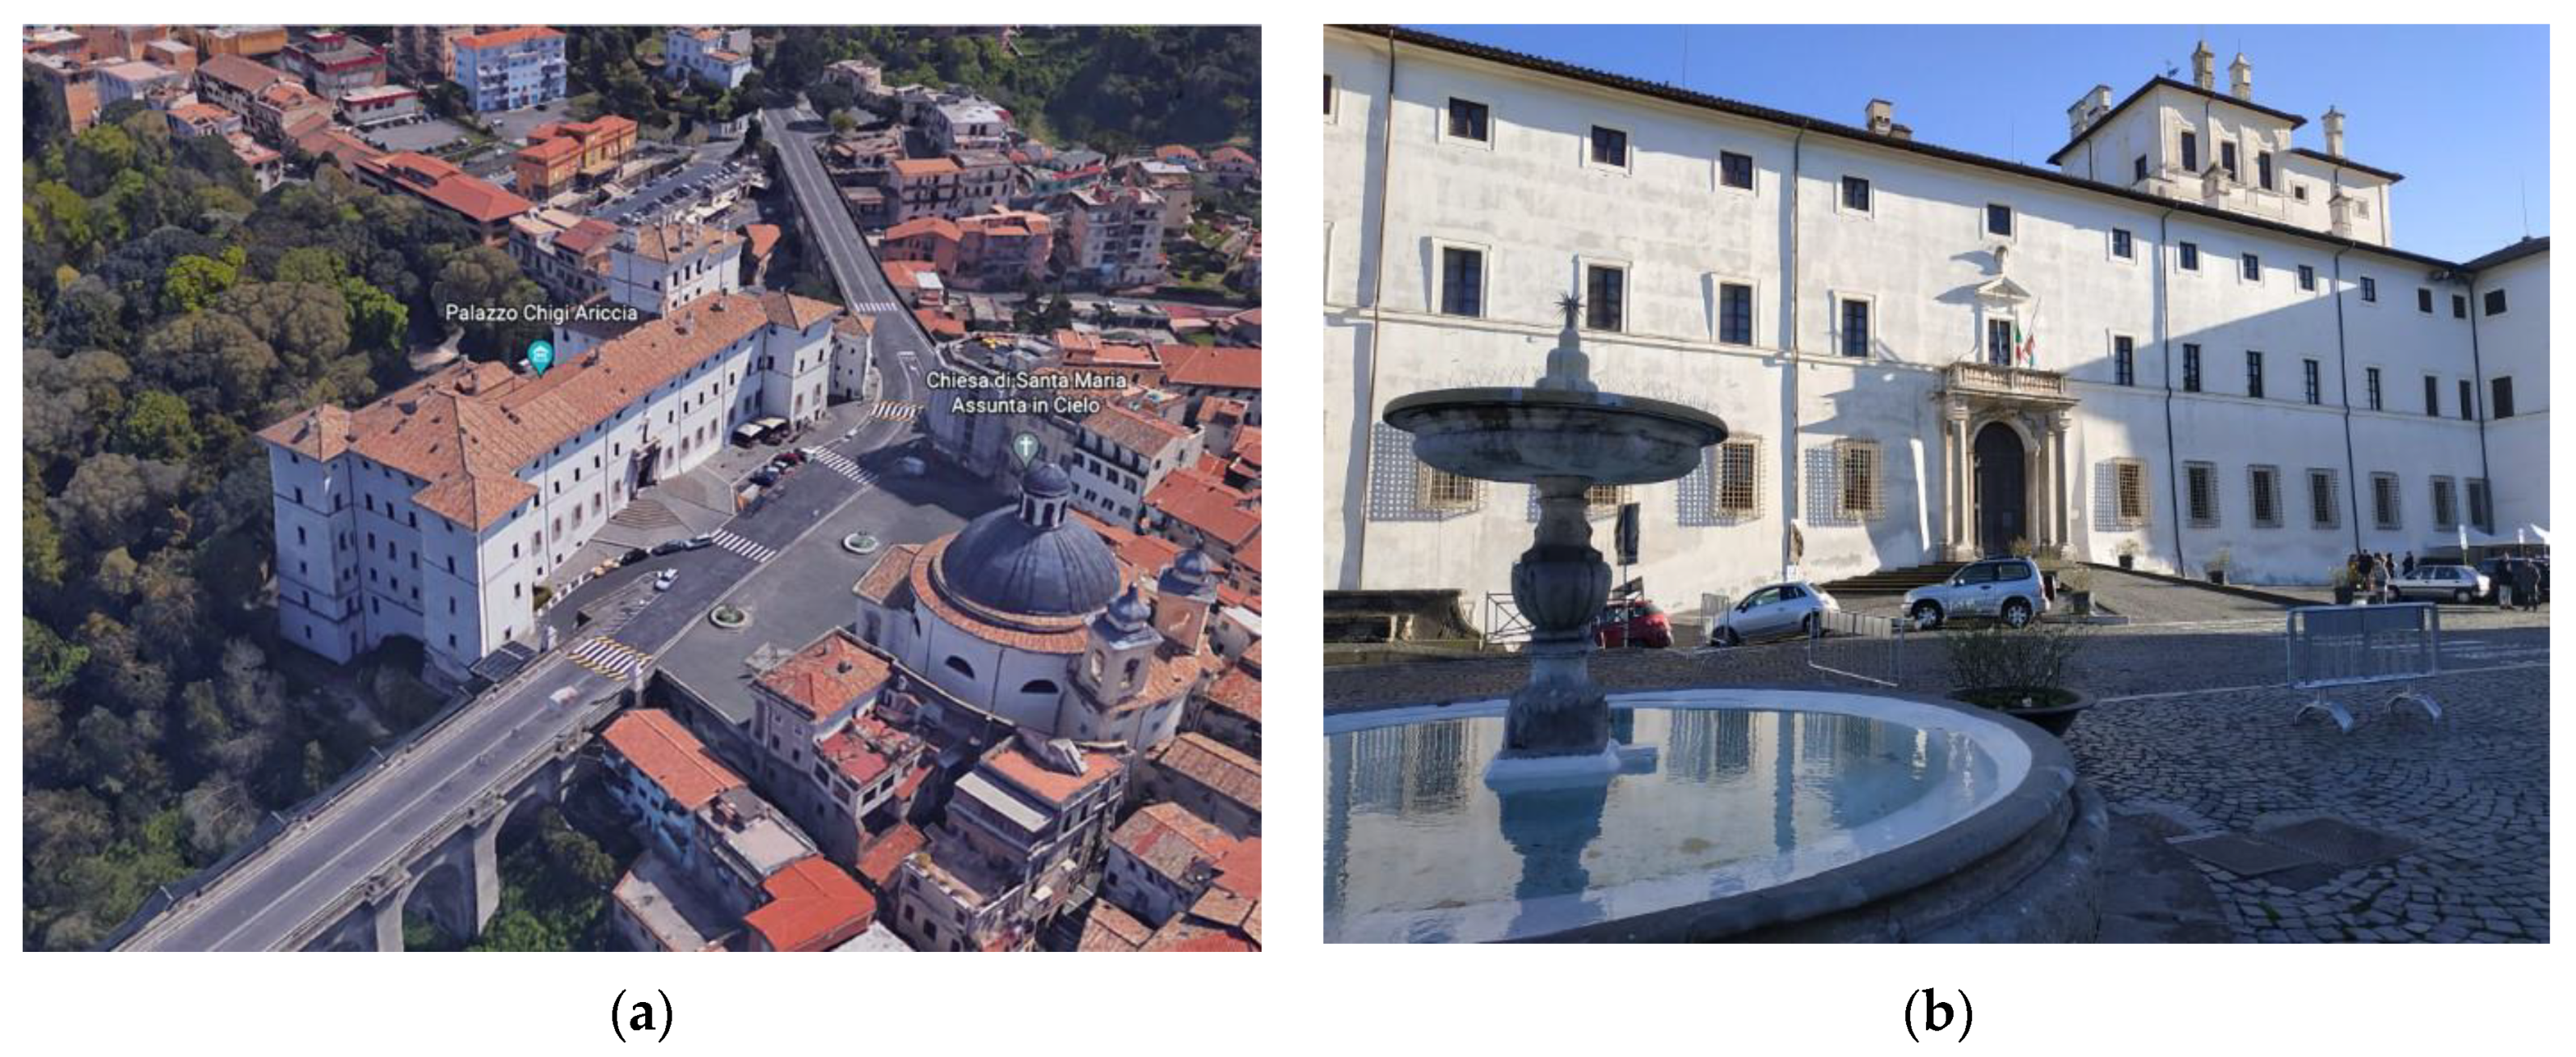
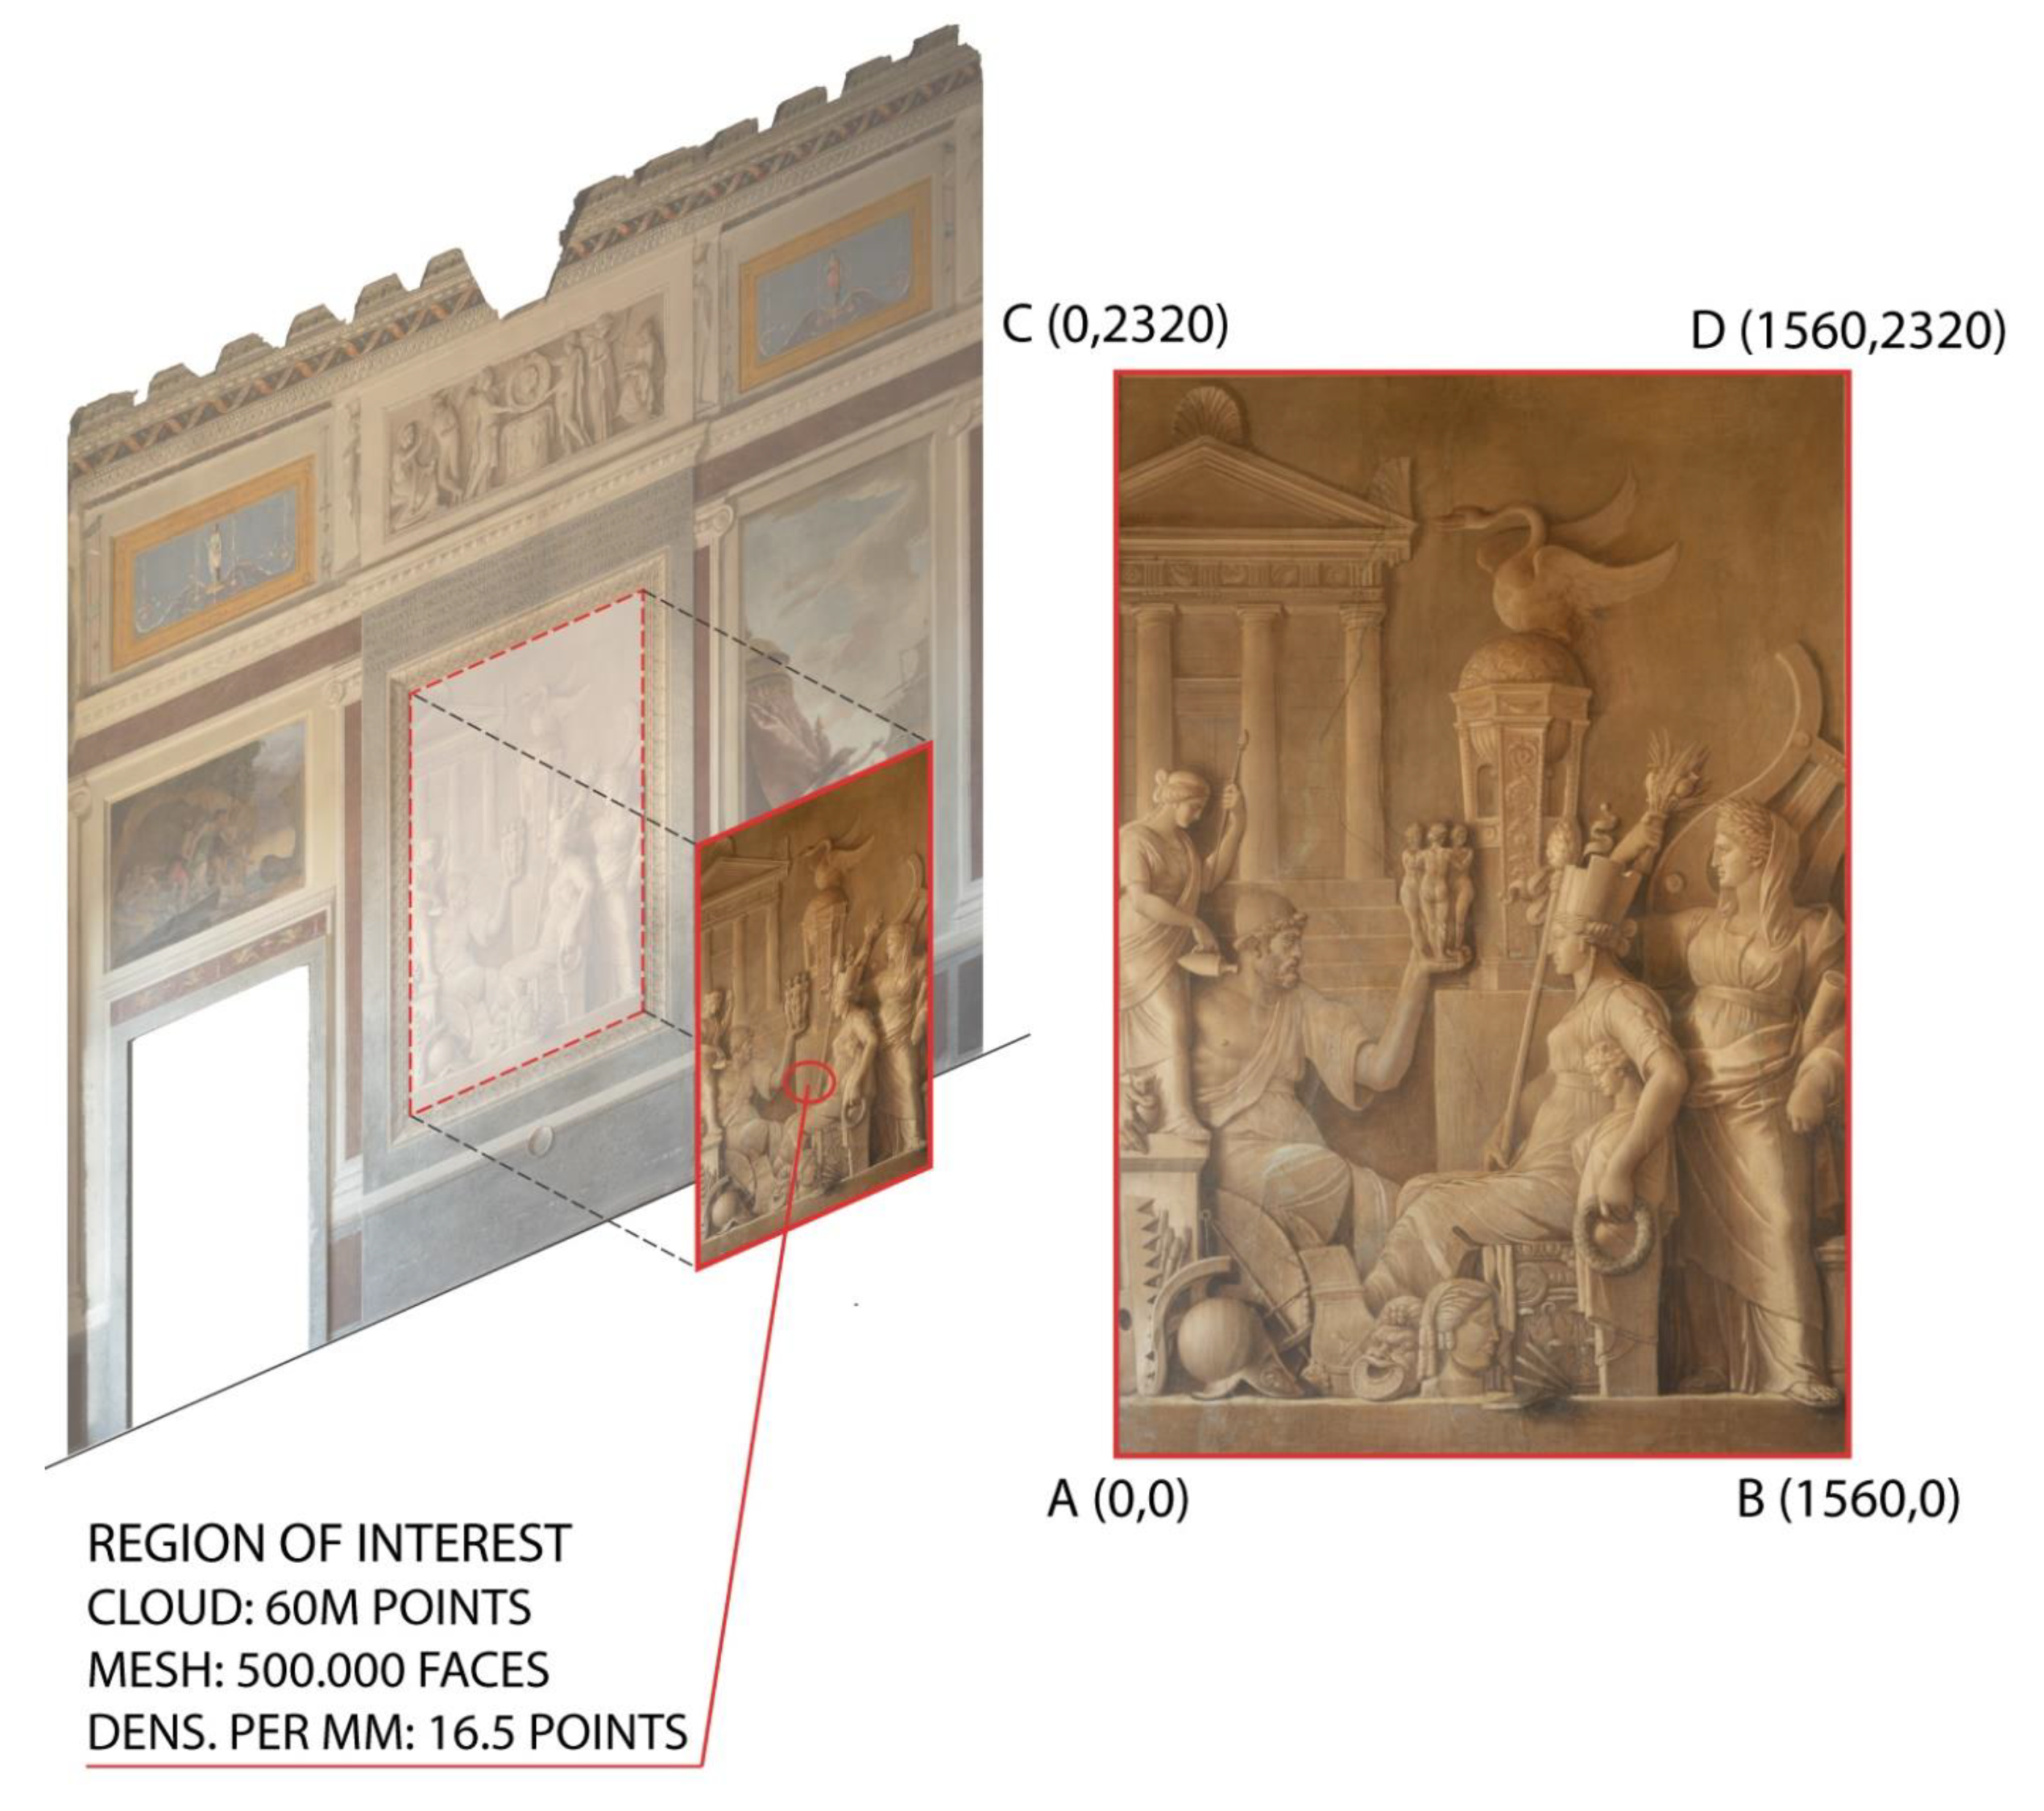
The Chigi Palace of Ariccia, a village near Rome, was one of the project sites, with its wonderful Baroque collections. At the noble floor of the palace, in the Ariosto Room, the monochrome mural painting Graecia Vetus reveals an uneven crack pattern, impairing the integrity of the painted surface, not present on the other side walls in the same room. In the present study, the dataset obtained from the photogrammetric survey, with particular reference to the region containing the Graecia Vetus painting, formed the basis of a morphological analysis of the pictorial surface. The processing of an orthomosaic image obtained from photogrammetry allows the information of other acoustic methods to be superimposed without distortion problems and with millimeter precision.
A contactless acoustic technique, Frequency Resolved Acoustic Imaging (FR-AI) in the audio frequency interval, was employed to investigate the structural damage of the artwork beneath the visible surface. Thus, the authors tried to correlate the deformation of the uppermost surface to the potential sub-surface damage. In recent years, this technique has been successfully applied by the authors to study the conservation state of antique paintings, from frescoes to glazed ceramic tile panels and wood panel paintings [10,11]. The AF-AI technique adopts the acoustic energy absorption coefficient as an indicator for this kind of decay processes; a set of 2D Acoustic Images, each one in a specific frequency interval, provides information about different causes of decay concurring to the overall conservation state of the artwork. Some features in the acoustic images are related to the substrate’s integrity (low frequency images), other ones to the surface’s conservation state (high frequency images). The acoustic multi-frequency analysis on the Graecia Vetus showed interesting features likely associated with the masonry structure at the lower audio frequency interval, and detached areas at the higher frequency intervals correlated to the visible crack pattern. For a better interpretation of the data, the inner structure of the masonry was also investigated by using the Acoustic Tomography (AT), considered the most appropriate among the available technologies within the ADAMO project, to give complementary information. Indeed, the AT is a well-assessed method and widely employed to detect the presence of hidden bulk discontinuities inside different building materials, such as cracks or dis-homogeneities that produce anomalous acoustic or mechanical wave propagation velocity [1].
The following paragraphs present some details of the case study, a brief description of the techniques, the experimental results obtained on the Graecia Vetus and a discussion of the data integration process. The main findings reveal a potential relationship between the surface layer of the painting and the structural characteristics of the underlying masonry structure. This helps to formulate a reliable hypothesis explaining the current conservation state of the painting.

2. Case Study and Methods

2.1. Graecia Vetus in the Ariosto Room, Chigi Palace of Ariccia

Ariccia is a town in central Italy at about thirty kilometers south-east of Rome, along the consular road the Appian Way (Via Appia); it is an important tourist center for the naturalistic landscape and the architectures, such as the extraordinary urban complex of Court Square (Piazza di Corte), designed by the famous Baroque sculptor and architect Gian Lorenzo Bernini. This is the place of considerable prestige where the Chigi Palace is located. The Palace represents a unique example of the Roman Baroque style: formerly owned by the Savelli family, in 1661, the palace was acquired by the Chigi family who transformed it into a sumptuous Baroque residence, extending its structure to the current architectural configuration. The building was radically restructured on the commission of Prince Agostino Chigi by Carlo Fontana, probably following an idea by Bernini, creating a symmetrical layout with two foreparts and four corner towers, according to the type of “castle-palace”, as shown in Figure 1. Today the three floors of the Palace host the Municipality of Ariccia, a center of multiple cultural activities and a museum with an important collection of paintings, sculptures and furnishings, mostly dated to the 17th century [12,13].
At the Noble floor, the left wing of the building hosts the Ariosto Room (Sala dell’Ariosto), shown in Figure 2, characterized by the decorative cycle painted by Giuseppe Cades in 1788 with scenes inspired to the famous Ludovico Ariosto poem the “Raging Roland” (Orlando Furioso) [14,15]. In addition, two large monochrome paintings on opposite walls by the same author enrich the room, representing Antique Greece (the Graecia Vetus) and the New Italy (the Italia Nova). In particular, the Graecia Vetus and its supporting wall are the objects of the present study. Figure 2a shows the composition (plan and the axonometry) of the Ariosto room with its decorative cycle, while Figure 2c presents the orthorectified image of the Graecia Vetus.
Basing on information from publications and antique drawings, we know that at the time of the Savelli family, this specific wall was a perimetral wall belonging to the rear façade of the palace [15,16]. During the 17th century enlargement, under the Chigi family, the wall became an internal wall separating two adjacent rooms, the Ariosto room and the so-called Studio of Prince Mario, transforming the door window into a door for the passage between the two rooms. That explains the relevant thickness of the wall, 1 m. Then, the successive century decoration completed the room, which is presently considered a masterpiece of the Roman eighteenth century decorative painting, actually due to the work of Giuseppe Cades, one of the main talents of Italian Neoclassicism. Preparatory bozzettos and major historical documents belong to the Chigi Archive conserved in the Vatican Apostolic Library in Rome (BAV) [16]. Details about Cades’ work are reported in a thorough monograph [17], where further information concerning the monochromes in the Ariosto room can be found. Two beautiful preparatory bozzettos, named Greece (La Grecia) and Rome of the Pope (Roma Papale), are presently part of the remarkable collection of graphic works belonging to the Museu Nacional de Arte Antiga (MNAA) in Lisbon.
Our investigation aimed at identifying the causes of deterioration of the monochrome mural painting Graecia Vetus, visibly suffering a non-perfect conservation state. A first visual inspection evidenced a peculiar crack pattern and the presence of potential detachments; this is a singular case for that location because it is not present on the other sides of the room. This crack pattern encompasses two main lateral and vertical fracture lines, plus another slightly diagonal line joining the previous ones at mid height. Figure 2b shows some details of the paintings with the superficial fractures revealed by visual inspection.
Furthermore, a stovepipe opening at the bottom of the painting constitutes another element, recalling a reliable presence of a hidden pipe. Indeed, some twentieth century photos from the museum’s archive show a little external stove connected to that opening, and the furnishing indicating that the Ariosto room was used as a bedroom during the last decades of the century until about 1988; thus, the presence of a heater appears reasonable.
Finally, the Ariosto room underwent a restoration in 2004 [13,14]. Unfortunately, to the best of our knowledge, no existing document describes the architectural plan of the room, or any hidden structure inside that wall, nor the information about the more recent restoration intervention results archived and accessible.

2.2. Experimental Methods

The proposed experimental approach aims to integrate the datasets deriving from non-destructive dimensional measurements and acoustic acquisitions. The assumption of the experiment starts from the observation that the detachment or delamination mechanism is usually connected to a geometric variation of the interested part with respect to the surrounding environment.
During the acquisitions, it was important to prepare a dimensional reference system that would allow the datasets acquired with different techniques to be aligned and correctly superimposed. The rectangular Region of Interest (ROI) of the artifact was identified by means of a self-levelling laser pointer supported by a tripod, generating a cross-shaped beam to identify the coordinates of some reference points useful for the alignment procedure. In Figure 3, a scheme of the wall with the measure setting is shown.

2.2.1. Geometric Acquisition and Analyses

The applied method starts with the execution of a photogrammetric survey, useful both to obtain a dense point cloud for geometric analyses and an orthorectified image to superimpose the maps obtained from surveys carried out with other methods: the geometric analyses (in terms of distance from the medium plane, dip and direction) and the acoustic images.
The photogrammetric survey was obtained through the Structure from Motion (SfM) process. The 2D image set consisted of 66 high-resolution images captured by a Nikon D800 (NITAL S.p.A., Turin, Italy) equipped with a Nikkor calibrated lens with a focal length of 28 mm. The photographic setting consisted of two 1000w Ianiro Varibeam lamps that emit at a temperature of 3400 K. A color checker Datacolor Mod. SpyderChecker (Datacolor, Lawrenceville, USA) was inserted in the scene in order to calibrate and balance each captured photo. Two photogrammetric markers completed the scene in order to scale the 3D model during the processing of the dense cloud [18]. Moreover, a laser pointer projected a cross-shaped beam onto point A (0, 0) of the ROI on the surface.
The acquired photos were processed with the software Agisoft Metashape in order to obtain a dense cloud model of the entire wall containing the painting (124 M points). The processing with the software Agisoft Metashape was done on the Itacha platform, ENEA TERIN-ICT, Rome, Italy. Subsequently was selected the ROI delimited by the laser beams, which counts 60 M points, as shown in Figure 4. With the same software, it was possible to create a high resolution orthomosaic image of the mural painting, in which every pixel is equal to 1 mm of the surface. The orthorectified image, avoiding the distortion of the camera lens, is particularly useful as a basis for superimposing point by point the maps obtained with other diagnostic methods.

2.2.2. Frequency Resolved Acoustic Imaging

Structural damage in artworks can be effectively revealed by means of contactless acoustic diagnostic techniques. In particular, in recent years, the authors demonstrated that the evaluation of the acoustic energy absorption coefficient results as an appropriate indicator to detect detachments and flaws in different typologies of paintings [7,8].
Different mechanisms, related to the structural properties of materials and complex structures, concur to produce acoustic energy absorption. Detachments in paintings, and any parts presenting a non-perfect adherence between adjacent elements, vibrate when exposed to an external acoustic excitation field, partially absorbing the incoming acoustic energy. In addition, the acoustic absorption is related to the porosity of the materials and to their elastic properties; thus, other decay processes might be revealed. For instance, the detection of moisture effects on masonry is another class of structural damage that can be monitored, based on the knowledge of the acoustic response of wet and dry walls [19].
To perform the acoustic absorption measurement according to the AF-AI methodology, the related device named the Acoustic Energy Absorption Diagnostic Device (ACEADD) automatically scans an area while an acoustic source radiates towards the surface an acoustic wave with audible frequency content, and a receiver records the acoustic pressure wave, as shown in Figure 5. The microphone, placed amid the source and the surface under study, records both the incident wave pi(t) and the reflected wave pr(t) after a specific time delay τ as expressed in Equation (1):
p ( t ) = p i ( t ) + p r ( t ) = p i ( t ) + L b p i ( t )     h ( t     τ )
where Lb is a geometrical factor (<1) accounting for the beam spreading and the different paths between the incident and the reflected waves, while h(t − τ) is the impulse response that represents the acoustic response of the analyzed area accounting for the time delay τ. The symbol ⨂ indicates the convolution.
The signal processing is based on the Cepstrum algorithm [10,11,20,21], defined as the inverse Fast Fourier Transform of the natural logarithm of the power spectrum P(f):
C ( t ) = IFFT [ ln | P ( f ) | 2 ] = C i ( t ) + L b h ( t     τ ) + higher   order   terms
The cepstrum trace C(t), in Equation (2), is a simple sum of the incident wave’s cepstrum, Ci(t), and the reflection peak, plus higher order terms of this latter. In Equation (2), only the first term is considered, while the higher order terms derive from a series expansion. They can be neglected because they are scaled by a power of the geometrical factor Lb, which is <1, and they occur at different delay times, ±2τ, ±3τ and so on [20]. All these terms are peak shaped, decaying to background quite rapidly; thus, the reflection peak arises over a flat background around zero. The signal processing extracts from Equation (2) the impulse response h(t − τ) of the surface, in the measurement point, by a simple time window, while, in the frequency domain, its FFT H(f) determines the reflection coefficient r(f) and the absorption coefficient α(f) as in Equations (3) and (4), respectively, according to their definition [22]:
r ( f ) = ( 1 / L b )   ( | P r ( f ) | 2 / | P i ( f ) | 2 ) = | H ( f ) | 2
α ( f ) = 1   -   r ( f )
For each measuring point (i), the total amount of reflected energy Σi, over the entire frequency interval Δf, is calculated as follows:
Σ i =   Δ f   | H i ( f ) | 2   df .
It is common practice to assume the most reflecting point (R) as the reference, thus restituting the data in terms of percentage of acoustic energy absorption ABS%, which is calculated for each analyzed point (i) with respect to the reference point, as in Equation (6):
ABS % i = ( Σ R     Σ i ) / Σ R .
In order to guarantee a thorough detection of a wide range of decays, the measurement employs a broadband audio frequency excitation, from a few hundredths of a Hz to about 16 kHz depending on the object under study. The ABS% data are configured in matrices and displayed as false color images, using a color scale corresponding to the interval of ABS% values (0–100)%. This type of measurement firstly provides one broadband image, the integrated acoustic image (IAI), which sums up the information about many elements concurring to the overall state of conservation of the painting, detachments and other decay effects. The acoustic image is overlaid and correctly aligned on a painting’s photograph, so that the localization of the critical areas is easily accomplished.
A suitable frequency analysis extracts the data dividing the wide frequency interval Δf into n narrow frequency intervals Δfn, namely, 1/3 octave bands, expressing the two indicators Σ i n   and ABS % i n as follows in Equations (7) and (8):
Σ i n = Δ f n   | H i ( f ) | 2   df , n = 1 / 3   octave   band   index
ABS % i n = ( Σ R n   -   Σ i n ) / Σ R n .
In this case, the results are displayed as a set of n frequency-resolved acoustic images (FRAI), according to the same IAI graphical procedure. Further details about the experimental method, data analysis and other case studies can be found in previous works [7,8].
Figure 5a shows the scheme of the contactless transceiver unit, having an acoustic source and a microphone mounted in co-axial configuration, and its electronic chain as the ACEADD basic components. The right side of this scheme shows the resulting set of acoustic images: one wide band image, plus a number of narrow band images. In this work, the highly directive acoustic source has been employed: a square (20 cm × 20 cm) Audio Spotlight by Holosonics that delivers a narrow sound beam towards the examined surface. The omnidirectional microphone Sony T145 (SONY, Tokyo, Japan), with 50 mV/Pa sensitivity, measures the amount of reflected acoustic energy, using a back reflection geometry. A motion control unit allows the automatic instrument scan; a PC remotely controls the measure through the National Instruments USB6221 (National Instruments, Austin, TX, USA) acquisition board and analyses the data in real time by means of a custom software. Figure 5b shows the ACEADD system during the on-site measurement.
The experimental procedure includes a part dedicated to the repeatability tests, in order to provide an evaluation of the uncertainty of measurements. Usually, two or more vertical profiles are selected to carry out multiple repetitions during the entire measuring campaign; thus, a restricted but statistically significant number of points are used to calculate the average values across multiple repetitions of the indicators Σ and ABS% and analyze their standard deviation and relative uncertainty. Relative uncertainty below 20% can be considered good enough for assessing the reliability of the results.

2.2.3. Masonry Inspection through Acoustic Tomography

Among the most widely used techniques for Non-Destructive Testing (NDT), the Acoustic Tomography (AT) is a powerful tool for identifying defects within an object or structure, reconstructing cross-sectional slice images by elaborating data of transmitted acoustic signals [23]. Indeed, the visualization of the internal structure of a material is fundamental for evaluating the good condition of many infrastructures’ components.
The procedure consists in measuring the time of flight of a longitudinal sonic wave, generated by a sound generator and propagating into the object under test. An instrumented impact hammer is commonly used to produce a sonic pulse, while an accelerometer, placed at a known distance, receives the wave and converts it into an electrical signal.
The pulse velocity estimated through the AT Technique is an apparent physical quantity, since for its calculation it is used the minimum linear path between the point of impact and the receiver, and in some cases the measurement underestimates the real value [24,25,26]. Nevertheless, the occurrence of defects and heterogeneities is correctly indicated. In such cases where the masonry presents a very heterogeneous inner structure, very frequent in historical building where the ancient materials properties and architectural structure are unknown, the velocity value loses its physical meaning, and it is more useful to display data in terms of relative variation of pulse velocity (%).
Indirect AT has been employed in this work: for each measurement, the acquisition system simultaneously records the impact hammer signal and the accelerometer signal, according to the scheme in Figure 6a, where each impact point is connected to n positions of measurement. The results are displayed as a 2D map providing the distribution of relative variation of pulse velocity inside the masonry. The cross-sectional slice image of pulse velocity can highlight the internal morphology of different materials, indicating the degree of homogeneity, the presence of defects and discontinuities or lack of adhesion.
For the indirect tomography, the signal processing is based on the Back Projection (BP) algorithm from the projections of the sound paths, and the tomographic reconstruction is accomplished by software, customarily developed by the Enea Casaccia Research Center. The processing discretizes the cross-section of the investigated structure, dividing it into N cells with known dimensions, according to the number of projections and the extension of the structure. Each path is characterized by a specific pulse velocity value, while a defined number of paths crosses each cell. The output is a matrix V whose element is the average of the velocity values relative to the paths crossing a specific cell, as expressed in Equation (9):
V   = [ v ij ]   v ij = 1 L   p = 1 L v p
where p is the path index, and L is the number of paths crossing the ij-cell. The cycle is repeated for all cells; finally, each vij is converted to the percentage variation with respect to the highest value vmax, i.e., the Relative Variation of Pulse Velocity (RVPV%). The values of this quantity, RVPV% for each ij-cell, constitute the pixels of the tomographic image, as expressed in Equation (10):
RVPV % ij = ( v max   -   v ij ) / v max .
The equipment operation is based on contact measurements, employing a piezoelectric ultrasonic emitter and a similar piezoelectric probe of the ICP pressure sensor type by PCB®®. The detected signal, after amplification and filtering, is transmitted to the acquisition and processing unit, equipped with a customized software, that finally displays the results on a monitor.

3. Results

For a better understanding of the conservation state of the painting, the following paragraphs will report the results of the different techniques and will discuss the data fusion procedure adopted in this case study. AF-AI and the AT measurements were accomplished during the same days at the end of March 2019; photogrammetric survey and further AT measurements were conducted in December 2020. Stable environmental conditions characterized the two experimental campaigns, with room temperature (13 ± 1) °C, and relative humidity ranging within 46% and 58% (±1% of uncertainty) detected near the investigated surface.

3.1. Photogrammetric Analysis

Through the functions of the open-source software Cloud Compare, the dense cloud of the ROI was geometrically analyzed. A Digital Elevation Model was elaborated in order to visualize the standard deviation from the best fitting plane of the surface. Figure 7 shows how the central part of the painting could be affected by a discontinuity, a case that would suggest the presence of a detachment mechanism or a subsequent restorative intervention on the work. For a better visualization of the surface morphology, a map of the contour lines has been elaborated in order to better represent how many millimeters the observed variation corresponds.
This method of visualization is particularly useful to highlight, with a low-cost method, the areas that probably present a detachment or delamination mechanism. Like the most common image-based techniques, it should constitute a low-cost non-invasive investigation preparatory to diagnostics carried out with specialized methods. Moreover, considering the resolution of the image, it is possible to analyze and visualize the details of the painting through a precise scale representation, as shown in Figure 8.
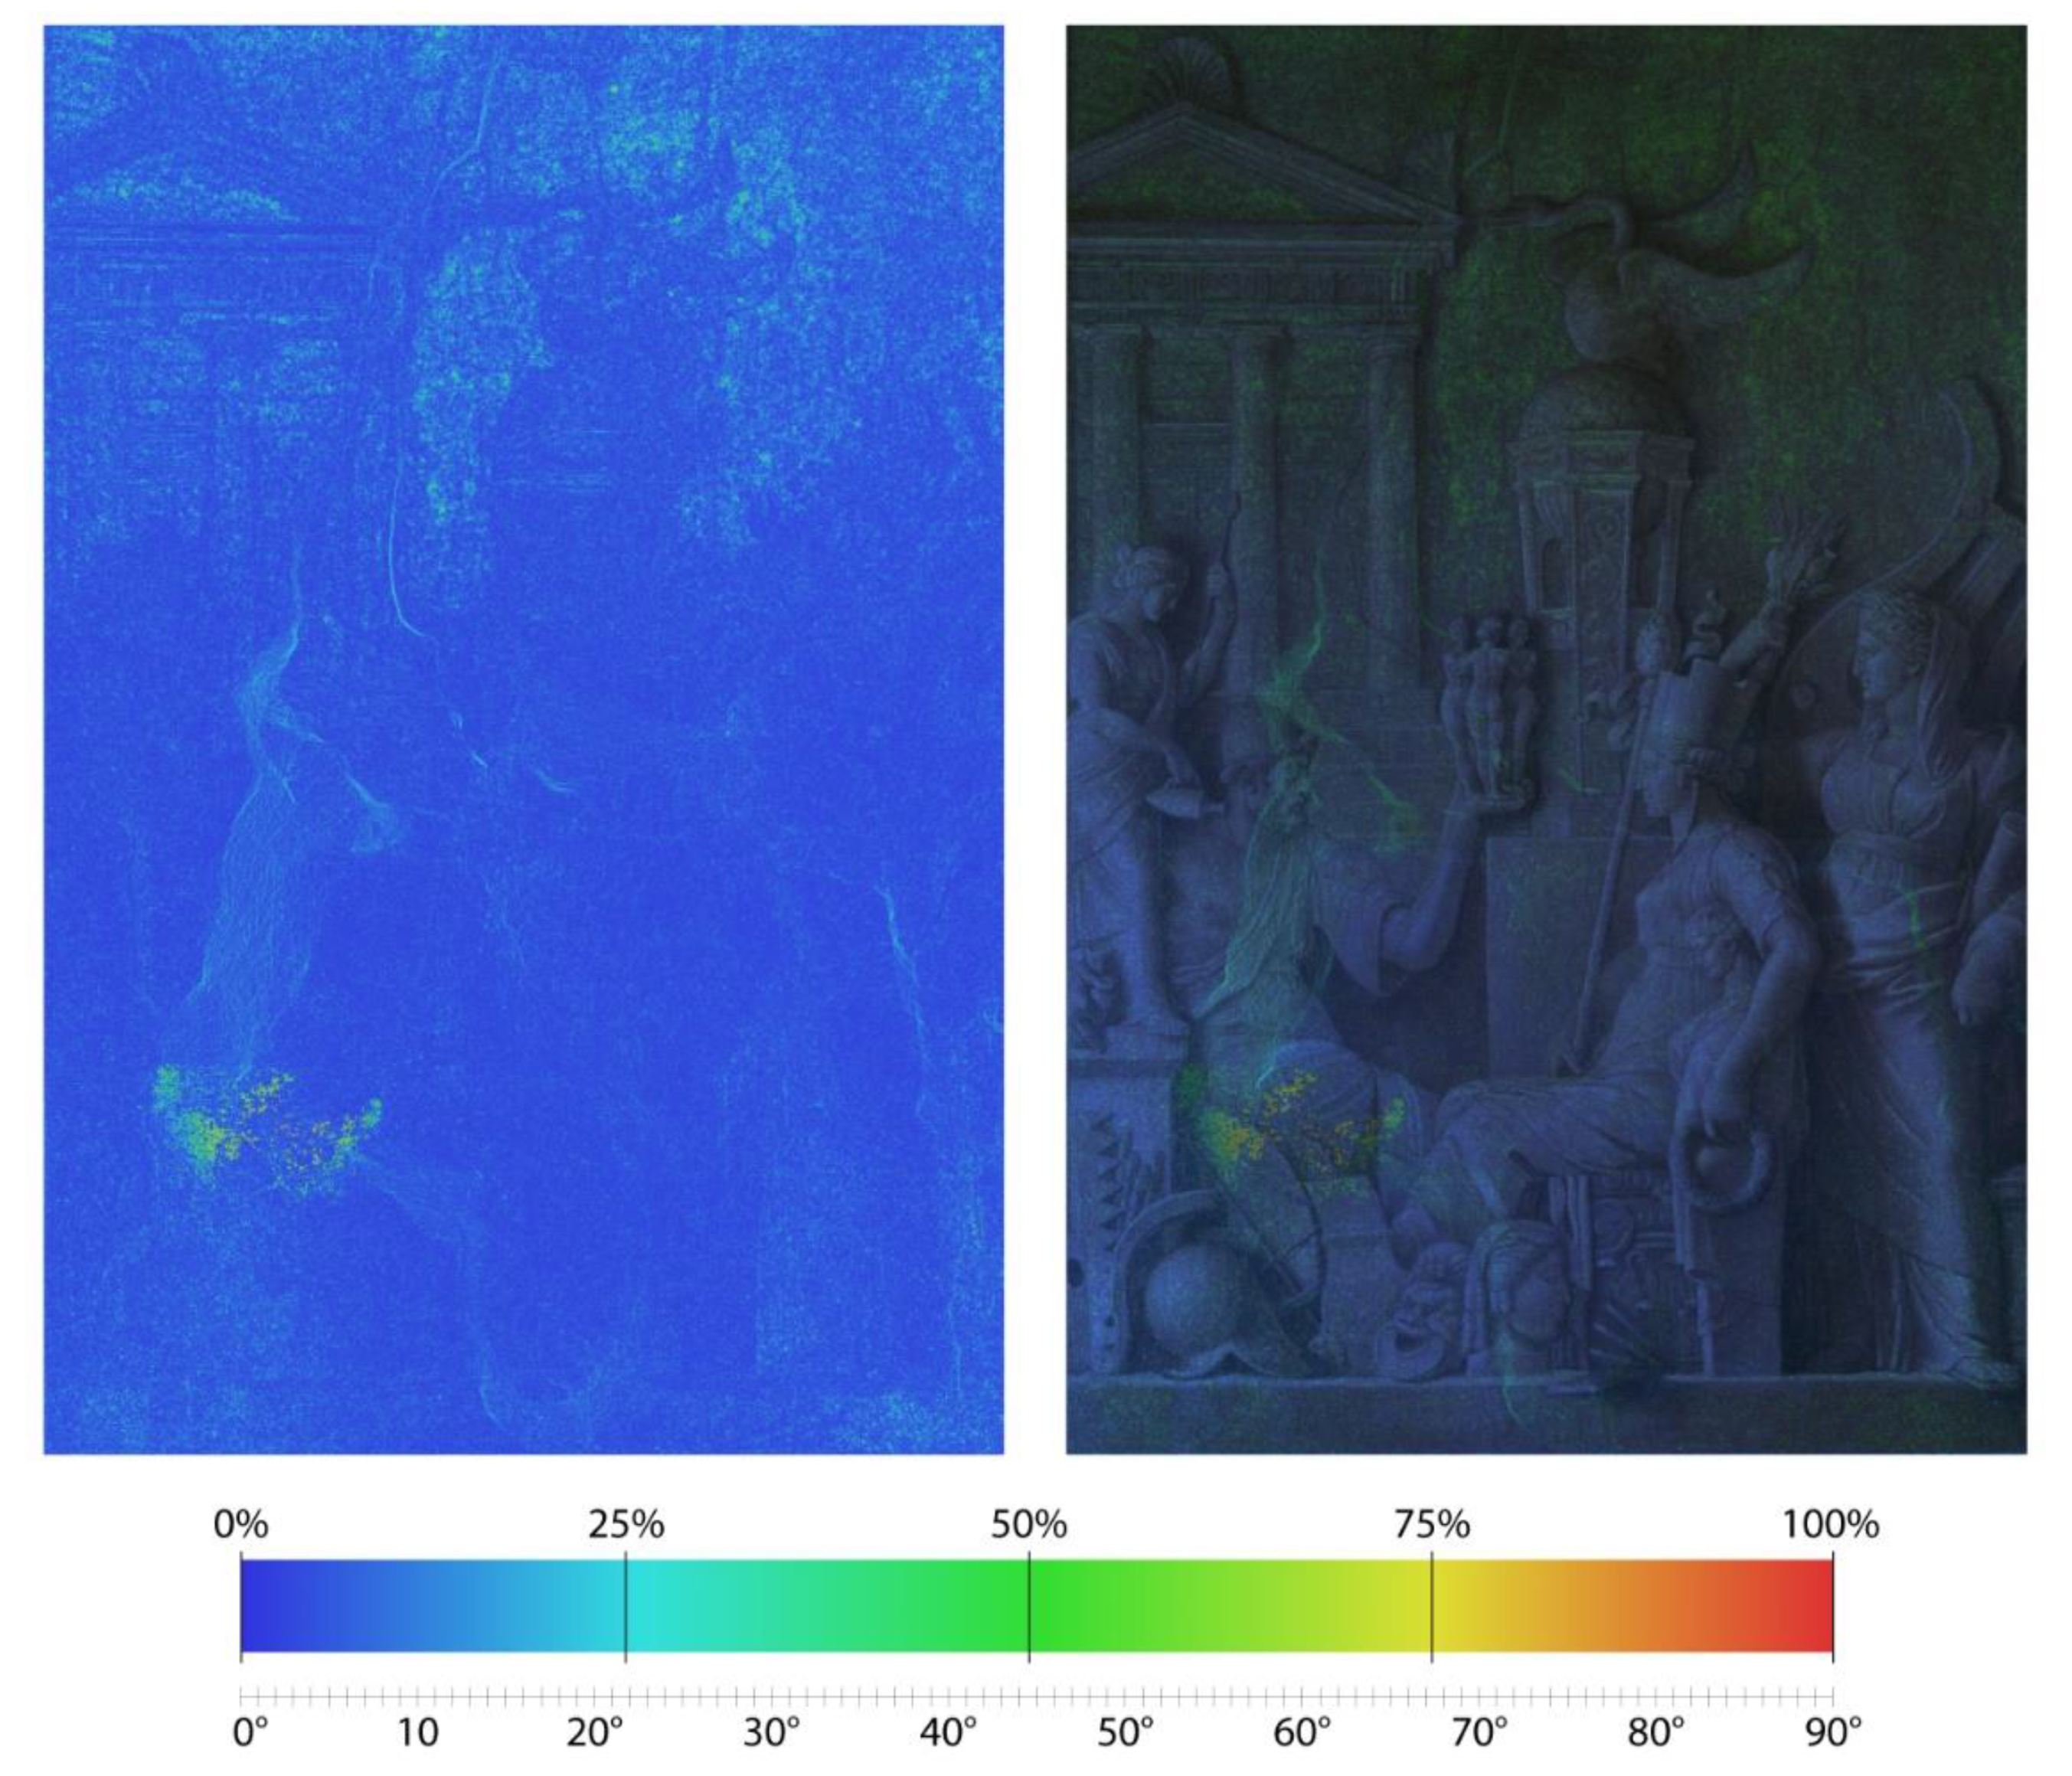
The analysis of the normals calculated for each point (elaborated with the software Cloud Compare) allows one to view the variation linked to the dip and the direction of each point referred to a nearby area. In Figure 9, it is possible to recognize that the central part of the artwork is characterized by a raised area (almost rectangular); the slope analysis highlights the contours allowing to better identify the damaged areas. These areas of the painting, in fact, present significant variations in terms of slope and direction with respect to the average circular plane that best fit the neighbor points in the radius of 3 mm. Figure 9 shows, also, that in the upper part of the painting, the surface is characterized by a more relevant roughness. Moreover, the figure reveals a surface breaking mechanism that affects the central part of the painting and rises from the center to the upper edge of the composition.

3.2. Acoustic Images of the Graecia Vetus

The area of analysis (1.6 m × 2.1 m) covers almost the whole surface of the Graecia Vetus, with 1419 points of measurements at 5 cm distance from one another, at a height 1.33 m from the ground. Two configurations of the scan unit were used in order to cover the whole extension in two parts, the lower half (from height 1.33 m to 2.43 m) and the higher half (from height 2.33 m to 3.43 m), with a little portion of superposition.
Figure 10 shows the results obtained by composing the ABS% maps on the orthorectified image of the painting, derived by photogrammetric survey. Specifically, Figure 10a reports the broadband image (namely, IAI image) related to the entire frequency band (500–12,000 Hz) used in this specific measurement, thus providing an overall view of different critical zones and decay processes. The color levels ranging from yellow to dark red (45–100%) evidence the most critical areas, characterized by the presence of detachments and other sub-surface cavities, mainly distributed in the lower half of the painting and partially localized in the proximity of visible cracks. A better conservation state clearly characterizes the upper half, over the heads of the figures. Finally, in the center at the bottom of the painting, a defined area appears near the stovepipe opening. A great number of acoustically reacting spots are distributed over the entire surface, suggesting a very heterogeneous inner structure of the wall.
A selection of the FRAI images in the most relevant frequency bands are shown in Figure 10b–d, providing many other details that emerge at different frequency values. The most reliable FRAI images, in terms of best obtainable uncertainty, were found between 1000 Hz and 10,000 Hz. Indeed, in these frequency bands, the relative uncertainty evaluated through multiple repetitions on a restricted number of points was comprised in 6–16%.
At the lower frequency band shown in Figure 10b, 1000 Hz, a wide and regular red area evidently appears in the lower half and at the center-right part of the painting, suggesting the presence of an important sub-surface cavity. This last might be connected to the stovepipe opening, considering the proximity of the two. At the medium and high frequency bands, 6300 Hz in Figure 10c and 10,000 Hz in Figure 10d, some relevant detachments appear mainly at the crossing points of important cracks, or along them. At the bottom, a very regular zone clearly emerges in the central part, suggesting the presence of a well-defined cavity with the same extension of the circular stovepipe opening; considering that high resonance frequency values depend on thin superficial layers, this little and central cavity probably results as being more superficial than the rectangular one in Figure 10b.

3.3. Masonry Inspection through Acoustic Tomography

The AT tests were performed in the lower part of the Graecia Vetus, along a horizontal axis identified, in Figure 11, with the yellow line 1, the indirect AT measurement, and with the red line 2, the direct AT measurement, respectively. The two lines are geometrically superimposed and indicate the axis along which the analyzed points are distributed. The extension of the first dataset covers 2.1 m, while the second dataset extends over almost the entire wall, from the door jamb for an extension of 3.6 m. The thickness of the wall is 1 m; the value was derived from the historical plans of the building and verified on site through the direct measure across the light of the door connecting the two rooms.
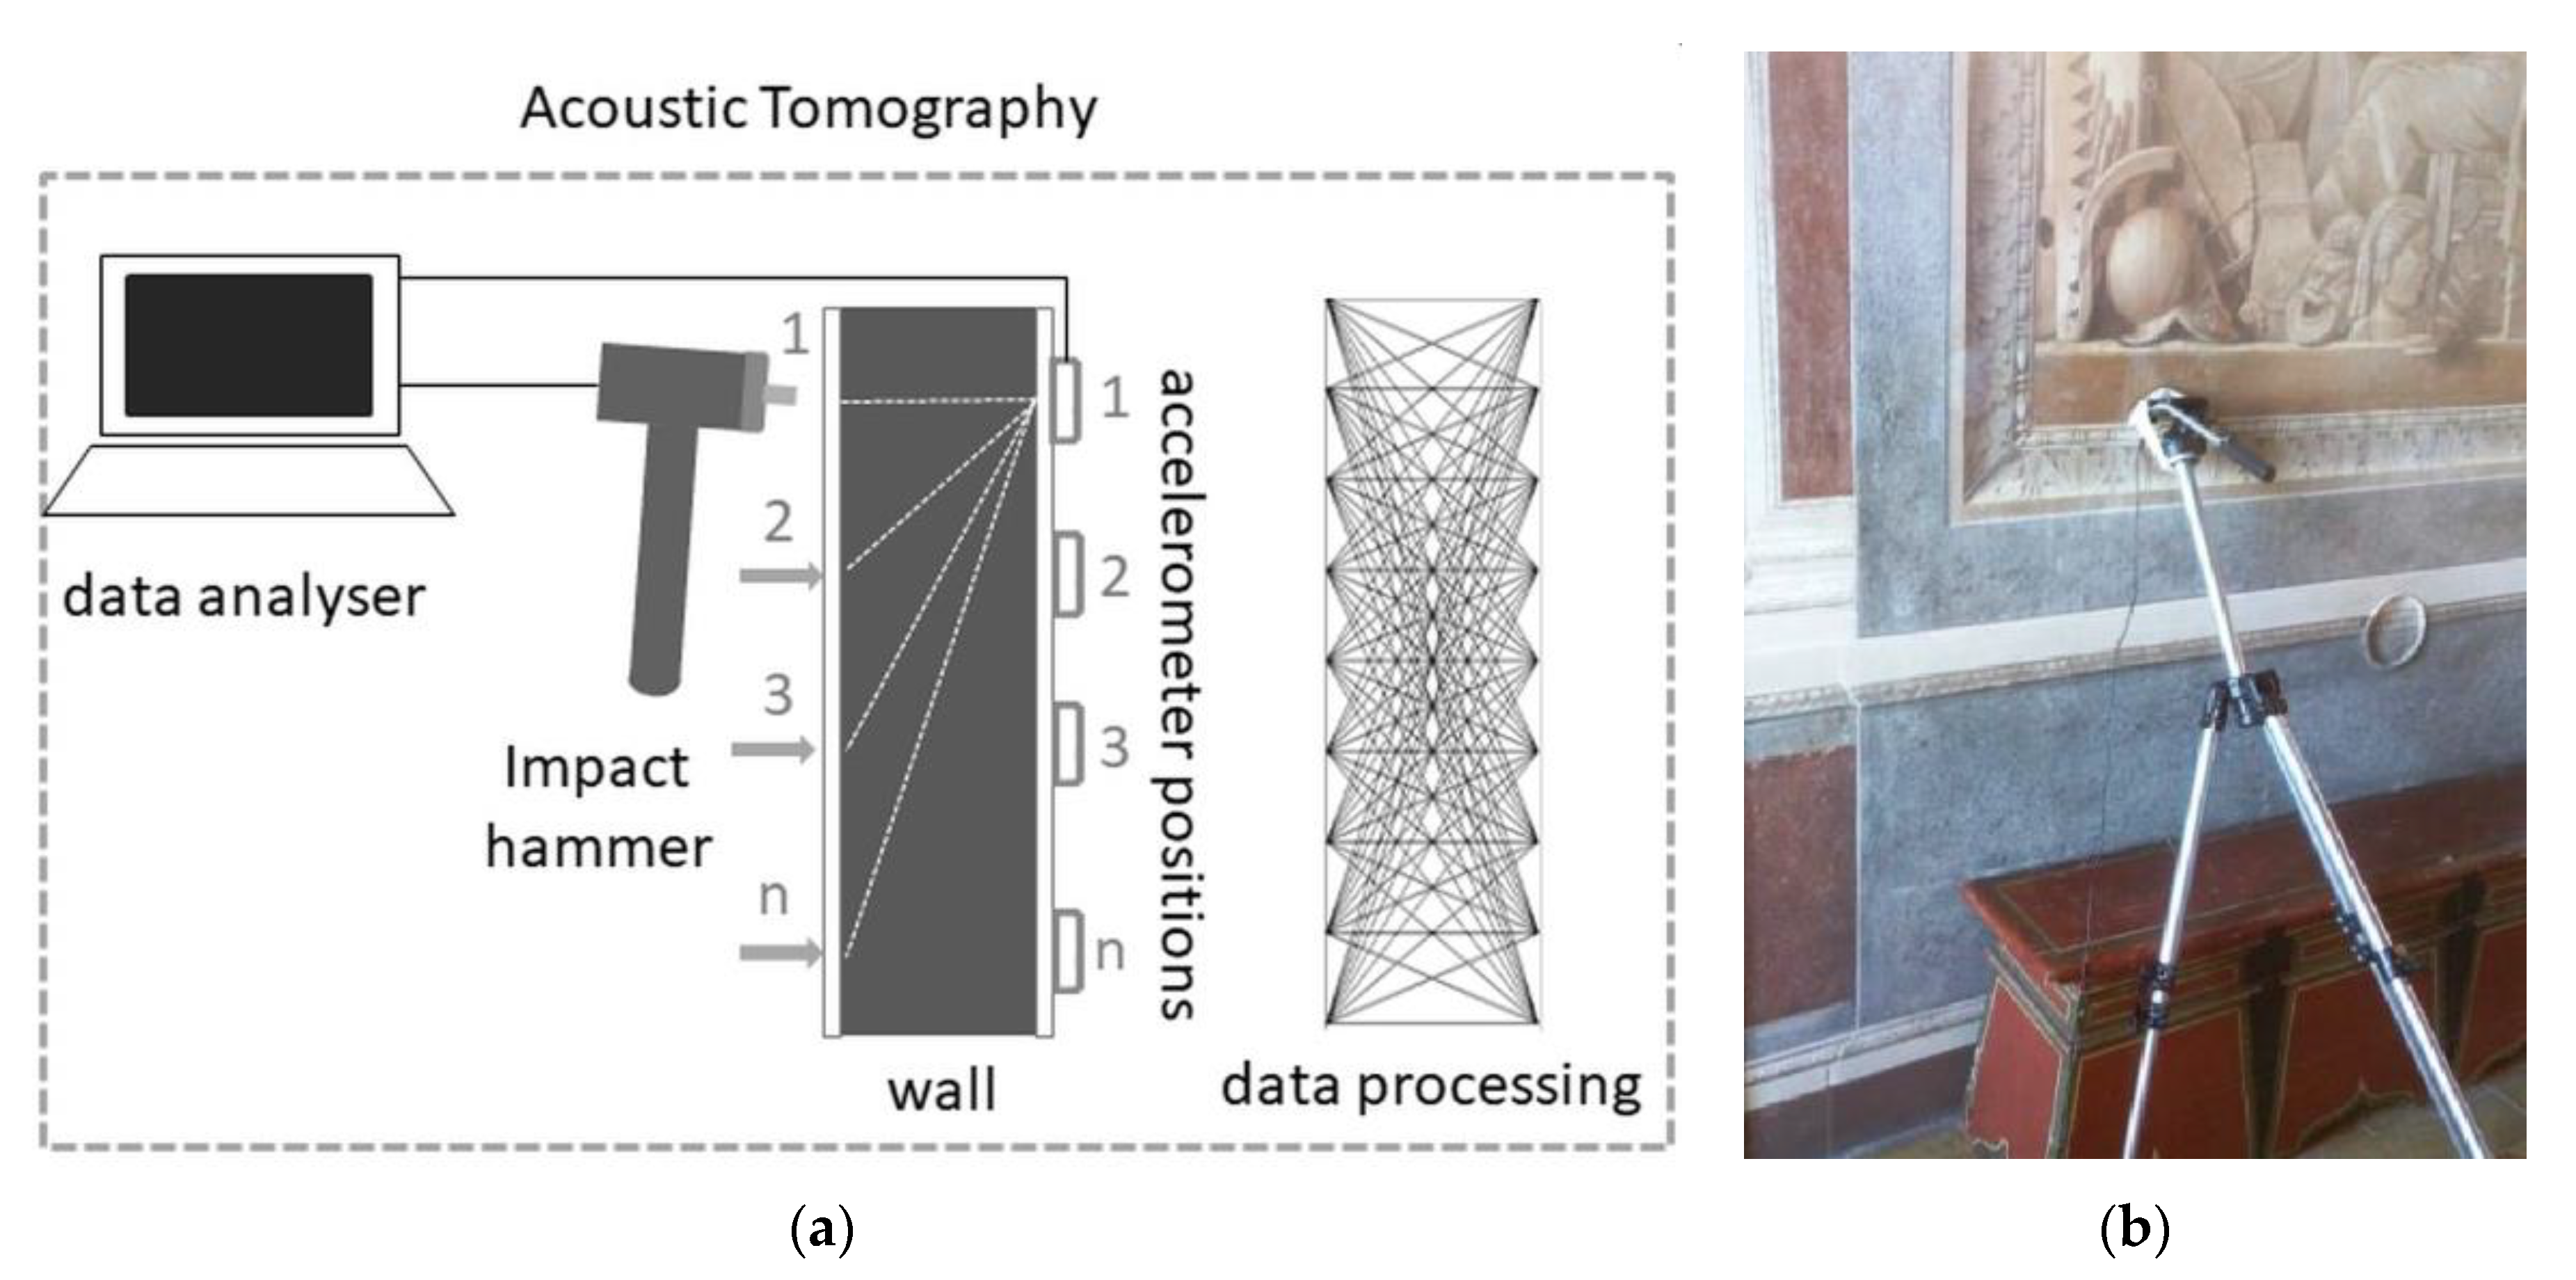
The acquisition system controlling the equipment and the impact hammer were positioned on the Studio of Prince Mario side, while the accelerometer was placed on the other side of the wall, in the Ariosto room, held by a tripod at height 1.4 m from the ground, as shown in Figure 6b. The impulse was generated by beating on the leather-covered wall, while the measurement points were aligned along the horizontal axis.
The leather covering in the Studio was present on the entire investigated area, and for its high historical/artistic value, it was not possible to detach small areas to make the measure directly on the wall. We verified that, for each measuring point, the same conditions were present: the adhesion of the leather on the wall, the thickness of the material or the presence of glue. Direct preliminary tests of AT were carried out on areas where coverage was only partially present to assess the effect that the presence of the covering could have on the shape and strength of the signal measured by the accelerometer. The analysis confirms that the covering has a signal filtering effect for frequencies above 300 Hz, reducing the main peak intensity by about 40%. Although an attenuation is present, the main structures of the spectrum are well defined and the obtained accelerometer signal is well shaped.
The indirect AT was applied to a horizontal section of the wall, whose thickness is 1 m, separating the Ariosto room from the Studio of Prince Mario. The 64 measurements resulted from the combination of 8 impact points and 8 accelerometer positions, 0.3 m distant from one another. The grayscale tomography map described in Figure 11 was reconstructed through the data-processing software, previously described. The value of the maximum apparent velocity measured inside the masonry is 620 m/s and the distribution of the relative variation suggests the presence of discontinuities, together with a very heterogeneous structure known as sack masonry typical of the building’s construction technique of the same period. These findings are compatible with other works that can be found in the literature [26].
In addition, a percentage variation between 60% and 70% in the central part of the masonry suggests the presence of a well-defined cavity, mainly extended to the right of the circular stovepipe opening.
Furthermore, direct AT tests were performed along the red line 2, using 13 measurement points covering the entire wall on which the Graecia Vetus is located. In Figure 11, the graph of the relative velocity estimated on the maximum measured value (point 13 at 3.9 m) is shown, and the area of the ROI and the point corresponding to the stovepipe opening are marked. The maximum value of the apparent pulse velocity is about 890 m/s, at the right lateral zone, while the minimum value of about 120 m/s is reached in the central area, with a reduction of about 80%. Such a high variation in the relative percentage confirms the inner heterogeneity of the wall and the presence of significant cavities.
The difficulty of interpretation of the results in the case of inhomogeneous materials like masonry was always known and these results were clearly interpreted as qualitative information rather than actual quantitative values.

3.4. Data Interpretation and Integration

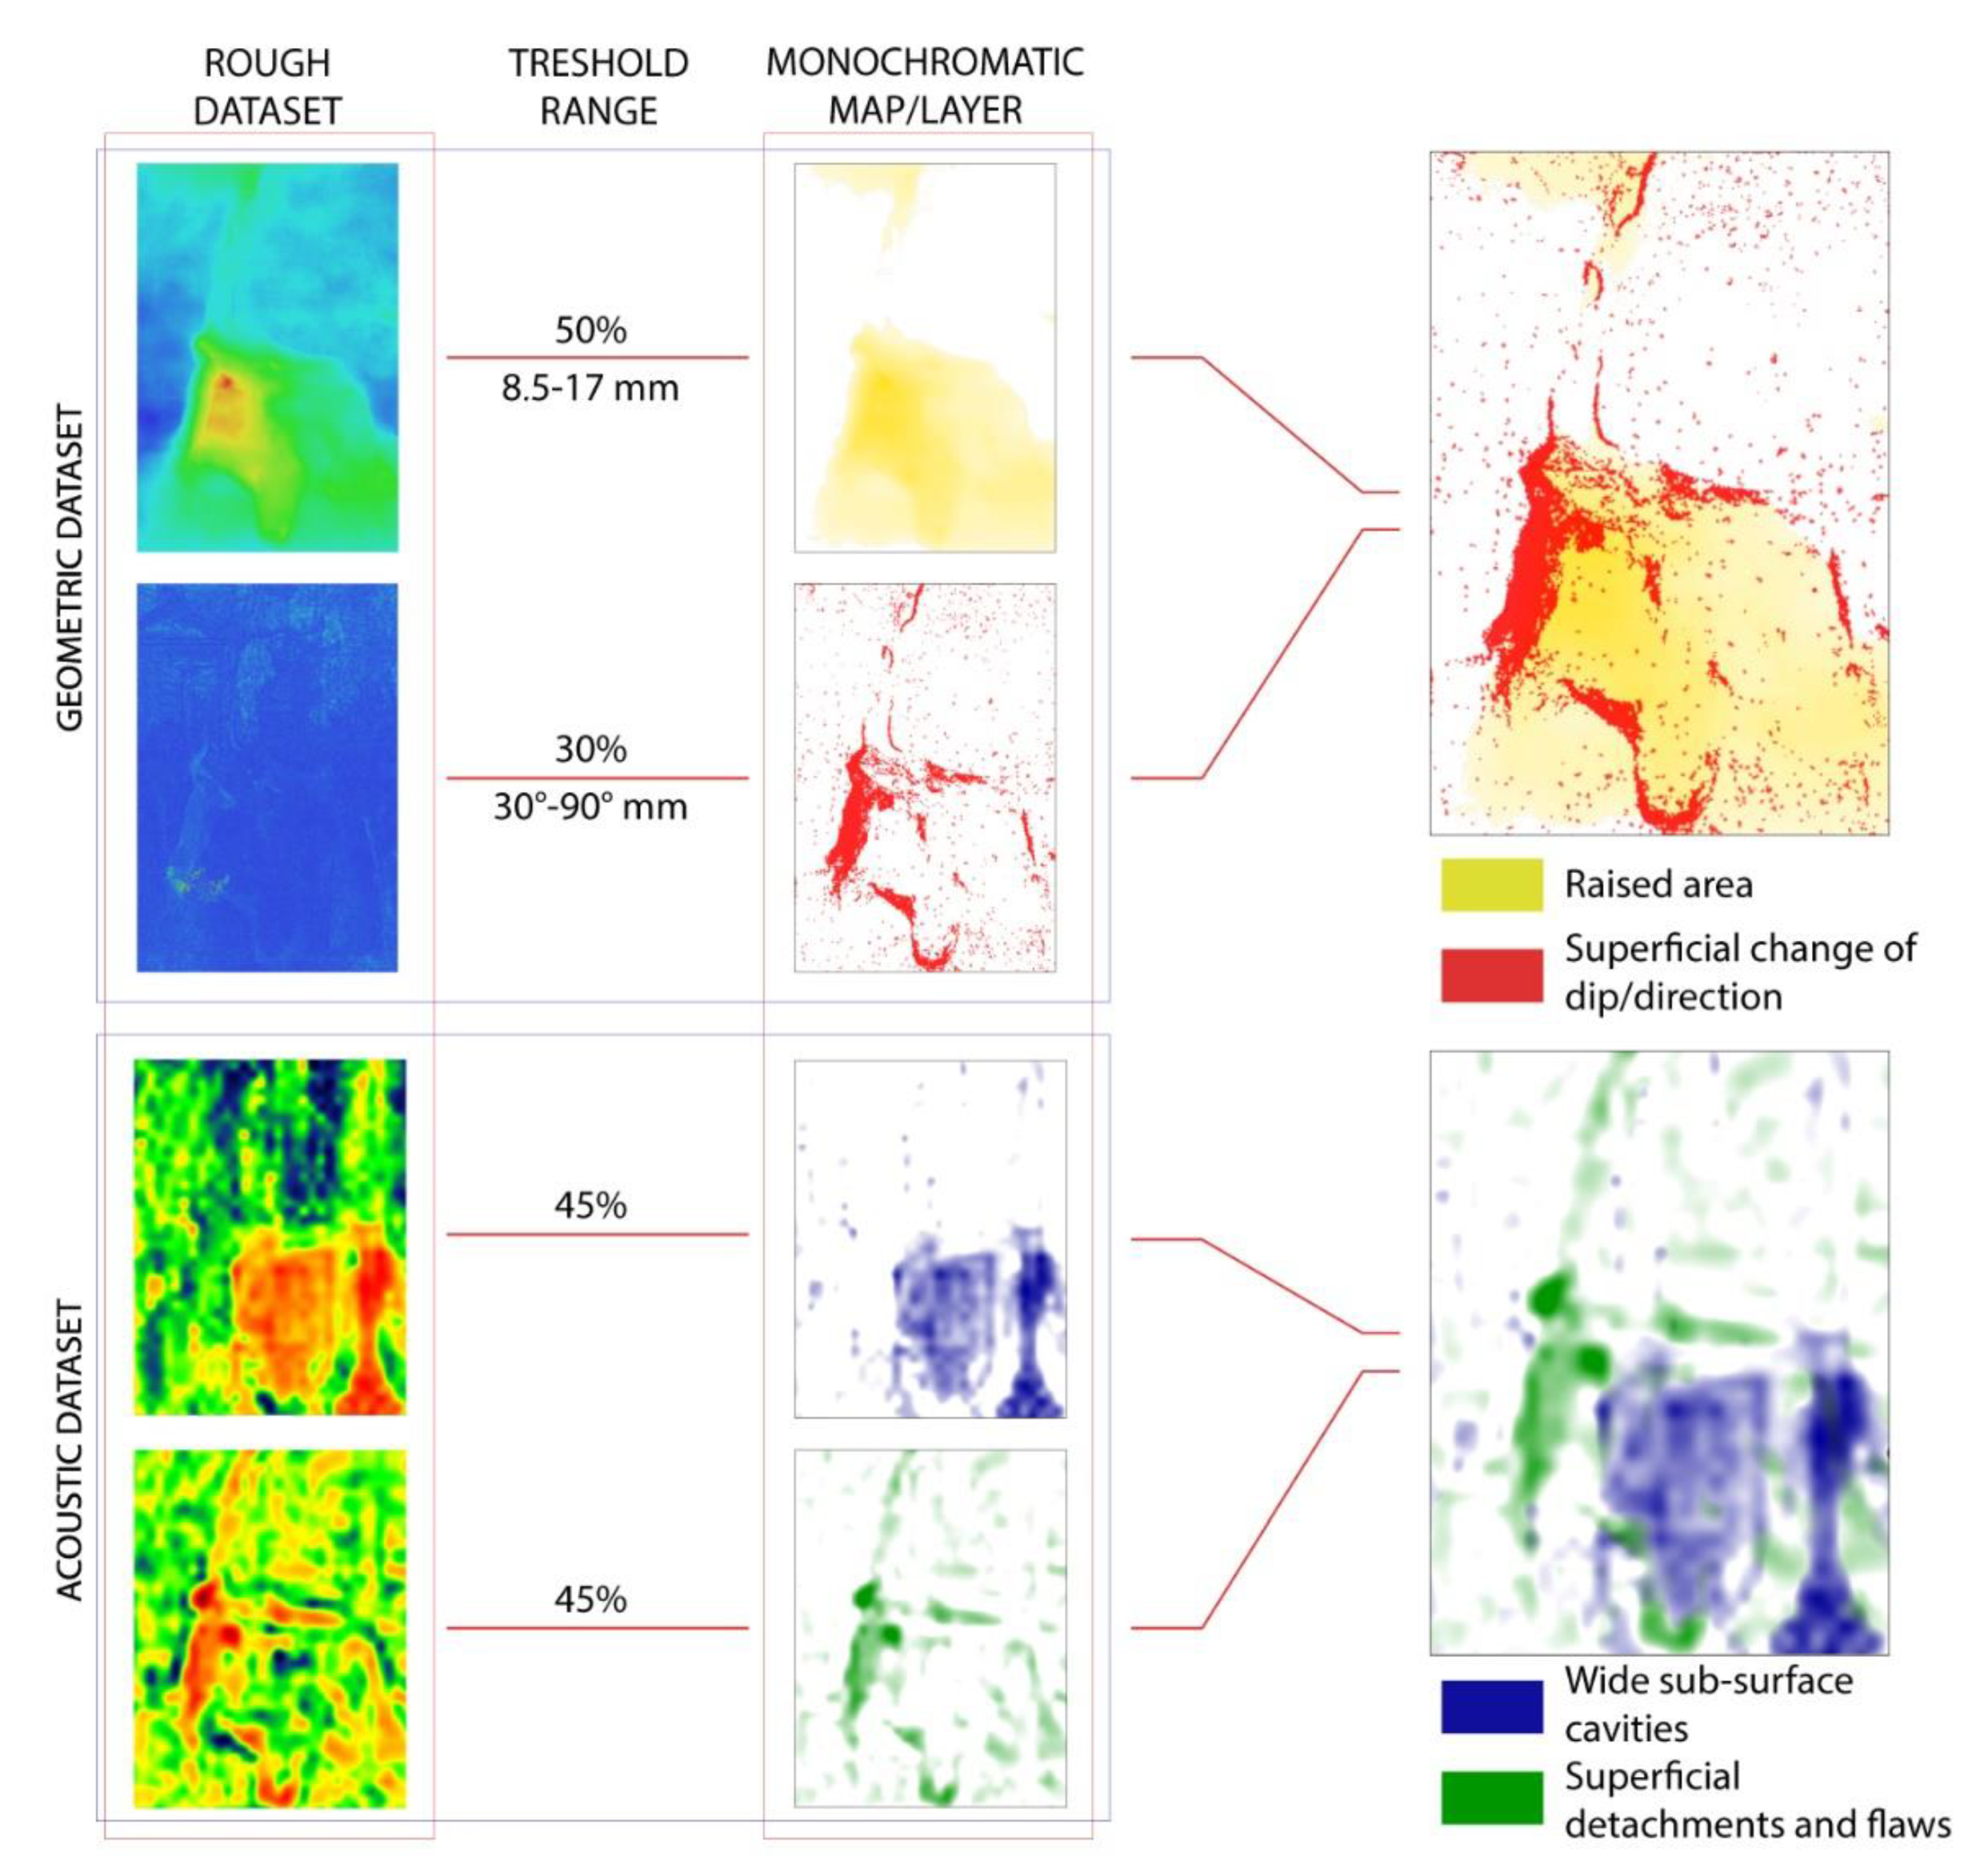
The last part of the study, after the insight into the results of each individual methodology, faced the integration of them all. The AT results were used to support the findings of the AF-AI since the datasets are related to two different orthogonal planes. The more effective data fusion regarded the 3D geometrical relief and the 2D acoustic images in two frequency bands, 1000 Hz and 10,000 Hz, from which specific features could be well identified and extrapolated.
The data fusion procedure, adopted in this study, encompasses a number of steps:
  • the harmonization of the datasets, in order to represent all the different physical quantities as variation percentage with respect to a reference element (a point, a plane, an angle, etc.) and with the same spatial resolution in the plane;
  • the interpretation of the single images within their proper significance criteria, in order to give evidence to the most relevant features;
  • the extrapolation of the main features, by applying thresholds which are meaningful within their proper significance criteria, and displayed in monochrome color scale images (256 color levels from white to full color);
  • the discrimination of the different features by correlating each one to a different color;
  • the constitution of a suitable vocabulary for translating the significant features of each dataset in categories of damage/risk;
  • the alignment of the images with respect to the common references, ROI origin and limits;
  • the composition of a unique multi-layer map, where each layer corresponds to one category of damage/risk evidenced by the different methodologies.
Figure 12 shows the images, after step (4), that gather the information about both the surface morphology and the sub-surface defects, as synthetically reported in Table 1:
Figure 12 shows that the peculiarity of the method is represented by the integration of maps consciously interpreted by the operators, who can manage their weight through the thresholds of each layer. The different artistic supports, the variety of techniques and the different possible geometries of the surfaces impose the need to interpret the data before fusion through the choice of characteristic intervals for each map. As shown in Figure 13, it is possible to associate the acoustic maps and the morphological ones in order to have homogeneous datasets referring to the same type of analysis. More generally, the overlapping of data relating to morphological and acoustic diagnosis allows correlating of the degradation dynamics on the surface (recalling also the visible crack pattern) with the deep degradation mechanisms. The method therefore allows a double reading: asynchronous being able to read each layer individually, and synchronous being able to read several overlapping layers. It will always be the expert operator, with his sensitivity and awareness, who will correlate several physical characteristics one another, highlighting the major criticalities of the product.
The output of this procedure is presented in 
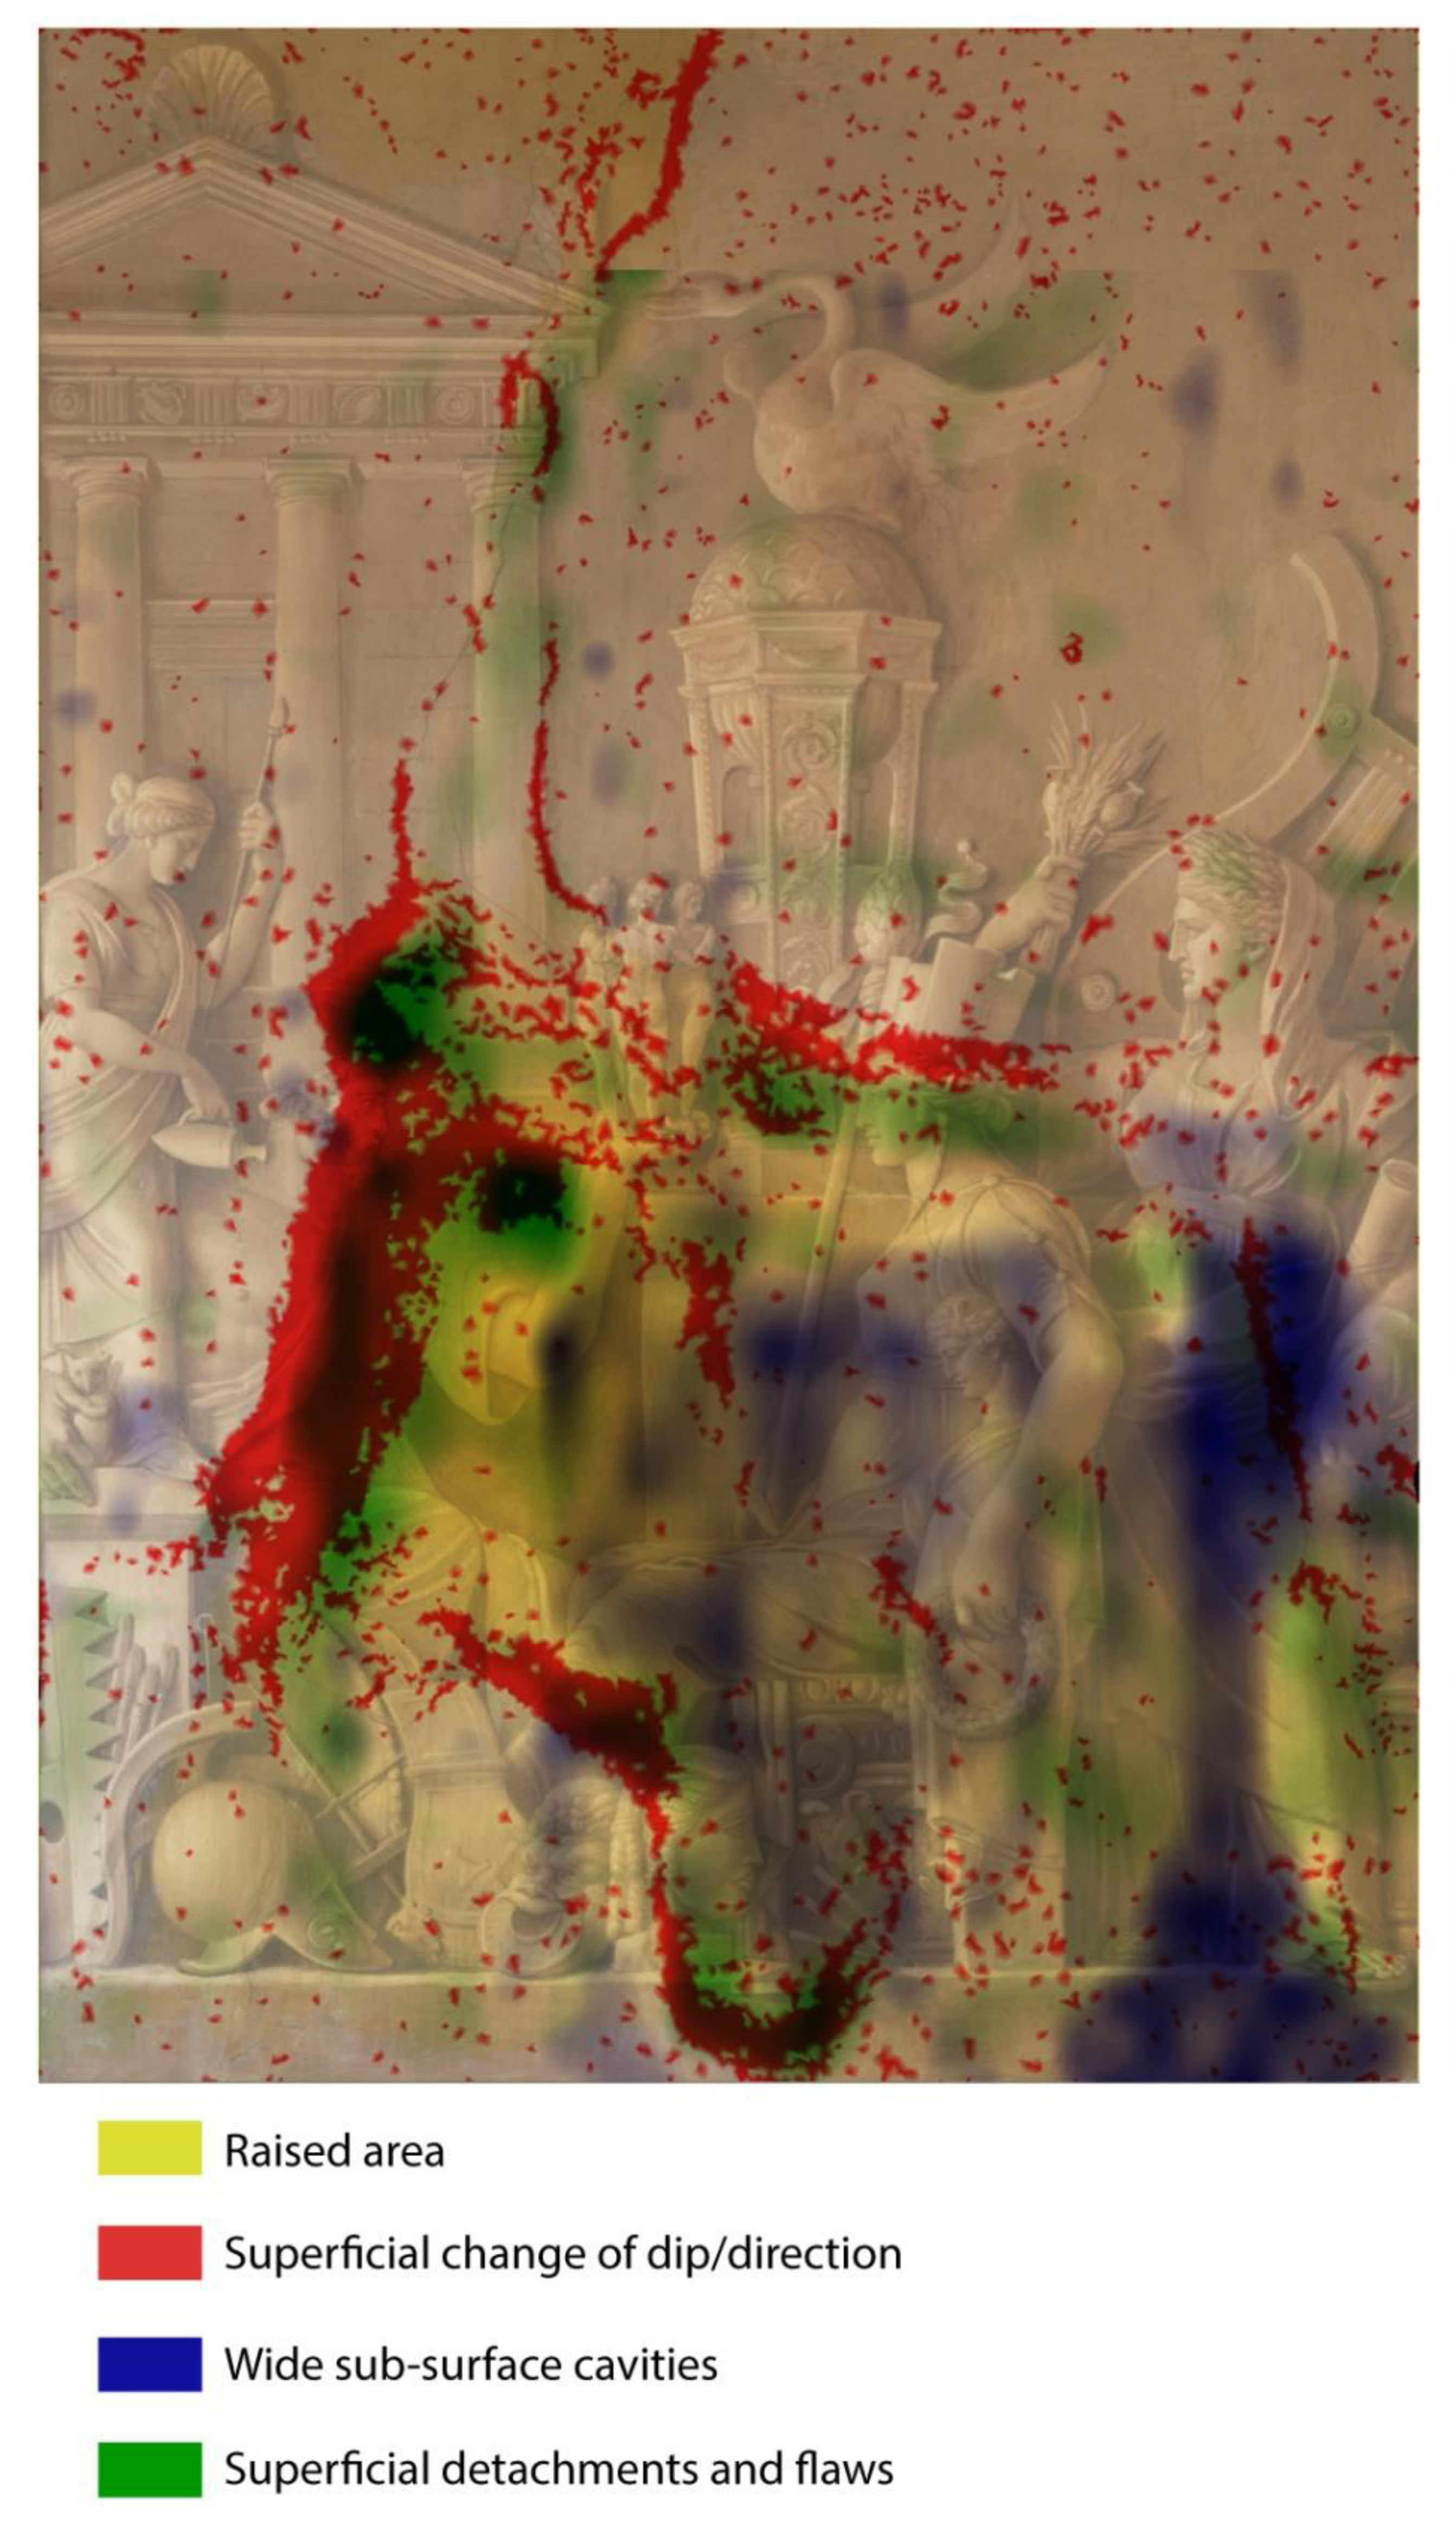
Figure 14: the layers appear superimposed (through a blending multiply graphical mode), to visually correlate the deformation of the surface, customized in yellow and red color, to different types of pathologies occurring beneath the surface, customized in blue and green color. The use of different colors to customize the layers allows them to be still discernible, in order to be retrieved on request and be singularly analyzed.
The resulting multi-layer map is intended to help the global reading and the thorough knowledge of the investigated cultural asset and its conservation state, using a user-friendly terminology for the CH operators. In Figure 14, the wide sub-surface cavity (blue) perfectly superposes the (yellow) squared plateau with intermediate elevation values in the low central part of the ROI. Furthermore, the superficial detachments (green) are clearly placed in the surroundings of areas with major changes of dip/direction (red) and with the highest elevation values (deep yellow). Thus, as in a cause-and-effect relationship, it is highly probable that structural elements inside the wall have induced the creation of detachments, superficial deformations and fractures generating the current status.

4. Discussion and Conclusions

The work presented in this paper was carried out within the framework of the ADAMO Project (Technologies of Analysis, DIAgnostics and MOnitoring for the preservation and restoration of cultural heritage), part of the actions of the Technological District for Cultural Heritage of the Lazio Region.
The experimental campaign was performed at the site of Chigi Palace in Ariccia, specifically in the Ariosto Room, for identifying the causes of deterioration of the monochrome mural painting Graecia Vetus by Giuseppe Cades (1788) and of the supporting wall structure. The investigation techniques encompassed photogrammetric survey and non-destructive acoustic diagnostics, in particular, the innovative contactless Audio Frequency Acoustic Imaging (AF-AI) supported by the more traditional Acoustic Tomography (AT) with impact hammer. The results were individually analysed and interpreted, and successively integrated in order to make them readable to the operators in charge of the protection and the management of cultural heritage.
We can note that the relevant variation of the pulse velocity, obtained from the AT, is quite coherent with discontinuities and a very heterogeneous inner structure of the masonry, although only a qualitative exam can be made for this case study. Considering this evidence together with the AF-AI results, denoting sub-surface alterations, and the DEM from the photogrammetry, revealing consistent surface deformations in the same areas, we can state that all the results confirm that the main critical area is located in the lower right half of the ROI.
To the best of our knowledge, some possible hypotheses might take into account the presence of a hidden chimney, or a system of pipes, or a sort of masonry stove built inside the wall. This type of stove [27] uses the convection of the hot air inside a labyrinth of cavities, a system of channels and baffles that stores for a long time the heat within the masonry. Unfortunately, no indication has been found in historical documents and drawings related to the palace; only the twentieth-century photos attest to the presence of an external heater connected to the stovepipe opening, while similar cases in antique buildings have been found in the literature.
Beside these initial findings, the major result of the present paper is the implications of the multi-layer map that is the output of an articulated image processing for obtaining the data integration. Specifically, a data fusion of heterogeneous datasets was accomplished according to a seven steps procedure encompassing: 1. the harmonisation of the datasets; 2. the interpretation of the 3D and 2D images; 3. the extrapolation of the main features; 4. the discrimination of the different features; 5. the translation of the significant features in categories of damage; 6. the alignment of the images; 7. the composition of a unique multi-layer map.
In this workflow, the raw data displayed as independent images are processed into the intermediate data, still treated as images. These last contain only the main features, discriminated according to the peculiar significance criteria of each methodology, that constitute different layers associated with specific categories of damage. Thus, the superposition of these layers actually represents the map where all these details converge. In this case study, the composed map clearly evidences that the surface deformations are correlated with, and are likely the effect of, the presence of sub-surface anomalies. Thus, the pattern characterising the surface, impairing in some parts the integrity of the monochrome painting, cannot be understood and treated without considering the causes of the decay process occurring in the underlying mural structure. Under this point of view, further investigations would be very interesting in order to definitely assess the actual state of conservation of the wall.
The approach proposed in this work for integrating different datasets represents a first attempt to meet the increasing need in the CH field of gathering information from different sources and elaborate them into a unique frame. This is an issue of growing importance among this scientific community, generating a number of tools and platforms suitable for similar tasks. Nevertheless, the wide variety of scientific methods for CH applications requires a tool capable of manipulating heterogeneous datasets (both synchronic and diachronic), and of managing a great amount of information in a user-friendly environment. The proposed procedure effectively guarantees access to the integrated information, offering the possibility to understand the correlation between the causes and the effects of a decay process, as well as the retrieval of the single analysis in order to deepen one specific aspect.
At present, further improvements are under study. In particular, one fundamental question regards the choice of working with numerical data or with pixels in the image superposition, as well as the number of images that can be effectively superposed without losing the readability of the final map. The intermediate images, after the extraction of the main features applying the threshold filtering, could be further simplified in the form of binary images. The last aspect, but surely not the least important, regards the future implementation of a proper code to automatically perform some steps of the integration procedure.

Author Contributions

Conceptualization, P.C.; methodology, P.C., S.D.S. and A.C.; investigation, P.C., S.D.S., A.C. and A.T.; resources, F.P.; data curation, P.C., S.D.S. and A.C.; writing—original draft preparation, P.C., S.D.S. and A.C.; writing—review and editing, P.C., S.D.S., A.C. and A.T.; funding acquisition, P.C. All authors have read and agreed to the published version of the manuscript.

Funding

This research was funded by LAZIO REGION under the Project ADAMO n. B86C18001220002 of the Excellence Centre at the Lazio Technological District for Cultural Heritage (DTC).

Data Availability Statement

Data are available in a publicly accessible repository. The data presented in this study are openly available in Zenodo repository at doi https://doi.org/10.5281/zenodo.7377683, reference number 7377683.

Acknowledgments

We are grateful to Roberta Fantoni, responsible for the division ENEA FSN-TECFIS, as coordinator of the ADAMO Project. Furthermore, the authors wish to thank Giovan Battista Fidanza (University of Rome 2 Tor Vergata) and Mauro Missori (National Research Council), who greatly contributed to the management of the research groups during the entire measurement campaign, and the whole team at Chigi Palace in Ariccia. The authors wish to further thank Ing. Maria Luisa Mongelli for assisting in the interpretation of data and Marco Puccini (ENEA TERIN-ICT) for the managing of the Itacha platform.

Conflicts of Interest

The authors declare no conflict of interest.

References

  1. Binda, L.; Zanzi, L.; Santiago, J.R.; Knupfer, B.; Johansson, B.; Modena, C.; Da Porto, F.; Marchisio, M.; Gravina, F.; Falci, M.; et al. Onsiteformasonry Project: On-Site Investigation Techniques for the Structural Evaluation of Historic Masonry Buildings; Köpp, C., Maierhofer, C., Binda, L., Eds.; EUR 21696 EN, Project Report; Office for Official Publications of the European Communities: Luxembourg, 2006; ISBN 92-894-9601-0. Available online: https://op.europa.eu/en/publication-detail/-/publication/f5ad6b4d-a0b5-4d79-888d-2fb1fe962da4/language-en (accessed on 20 October 2022).
  2. Adamopoulos, E.; Rinaudo, F. Close-Range Sensing and Data Fusion for Built Heritage Inspection and Monitoring—A Review. Remote Sens. 2021, 13, 3936. [Google Scholar] [CrossRef]
  3. Ramos, M.M.; Remondino, F. Data fusion in Cultural Heritage—A Review. Int. Arch. Photogramm. Remote Sens. Spat. Inf. Sci. 2015, XL-5/W7, 359–363. [Google Scholar] [CrossRef] [Green Version]
  4. Castanedo, F. A Review of Data Fusion Techniques. Sci. World J. 2013, 2013, 704504. [Google Scholar] [CrossRef] [PubMed]
  5. Shahandashti, S.M.; Razavi, S.N.; Soibelman, L.; Berges, M.; Caldas, C.H.; Brilakis, I.; Teizer, J.; Vela, P.A.; Haas, C.; Garrett, J.; et al. Data Fusion Approaches and Applications for Construction Engineering. J. Constr. Eng. Manag. 2011, 137, 863–869. Available online: https://www.researchgate.net/publication/264625988_Data_Fusion_Approaches_and_Applications_for_Construction_Engineering (accessed on 18 November 2022). [CrossRef]
  6. Oh, T.; Kee, S.H.; Arndt, R.W.; Popovics, J.S.; Zhu, J. Comparison of NDT Methods for Assessment of a Concrete Bridge Deck, undefined. J. Eng. Mech. 2013, 139, 305–314. [Google Scholar] [CrossRef]
  7. Pashoutani, S.; Zhu, J.; Sim, C.; Won, K.; Mazzeo, B.A.; Guthrie, W.S. Multi-sensor data collection and fusion using autoencoders in condition evaluation of concrete bridge decks. J. Infrastruct. Preserv. Resil. 2021, 2, 18. [Google Scholar] [CrossRef]
  8. Excellence Centre of the Technological District for Cultural Heritage of the Lazio Region (DTC Lazio). Available online: https://dtclazio.it (accessed on 20 October 2022).
  9. ADAMO Project. Available online: http://progettoadamo.enea.it (accessed on 20 October 2022).
  10. Calicchia, P.; Cannelli, G.B. Detecting and mapping detachments in mural paintings by non-invasive acoustic techniques: Measurements in antique sites in Rome and Florence. J. Cult. Herit. 2005, 6, 115–124. [Google Scholar] [CrossRef]
  11. Calicchia, P.; De Simone, S.; Di Marcoberardino, L.; Verardi, P. Exploring the potential of a frequency resolved acoustic imaging technique in panel painting diagnostics. Measurement 2018, 118, 320–329. [Google Scholar] [CrossRef]
  12. Palace Chigi Ariccia. Available online: https://www.palazzochigiariccia.it (accessed on 20 October 2022).
  13. Petrucci, D.; Petrucci, F. Donazioni, Recuperi e Restauri Palazzo Chigi in Ariccia: 2009–2019; di Ariccia, C., Ed.; Publisher Arti Grafiche Ariccia: Ariccia, Italy, 2019. [Google Scholar]
  14. Petrucci, D.; Petrucci, F. The Chigi Palace in Ariccia. Illustrated Guide; Publisher Arti Grafiche Ariccia: Ariccia, Italy, 2019. [Google Scholar]
  15. Petrucci, F. Carlo Lambardi, architetto di Palazzo Savelli (poi Chigi) ad Ariccia. Castelli Rom. 2017, LVII, 35–40. [Google Scholar]
  16. Gobbi, M.; Jatta, B. I disegni di Bernini e Della sua Scuola Nella Biblioteca Apostolica Vaticana-Drawings by Bernini and His School at the Vatican Apostolic Library; Biblioteca Apostolica Vaticana: Città del Vaticano, Vatican City, 2015; pp. 479–501. [Google Scholar]
  17. Caracciolo, M.T. Giuseppe Cades 1750–1799 et la Rome de son Temps; Arthena: Paris, France, 1992; pp. 79, 310–313. [Google Scholar]
  18. Pierrot-Deseilligny, M.; De Luca, L.; Remondino, F. Automated image-based procedures for accurate artifacts 3D modeling and orthoimage generation. Geoinform. FCE CTU 2011, 6, 291–299. [Google Scholar] [CrossRef]
  19. Proietti, N.; Calicchia, P.; Colao, F.; De Simone, S.; Di Tullio, V.; Luvidi, L.; Prestileo, F.; Romani, M.; Tatì, A. Moisture Damage in Ancient Masonry: A Multidisciplinary Approach for In Situ Diagnostics. Minerals 2021, 11, 406. [Google Scholar] [CrossRef]
  20. Calicchia, P.; Cannelli, G.B. Revealing surface anomalies in structures by in situ measurement of acoustic energy absorption. Appl. Acoust. 2002, 63, 43–59. [Google Scholar] [CrossRef]
  21. Bogert, B.P.; Healy, M.J.R.; Tukey, J.W. The frequency analysis of time series for echoes: Cepstrum, pseudo-autocovariance, cross-cepstrum. In Symposium on Time Series Analysis; Rosenblatt, M., Ed.; Wiley: New York, NY, USA, 1963; pp. 209–243. [Google Scholar]
  22. Kinsler, L.E.; Frey, A.R.; Coppens, A.B.; Sanders, J.V. Fundamentals of Acoustics; Wiley India Pvt. Limited: New Delhi, India, 2009; p. 284. ISBN 0471847895. [Google Scholar]
  23. Italian Standard UNI 10627:1997; Computed Tomography Systems for Structural Investigations. UNI National Organization for Standardization: Italy, 1997.
  24. Cescatti, E.; Rosato, L.; Valluzzi, M.R.; Casarin, F. An Automatic Algorithm for the Execution and Elaboration of Sonic Pulse Velocity Tests in Direct and Tomographic Arrangements. In Structural Analysis of Historical Constructions; Aguilar, R., Torrealva, D., Moreira, S., Pando, M.A., Ramos, L.F., Eds.; RILEM Bookseries, vol 18; Springer: Cham, Switzerland, 2019; pp. 716–724. [Google Scholar] [CrossRef]
  25. Polimeno, M.R.; Roselli, I.; Luprano, V.A.M.; Mongelli, M.; Tatì, A.; De Canio, G. A non-destructive testing methodology for damage assessment of reinforced concrete buildings after seismic events. Eng. Struct. 2018, 163, 122–136. [Google Scholar] [CrossRef]
  26. Binda, L.; Cantini, L.; Fernandes, F.; Saisi, A.; Tedeschi, C.; Zanzi, L. Diagnostic Investigation on the Historical Masonry Structures of A Castle by the complementary use of Non Destructive Techniques 2004. In Proceedings of the 13th International Brick and Block Masonry Conference, Amsterdam, The Netherlands, 4–7 July 2014; Available online: https://www.researchgate.net/publication/237447949 (accessed on 20 October 2022).
  27. Forni, M. Il Comfort Nelle Dimore: Camini e Stufe Tra Cinquecento e Settecento, atti Convegno “Il Legno Brucia: L’Energia Del Fuoco Nel Mondo Naturale e Nella Storia Civile”, 20–21 September 2007 Milano Museo di Storia Naturale, Rivista di Storia Naturale, 2008. Available online: shorturl.at/KNX17 (accessed on 10 October 2022).
Figure 1. (a) Aerial view of Ariccia by Google Earth showing the Chigi Palace from the left side; (b) front view of the Chigi Palace from Court Square (Piazza di Corte).
Heritage 05 00195 g001
Figure 2. (a) Composition scheme of the mural paintings in the Ariosto room, on the Noble floor of the Chigi Palace (plan and axonometry); (b) Details of the surface fractures by visual inspection; (c) Mural painting Graecia Vetus (orthorectified image).
Heritage 05 00195 g002
Figure 3. Scheme of the measure setting on mural painting.
Heritage 05 00195 g003
Figure 4. Geometrical definition of Region of Interest.
Heritage 05 00195 g004
Figure 5. Scheme of the ACEADD instrument with the resulting acoustic images, i.e., a wide-band image plus a set of narrow-band images (a). Picture of the ACEADD instrument during the on-site measurement in front of the painting (b).
Heritage 05 00195 g005
Figure 6. Scheme of the working principle of Sonic Tomography with impact hammer and accelerometer’s positions (a), during onsite measurements (b).
Heritage 05 00195 g006
Figure 7. Digital Elevation Model of the mural painting Graecia Vetus with insertion of the contour lines every millimeter. On the right, the Digital Elevation Model is superimposed to the orthorectified image of the painting.
Heritage 05 00195 g007
Figure 8. Digital Elevation Model (DEM) of the mural painting Graecia Vetus, detail of the most critical area.
Heritage 05 00195 g008
Figure 9. Dip and direction model of the mural painting Graecia Vetus. On the right superimposed on the orthorectified image.
Heritage 05 00195 g009
Figure 10. (a) Integrated Acoustic Image. Frequency Resolved Acoustic Images at the most representative frequency bands: (b) 1000 Hz, (c) 6300 Hz, (d) 10,000 Hz.
Heritage 05 00195 g010
Figure 11. Indirect AT (along yellow line 1): tomographic map displaying the relative variation of pulse velocity. Direct AT (along red line 2): profile of the relative variation of pulse velocity along the horizontal axis. In evidence, the portion of the stovepipe opening (red arrow) and the ROI limits.
Heritage 05 00195 g011
Figure 12. The set of images, already interpreted, used for the successive step of data fusion.
Heritage 05 00195 g012
Figure 13. Multi-layer overlapping procedure that, in a general case, can encompass several heterogeneous datasets.
Heritage 05 00195 g013
Figure 14. Multi-layer map of the risk composed by the data fusion of 3D geometrical morphological data and 2D frequency resolved acoustic images.
Heritage 05 00195 g014
Table 1. Characteristics of the datasets composing the multi-layer map.
DatasetThresholdColorMain Feature
Digital Elevation Model50% 1YellowRaised area
Surface dip/direction30% 2RedSuperficial change of slope and direction
FRAI 1000 Hz45% 3BlueWide sub-surface cavities
FRAI 10,000 Hz45% 3GreenSuperficial detachments and flaws
1 The threshold applied to DEM (50%) refers to a range of 8.5–17.0 mm. 2 The threshold applied to Dip and direction map (30%) refers to a range of 30–90°. 3 The threshold applied to FRAI, within a 0–100% scale, discriminates the low–medium damage from the high damage; in the images of Figure 10, it corresponds to the yellow color level.
Publisher’s Note: MDPI stays neutral with regard to jurisdictional claims in published maps and institutional affiliations.

