1. Introduction
Nowadays, a growing awareness about the management of complexity is pushing research towards innovative and holistic approaches to diagnostic methodologies and to conservation/restoration protocols of Cultural Heritage (CH).
In the attempt at mitigating the damage to unique cultural sites of inestimable significance, where built structures host relevant collections of artworks, much attention is being paid to the correlation between the structural integrity of the historical building and the conservation of the artistic assets there present. Often, the stratification of a number of elements, from different historical periods, makes this task very complex, also considering the non-standardized knowledge of many traditional materials [
1].
Accordingly, the integration of different analyses has been widely pursued in many projects aiming at a more accurate knowledge of the cultural assets and of their conservation state.
In recent years, great technological advancements in laser scanning and in photogrammetry have supported the integrated use of image-based methodologies. We speak of data fusion, which assumes a huge potential when multisource scientific data are dealt with, and where the 3D geometric documentation of the cultural asset often represents its base element [
2]. Within this framework, a wide range of investigation purposes require different scales of 3D reconstruction, from landscape topography to small sites reconstruction down to the object scale, employing different sensors, and processing heterogeneous data [
3]. Furthermore, multi-sensor data fusion may be accomplished at different levels (low–medium–high), considering that one may operate with raw data, or may extract and integrate the most significant features from the raw data [
3], in many cases the Principal Component Analysis is included in the image-elaboration process. The integration of already processed data can be better referred to as “information fusion”, and in many applicative fields it is a suitable tool for decision makers [
4]. With significant advancements in similar applicative sectors, such as in civil engineering disciplines, data fusion represents a relevant tool for monitoring complex industrial processes or great infrastructures security. The literature in this field reports a number of approaches and applications [
5], among which the combination of material features information and shape information in visual data fusion optimizes the object recognition in defects analysis. In order to guarantee the accuracy of the output, often used is appropriate image processing, including the identification of rule-based criteria and thresholds, for extracting binary images from image-based inspections before data integration [
6]. The possibility to detect at one time different kinds of defects, such as cracks, may be increased by the integration of many NDT techniques also giving evidence to the cause-and-effect relationship [
7].
Despite the wide variety of applications, some common critical aspects have to be highlighted. Data from image-based methodologies are evidently heterogeneous, and different quantities constitute the indicators of different phenomena, such as the amount of a material or the presence of a defect; thus, before integrating multi-source scientific data, the researchers need to harmonize them. When superposing 2D images on 3D models, the alignment and the spatial resolution play a crucial role. Finally, the amount of data to be processed and saved is extremely important in the data fusion process, in relation to the duration of the analysis, to the memory requirements for data storage, to the final results visualization and to the data archives fruition. In the CH field, a further crucial aspect is the release of a final product, suitable for heritage restorers, conservators and managers in order to navigate the results by means of user-friendly platforms.
The purpose of the present paper is to describe the approach, the measurements and their results for a first attempt to integrate a 3D photogrammetric survey with 2D image-based acoustic diagnostic methodologies, in order to provide a set of simple and intelligible information to the end users. The novelty of this study lies in the integration of 2D maps deriving from two types of sensing data: morphological 3D analyses of the artifact and image-based acoustic methodologies. The 2D morphological maps derive from a digital representation (scalar field) which relates each point of the painting to a physical characteristic of the point itself (e.g., altitude, dip/direction). Consequently, the novelty of this approach derives from the integration of heterogeneous data, diagnostic data and morphological data, harmonized through the use of two-dimensional images.
Recently, in central Italy, the Technological District for Cultural Heritage of the Lazio Region (DTC Lazio) [
8] has been addressing the development and use of innovative technologies for CH tailored to the priorities of the territory. Within this framework, the ADAMO Project (Technologies of Analysis, DIAgnostics and MOnitoring for the preservation and restoration of cultural heritage) [
9] supported the dissemination of innovative non-destructive technologies to end users, conservation/restoration organizations and heritage owners/managers, realizing wide investigation campaigns and demo events in a number of important heritage sites.
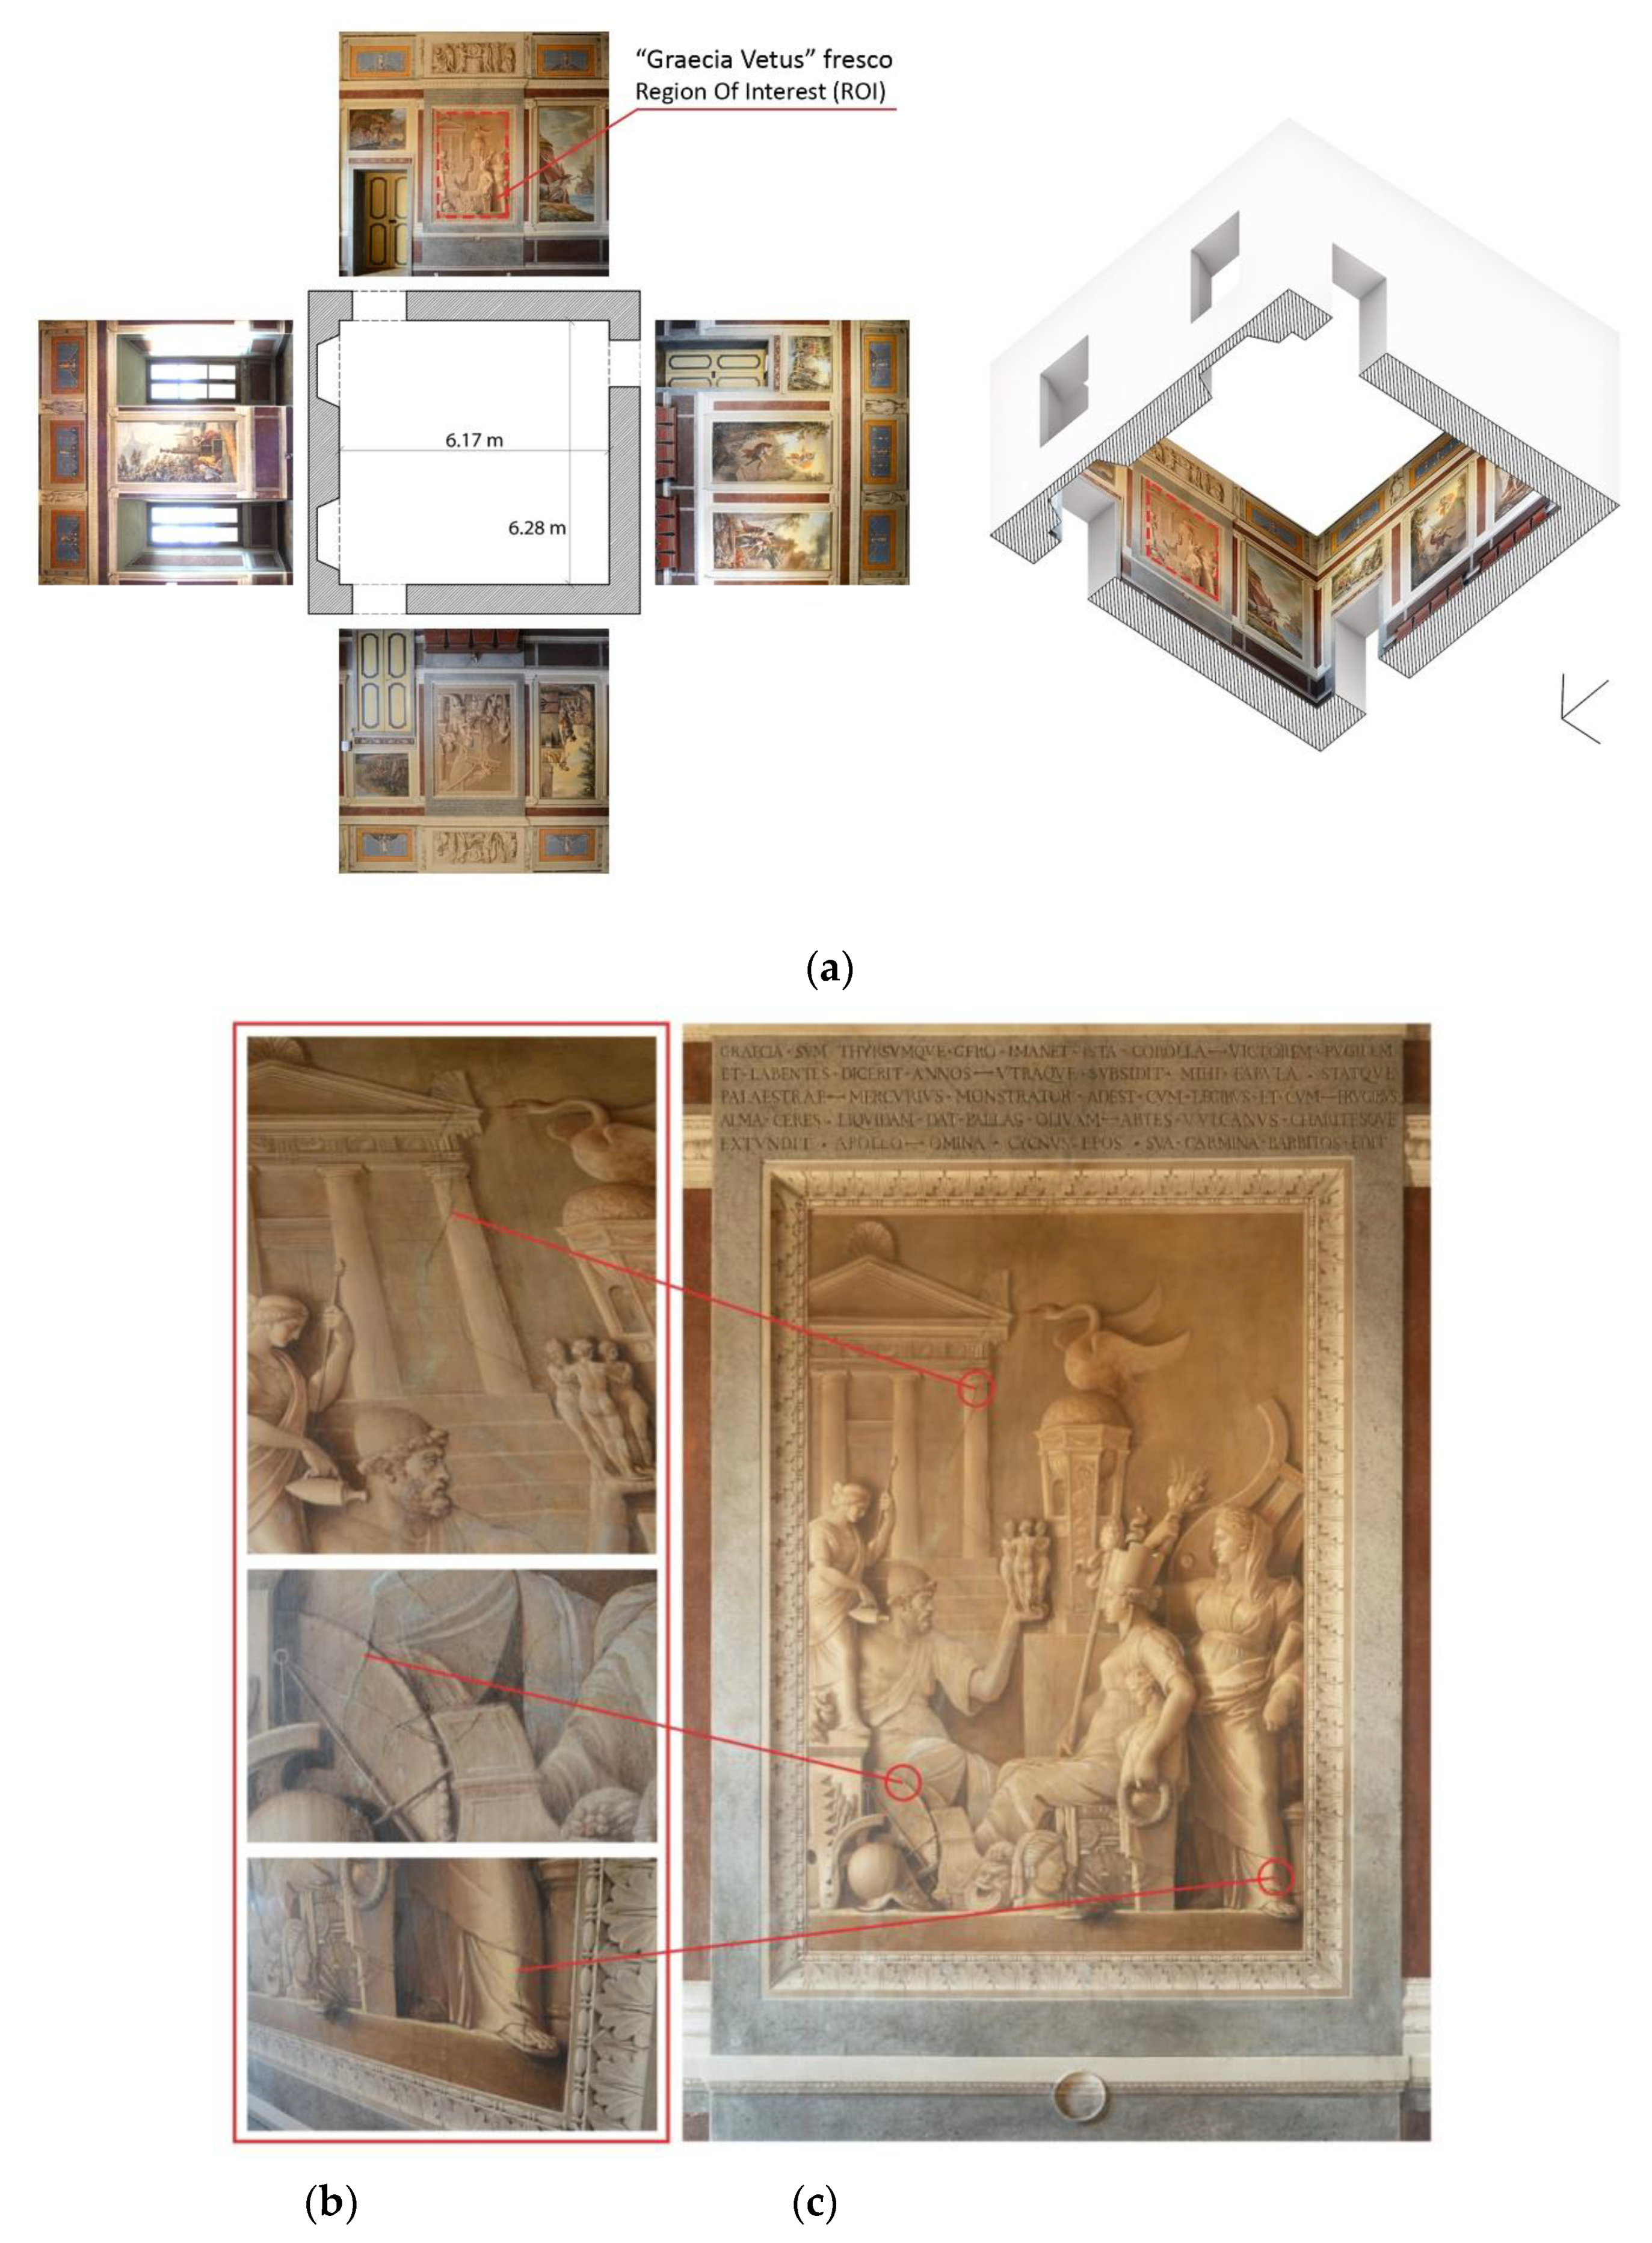
The Chigi Palace of Ariccia, a village near Rome, was one of the project sites, with its wonderful Baroque collections. At the noble floor of the palace, in the Ariosto Room, the monochrome mural painting Graecia Vetus reveals an uneven crack pattern, impairing the integrity of the painted surface, not present on the other side walls in the same room. In the present study, the dataset obtained from the photogrammetric survey, with particular reference to the region containing the Graecia Vetus painting, formed the basis of a morphological analysis of the pictorial surface. The processing of an orthomosaic image obtained from photogrammetry allows the information of other acoustic methods to be superimposed without distortion problems and with millimeter precision.
A contactless acoustic technique, Frequency Resolved Acoustic Imaging (FR-AI) in the audio frequency interval, was employed to investigate the structural damage of the artwork beneath the visible surface. Thus, the authors tried to correlate the deformation of the uppermost surface to the potential sub-surface damage. In recent years, this technique has been successfully applied by the authors to study the conservation state of antique paintings, from frescoes to glazed ceramic tile panels and wood panel paintings [
10,
11]. The AF-AI technique adopts the acoustic energy absorption coefficient as an indicator for this kind of decay processes; a set of 2D Acoustic Images, each one in a specific frequency interval, provides information about different causes of decay concurring to the overall conservation state of the artwork. Some features in the acoustic images are related to the substrate’s integrity (low frequency images), other ones to the surface’s conservation state (high frequency images). The acoustic multi-frequency analysis on the
Graecia Vetus showed interesting features likely associated with the masonry structure at the lower audio frequency interval, and detached areas at the higher frequency intervals correlated to the visible crack pattern. For a better interpretation of the data, the inner structure of the masonry was also investigated by using the Acoustic Tomography (AT), considered the most appropriate among the available technologies within the ADAMO project, to give complementary information. Indeed, the AT is a well-assessed method and widely employed to detect the presence of hidden bulk discontinuities inside different building materials, such as cracks or dis-homogeneities that produce anomalous acoustic or mechanical wave propagation velocity [
1].
The following paragraphs present some details of the case study, a brief description of the techniques, the experimental results obtained on the Graecia Vetus and a discussion of the data integration process. The main findings reveal a potential relationship between the surface layer of the painting and the structural characteristics of the underlying masonry structure. This helps to formulate a reliable hypothesis explaining the current conservation state of the painting.
3. Results
For a better understanding of the conservation state of the painting, the following paragraphs will report the results of the different techniques and will discuss the data fusion procedure adopted in this case study. AF-AI and the AT measurements were accomplished during the same days at the end of March 2019; photogrammetric survey and further AT measurements were conducted in December 2020. Stable environmental conditions characterized the two experimental campaigns, with room temperature (13 ± 1) °C, and relative humidity ranging within 46% and 58% (±1% of uncertainty) detected near the investigated surface.
3.1. Photogrammetric Analysis
Through the functions of the open-source software Cloud Compare, the dense cloud of the ROI was geometrically analyzed. A Digital Elevation Model was elaborated in order to visualize the standard deviation from the best fitting plane of the surface.
Figure 7 shows how the central part of the painting could be affected by a discontinuity, a case that would suggest the presence of a detachment mechanism or a subsequent restorative intervention on the work. For a better visualization of the surface morphology, a map of the contour lines has been elaborated in order to better represent how many millimeters the observed variation corresponds.
This method of visualization is particularly useful to highlight, with a low-cost method, the areas that probably present a detachment or delamination mechanism. Like the most common image-based techniques, it should constitute a low-cost non-invasive investigation preparatory to diagnostics carried out with specialized methods. Moreover, considering the resolution of the image, it is possible to analyze and visualize the details of the painting through a precise scale representation, as shown in
Figure 8.
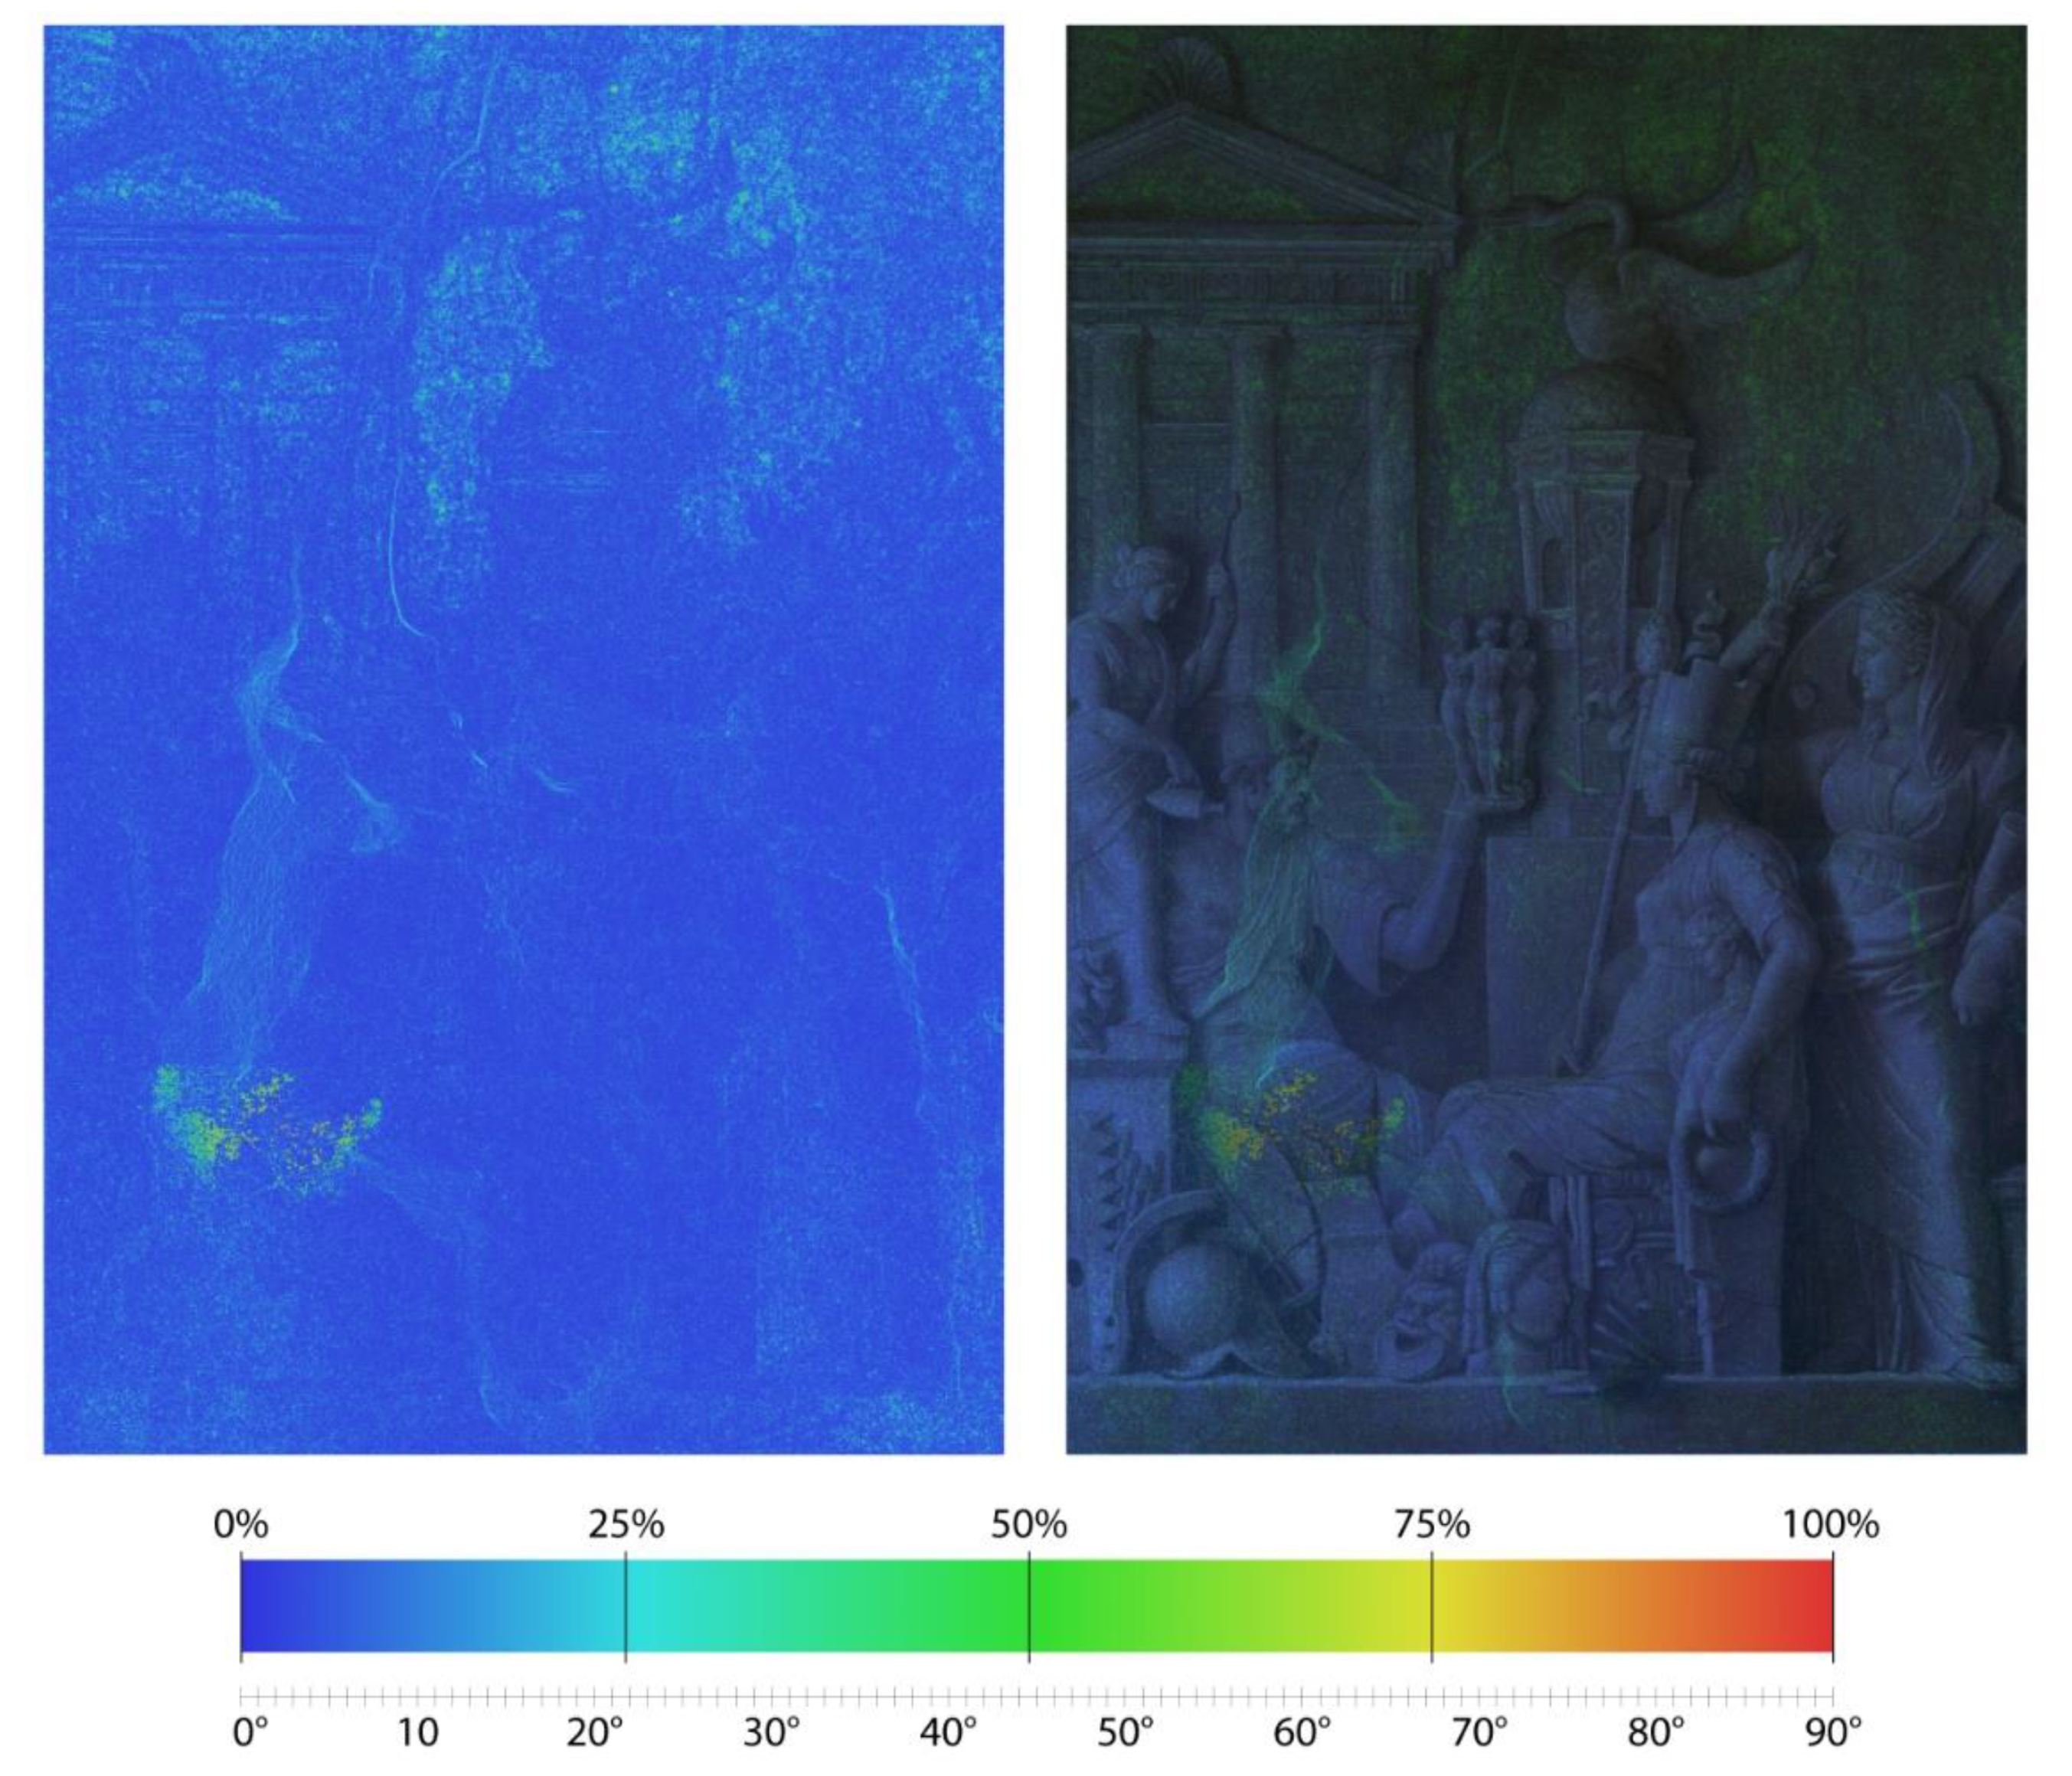
The analysis of the normals calculated for each point (elaborated with the software Cloud Compare) allows one to view the variation linked to the dip and the direction of each point referred to a nearby area. In
Figure 9, it is possible to recognize that the central part of the artwork is characterized by a raised area (almost rectangular); the slope analysis highlights the contours allowing to better identify the damaged areas. These areas of the painting, in fact, present significant variations in terms of slope and direction with respect to the average circular plane that best fit the neighbor points in the radius of 3 mm.
Figure 9 shows, also, that in the upper part of the painting, the surface is characterized by a more relevant roughness. Moreover, the figure reveals a surface breaking mechanism that affects the central part of the painting and rises from the center to the upper edge of the composition.
3.2. Acoustic Images of the Graecia Vetus
The area of analysis (1.6 m × 2.1 m) covers almost the whole surface of the Graecia Vetus, with 1419 points of measurements at 5 cm distance from one another, at a height 1.33 m from the ground. Two configurations of the scan unit were used in order to cover the whole extension in two parts, the lower half (from height 1.33 m to 2.43 m) and the higher half (from height 2.33 m to 3.43 m), with a little portion of superposition.
Figure 10 shows the results obtained by composing the ABS% maps on the orthorectified image of the painting, derived by photogrammetric survey. Specifically,
Figure 10a reports the broadband image (namely, IAI image) related to the entire frequency band (500–12,000 Hz) used in this specific measurement, thus providing an overall view of different critical zones and decay processes. The color levels ranging from yellow to dark red (45–100%) evidence the most critical areas, characterized by the presence of detachments and other sub-surface cavities, mainly distributed in the lower half of the painting and partially localized in the proximity of visible cracks. A better conservation state clearly characterizes the upper half, over the heads of the figures. Finally, in the center at the bottom of the painting, a defined area appears near the stovepipe opening. A great number of acoustically reacting spots are distributed over the entire surface, suggesting a very heterogeneous inner structure of the wall.
A selection of the FRAI images in the most relevant frequency bands are shown in
Figure 10b–d, providing many other details that emerge at different frequency values. The most reliable FRAI images, in terms of best obtainable uncertainty, were found between 1000 Hz and 10,000 Hz. Indeed, in these frequency bands, the relative uncertainty evaluated through multiple repetitions on a restricted number of points was comprised in 6–16%.
At the lower frequency band shown in
Figure 10b, 1000 Hz, a wide and regular red area evidently appears in the lower half and at the center-right part of the painting, suggesting the presence of an important sub-surface cavity. This last might be connected to the stovepipe opening, considering the proximity of the two. At the medium and high frequency bands, 6300 Hz in
Figure 10c and 10,000 Hz in
Figure 10d, some relevant detachments appear mainly at the crossing points of important cracks, or along them. At the bottom, a very regular zone clearly emerges in the central part, suggesting the presence of a well-defined cavity with the same extension of the circular stovepipe opening; considering that high resonance frequency values depend on thin superficial layers, this little and central cavity probably results as being more superficial than the rectangular one in
Figure 10b.
3.3. Masonry Inspection through Acoustic Tomography
The AT tests were performed in the lower part of the
Graecia Vetus, along a horizontal axis identified, in
Figure 11, with the yellow line 1, the indirect AT measurement, and with the red line 2, the direct AT measurement, respectively. The two lines are geometrically superimposed and indicate the axis along which the analyzed points are distributed. The extension of the first dataset covers 2.1 m, while the second dataset extends over almost the entire wall, from the door jamb for an extension of 3.6 m. The thickness of the wall is 1 m; the value was derived from the historical plans of the building and verified on site through the direct measure across the light of the door connecting the two rooms.
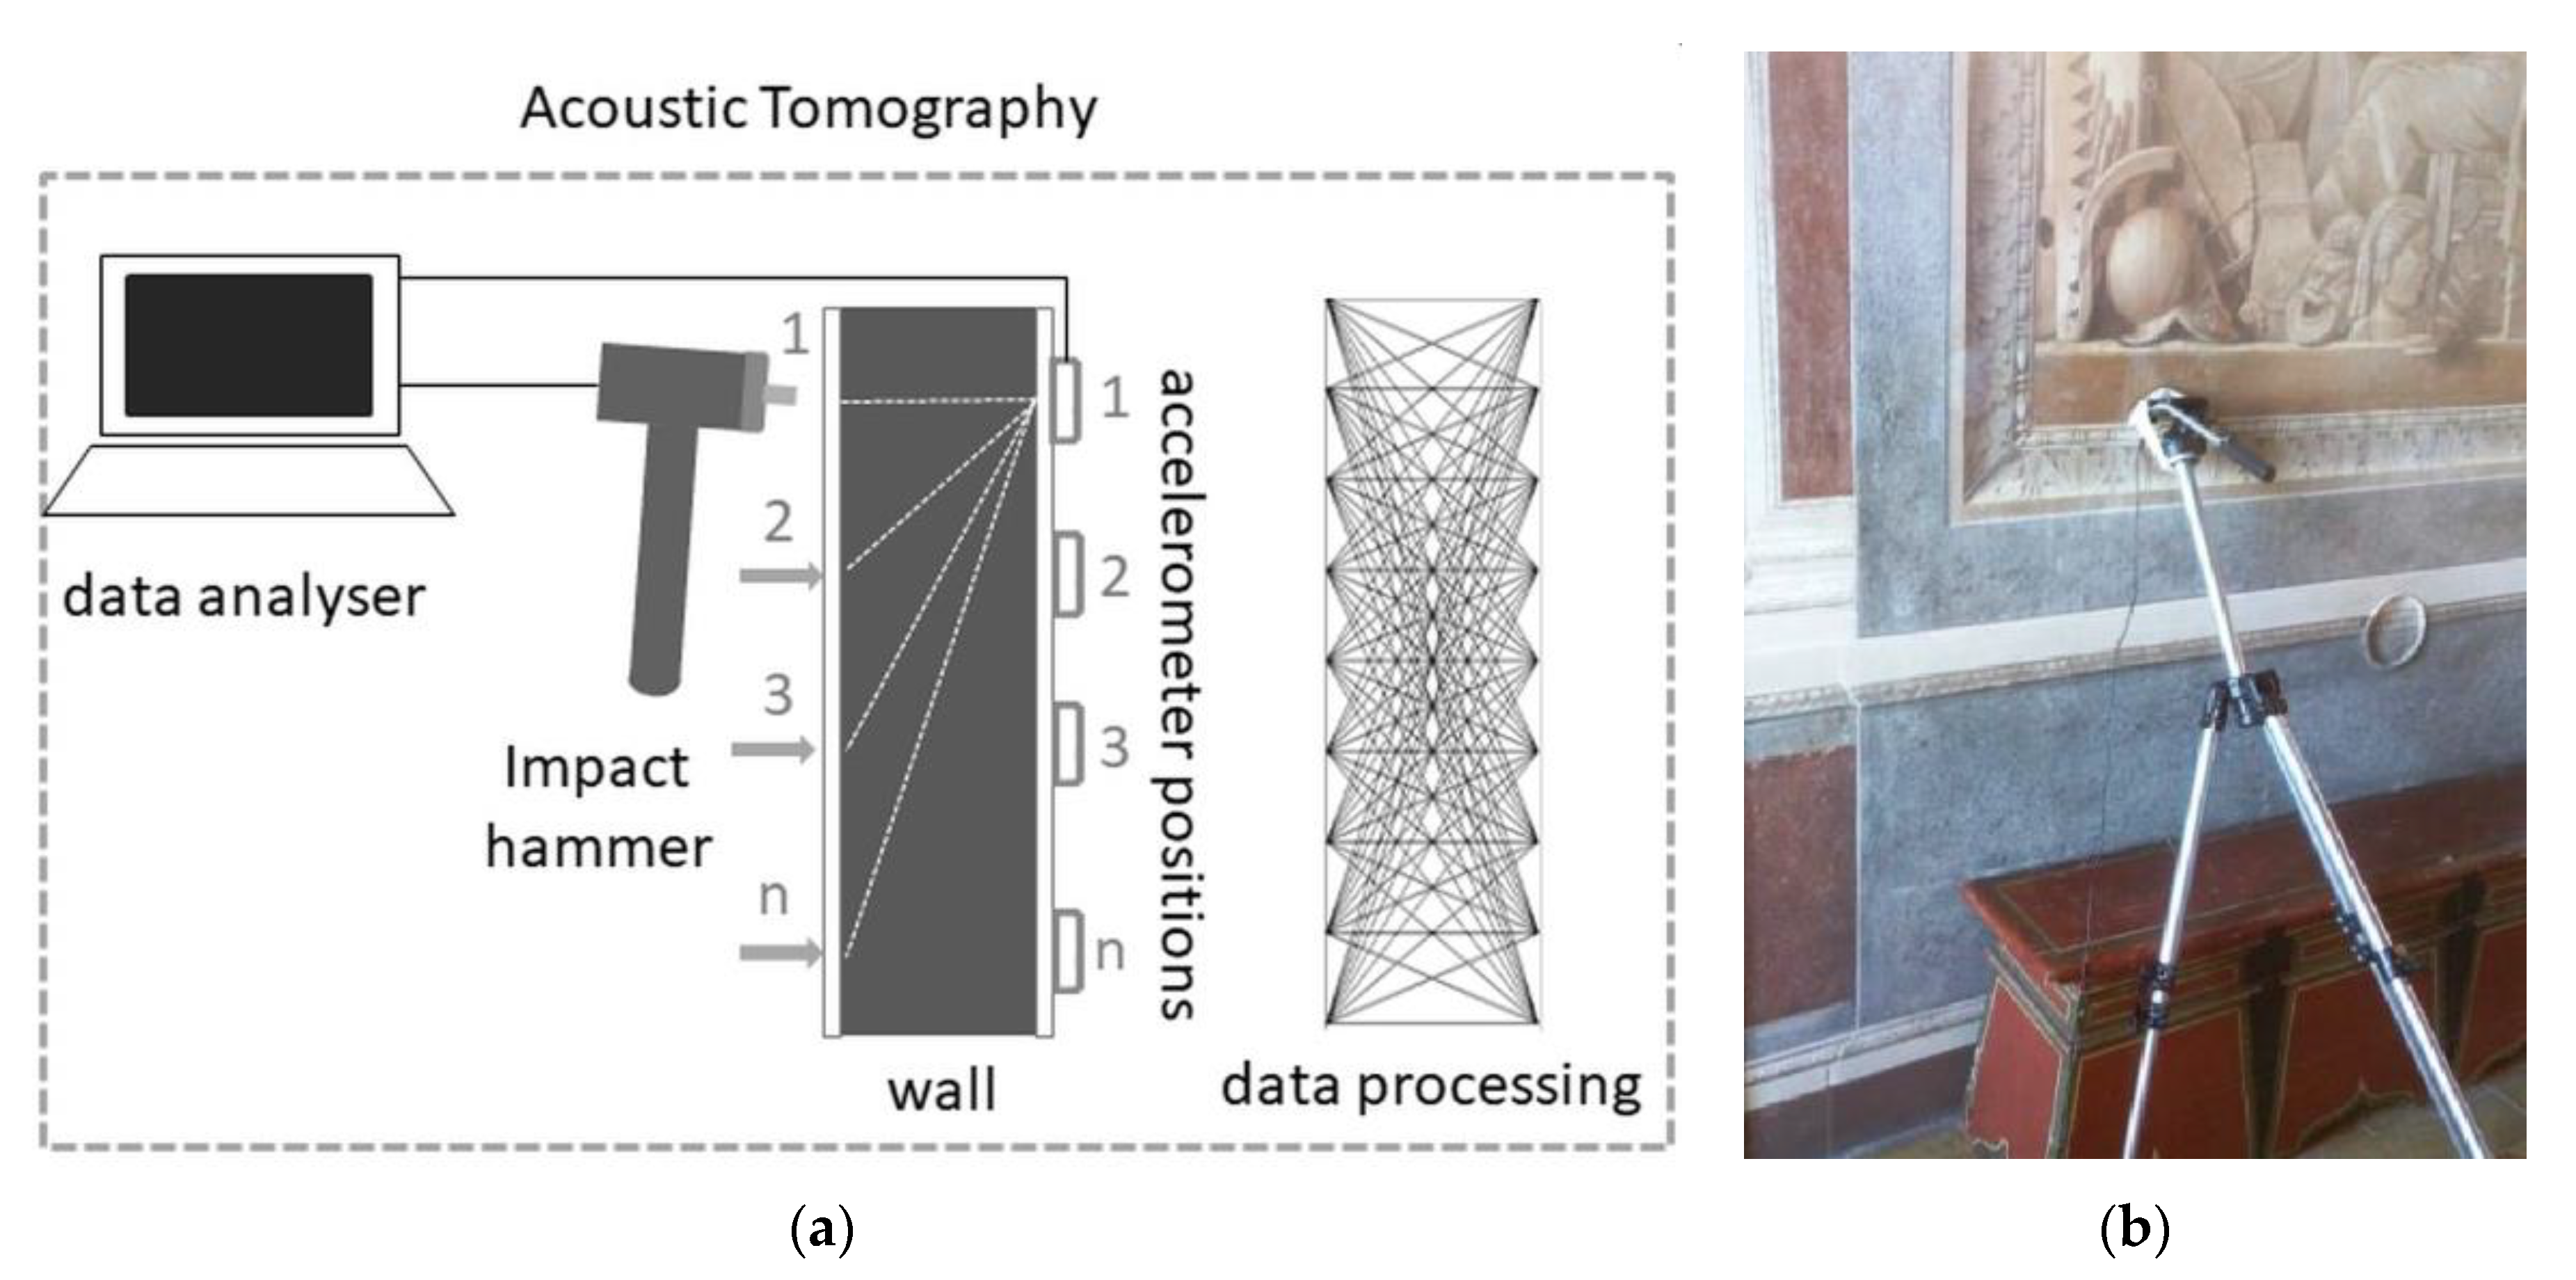
The acquisition system controlling the equipment and the impact hammer were positioned on the Studio of Prince Mario side, while the accelerometer was placed on the other side of the wall, in the Ariosto room, held by a tripod at height 1.4 m from the ground, as shown in
Figure 6b. The impulse was generated by beating on the leather-covered wall, while the measurement points were aligned along the horizontal axis.
The leather covering in the Studio was present on the entire investigated area, and for its high historical/artistic value, it was not possible to detach small areas to make the measure directly on the wall. We verified that, for each measuring point, the same conditions were present: the adhesion of the leather on the wall, the thickness of the material or the presence of glue. Direct preliminary tests of AT were carried out on areas where coverage was only partially present to assess the effect that the presence of the covering could have on the shape and strength of the signal measured by the accelerometer. The analysis confirms that the covering has a signal filtering effect for frequencies above 300 Hz, reducing the main peak intensity by about 40%. Although an attenuation is present, the main structures of the spectrum are well defined and the obtained accelerometer signal is well shaped.
The indirect AT was applied to a horizontal section of the wall, whose thickness is 1 m, separating the Ariosto room from the Studio of Prince Mario. The 64 measurements resulted from the combination of 8 impact points and 8 accelerometer positions, 0.3 m distant from one another. The grayscale tomography map described in
Figure 11 was reconstructed through the data-processing software, previously described. The value of the maximum apparent velocity measured inside the masonry is 620 m/s and the distribution of the relative variation suggests the presence of discontinuities, together with a very heterogeneous structure known as sack masonry typical of the building’s construction technique of the same period. These findings are compatible with other works that can be found in the literature [
26].
In addition, a percentage variation between 60% and 70% in the central part of the masonry suggests the presence of a well-defined cavity, mainly extended to the right of the circular stovepipe opening.
Furthermore, direct AT tests were performed along the red line 2, using 13 measurement points covering the entire wall on which the
Graecia Vetus is located. In
Figure 11, the graph of the relative velocity estimated on the maximum measured value (point 13 at 3.9 m) is shown, and the area of the ROI and the point corresponding to the stovepipe opening are marked. The maximum value of the apparent pulse velocity is about 890 m/s, at the right lateral zone, while the minimum value of about 120 m/s is reached in the central area, with a reduction of about 80%. Such a high variation in the relative percentage confirms the inner heterogeneity of the wall and the presence of significant cavities.
The difficulty of interpretation of the results in the case of inhomogeneous materials like masonry was always known and these results were clearly interpreted as qualitative information rather than actual quantitative values.
3.4. Data Interpretation and Integration
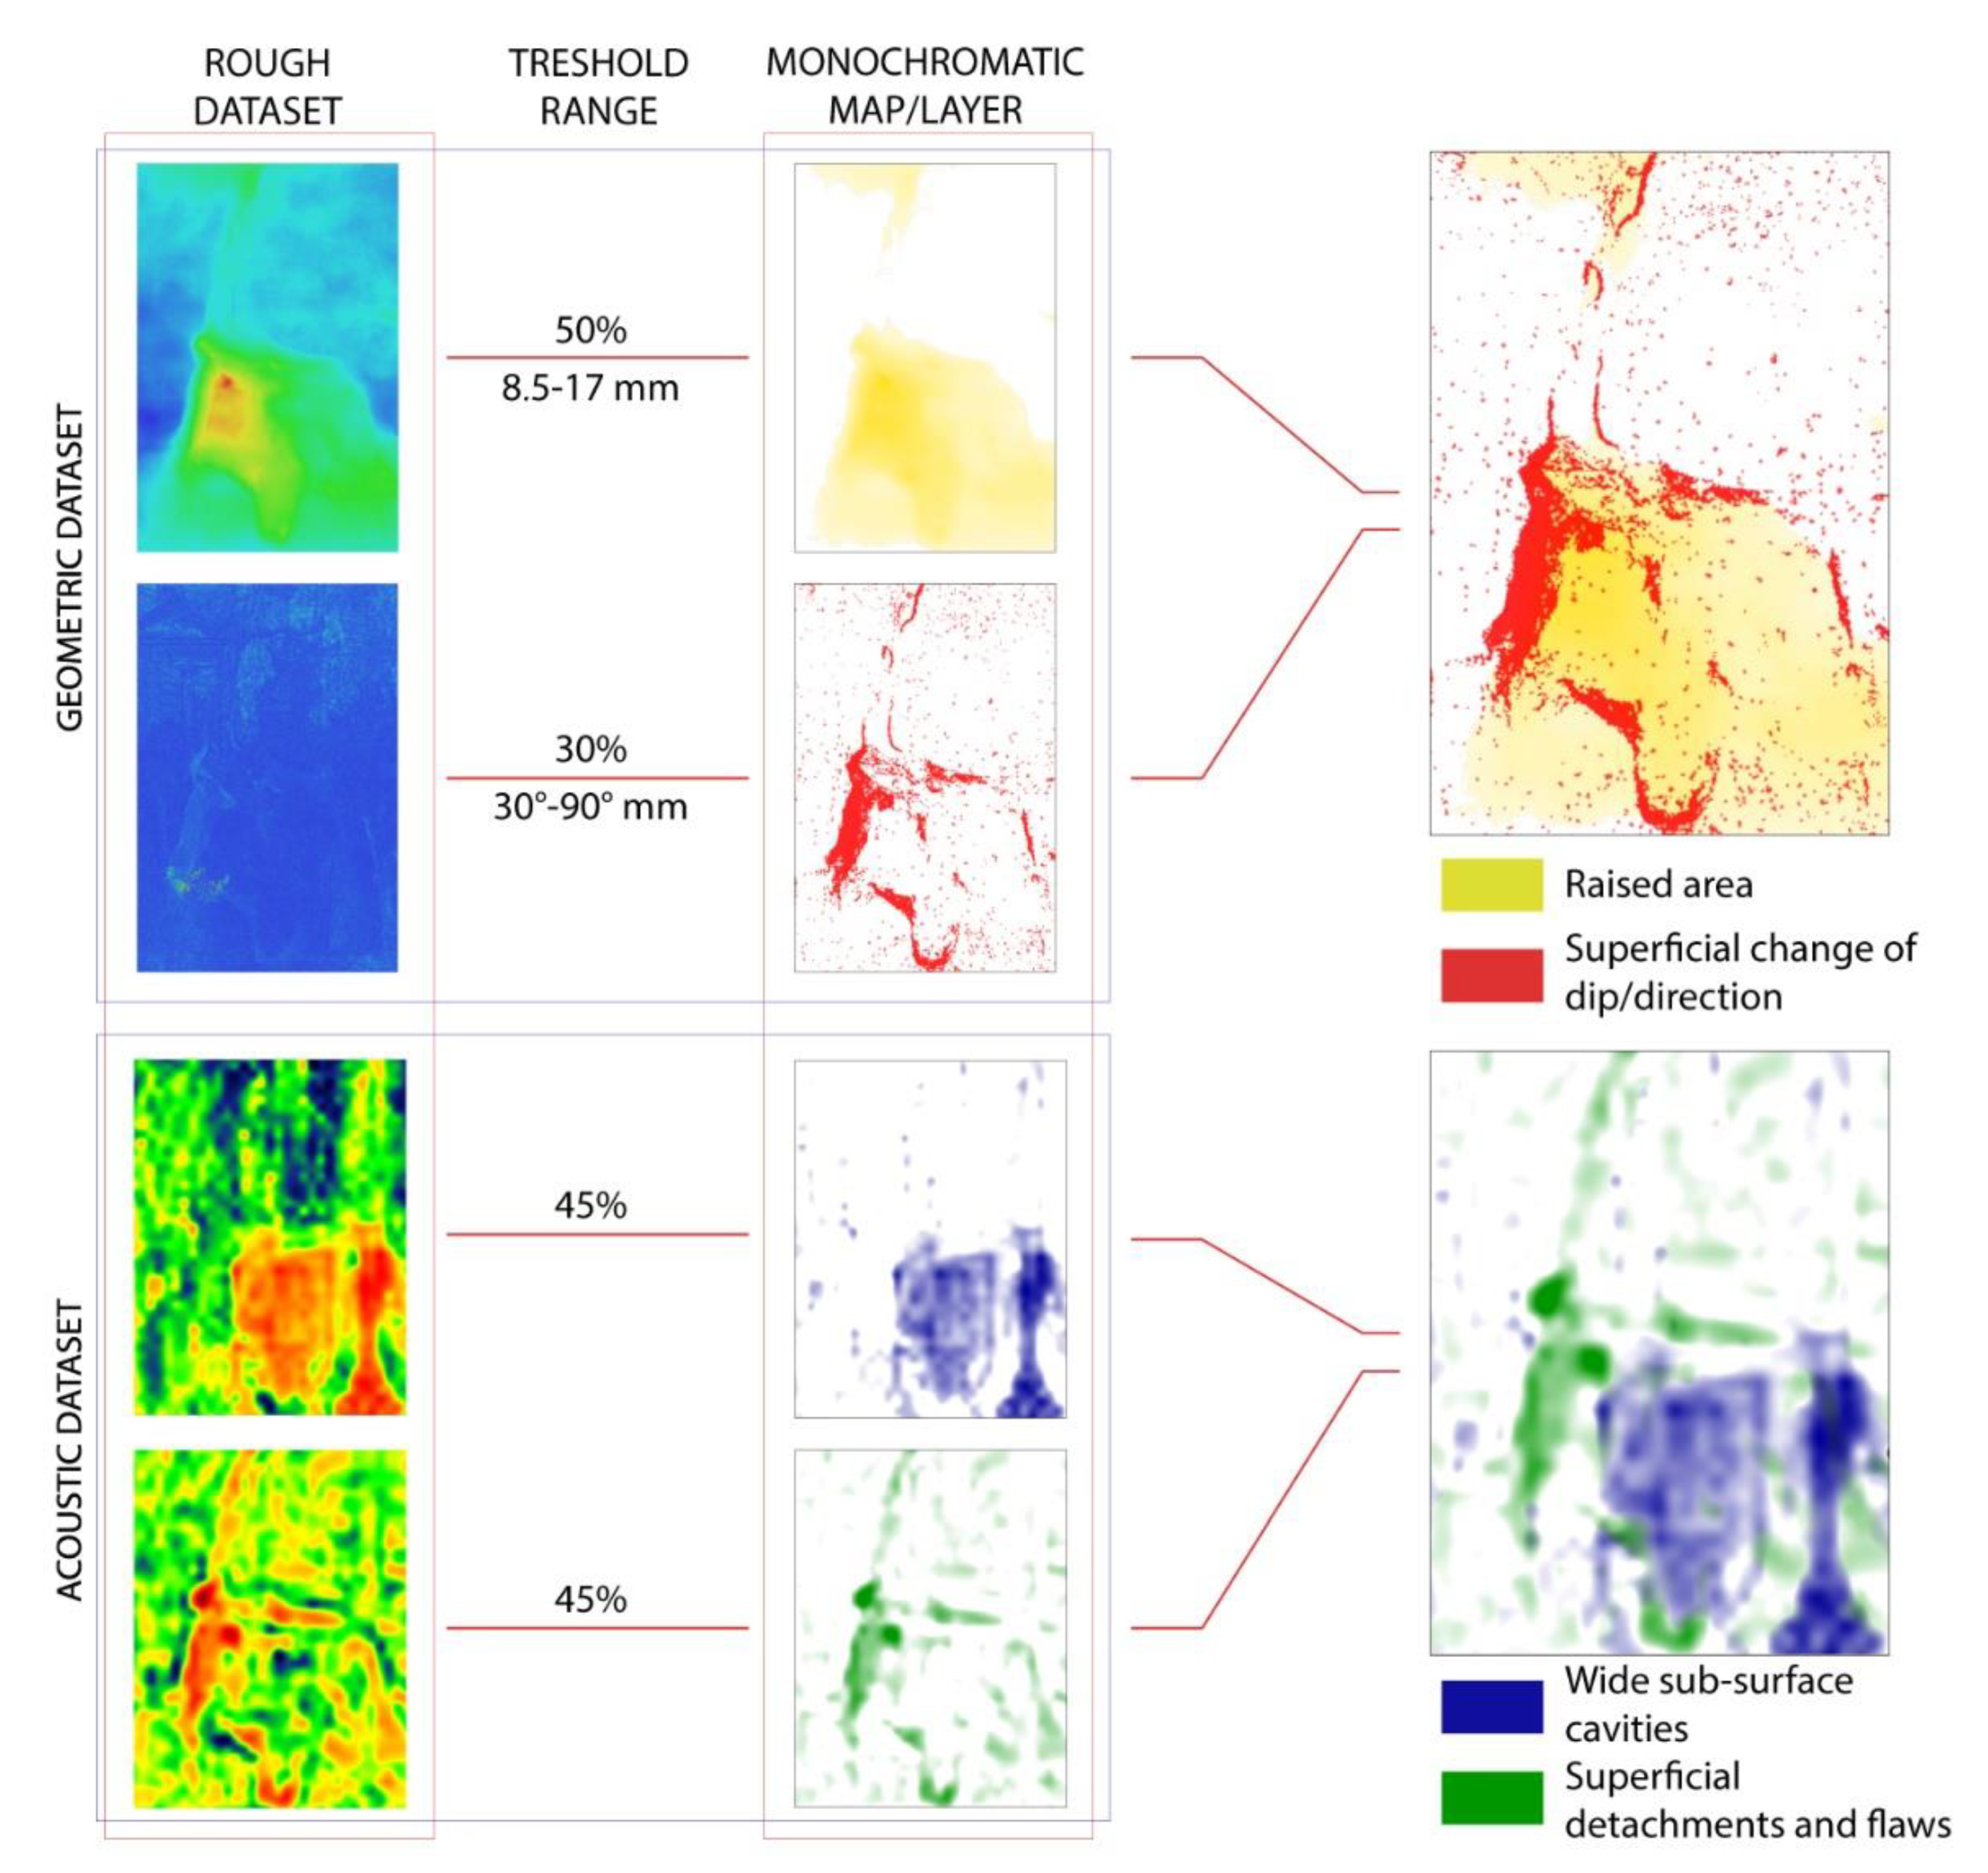
The last part of the study, after the insight into the results of each individual methodology, faced the integration of them all. The AT results were used to support the findings of the AF-AI since the datasets are related to two different orthogonal planes. The more effective data fusion regarded the 3D geometrical relief and the 2D acoustic images in two frequency bands, 1000 Hz and 10,000 Hz, from which specific features could be well identified and extrapolated.
The data fusion procedure, adopted in this study, encompasses a number of steps:
the harmonization of the datasets, in order to represent all the different physical quantities as variation percentage with respect to a reference element (a point, a plane, an angle, etc.) and with the same spatial resolution in the plane;
the interpretation of the single images within their proper significance criteria, in order to give evidence to the most relevant features;
the extrapolation of the main features, by applying thresholds which are meaningful within their proper significance criteria, and displayed in monochrome color scale images (256 color levels from white to full color);
the discrimination of the different features by correlating each one to a different color;
the constitution of a suitable vocabulary for translating the significant features of each dataset in categories of damage/risk;
the alignment of the images with respect to the common references, ROI origin and limits;
the composition of a unique multi-layer map, where each layer corresponds to one category of damage/risk evidenced by the different methodologies.
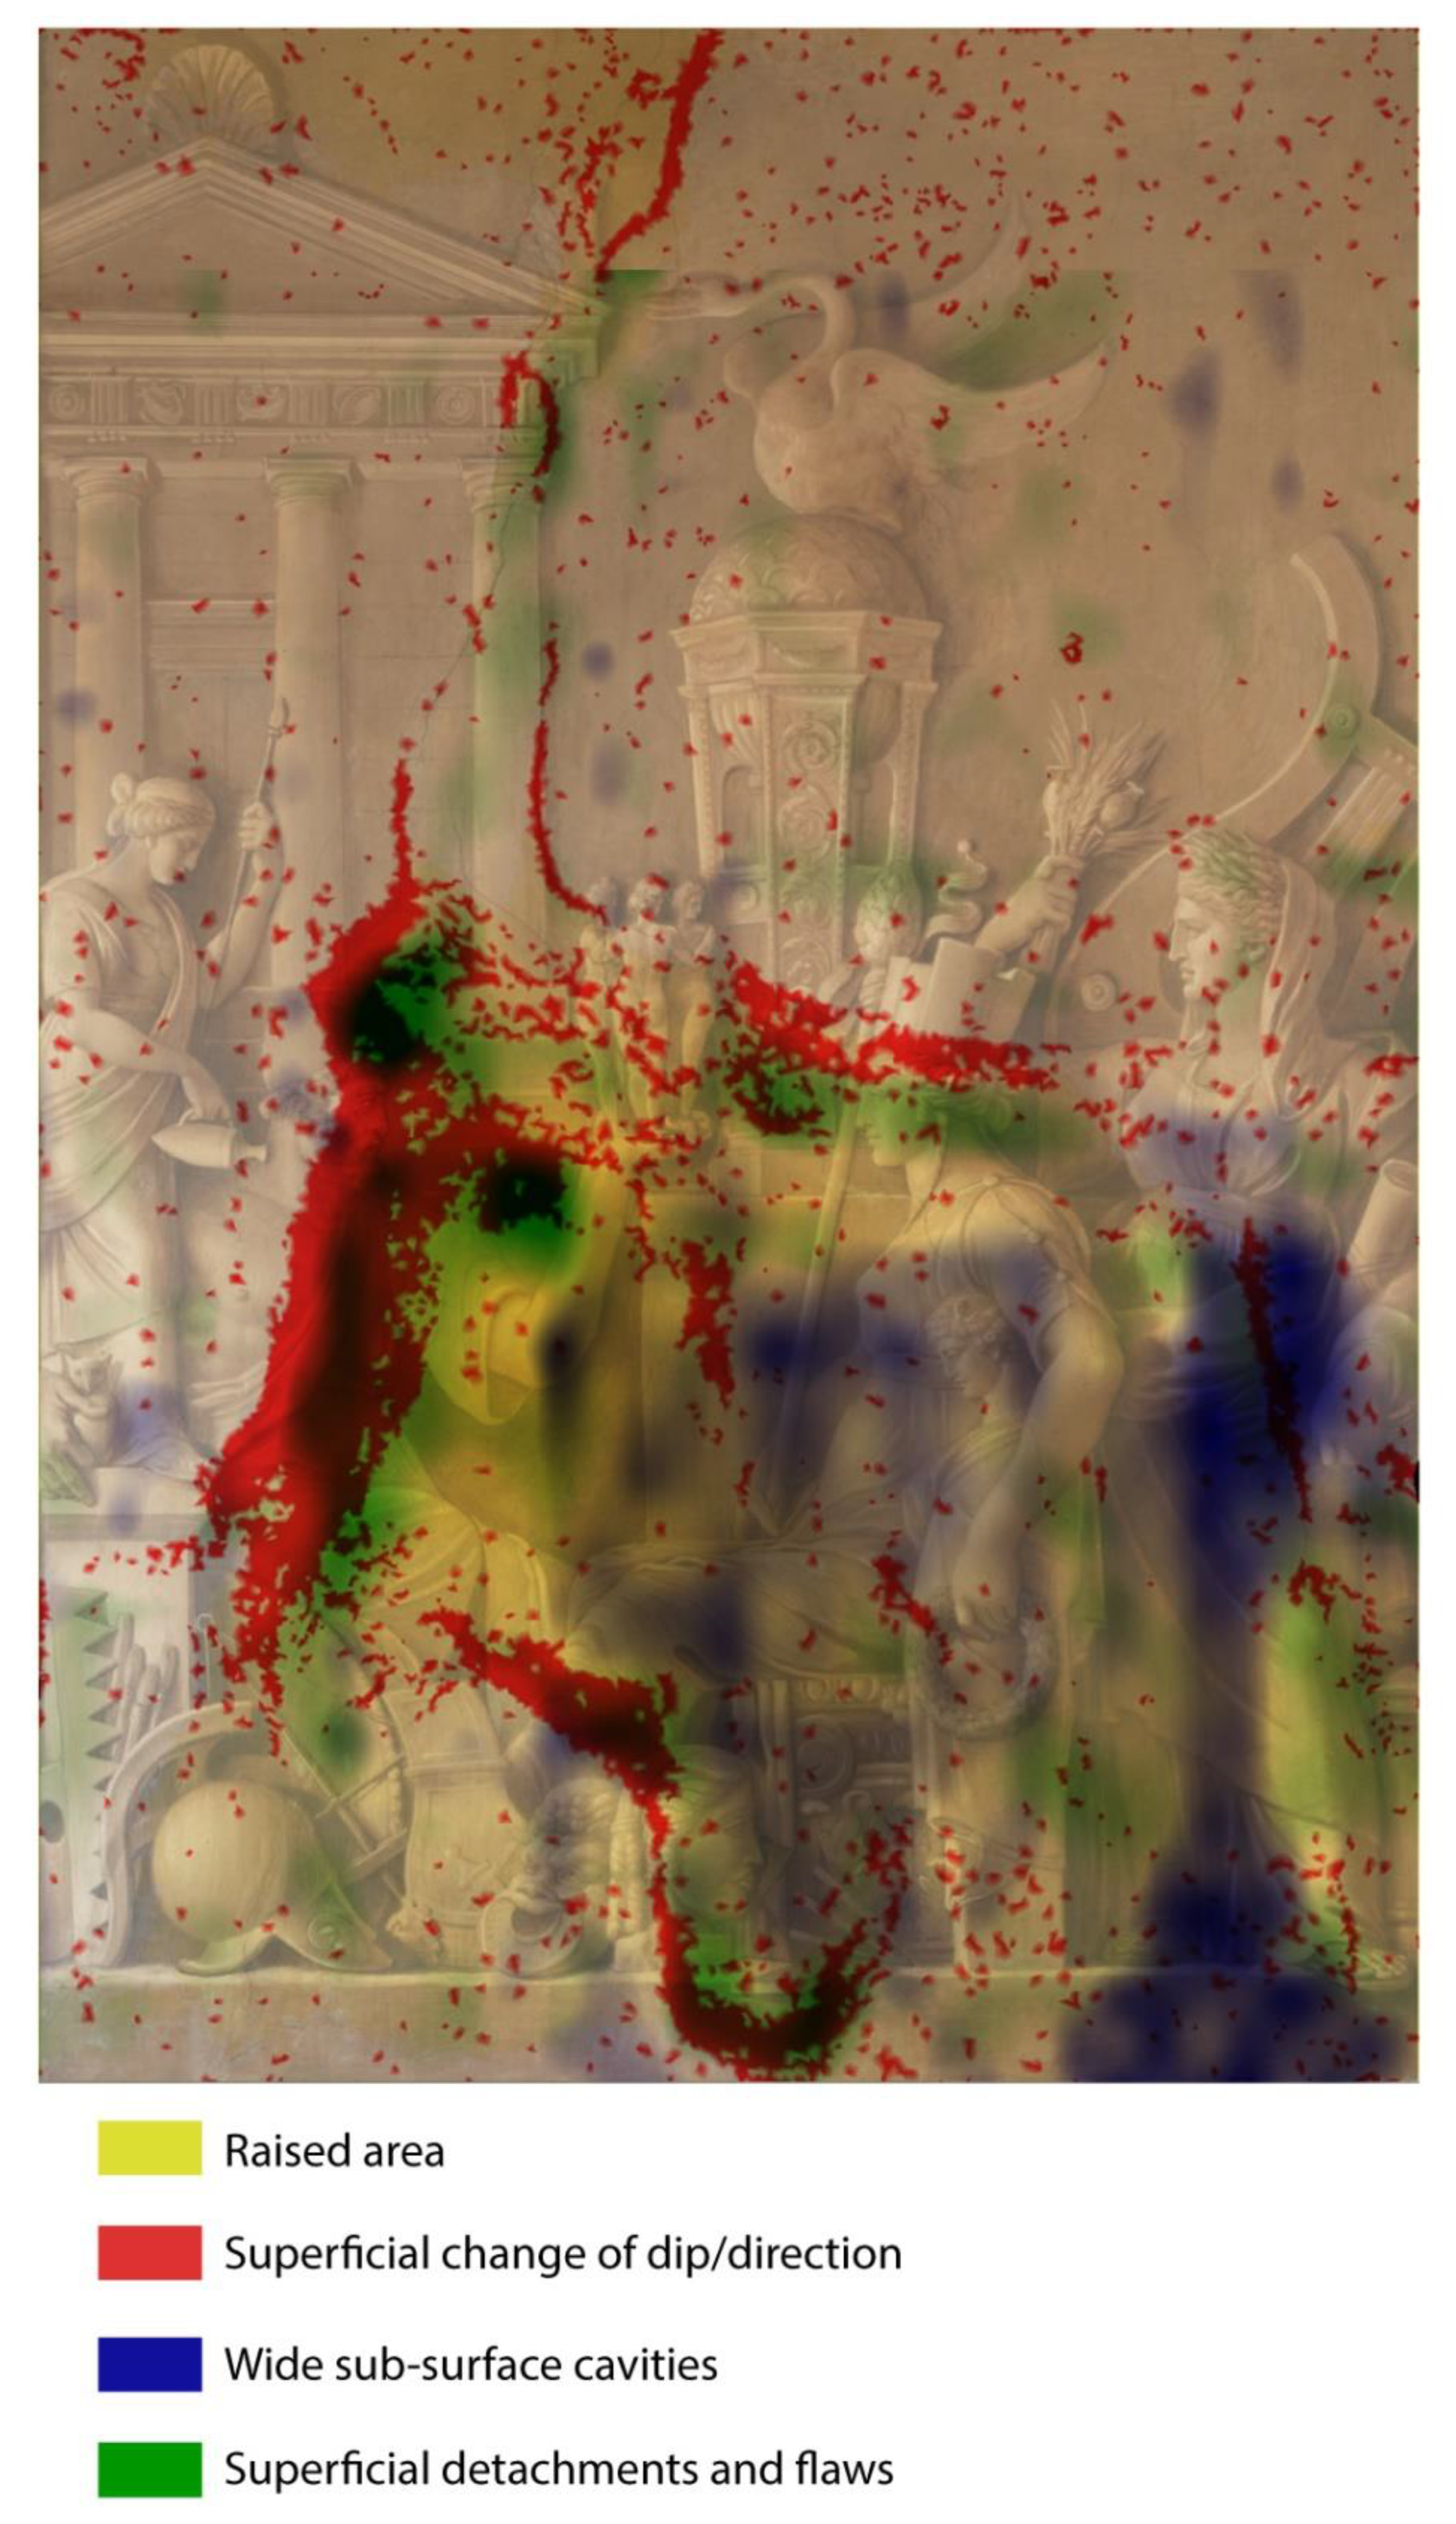
Figure 12 shows the images, after step (4), that gather the information about both the surface morphology and the sub-surface defects, as synthetically reported in
Table 1:
Figure 12 shows that the peculiarity of the method is represented by the integration of maps consciously interpreted by the operators, who can manage their weight through the thresholds of each layer. The different artistic supports, the variety of techniques and the different possible geometries of the surfaces impose the need to interpret the data before fusion through the choice of characteristic intervals for each map. As shown in
Figure 13, it is possible to associate the acoustic maps and the morphological ones in order to have homogeneous datasets referring to the same type of analysis. More generally, the overlapping of data relating to morphological and acoustic diagnosis allows correlating of the degradation dynamics on the surface (recalling also the visible crack pattern) with the deep degradation mechanisms. The method therefore allows a double reading: asynchronous being able to read each layer individually, and synchronous being able to read several overlapping layers. It will always be the expert operator, with his sensitivity and awareness, who will correlate several physical characteristics one another, highlighting the major criticalities of the product.
The output of this procedure is presented in
Figure 14: the layers appear superimposed (through a blending multiply graphical mode), to visually correlate the deformation of the surface, customized in yellow and red color, to different types of pathologies occurring beneath the surface, customized in blue and green color. The use of different colors to customize the layers allows them to be still discernible, in order to be retrieved on request and be singularly analyzed.
The resulting multi-layer map is intended to help the global reading and the thorough knowledge of the investigated cultural asset and its conservation state, using a user-friendly terminology for the CH operators. In
Figure 14, the wide sub-surface cavity (blue) perfectly superposes the (yellow) squared plateau with intermediate elevation values in the low central part of the ROI. Furthermore, the superficial detachments (green) are clearly placed in the surroundings of areas with major changes of dip/direction (red) and with the highest elevation values (deep yellow). Thus, as in a cause-and-effect relationship, it is highly probable that structural elements inside the wall have induced the creation of detachments, superficial deformations and fractures generating the current status.
4. Discussion and Conclusions
The work presented in this paper was carried out within the framework of the ADAMO Project (Technologies of Analysis, DIAgnostics and MOnitoring for the preservation and restoration of cultural heritage), part of the actions of the Technological District for Cultural Heritage of the Lazio Region.
The experimental campaign was performed at the site of Chigi Palace in Ariccia, specifically in the Ariosto Room, for identifying the causes of deterioration of the monochrome mural painting Graecia Vetus by Giuseppe Cades (1788) and of the supporting wall structure. The investigation techniques encompassed photogrammetric survey and non-destructive acoustic diagnostics, in particular, the innovative contactless Audio Frequency Acoustic Imaging (AF-AI) supported by the more traditional Acoustic Tomography (AT) with impact hammer. The results were individually analysed and interpreted, and successively integrated in order to make them readable to the operators in charge of the protection and the management of cultural heritage.
We can note that the relevant variation of the pulse velocity, obtained from the AT, is quite coherent with discontinuities and a very heterogeneous inner structure of the masonry, although only a qualitative exam can be made for this case study. Considering this evidence together with the AF-AI results, denoting sub-surface alterations, and the DEM from the photogrammetry, revealing consistent surface deformations in the same areas, we can state that all the results confirm that the main critical area is located in the lower right half of the ROI.
To the best of our knowledge, some possible hypotheses might take into account the presence of a hidden chimney, or a system of pipes, or a sort of masonry stove built inside the wall. This type of stove [
27] uses the convection of the hot air inside a labyrinth of cavities, a system of channels and baffles that stores for a long time the heat within the masonry. Unfortunately, no indication has been found in historical documents and drawings related to the palace; only the twentieth-century photos attest to the presence of an external heater connected to the stovepipe opening, while similar cases in antique buildings have been found in the literature.
Beside these initial findings, the major result of the present paper is the implications of the multi-layer map that is the output of an articulated image processing for obtaining the data integration. Specifically, a data fusion of heterogeneous datasets was accomplished according to a seven steps procedure encompassing: 1. the harmonisation of the datasets; 2. the interpretation of the 3D and 2D images; 3. the extrapolation of the main features; 4. the discrimination of the different features; 5. the translation of the significant features in categories of damage; 6. the alignment of the images; 7. the composition of a unique multi-layer map.
In this workflow, the raw data displayed as independent images are processed into the intermediate data, still treated as images. These last contain only the main features, discriminated according to the peculiar significance criteria of each methodology, that constitute different layers associated with specific categories of damage. Thus, the superposition of these layers actually represents the map where all these details converge. In this case study, the composed map clearly evidences that the surface deformations are correlated with, and are likely the effect of, the presence of sub-surface anomalies. Thus, the pattern characterising the surface, impairing in some parts the integrity of the monochrome painting, cannot be understood and treated without considering the causes of the decay process occurring in the underlying mural structure. Under this point of view, further investigations would be very interesting in order to definitely assess the actual state of conservation of the wall.
The approach proposed in this work for integrating different datasets represents a first attempt to meet the increasing need in the CH field of gathering information from different sources and elaborate them into a unique frame. This is an issue of growing importance among this scientific community, generating a number of tools and platforms suitable for similar tasks. Nevertheless, the wide variety of scientific methods for CH applications requires a tool capable of manipulating heterogeneous datasets (both synchronic and diachronic), and of managing a great amount of information in a user-friendly environment. The proposed procedure effectively guarantees access to the integrated information, offering the possibility to understand the correlation between the causes and the effects of a decay process, as well as the retrieval of the single analysis in order to deepen one specific aspect.
At present, further improvements are under study. In particular, one fundamental question regards the choice of working with numerical data or with pixels in the image superposition, as well as the number of images that can be effectively superposed without losing the readability of the final map. The intermediate images, after the extraction of the main features applying the threshold filtering, could be further simplified in the form of binary images. The last aspect, but surely not the least important, regards the future implementation of a proper code to automatically perform some steps of the integration procedure.

