Author Contributions
Conceptualization, I.A.N. and N.D.L.; methodology, I.A.N., C.C.M. and N.D.L.; software, I.A.N., C.C.M. and N.D.L.; validation, I.A.N. and N.D.L.; formal analysis, I.A.N. and N.D.L.; investigation, I.A.N. and N.D.L.; writing-original draft preparation, I.A.N., C.C.M. and N.D.L.; writing-review and editing, I.A.N., C.C.M. and N.D.L.; visualization, I.A.N. and N.D.L., supervision, C.C.M. and N.D.L.; project administration, C.C.M. and N.D.L. All authors have read and agreed to the published version of the manuscript.
Disclaimer: The content of this paper expresses the views of the author and not the official position of the Ministry of Maritime Affairs & Insular Policy.
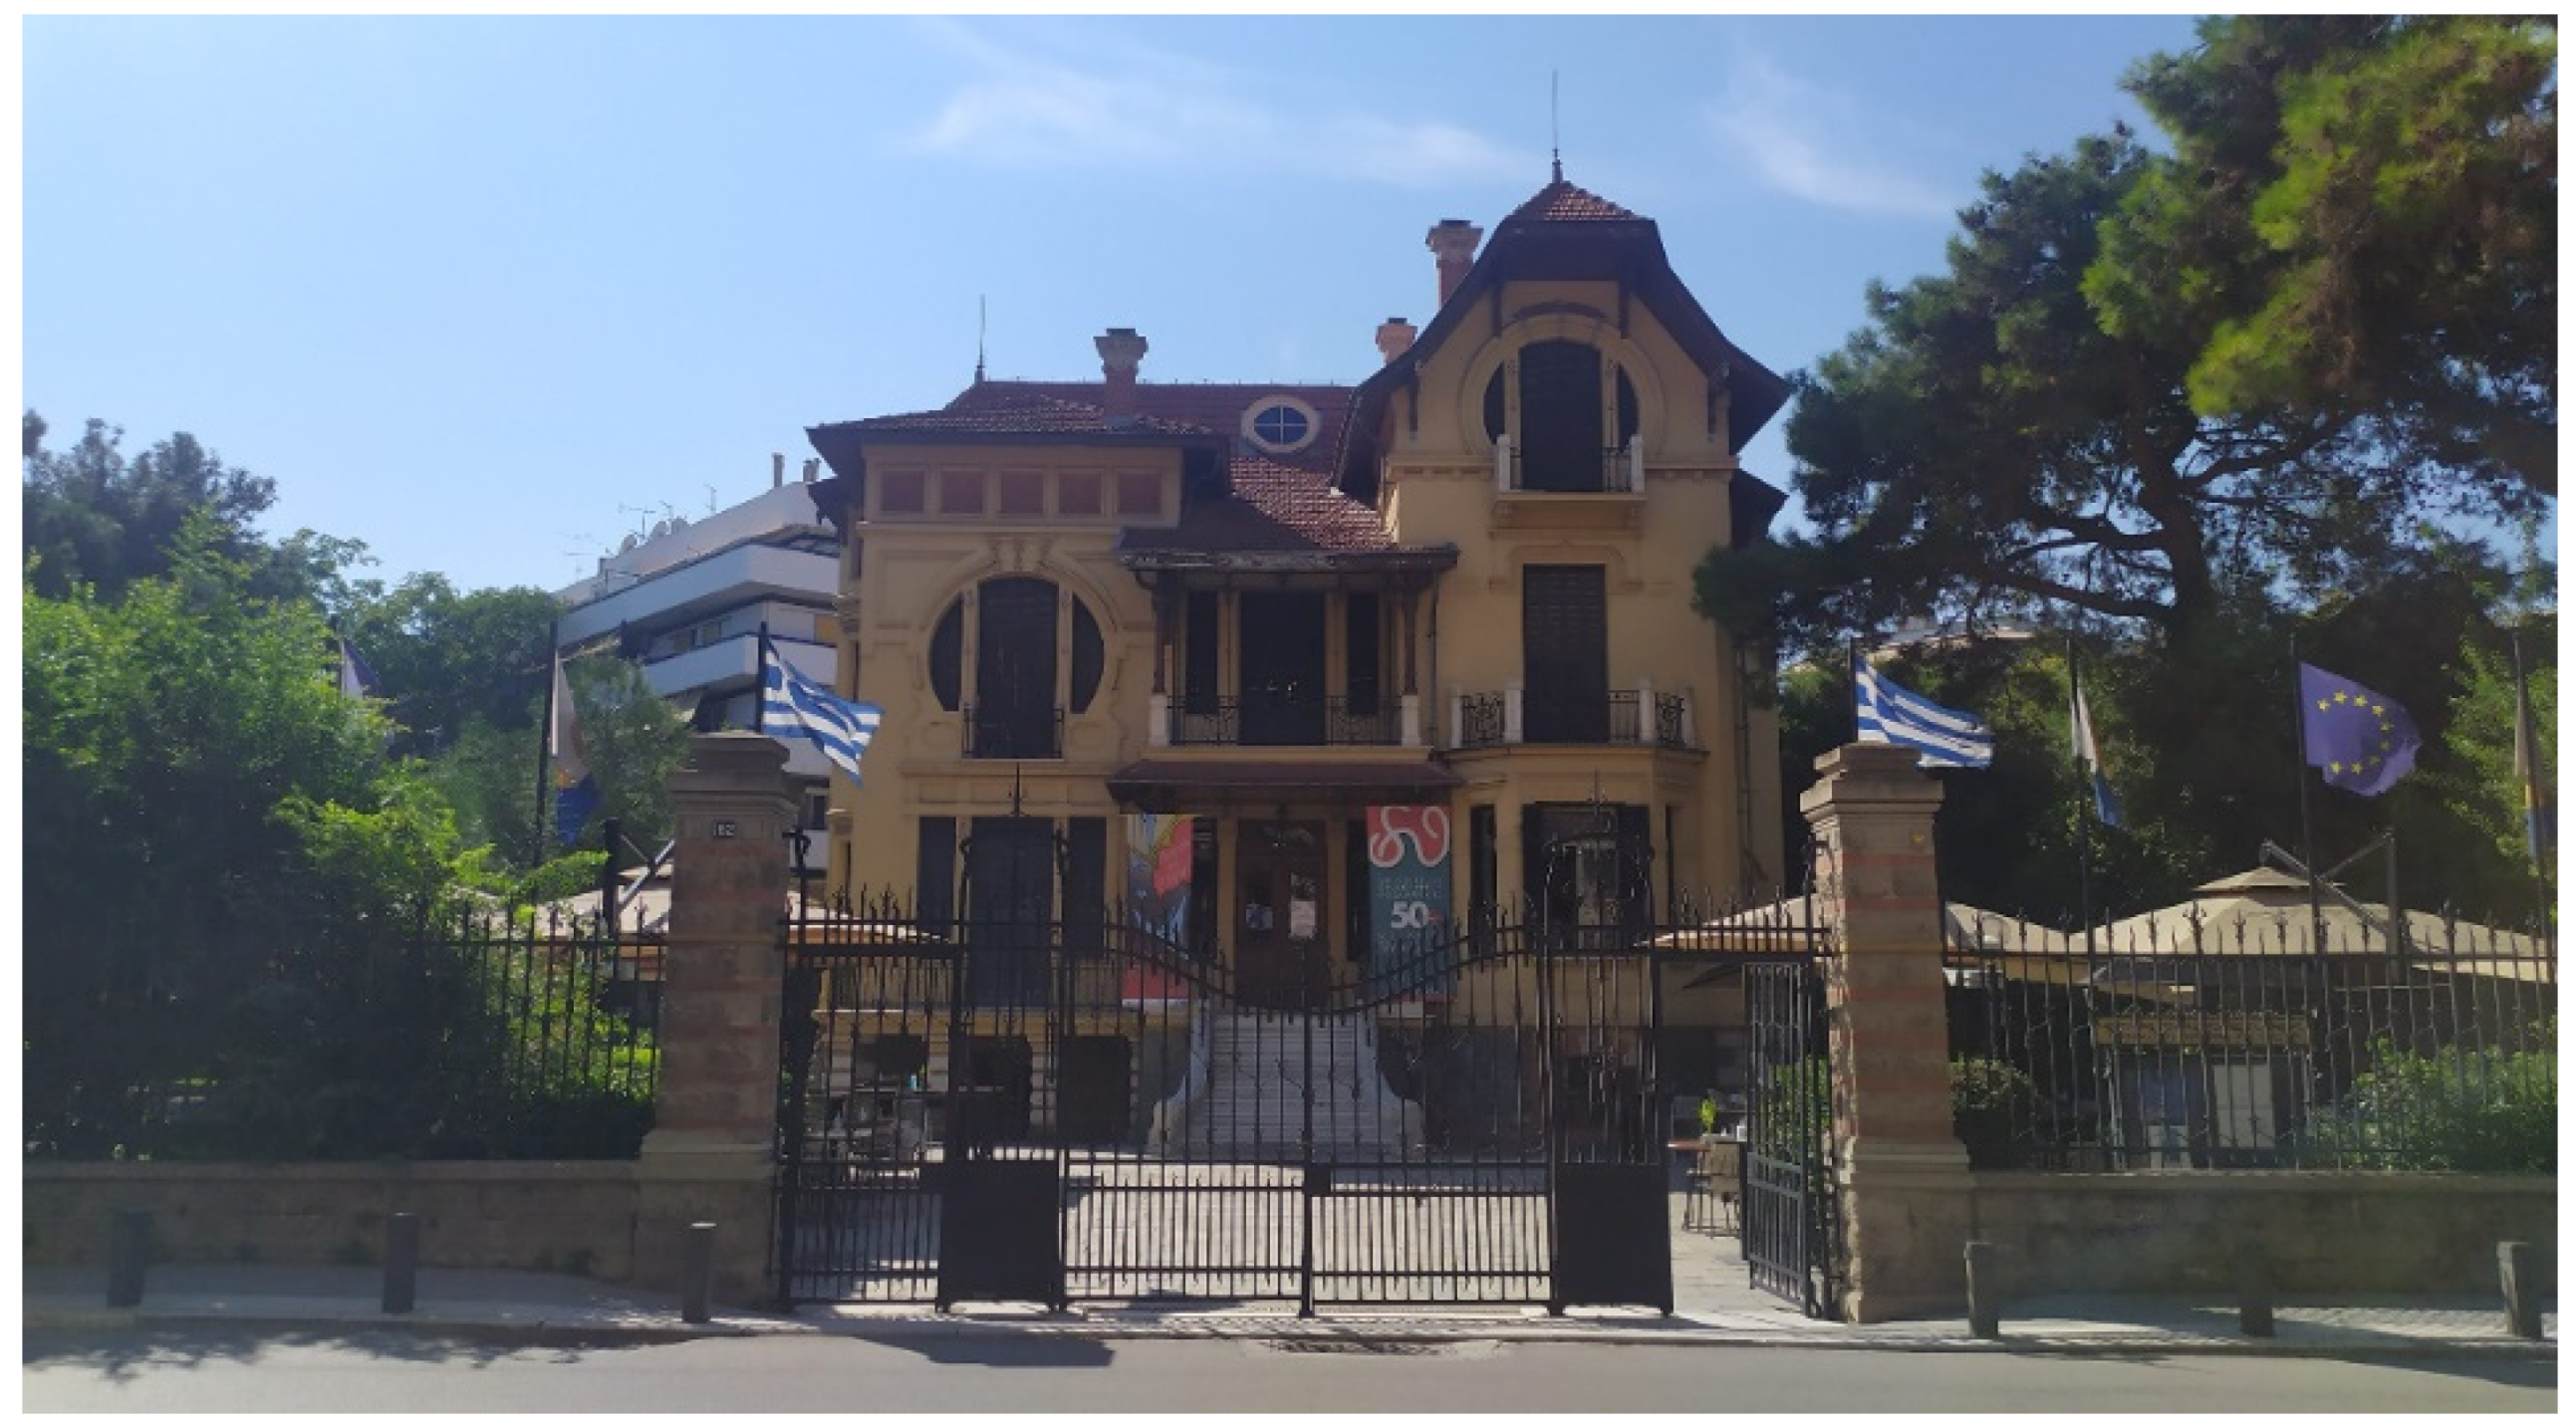
Figure 1.
Front view of Villa Bianca (authors’ archive).
Figure 1.
Front view of Villa Bianca (authors’ archive).
Figure 2.
The main building complex of Simonopetra Monastery (west view—authors’ archive).
Figure 2.
The main building complex of Simonopetra Monastery (west view—authors’ archive).
Figure 3.
Optimized implementation grades of the 16 fire protection measures for the six different FSI targets (F.A).
Figure 3.
Optimized implementation grades of the 16 fire protection measures for the six different FSI targets (F.A).
Figure 4.
Cost and API representation for different FSI values (Test Case 1).
Figure 4.
Cost and API representation for different FSI values (Test Case 1).
Figure 5.
Optimized implementation grades of the 16 fire protection measures for the six different cost targets (F.B).
Figure 5.
Optimized implementation grades of the 16 fire protection measures for the six different cost targets (F.B).
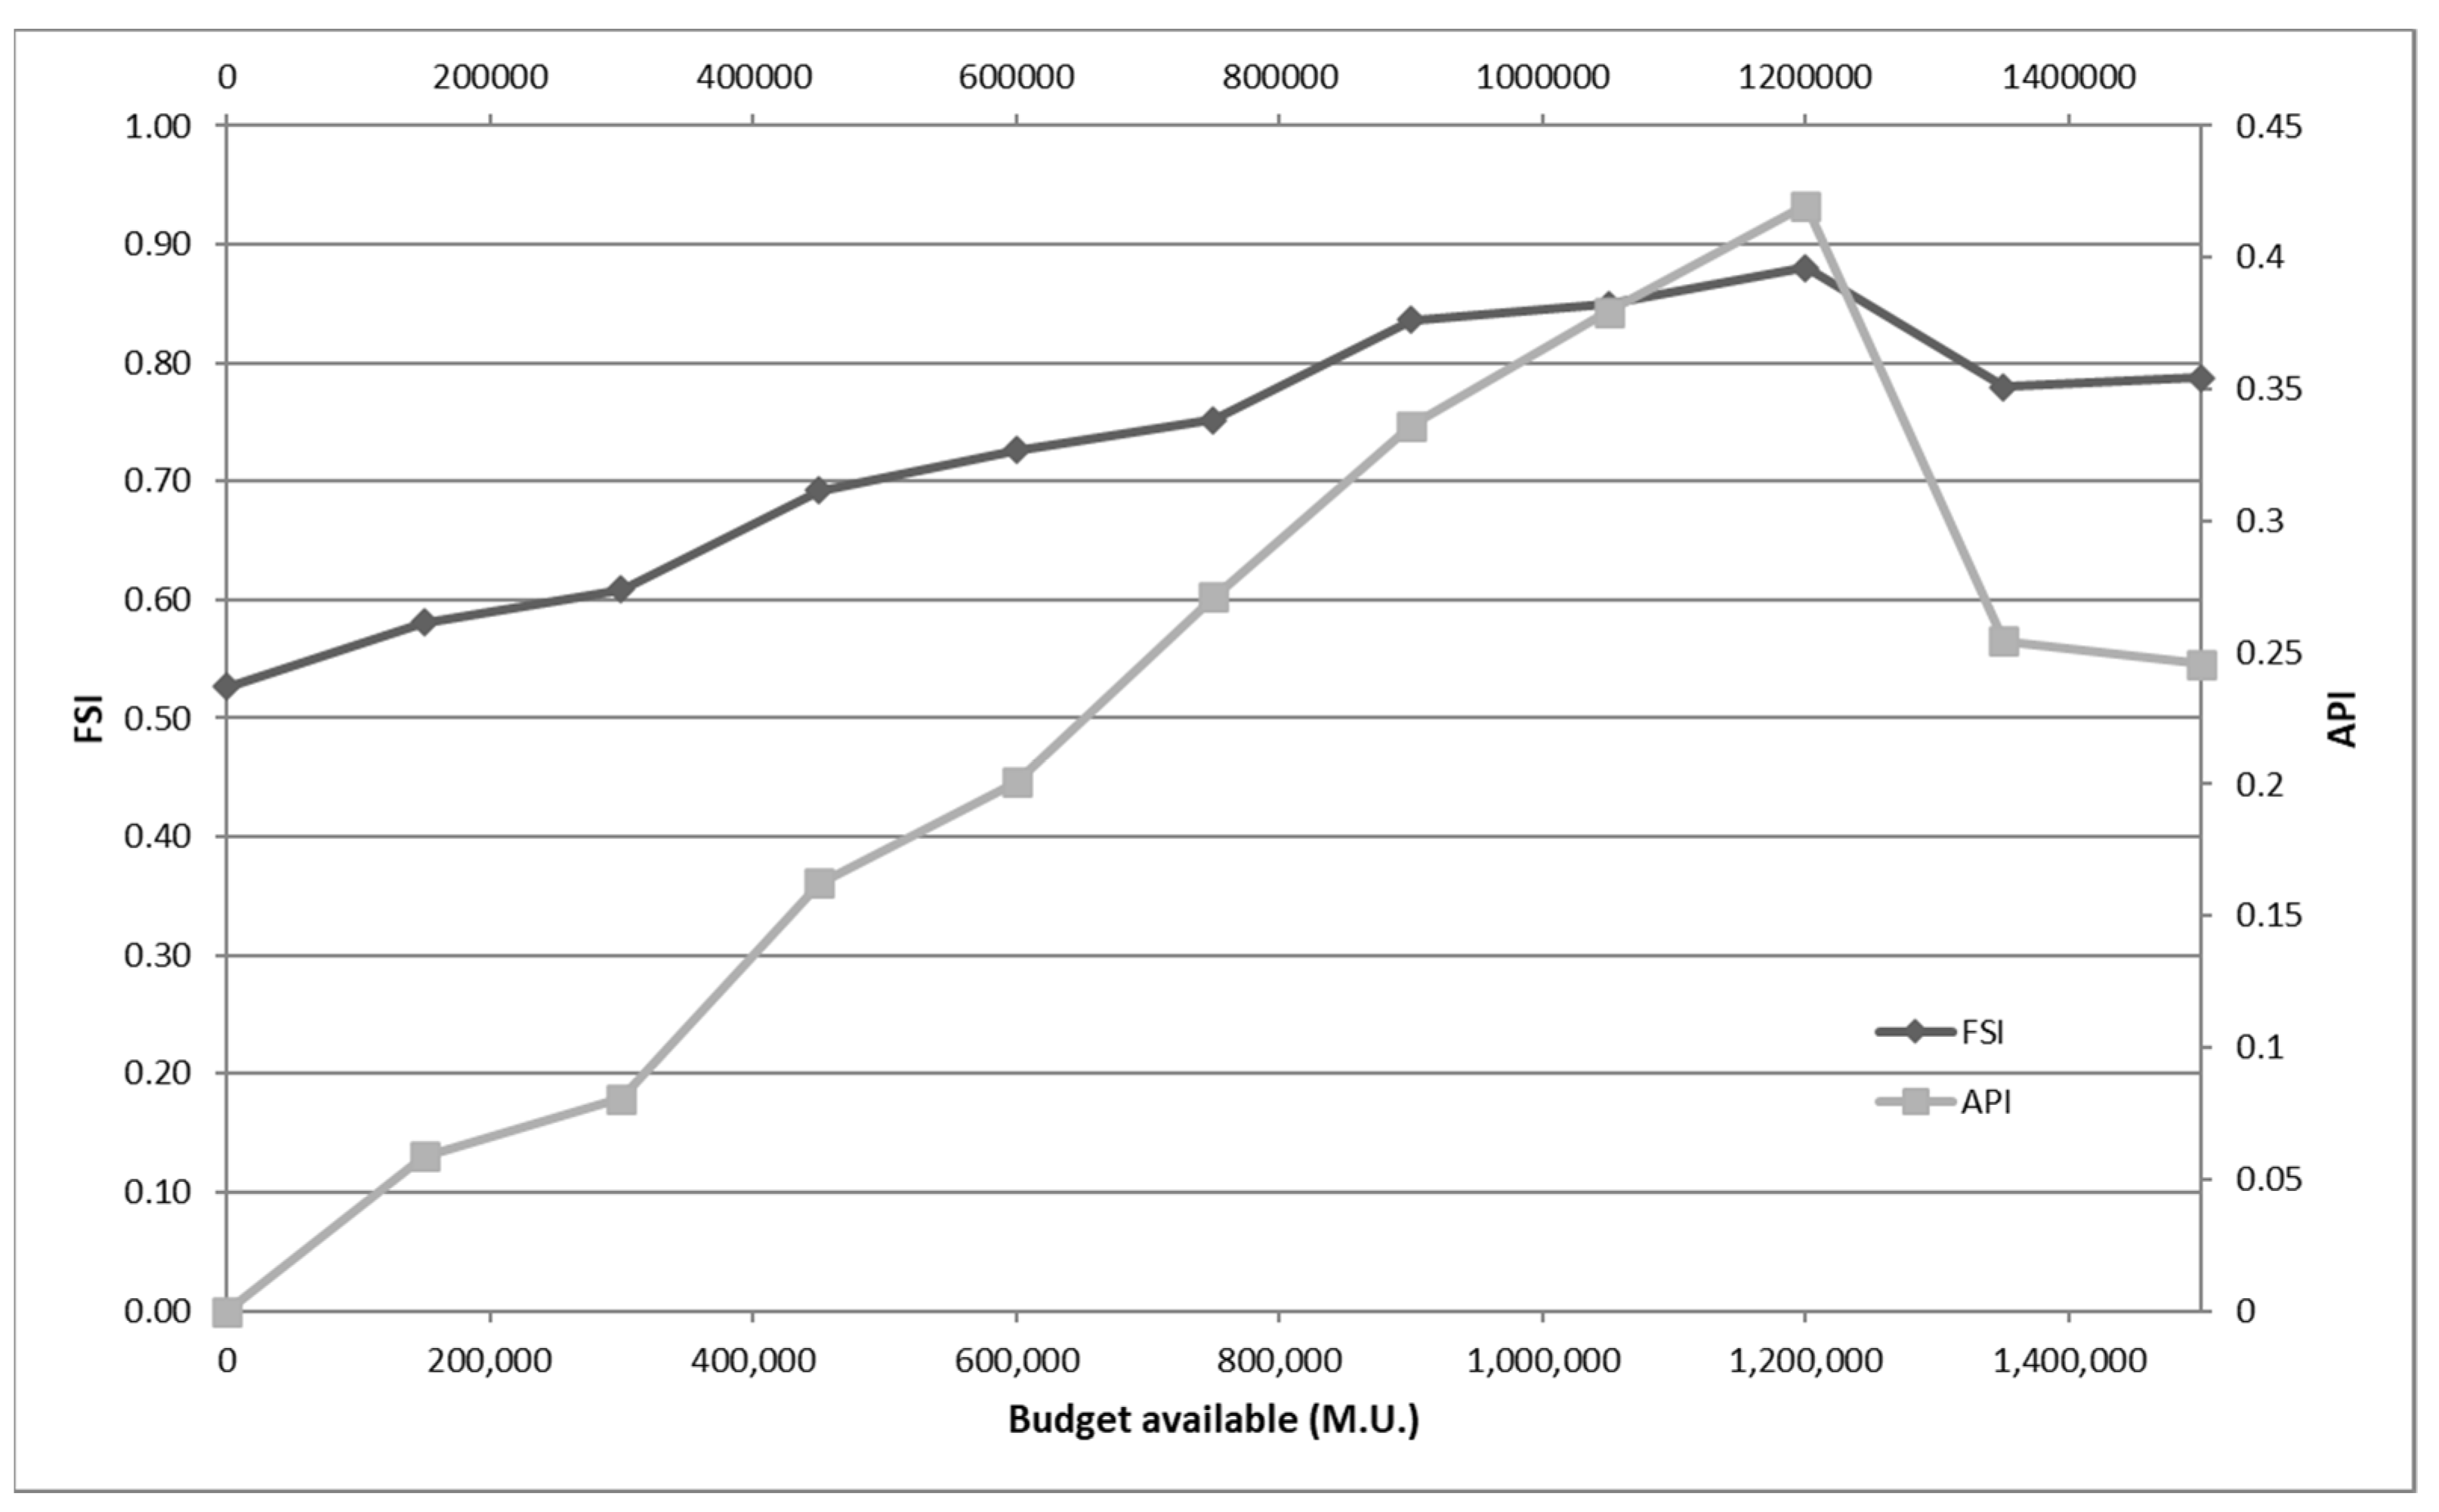
Figure 6.
FSI and API for different budget available (Test Case 1).
Figure 6.
FSI and API for different budget available (Test Case 1).
Figure 7.
Presentation of Pareto fronts for the six test cases of FSI target value.
Figure 7.
Presentation of Pareto fronts for the six test cases of FSI target value.
Figure 8.
Implementation grades of the 16 fire protection measures for designs (1) and (2) of the Pareto front corresponding to FSI = 0.60.
Figure 8.
Implementation grades of the 16 fire protection measures for designs (1) and (2) of the Pareto front corresponding to FSI = 0.60.
Figure 9.
Implementation grades of the 16 fire protection measures for designs (3) and (4) of the Pareto front corresponding to FSI = 0.70.
Figure 9.
Implementation grades of the 16 fire protection measures for designs (3) and (4) of the Pareto front corresponding to FSI = 0.70.
Figure 10.
Implementation grades of the 16 fire protection measures for designs (5) and (6) of the Pareto front corresponding to FSI = 0.80.
Figure 10.
Implementation grades of the 16 fire protection measures for designs (5) and (6) of the Pareto front corresponding to FSI = 0.80.
Figure 11.
Implementation grades of the 16 fire protection measures for designs (7) and (8) of the Pareto front corresponding to FSI = 0.90.
Figure 11.
Implementation grades of the 16 fire protection measures for designs (7) and (8) of the Pareto front corresponding to FSI = 0.90.
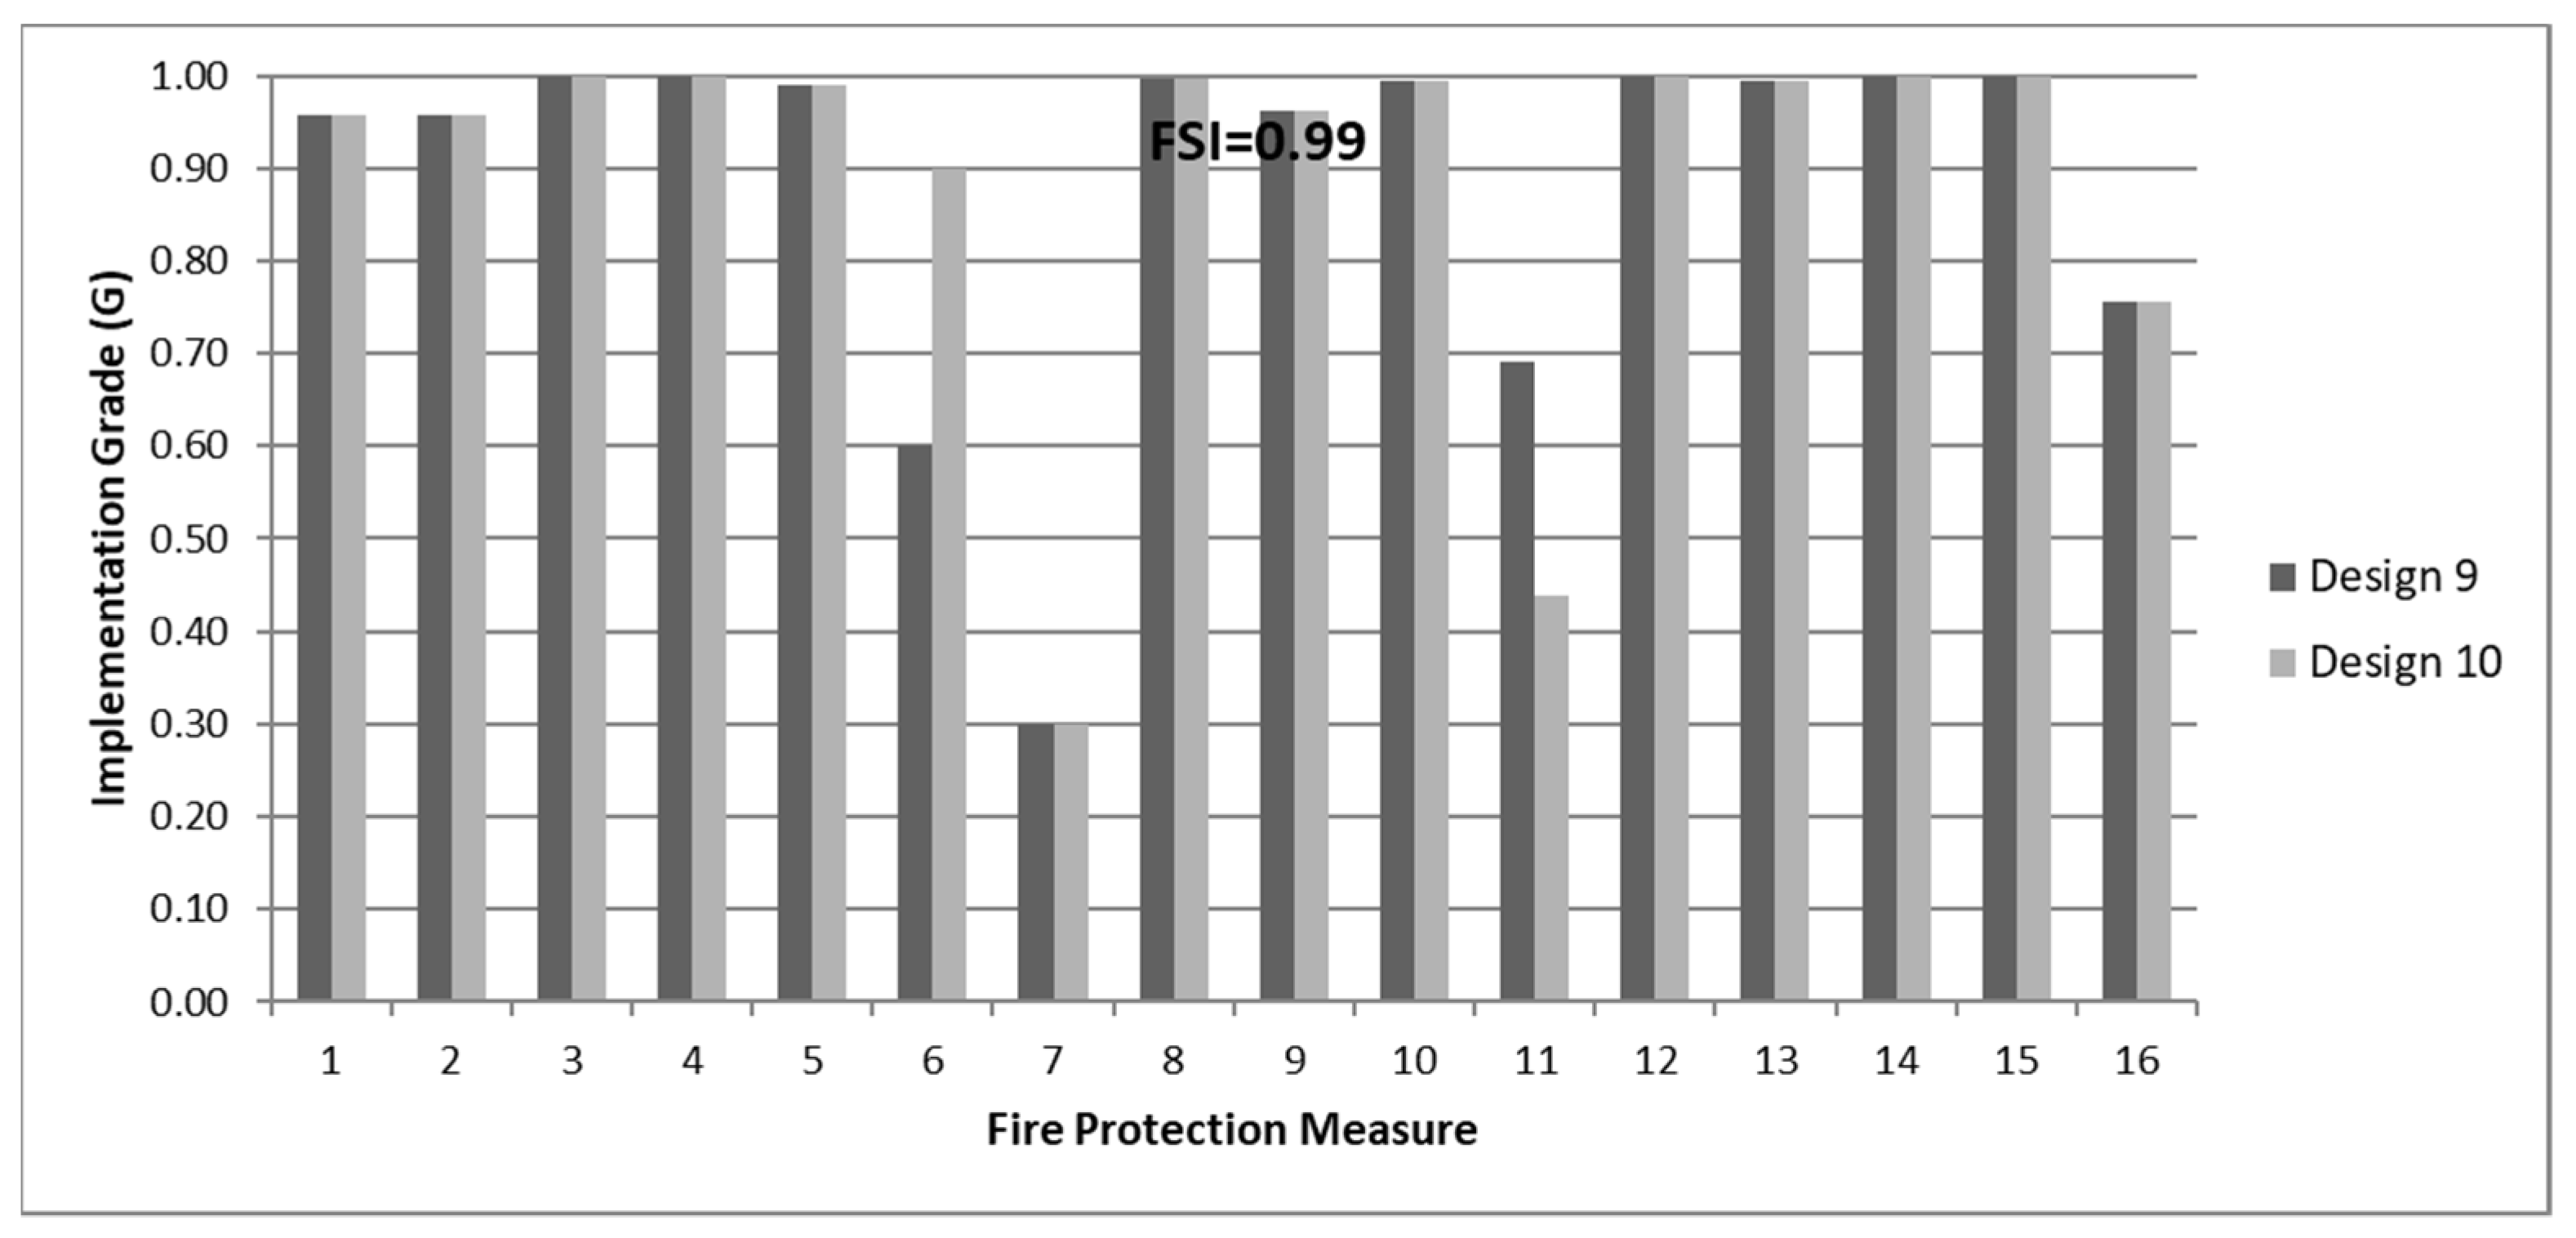
Figure 12.
Implementation grades of the 16 fire protection measures for designs (9) and (10) of the Pareto front corresponding to FSI = 0.99.
Figure 12.
Implementation grades of the 16 fire protection measures for designs (9) and (10) of the Pareto front corresponding to FSI = 0.99.
Figure 13.
Results obtained by ATC (Formulation A) and NSES-II approaches for the test case of Villa Bianca.
Figure 13.
Results obtained by ATC (Formulation A) and NSES-II approaches for the test case of Villa Bianca.
Figure 14.
Optimized implementation grades of the 16 fire protection measures for the 10 different FSI targets (F.A).
Figure 14.
Optimized implementation grades of the 16 fire protection measures for the 10 different FSI targets (F.A).
Figure 15.
Cost and API representation for different FSI values (Test Case 2).
Figure 15.
Cost and API representation for different FSI values (Test Case 2).
Figure 16.
Optimized implementation grades of the 16 fire protection measures for the 10 different cost targets (F.B).
Figure 16.
Optimized implementation grades of the 16 fire protection measures for the 10 different cost targets (F.B).
Figure 17.
FSI and API for different budget available.
Figure 17.
FSI and API for different budget available.
Figure 18.
FSI for different budget available, considering and not considering authenticity preservation (Test Case 2).
Figure 18.
FSI for different budget available, considering and not considering authenticity preservation (Test Case 2).
Figure 19.
Presentation of Pareto fronts for the ten test cases of FSI target value.
Figure 19.
Presentation of Pareto fronts for the ten test cases of FSI target value.
Figure 20.
Presentation of Pareto fronts for the first five test cases of FSI target value.
Figure 20.
Presentation of Pareto fronts for the first five test cases of FSI target value.
Figure 21.
Implementation grades of the 16 fire protection measures for designs (1) and (2) of the Pareto front corresponding to FSI = 0.55.
Figure 21.
Implementation grades of the 16 fire protection measures for designs (1) and (2) of the Pareto front corresponding to FSI = 0.55.
Figure 22.
Implementation grades of the 16 fire protection measures for designs (3) and (4) of the Pareto front corresponding to FSI = 0.60.
Figure 22.
Implementation grades of the 16 fire protection measures for designs (3) and (4) of the Pareto front corresponding to FSI = 0.60.
Figure 23.
Implementation grades of the 16 fire protection measures for designs (5) and (6) of the Pareto front corresponding to FSI = 0.65.
Figure 23.
Implementation grades of the 16 fire protection measures for designs (5) and (6) of the Pareto front corresponding to FSI = 0.65.
Figure 24.
Implementation grades of the 16 fire protection measures for designs (7) and (8) of the Pareto front corresponding to FSI = 0.70.
Figure 24.
Implementation grades of the 16 fire protection measures for designs (7) and (8) of the Pareto front corresponding to FSI = 0.70.
Figure 25.
Implementation grades of the 16 fire protection measures for designs (9) and (10) of the Pareto front corresponding to FSI = 0.75.
Figure 25.
Implementation grades of the 16 fire protection measures for designs (9) and (10) of the Pareto front corresponding to FSI = 0.75.
Figure 26.
Results obtained by ATC (Formulation A) and NSES-II approaches for the test case of Simonopetra.
Figure 26.
Results obtained by ATC (Formulation A) and NSES-II approaches for the test case of Simonopetra.
Table 1.
AHP tree weight coefficients (W) scale according to the importance of the element evaluated [
2].
Table 1.
AHP tree weight coefficients (W) scale according to the importance of the element evaluated [
2].
| Importance | Weight (W) |
|---|
| None | 0 |
| Low | 1 |
| Moderate | 2 |
| High | 3 |
| Very high | 4 |
Table 2.
AHP tree weight coefficients (W) and normalized weight coefficients (N.W.) between objectives and policy [
4].
Table 2.
AHP tree weight coefficients (W) and normalized weight coefficients (N.W.) between objectives and policy [
4].
| | | OB1 | OB2 | OB3 | OB4 |
|---|
| PO | W. | 4 | 3 | 3 | 1 |
| N.W. | 0.36 | 0.27 | 0.27 | 0.09 |
Table 3.
AHP tree weight coefficients (W) and normalized weight coefficients (N.W.) between strategies and objectives [
4].
Table 3.
AHP tree weight coefficients (W) and normalized weight coefficients (N.W.) between strategies and objectives [
4].
| | | ST1 | ST2 | ST3 | ST4 | ST5 |
|---|
| OB1 | W. | 4 | 3 | 2 | 4 | 3 |
| N.W. | 0.25 | 0.19 | 0.13 | 0.25 | 0.19 |
| OB2 | W. | 4 | 4 | 3 | 1 | 3 |
| N.W. | 0.27 | 0.27 | 0.20 | 0.07 | 0.20 |
| OB3 | W. | 4 | 4 | 0 | 0 | 3 |
| N.W. | 0.36 | 0.36 | 0.00 | 0.00 | 0.27 |
| OB4 | W. | 2 | 2 | 4 | 0 | 2 |
| N.W. | 0.20 | 0.20 | 0.40 | 0.00 | 0.20 |
Table 4.
AHP tree weight coefficients (W) and normalized weight coefficients (N.W.) between fire protection measures and strategies [
4].
Table 4.
AHP tree weight coefficients (W) and normalized weight coefficients (N.W.) between fire protection measures and strategies [
4].
| | ST1 | ST2 | ST3 | ST4 | ST5 |
|---|
| | W. | N.W. | W. | N.W. | W. | N.W. | W. | N.W. | W. | N.W. |
|---|
| M1 | 0 | 0.00 | 4 | 0.15 | 1 | 0.11 | 3 | 0.07 | 3 | 0.08 |
| M2 | 0 | 0.00 | 4 | 0.15 | 1 | 0.11 | 3 | 0.07 | 4 | 0.11 |
| M3 | 3 | 0.13 | 3 | 0.11 | 2 | 0.22 | 2 | 0.05 | 3 | 0.08 |
| M4 | 4 | 0.17 | 3 | 0.11 | 0 | 0.00 | 4 | 0.10 | 2 | 0.05 |
| M5 | 0 | 0.00 | 0 | 0.00 | 4 | 0.44 | 0 | 0.00 | 1 | 0.03 |
| M6 | 0 | 0.00 | 2 | 0.07 | 0 | 0.00 | 4 | 0.10 | 1 | 0.03 |
| M7 | 0 | 0.00 | 0 | 0.00 | 0 | 0.00 | 4 | 0.10 | 1 | 0.03 |
| M8 | 0 | 0.00 | 2 | 0.07 | 1 | 0.11 | 1 | 0.02 | 4 | 0.11 |
| M9 | 3 | 0.13 | 2 | 0.07 | 0 | 0.00 | 3 | 0.07 | 2 | 0.05 |
| M10 | 3 | 0.13 | 2 | 0.07 | 0 | 0.00 | 3 | 0.07 | 4 | 0.11 |
| M11 | 0 | 0.00 | 1 | 0.04 | 0 | 0.00 | 4 | 0.10 | 4 | 0.11 |
| M12 | 4 | 0.17 | 1 | 0.04 | 0 | 0.00 | 3 | 0.07 | 3 | 0.08 |
| M13 | 0 | 0.00 | 0 | 0.00 | 0 | 0.00 | 4 | 0.10 | 3 | 0.08 |
| M14 | 4 | 0.17 | 1 | 0.04 | 0 | 0.00 | 2 | 0.05 | 2 | 0.05 |
| M15 | 3 | 0.13 | 2 | 0.07 | 0 | 0.00 | 2 | 0.05 | 1 | 0.03 |
| M16 | 0 | 0.00 | 0 | 0.00 | 0 | 0.00 | 0 | 0.00 | 0 | 0.00 |
Table 5.
Implementation grades (G) of the fire protection measures regarding the present situation of Villa Bianca [
4].
Table 5.
Implementation grades (G) of the fire protection measures regarding the present situation of Villa Bianca [
4].
| Measure | M1 | M2 | M3 | M4 | M5 | M6 | M7 | M8 | M9 | M10 | M11 | M12 | M13 | M14 | M15 | M16 |
|---|
| G (Present Situation) | 0.3 | 0.4 | 0.7 | 0.5 | 0.8 | 0.7 | 1.0 | 1.0 | 0.7 | 0.6 | 0.0 | 0.0 | 0.0 | 0.2 | 0.5 | 0.2 |
Table 6.
AHP tree weight coefficients (W) and normalized weight coefficients (N.W.) between preservation objectives (POB1 and POB2) and preservation policy (PPO).
Table 6.
AHP tree weight coefficients (W) and normalized weight coefficients (N.W.) between preservation objectives (POB1 and POB2) and preservation policy (PPO).
| | | PG1 | PG2 |
|---|
| PPO | W. | 2 | 4 |
| N.W. | 0.33 | 0.67 |
Table 7.
AHP tree weight coefficients (W) and normalized weight coefficients (N.W.) between 16 measures (M1 to M16) and preservation objectives (POB1 and POB2).
Table 7.
AHP tree weight coefficients (W) and normalized weight coefficients (N.W.) between 16 measures (M1 to M16) and preservation objectives (POB1 and POB2).
| | PG1 | PG2 |
|---|
| | W. | N.W. | W. | N.W. |
|---|
| M1 | 4 | 0.14 | 3 | 0.09 |
| M2 | 4 | 0.14 | 1 | 0.03 |
| M3 | 2 | 0.07 | 4 | 0.12 |
| M4 | 3 | 0.10 | 2 | 0.06 |
| M5 | 3 | 0.10 | 3 | 0.09 |
| M6 | 4 | 0.14 | 4 | 0.12 |
| M7 | 1 | 0.03 | 4 | 0.12 |
| M8 | 3 | 0.10 | 3 | 0.09 |
| M9 | 1 | 0.03 | 3 | 0.09 |
| M10 | 2 | 0.07 | 3 | 0.09 |
| M11 | 2 | 0.07 | 3 | 0.09 |
| M12 | 0 | 0.00 | 0 | 0.00 |
| M13 | 0 | 0.00 | 0 | 0.00 |
| M14 | 0 | 0.00 | 0 | 0.00 |
| M15 | 0 | 0.00 | 0 | 0.00 |
| M16 | 0 | 0.00 | 0 | 0.00 |
Table 8.
(W) and normalized weight coefficients (N.W.) between preservation objectives (POB1–POB4) and preservation policy (PPO).
Table 8.
(W) and normalized weight coefficients (N.W.) between preservation objectives (POB1–POB4) and preservation policy (PPO).
| | | POB1 | POB2 | POB3 | POB4 |
|---|
| PPO | W. | 3 | 2 | 3 | 2 |
| N.W. | 0.30 | 0.20 | 0.30 | 0.20 |
Table 9.
AHP tree weight coefficients (W) and normalized weight coefficients (N.W.) between 16 measures (M1 to M16) and preservation objectives (POB1–POB4).
Table 9.
AHP tree weight coefficients (W) and normalized weight coefficients (N.W.) between 16 measures (M1 to M16) and preservation objectives (POB1–POB4).
| | POB1 | POB2 | POB3 | POB4 |
|---|
| | W. | N.W. | W. | N.W. | W. | N.W. | W. | N.W. |
|---|
| M1 | 4 | 0.14 | 3 | 0.09 | 3 | 0.10 | 1 | 0.03 |
| M2 | 4 | 0.14 | 1 | 0.03 | 2 | 0.06 | 3 | 0.10 |
| M3 | 2 | 0.07 | 4 | 0.12 | 3 | 0.10 | 0 | 0.00 |
| M4 | 3 | 0.10 | 2 | 0.06 | 2 | 0.06 | 2 | 0.06 |
| M5 | 3 | 0.10 | 3 | 0.09 | 2 | 0.06 | 1 | 0.03 |
| M6 | 4 | 0.14 | 4 | 0.12 | 4 | 0.13 | 0 | 0.00 |
| M7 | 1 | 0.03 | 4 | 0.12 | 4 | 0.13 | 0 | 0.00 |
| M8 | 3 | 0.10 | 3 | 0.09 | 2 | 0.06 | 1 | 0.03 |
| M9 | 1 | 0.03 | 3 | 0.09 | 3 | 0.10 | 1 | 0.03 |
| M10 | 2 | 0.07 | 3 | 0.09 | 3 | 0.10 | 1 | 0.03 |
| M11 | 2 | 0.07 | 3 | 0.09 | 3 | 0.10 | 1 | 0.03 |
| M12 | 0 | 0.00 | 0 | 0.00 | 0 | 0.00 | 4 | 0.13 |
| M13 | 0 | 0.00 | 0 | 0.00 | 0 | 0.00 | 4 | 0.13 |
| M14 | 0 | 0.00 | 0 | 0.00 | 0 | 0.00 | 4 | 0.13 |
| M15 | 0 | 0.00 | 0 | 0.00 | 0 | 0.00 | 4 | 0.13 |
| M16 | 0 | 0.00 | 0 | 0.00 | 0 | 0.00 | 4 | 0.13 |
Table 10.
Optimized implementation grades of the 16 fire protection measures for the six different FSI targets (F.A).
Table 10.
Optimized implementation grades of the 16 fire protection measures for the six different FSI targets (F.A).
| Measure | Cost per sq.m. | 0.48 (Initial) | 0.50 (0.50) | 0.60 (0.60) | 0.70 (0.70) | 0.80 (0.80) | 0.90 (0.90) | 1.00 (0.99) |
|---|
| M1 | 40 | 0.30 | 0.30 | 0.30 | 0.30 | 0.30 | 0.56 | 0.99 |
| M2 | 40 | 0.40 | 0.40 | 0.40 | 0.40 | 0.40 | 0.45 | 1.00 |
| M3 | 10 | 0.70 | 0.85 | 0.99 | 0.88 | 1.00 | 0.98 | 0.99 |
| M4 | 30 | 0.50 | 0.50 | 0.78 | 1.00 | 1.00 | 1.00 | 1.00 |
| M5 | 10 | 0.80 | 0.80 | 0.81 | 0.80 | 0.80 | 0.85 | 1.00 |
| M6 | 30 | 0.70 | 0.70 | 0.70 | 0.70 | 0.70 | 0.82 | 0.75 |
| M7 | 20 | 1.00 | 1.00 | 1.00 | 1.00 | 1.00 | 1.00 | 1.00 |
| M8 | 10 | 1.00 | 1.00 | 1.00 | 1.00 | 1.00 | 1.00 | 1.00 |
| M9 | 30 | 0.70 | 0.70 | 0.70 | 0.70 | 1.00 | 0.97 | 0.95 |
| M10 | 40 | 0.60 | 0.60 | 0.60 | 0.60 | 0.60 | 0.99 | 1.00 |
| M11 | 40 | 0.00 | 0.00 | 0.00 | 0.00 | 0.00 | 0.91 | 0.94 |
| M12 | 20 | 0.00 | 0.01 | 0.08 | 1.00 | 1.00 | 0.97 | 1.00 |
| M13 | 10 | 0.00 | 0.00 | 0.00 | 0.00 | 0.91 | 0.94 | 1.00 |
| M14 | 10 | 0.20 | 0.20 | 0.80 | 0.94 | 1.00 | 0.99 | 1.00 |
| M15 | 20 | 0.50 | 0.51 | 0.50 | 0.50 | 1.00 | 0.92 | 1.00 |
| M16 | 20 | 0.20 | 0.20 | 0.20 | 0.20 | 0.20 | 0.62 | 0.77 |
| Cost | > | 0.00 | 1587 | 17,694 | 40,639 | 68,160 | 136,103 | 178,774 |
| API | > | 0.00 | 0.02 | 0.05 | 0.05 | 0.09 | 0.24 | 0.33 |
Table 11.
Optimized implementation grades of the 16 fire protection measures for the six different cost targets (F.B).
Table 11.
Optimized implementation grades of the 16 fire protection measures for the six different cost targets (F.B).
| Measure | Cost per sq.m. | Present
Situation | 30,000 (26,430) | 60,000 (56,300) | 90,000 (84,512) | 120,000 (119,500) | 150,000 (127,280) | 180,000 (127,280) |
|---|
| M1 | 40 | 0.3 | 0.32 | 0.33 | 0.70 | 0.66 | 0.70 | 0.50 |
| M2 | 40 | 0.4 | 0.40 | 0.65 | 0.74 | 0.70 | 1.00 | 0.91 |
| M3 | 10 | 0.7 | 0.84 | 0.86 | 0.78 | 0.92 | 0.81 | 0.81 |
| M4 | 30 | 0.5 | 0.57 | 0.88 | 0.92 | 0.92 | 0.88 | 0.89 |
| M5 | 10 | 0.8 | 0.85 | 1.00 | 0.85 | 0.94 | 0.80 | 0.80 |
| M6 | 30 | 0.7 | 0.74 | 0.82 | 0.83 | 0.82 | 0.70 | 0.77 |
| M7 | 20 | 1.0 | 1.00 | 1.00 | 1.00 | 1.00 | 1.00 | 1.00 |
| M8 | 10 | 1.0 | 1.00 | 1.00 | 1.00 | 1.00 | 1.00 | 1.00 |
| M9 | 30 | 0.7 | 0.71 | 0.99 | 0.77 | 1.00 | 0.85 | 0.85 |
| M10 | 40 | 0.6 | 0.66 | 1.00 | 0.68 | 0.92 | 0.82 | 0.82 |
| M11 | 40 | 0.0 | 0.42 | 0.01 | 0.67 | 0.95 | 0.21 | 0.20 |
| M12 | 20 | 0.0 | 0.04 | 0.00 | 0.16 | 0.42 | 1.00 | 1.00 |
| M13 | 10 | 0.0 | 0.09 | 0.28 | 0.33 | 0.69 | 1.00 | 1.00 |
| M14 | 10 | 0.2 | 0.25 | 0.26 | 0.55 | 0.70 | 1.00 | 1.00 |
| M15 | 20 | 0.5 | 0.54 | 0.66 | 0.50 | 0.58 | 1.00 | 1.00 |
| M16 | 20 | 0.2 | 0.22 | 0.21 | 0.30 | 0.33 | 1.00 | 1.00 |
| FSI | > | 0.49 | 0.55 | 0.66 | 0.69 | 0.80 | 0.88 | 0.86 |
| API | > | 0 | 0.07 | 0.15 | 0.19 | 0.27 | 0.17 | 0.15 |
Table 12.
Optimized implementation grades of the 16 fire protection measures for the 10 denoted designs of
Figure 7.
Table 12.
Optimized implementation grades of the 16 fire protection measures for the 10 denoted designs of
Figure 7.
| | (1) | (2) | (3) | (4) | (5) | (6) | (7) | (8) | (9) | (10) |
|---|
| FSI Target | 0.60 | 0.60 | 0.70 | 0.70 | 0.80 | 0.80 | 0.90 | 0.90 | 0.99 | 0.99 |
|---|
| M1 | 0.30 | 0.30 | 0.30 | 0.30 | 0.30 | 0.30 | 0.30 | 0.56 | 0.96 | 0.96 |
| M2 | 0.40 | 0.40 | 0.40 | 0.40 | 0.44 | 0.44 | 0.99 | 0.97 | 0.96 | 0.96 |
| M3 | 0.70 | 0.98 | 0.70 | 0.98 | 0.98 | 0.99 | 0.99 | 1.00 | 1.00 | 1.00 |
| M4 | 0.50 | 0.50 | 0.50 | 0.57 | 1.00 | 1.00 | 1.00 | 1.00 | 1.00 | 1.00 |
| M5 | 0.80 | 0.80 | 0.80 | 0.80 | 0.80 | 0.80 | 0.86 | 0.98 | 0.99 | 0.99 |
| M6 | 0.70 | 0.70 | 0.70 | 0.70 | 0.70 | 0.70 | 0.70 | 0.70 | 0.60 | 0.90 |
| M7 | 1.00 | 1.00 | 1.00 | 1.00 | 1.00 | 1.00 | 1.00 | 1.00 | 0.30 | 0.30 |
| M8 | 1.00 | 1.00 | 1.00 | 1.00 | 1.00 | 1.00 | 1.00 | 1.00 | 1.00 | 1.00 |
| M9 | 0.70 | 0.70 | 0.70 | 0.70 | 0.73 | 0.96 | 0.99 | 0.98 | 0.96 | 0.96 |
| M10 | 0.60 | 0.60 | 0.60 | 0.60 | 0.60 | 0.60 | 0.99 | 0.97 | 1.00 | 0.99 |
| M11 | 0.00 | 0.00 | 0.00 | 0.00 | 0.00 | 0.00 | 0.00 | 0.00 | 0.69 | 0.44 |
| M12 | 0.70 | 0.38 | 1.00 | 1.00 | 1.00 | 1.00 | 1.00 | 1.00 | 1.00 | 1.00 |
| M13 | 0.00 | 0.00 | 1.00 | 0.03 | 1.00 | 0.98 | 1.00 | 0.98 | 0.99 | 0.99 |
| M14 | 1.00 | 0.94 | 1.00 | 1.00 | 1.00 | 1.00 | 1.00 | 1.00 | 1.00 | 1.00 |
| M15 | 0.50 | 0.50 | 0.98 | 0.98 | 1.00 | 1.00 | 1.00 | 1.00 | 1.00 | 1.00 |
| M16 | 0.20 | 0.20 | 0.87 | 0.20 | 0.98 | 0.20 | 0.97 | 0.20 | 0.76 | 0.76 |
| API | 0.00 | 0.03 | 0.00 | 0.04 | 0.07 | 0.09 | 0.16 | 0.20 | 0.32 | 0.33 |
| Cost | 20,228 | 16,343 | 56,136 | 39,495 | 77,166 | 68,858 | 119,329 | 113,872 | 180,170 | 175,950 |
Table 13.
Optimized implementation grades of the 16 fire protection measures for the 10 different FSI targets (F.A).
Table 13.
Optimized implementation grades of the 16 fire protection measures for the 10 different FSI targets (F.A).
| Measure | Cost per sq.m. | 0.53 (Initial) | 0.55 (0.55) | 0.60 (0.60) | 0.65 (0.65) | 0.70 (0.70) | 0.75 (0.75) | 0.80 (0.80) | 0.85 (0.88) | 0.90 (0.91) | 0.95 (0.95) | 0.999 (0.999) |
|---|
| M1 | 40 | 0.30 | 0.30 | 0.30 | 0.30 | 0.30 | 0.30 | 0.30 | 0.42 | 0.86 | 0.98 | 1.00 |
| M2 | 40 | 0.30 | 0.30 | 0.30 | 0.30 | 0.30 | 0.30 | 0.30 | 0.67 | 0.74 | 1.00 | 1.00 |
| M3 | 10 | 0.60 | 0.81 | 1.00 | 1.00 | 1.00 | 1.00 | 1.00 | 0.96 | 1.00 | 0.94 | 1.00 |
| M4 | 30 | 0.60 | 0.60 | 0.60 | 0.60 | 0.60 | 1.00 | 1.00 | 0.98 | 0.92 | 0.91 | 1.00 |
| M5 | 10 | 0.50 | 0.50 | 0.90 | 1.00 | 1.00 | 1.00 | 1.00 | 0.91 | 0.97 | 0.99 | 1.00 |
| M6 | 30 | 0.60 | 0.60 | 0.60 | 0.60 | 0.60 | 0.60 | 0.60 | 0.84 | 0.78 | 0.64 | 0.99 |
| M7 | 20 | 0.30 | 0.30 | 0.30 | 0.30 | 0.30 | 0.30 | 0.30 | 0.78 | 0.71 | 0.90 | 1.00 |
| M8 | 10 | 0.20 | 0.20 | 0.20 | 0.79 | 1.00 | 1.00 | 1.00 | 0.90 | 0.99 | 1.00 | 1.00 |
| M9 | 30 | 0.60 | 0.60 | 0.60 | 0.60 | 0.60 | 0.69 | 0.99 | 1.00 | 0.81 | 0.99 | 1.00 |
| M10 | 40 | 0.50 | 0.50 | 0.50 | 0.50 | 0.50 | 0.50 | 0.55 | 0.94 | 0.97 | 0.99 | 1.00 |
| M11 | 40 | 0.00 | 0.00 | 0.00 | 0.00 | 0.00 | 0.00 | 0.00 | 0.79 | 0.96 | 0.95 | 1.00 |
| M12 | 20 | 0.90 | 0.90 | 0.90 | 0.90 | 0.90 | 1.00 | 1.00 | 0.96 | 0.98 | 0.96 | 1.00 |
| M13 | 10 | 0.50 | 0.50 | 0.50 | 0.50 | 0.50 | 1.00 | 1.00 | 0.84 | 0.95 | 0.92 | 1.00 |
| M14 | 10 | 0.90 | 0.90 | 0.90 | 0.90 | 0.98 | 1.00 | 1.00 | 0.99 | 0.97 | 0.99 | 1.00 |
| M15 | 20 | 0.60 | 0.60 | 0.60 | 0.60 | 1.00 | 0.60 | 1.00 | 0.84 | 0.88 | 0.98 | 1.00 |
| M16 | 20 | 0.40 | 0.40 | 0.40 | 0.40 | 0.40 | 0.40 | 0.40 | 0.73 | 0.57 | 0.74 | 0.99 |
| Cost | > | 0.00 | 15,049 | 55,421 | 104,984 | 180,315 | 277,370 | 409,322 | 984,505 | 1,110,830 | 1,287,804 | 1,473,340 |
| API | > | 0.00 | 0.02 | 0.06 | 0.11 | 0.14 | 0.18 | 0.21 | 0.38 | 0.43 | 0.48 | 0.55 |
Table 14.
Optimized implementation grades of the 16 fire protection measures for the 10 different cost targets (F.B).
Table 14.
Optimized implementation grades of the 16 fire protection measures for the 10 different cost targets (F.B).
| Measure | Cost per sq.m. | 0.00 (Initial) | 150,000 (145,156) | 300,000 (237,524) | 450,000 (375,194) | 600,000 (565,171) | 750,000 (743,845) | 900,000 (886,958) | 1,050,000 (1,032,732) | 1,200,000 (1,173,260) | 1,350,000 (622,736) | 1,500,000 (654,392) |
|---|
| M1 | 40 | 0.30 | 0.30 | 0.31 | 0.39 | 0.64 | 0.52 | 0.55 | 0.86 | 0.96 | 0.42 | 0.42 |
| M2 | 40 | 0.30 | 0.70 | 0.30 | 0.47 | 0.30 | 0.64 | 0.64 | 0.73 | 0.99 | 0.68 | 0.69 |
| M3 | 10 | 0.60 | 0.70 | 0.60 | 0.95 | 0.85 | 0.84 | 0.97 | 0.96 | 0.92 | 0.84 | 0.84 |
| M4 | 30 | 0.60 | 0.61 | 0.64 | 0.78 | 0.80 | 0.75 | 0.95 | 0.84 | 0.97 | 0.84 | 0.84 |
| M5 | 10 | 0.50 | 0.68 | 0.69 | 0.77 | 0.87 | 0.83 | 0.87 | 0.87 | 0.56 | 0.82 | 0.81 |
| M6 | 30 | 0.60 | 0.60 | 0.60 | 0.82 | 0.60 | 0.78 | 0.80 | 0.81 | 0.96 | 0.75 | 0.68 |
| M7 | 20 | 0.30 | 0.31 | 0.31 | 0.36 | 0.31 | 0.85 | 0.76 | 0.74 | 0.91 | 0.69 | 0.30 |
| M8 | 10 | 0.20 | 0.21 | 0.26 | 0.36 | 0.31 | 0.28 | 0.59 | 0.56 | 0.60 | 0.77 | 0.78 |
| M9 | 30 | 0.60 | 0.61 | 0.87 | 0.63 | 0.77 | 0.79 | 0.81 | 0.92 | 0.94 | 0.83 | 0.83 |
| M10 | 40 | 0.50 | 0.50 | 0.73 | 0.76 | 0.93 | 0.99 | 0.99 | 0.92 | 0.95 | 0.75 | 0.73 |
| M11 | 40 | 0.00 | 0.00 | 0.04 | 0.11 | 0.66 | 0.49 | 0.64 | 0.87 | 0.70 | 0.05 | 0.43 |
| M12 | 20 | 0.90 | 0.90 | 0.90 | 0.97 | 0.97 | 0.95 | 0.94 | 0.98 | 0.99 | 1.00 | 1.00 |
| M13 | 10 | 0.50 | 0.51 | 0.99 | 0.75 | 0.59 | 0.69 | 0.67 | 0.80 | 0.75 | 0.73 | 0.73 |
| M14 | 10 | 0.90 | 0.90 | 0.92 | 0.96 | 0.93 | 1.00 | 0.99 | 0.93 | 0.98 | 1.00 | 1.00 |
| M15 | 20 | 0.60 | 0.64 | 0.60 | 0.68 | 0.74 | 0.76 | 0.94 | 0.83 | 1.00 | 1.00 | 1.00 |
| M16 | 20 | 0.40 | 0.42 | 0.70 | 0.45 | 0.41 | 0.68 | 0.60 | 0.63 | 0.54 | 0.68 | 0.68 |
| FSI | > | 0.53 | 0.58 | 0.61 | 0.69 | 0.73 | 0.75 | 0.84 | 0.85 | 0.88 | 0.78 | 0.79 |
| API | > | 0 | 0.06 | 0.08 | 0.16 | 0.20 | 0.27 | 0.34 | 0.38 | 0.42 | 0.25 | 0.25 |
Table 15.
Optimized implementation grades of the 16 fire protection measures for the 10 denoted designs of
Figure 20.
Table 15.
Optimized implementation grades of the 16 fire protection measures for the 10 denoted designs of
Figure 20.
| | (1) | (2) | (3) | (4) | (5) | (6) | (7) | (8) | (9) | (10) |
|---|
FSI
(Target) | 0.55 | 0.55 | 0.60 | 0.60 | 0.65 | 0.65 | 0.70 | 0.70 | 0.75 | 0.75 |
|---|
| M1 | 0.30 | 0.30 | 0.30 | 0.30 | 0.30 | 0.30 | 0.30 | 0.30 | 0.30 | 0.30 |
| M2 | 0.30 | 0.30 | 0.30 | 0.30 | 0.30 | 0.30 | 0.30 | 0.30 | 0.30 | 0.30 |
| M3 | 0.63 | 0.80 | 0.62 | 1.00 | 0.99 | 1.00 | 1.00 | 1.00 | 1.00 | 1.00 |
| M4 | 0.60 | 0.60 | 0.89 | 0.60 | 0.99 | 0.60 | 0.90 | 0.74 | 0.99 | 0.98 |
| M5 | 0.50 | 0.50 | 0.50 | 0.50 | 0.50 | 0.70 | 0.54 | 0.95 | 0.63 | 0.98 |
| M6 | 0.60 | 0.60 | 0.60 | 0.60 | 0.60 | 0.60 | 0.60 | 0.60 | 0.60 | 0.60 |
| M7 | 0.30 | 0.30 | 0.30 | 0.30 | 0.30 | 0.30 | 0.30 | 0.30 | 0.30 | 0.30 |
| M8 | 0.20 | 0.20 | 0.20 | 0.48 | 0.20 | 0.89 | 0.84 | 0.98 | 0.99 | 0.98 |
| M9 | 0.60 | 0.60 | 0.60 | 0.60 | 0.60 | 0.60 | 0.60 | 0.60 | 0.87 | 0.61 |
| M10 | 0.50 | 0.50 | 0.50 | 0.50 | 0.50 | 0.50 | 0.50 | 0.50 | 0.55 | 0.50 |
| M11 | 0.00 | 0.00 | 0.00 | 0.00 | 0.00 | 0.00 | 0.00 | 0.00 | 0.00 | 0.00 |
| M12 | 0.95 | 0.90 | 0.96 | 0.91 | 0.96 | 0.91 | 0.99 | 0.97 | 1.00 | 1.00 |
| M13 | 0.50 | 0.50 | 0.50 | 0.50 | 0.50 | 0.50 | 0.50 | 0.50 | 0.50 | 0.50 |
| M14 | 1.00 | 0.90 | 1.00 | 0.99 | 1.00 | 0.99 | 1.00 | 1.00 | 1.00 | 1.00 |
| M15 | 0.75 | 0.60 | 0.98 | 0.60 | 0.90 | 0.65 | 0.99 | 0.71 | 1.00 | 0.98 |
| M16 | 0.40 | 0.40 | 0.40 | 0.40 | 0.40 | 0.40 | 0.40 | 0.40 | 0.40 | 0.40 |
| API | 0.01 | 0.02 | 0.04 | 0.05 | 0.07 | 0.10 | 0.12 | 0.14 | 0.16 | 0.16 |
| Cost | 39,982 | 14,109 | 129,704 | 54,594 | 167,032 | 105,756 | 213,875 | 175,719 | 319,978 | 270,172 |


