Article

Cross-Regional Deep Learning for Air Quality Forecasting: A Comparative Study of CO, NO2, O3, PM2.5, and PM10

1
School of Engineering, Newcastle University, Newcastle upon Tyne NE1 7RU, UK
2
School of Computing, Newcastle University, Newcastle upon Tyne NE1 7RU, UK
*
Author to whom correspondence should be addressed.
Forecasting 2025, 7(4), 66; https://doi.org/10.3390/forecast7040066
Submission received: 26 May 2025 / Revised: 15 October 2025 / Accepted: 17 October 2025 / Published: 5 November 2025
(This article belongs to the Section Environmental Forecasting)

Abstract

Accurately forecasting air quality could lead to the development of dynamic, data-driven policy-making and improved early warning detection systems. Deep learning has demonstrated the potential to produce highly accurate forecasting models, but it is noted that much literature focuses on narrow datasets and typically considers one geographic area. In this research, three diverse air quality datasets are utilised to evaluate four deep learning algorithms, which are feedforward neural networks, Long Short-Term Memory (LSTM) recurrent neural networks, DeepAR and Temporal Fusion Transformers (TFTs). The study uses these modules to forecast CO, NO2, O3, and particulate matter 2.5 and 10 (PM2.5, PM10) individually, producing a 24 h forecast for a given sensor and pollutant. Each model is optimised using a hyperparameter and a feature selection process, evaluating the utility of exogenous data such as meteorological data, including wind speed and temperature, along with the inclusion of other pollutants. The findings show that the TFT and DeepAR algorithms achieve superior performance over their simpler counterparts, though they may prove challenging in practical applications. It is noted that while some covariates such as CO are important covariates for predicting NO2 across all three datasets, other parameters such as context length proved inconsistent across the three areas, suggesting that parameters such as context length are location and pollutant specific.

1. Introduction

Poor air quality is currently considered the leading cause of premature deaths, with the World Health Organisation (WHO) attributing over 6.7 million premature deaths each year to ambient air pollution [1]. This is primarily due to the long-term effects of being exposed to air pollutants, which can lead to various illnesses such as respiratory diseases [2,3,4,5], cardiovascular diseases [6,7,8,9], and various forms of cancer [10,11,12,13]. The WHO periodically releases air quality guidelines, with governments and local authorities typically using the WHO’s research, in conjunction with their own, to determine daily and annual exposure limits. Governments and councils typically then employ systems and policies to prevent these limits from being exceeded. While this approach has provided an ongoing solution to reducing the exposure to poor air quality, it is proposed that the use of Internet of Things (IoT), Artificial Intelligence (AI) and Smart City technologies can improve air quality management by monitoring and also forecasting future air pollution.
Understanding air quality patterns is one aspect of air quality management in urban areas, and much literature has been written on how to best understand spatio-temporal characteristics of air quality in local regions. While this understanding aids in better air quality management through the identification of local spatio-temporal patterns, we suggest that the next natural step is to use this information, in addition to local air quality feeds from IoT sensors, as a method of not only understanding current air quality conditions but also forecasting them into the near future. These forecasts, if accurate enough, could provide methods of improved air quality management through dynamic, data-driven policies such that different restrictions can be enforced based on forecasts. Not only this, but these forecasting systems may also prove useful in healthcare management by notifying hospitals of potential spikes in emergency cases and sufferers of respiratory-based illnesses that they are more likely to be affected by upcoming pollution.
To achieve the above, accurate air quality forecasting models must be developed, and there exists much literature on the subject, with surveys such as [14,15] covering the progress in much depth. While this literature paves the way forward and helps to understand how we may use deep learning to achieve accurate forecasts, it is noted that much of this literature focuses on a select few areas, with common datasets being utilised. Questions surrounding data quality and availability are in need of answering to determine the optimal distribution and quality of sensors needed to achieve such high accuracy.
Beyond data-driven approaches, traditional air quality forecasting has long relied on process-based chemical transport models (CTMs) such as CMAQ, CAMx, and WRF-Chem. These models solve coupled atmospheric dynamics and chemistry with detailed reaction mechanisms, meteorology, and boundary conditions, and they remain the backbone for policy evaluation because they are physically interpretable and scenario-ready (e.g., emissions or control strategies). However, they require high-quality emissions inventories and meteorological inputs, substantial pre-processing, and significant computational resources for routine forecasting or high-resolution urban applications [16].
Alongside CTMs, empirical/statistical approaches—including land-use regression (LUR), kriging, and time-series methods such as ARIMA/GAM—offer lighter-weight alternatives that leverage historical observations and static spatial descriptors. Recent work comparing LUR with modern machine learning (ML) shows that ML methods often achieve higher spatiotemporal accuracy for pollutants like ozone when rich covariates are available [17]. Emerging hybrid paradigms also integrate ML with process knowledge (e.g., large-eddy simulation or urban morphology) to improve fine-scale predictions, further blurring the boundary between physics-based and data-driven approaches [18]. Within this landscape, our study focuses on deep learning forecasters (FNN, LSTM, DeepAR, and TFT) and evaluates their behaviour across multiple regions, emphasising generalisability, probabilistic outputs, and practical configuration choices.
While many existing studies have demonstrated the potential of deep learning for air quality forecasting, most have focused on a single city or region, often using a single dataset. This narrow focus limits the generalisability and robustness of their findings, as models optimised for one geographic and environmental context may perform poorly when deployed elsewhere. In contrast, this study deliberately evaluates forecasting models across three regions that differ significantly in spatial scale, pollutant dynamics, meteorological conditions, and sensor network characteristics. This cross-context evaluation allows us to investigate how model performance, optimal configuration, and feature relevance vary across environments, providing insights that cannot be gained from single-region studies. Moreover, the inclusion of models such as the DeepAR algorithm introduces a probabilistic perspective, enabling the quantification of forecast uncertainty and providing richer information for decision-making in dynamic policy and management contexts. Together, these contributions aim to advance the development of forecasting systems that are not only accurate but also robust and transferable across diverse real-world conditions.
Building on this landscape, this research explores questions of spatial distribution and data quality using three diverse datasets covering Taiwan, Beijing, and Newcastle upon Tyne, the United Kingdom. All three datasets capture data on PM2.5, PM10, CO, O3, and NO2 across the three regions, as well as capturing meteorological data, which is an important element in air-quality forecasting [19,20]. Four deep learning models are utilised in the study, which are Multilayer Perceptron (MLP), Long-Short Term Memory (LSTM) recurrent neural network, DeepAR and Temporal Fusion Transformer (TFT). Each model is thoroughly explored via hyperparameter tuning and feature selection, looking to find the optimal configuration for forecasting along with determining common behaviour amongst all experiments.
The remainder of the paper is as follows: Section 2, Related Work, provides an overview of the related literature, providing a review of the current state of the art in air quality forecasting, Section 3, Materials and Methods, provides details on the datasets utilised, experiment configurations and evaluation metrics. Section 4, Results, provides the results achieved during the experiment, and Section 5, Discussion, provides a detailed discussion on the results achieved along with the experiment configurations and how this may be improved upon. Finally, Section 6, Conclusions, provides a final review of the research and directions for further work.

2. Related Work

Much attention has already been dedicated to the use of deep learning techniques to forecast air quality, with the complexity of models increasing over time with the advent of new and more advanced algorithms. The feedforward neural network (FNN), also referred to as the multilayer perceptron (MLP), has been used in many studies to produce forecasts. Agirre-Basurko et al. use an FNN to forecast hourly O3 and NO2 levels 8 h ahead in Bilbao, Spain [21], Corani analyses the use of FNN in predicting O3 and PM10 to predict the daily concentration in Milan [22]; Cabaneros et al. utilise FNN for predicting NO2 concentrations at a single point 24 h ahead [23]; Caselli demonstrates the use of FNN to predict daily PM10 concentrations up to three days early [24]. While FNNs have demonstrated forecasting abilities in the literature, more advanced algorithms have been utilised, which incorporate inductive biases to increase accuracy by accounting for the temporal domain. Cordova et al. compare the FNN and the long short-term memory (LSTM-RNN) recurrent neural network in forecasting hourly PM10 in Peru, showcasing that the LSTM achieved increased accuracy over the FNN [25]. Tsai et al. demonstrate the use of LSTM in predicting PM2.5 in Taiwan, suggesting that the LSTM is capable of predicting the value across the region. Das et al. compare FNN, RNN and LSTM in predicting PM10 and SO2 in Istanbul and show that the LSTM achieves the best forecasting accuracy [26]. Although LSTM remains the standard for time series forecasting, more recent additions to recurrent-based methods have been proposed and have demonstrated improved accuracy. One example algorithm is the DeepAR algorithm, which builds upon the LSTM-RNN. In their research, Shihab et al. demonstrate the use of DeepAR in forecasting PM2.5, showing that the algorithm achieved higher accuracy than LSTM and CNN methods [27], Jiang et al. utilise DeepAR in their research showcases how the algorithm was optimised using the Sparrow Search Algorithm (SSA) to achieve high forecasting accuracy, though alternative backbone models are not compared, focusing only on the optimisation of the algorithm [28]. While recurrent neural networks have been shown to achieve increased accuracy compared to simpler FNNs, one notable limitation in recurrent-based methods is the fixed-size embedding, which is updated on each timestep when processing the input data. This results in the network struggling to maintain historic information as the number of timesteps increase.
Attention, first proposed by Bahdanau et al. in [29] and further developed by Vaswani et al. in [30], provides an alternative to recurrent approaches like LSTMs by allowing the model to compare and weigh all previous steps simultaneously. This enables the model to compute relationships between different parts of the input sequence in parallel, reducing the bottlenecks associated with recurrent architectures and allowing the model to dynamically focus on relevant parts of the input, improving the handling of long-range dependencies. While there exist multiple algorithms incorporating attention mechanisms, with the most commonly known being used on natural language processing (NLP), algorithms have also been developed that utilise attention to focus primarily on forecasting problems. Examples include Zhu et al.’s research [31] in exploring the use of Temporal Fusion Transformer (TFT) in creating regional air quality forecasts for PM2.5 using LSTMs and TFT. Zhu et al. compare the accuracy against LSTMs and show TFT to exceed the accuracy of accuracy when forecasting PM2.5. Zhang et al. utilise attention-based transformers to forecast PM2.5 in Beijing and Taizhou, showing that their sparse attention-based models outperform the state-of-the-art models [32]. This research builds upon the current literature by evaluating well-known forecasting approaches using well-established methods such as MLP and LSTM and compares them against more complex forecasting algorithms, which are DeepAR and Temporal Fusion Transformer. The research builds upon the previous literature by evaluating these models against three diverse datasets and explores the use of exogenous data as optional inputs for the models.

3. Materials and Methods

3.1. Datasets

This study utilises three distinct air quality datasets from Taiwan, Beijing, and Newcastle upon Tyne, each offering unique insights into the spatio-temporal characteristics of air pollution across different geographic scales, environmental contexts, and sensor types. These three regions were deliberately selected to represent a diverse range of urban environments and pollution conditions. Beijing exemplifies a highly industrialised megacity with frequent severe pollution episodes, Taiwan offers a mix of coastal and urban environments characterised by strong seasonal dynamics, and Newcastle provides a contrasting low-pollution context with a dense sensor network in a mild climate. This diversity enables a broader evaluation of forecasting model behaviour across heterogeneous conditions, enhancing the generalisability and robustness of the findings.

3.1.1. Taiwan Dataset

The first dataset utilised in this research is a Taiwanese air quality dataset. Initially, the dataset included data from over 80 sensors for the period between December 2016 and December 2021; however, the dataset was refined by selecting 69 sensors and narrowing the timeframe to January 2019 to December 2019. The selected sensors were chosen based on data availability, with a filtering criterion requiring each sensor to have at least 80% data coverage for the specific timeframe. This specific timeframe was chosen to limit the amount of data while ensuring that an entire annual cycle was captured, as it is well-documented in the literature that air quality often follows an annual seasonal pattern [33,34]. This approach was also applied consistently to all three datasets to ensure that the selected timeframes captured a complete annual cycle of air quality dynamics, including seasonal variations and representative emission patterns for each region. Although sulphur dioxide (SO2) was available in some regional datasets, it was excluded from the main analysis to maintain consistency and comparability across all three study areas.
Additional data processing was required for the Taiwanese dataset due to CO, NO2, and O3 being recorded in parts per billion (PPB), rather than micrograms per cubic meter (µg/m3). A conversion factor of 1.15, 1.88, and 1.96 was applied to convert the measurements of PPB to µg/m3, respectively, standardising the unit of measure across the study.
The locations of the chosen 69 air quality sensors are illustrated in Figure 1, which shows that a significant portion of the sensors are positioned on the west coast of the island, reflecting the population density and industrial activities in that region.

3.1.2. Beijing Dataset

The second air quality dataset focuses on the Beijing region, a densely populated area known for its significant industrialisation, which contributes to elevated emission levels due to numerous factories burning fossil fuels and extensive transportation networks. Not only this, but Beijing’s geographical location exacerbates pollution issues, as the city is surrounded by mountains, causing air pollutants to become trapped within the area.
The Beijing dataset was refined using the same basic filtering process as applied to the Taiwanese data. Specifically, the timeframe between January 2017 and December 2017 was chosen for the annual cycle, and sensors were selected only if they had at least 80% data availability for that period. Since all sensors in the Beijing dataset recorded pollutant levels in µg/m3, no conversion was required.
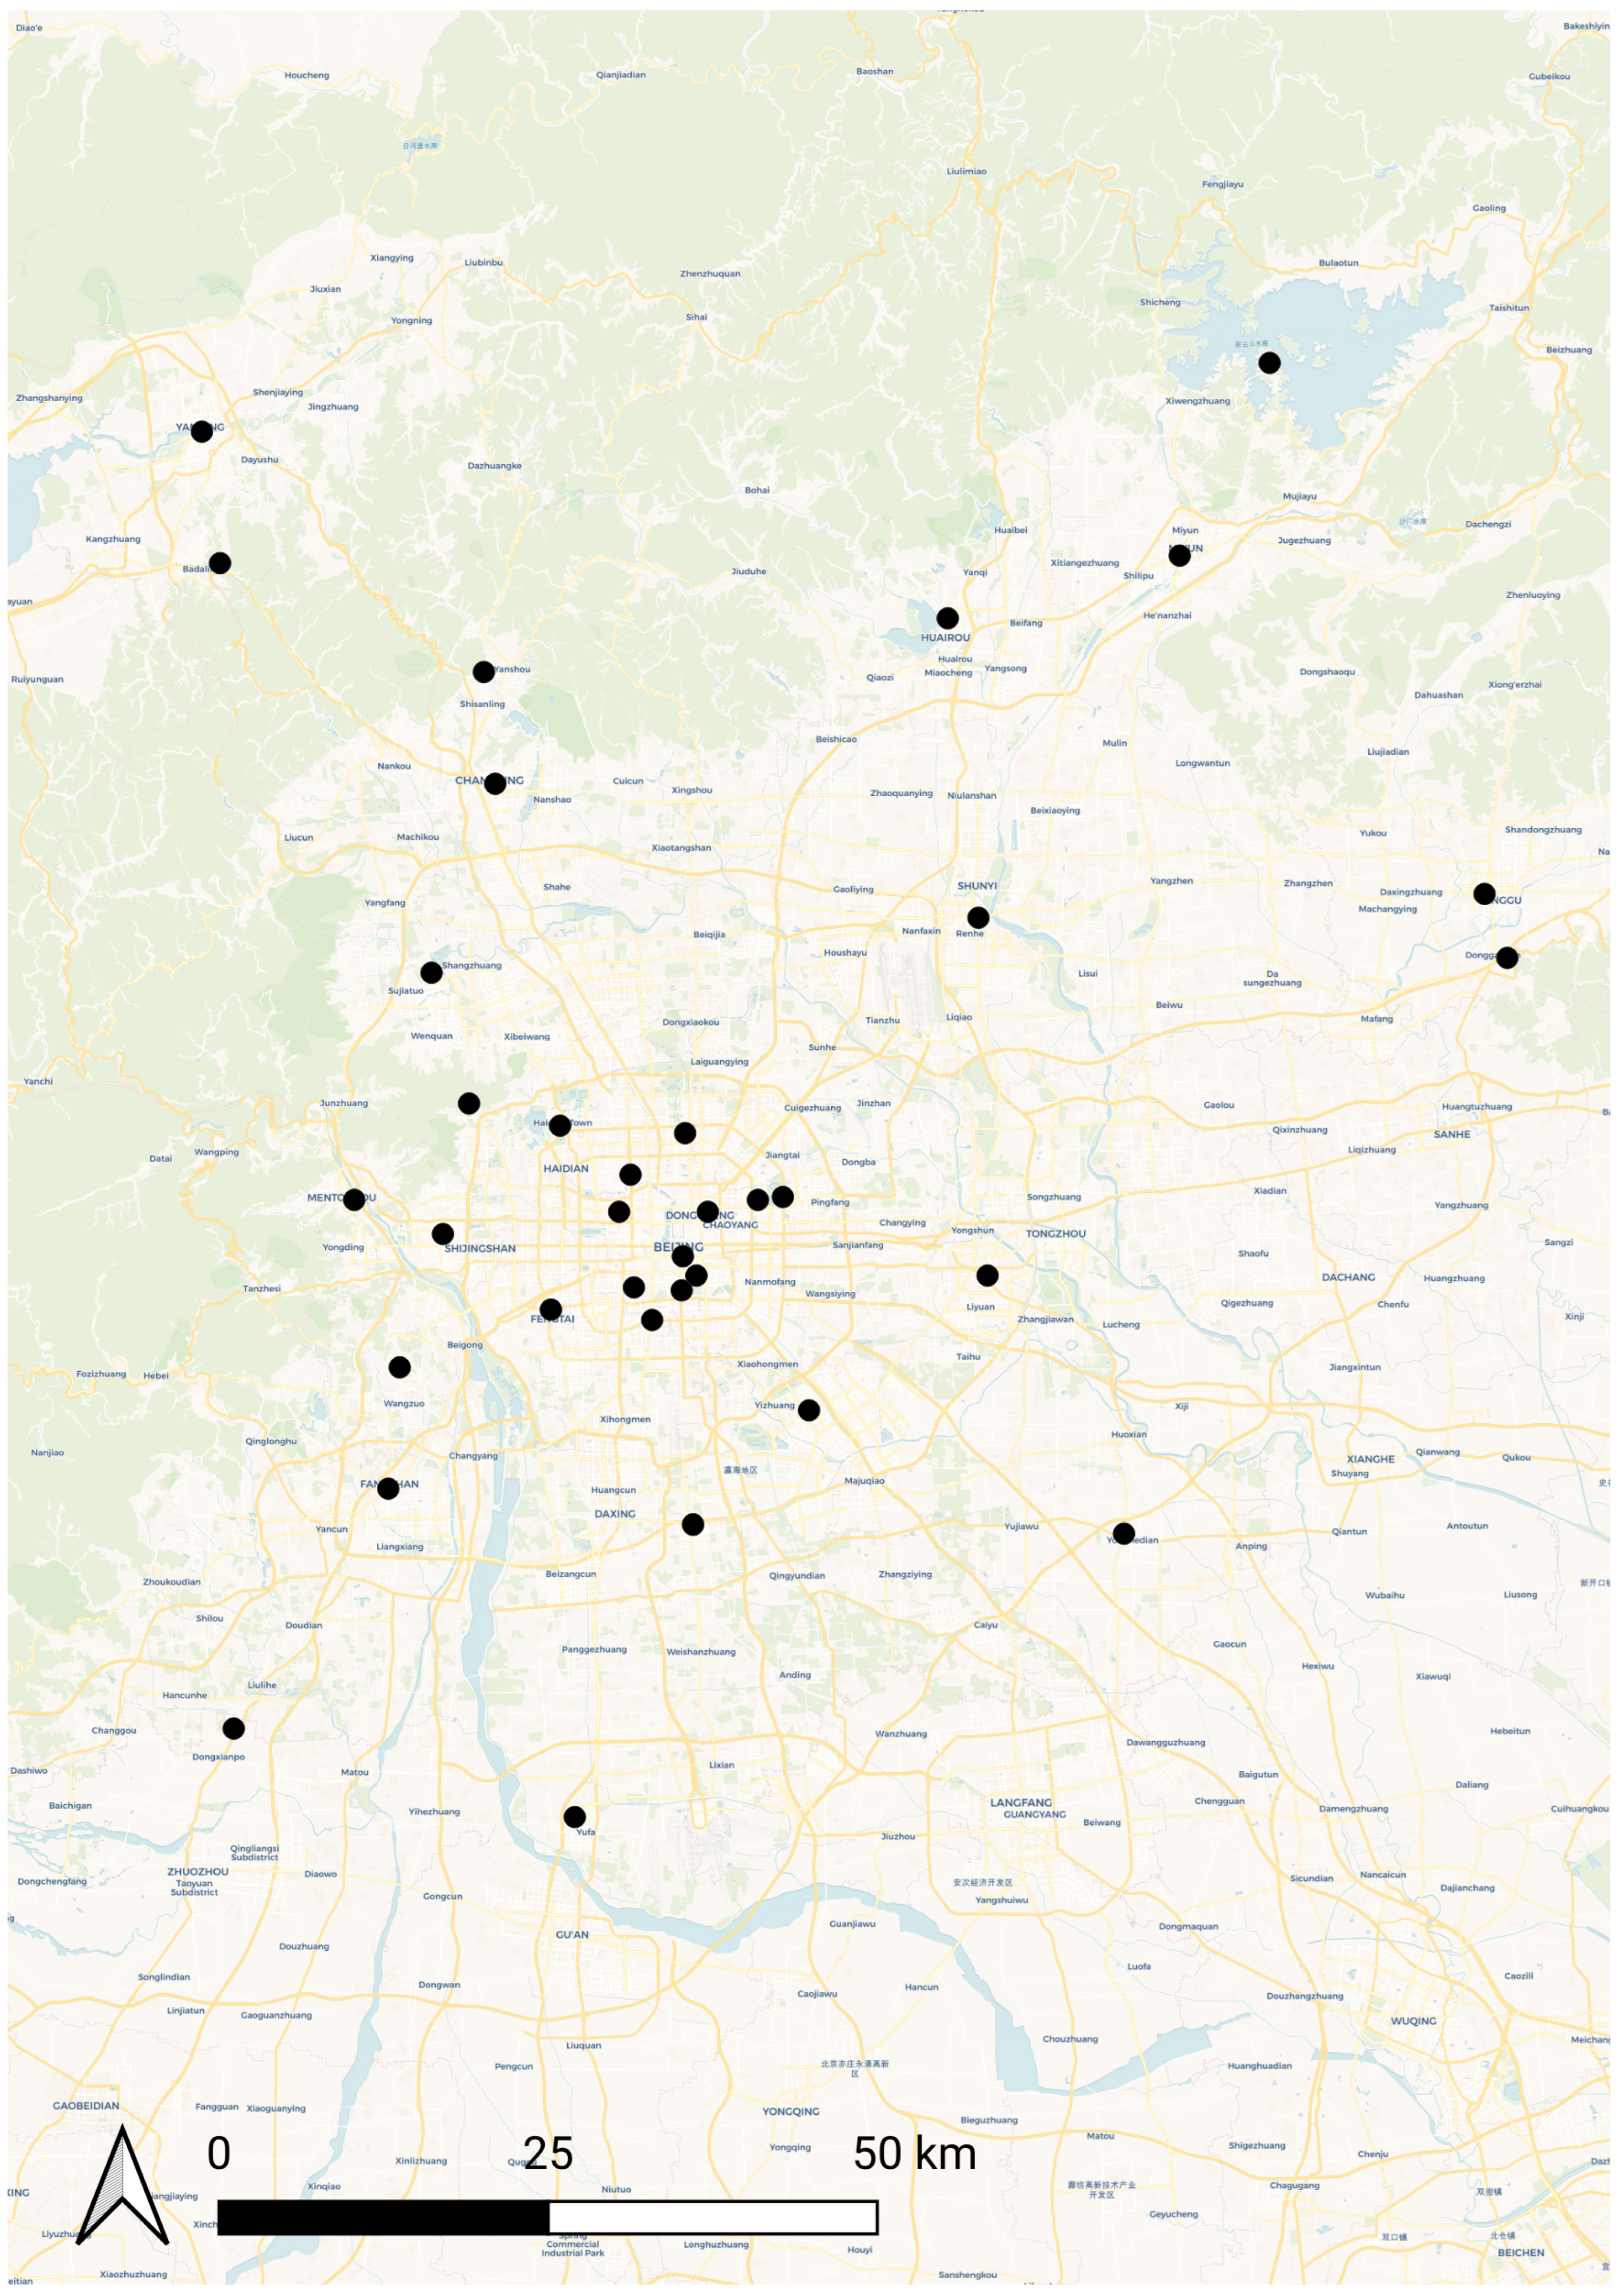
After this refinement process, 35 sensors were selected for analysis, which is illustrated in Figure 2. This figure highlights that the central area of Beijing has a high concentration of sensors, with sensor density gradually decreasing as the distance from the centre increases.

3.1.3. Newcastle upon Tyne Dataset

The final dataset covers the city of Newcastle upon Tyne, situated in the northeast of England. Since 2013, Newcastle has become progressively more ‘smart’ due to the deployment of over 200 sensors across the city by the Urban Observatory at Newcastle University (UO) [35]. This dataset offers a microscopic, higher-spatial-resolution view of air quality compared to the other datasets.
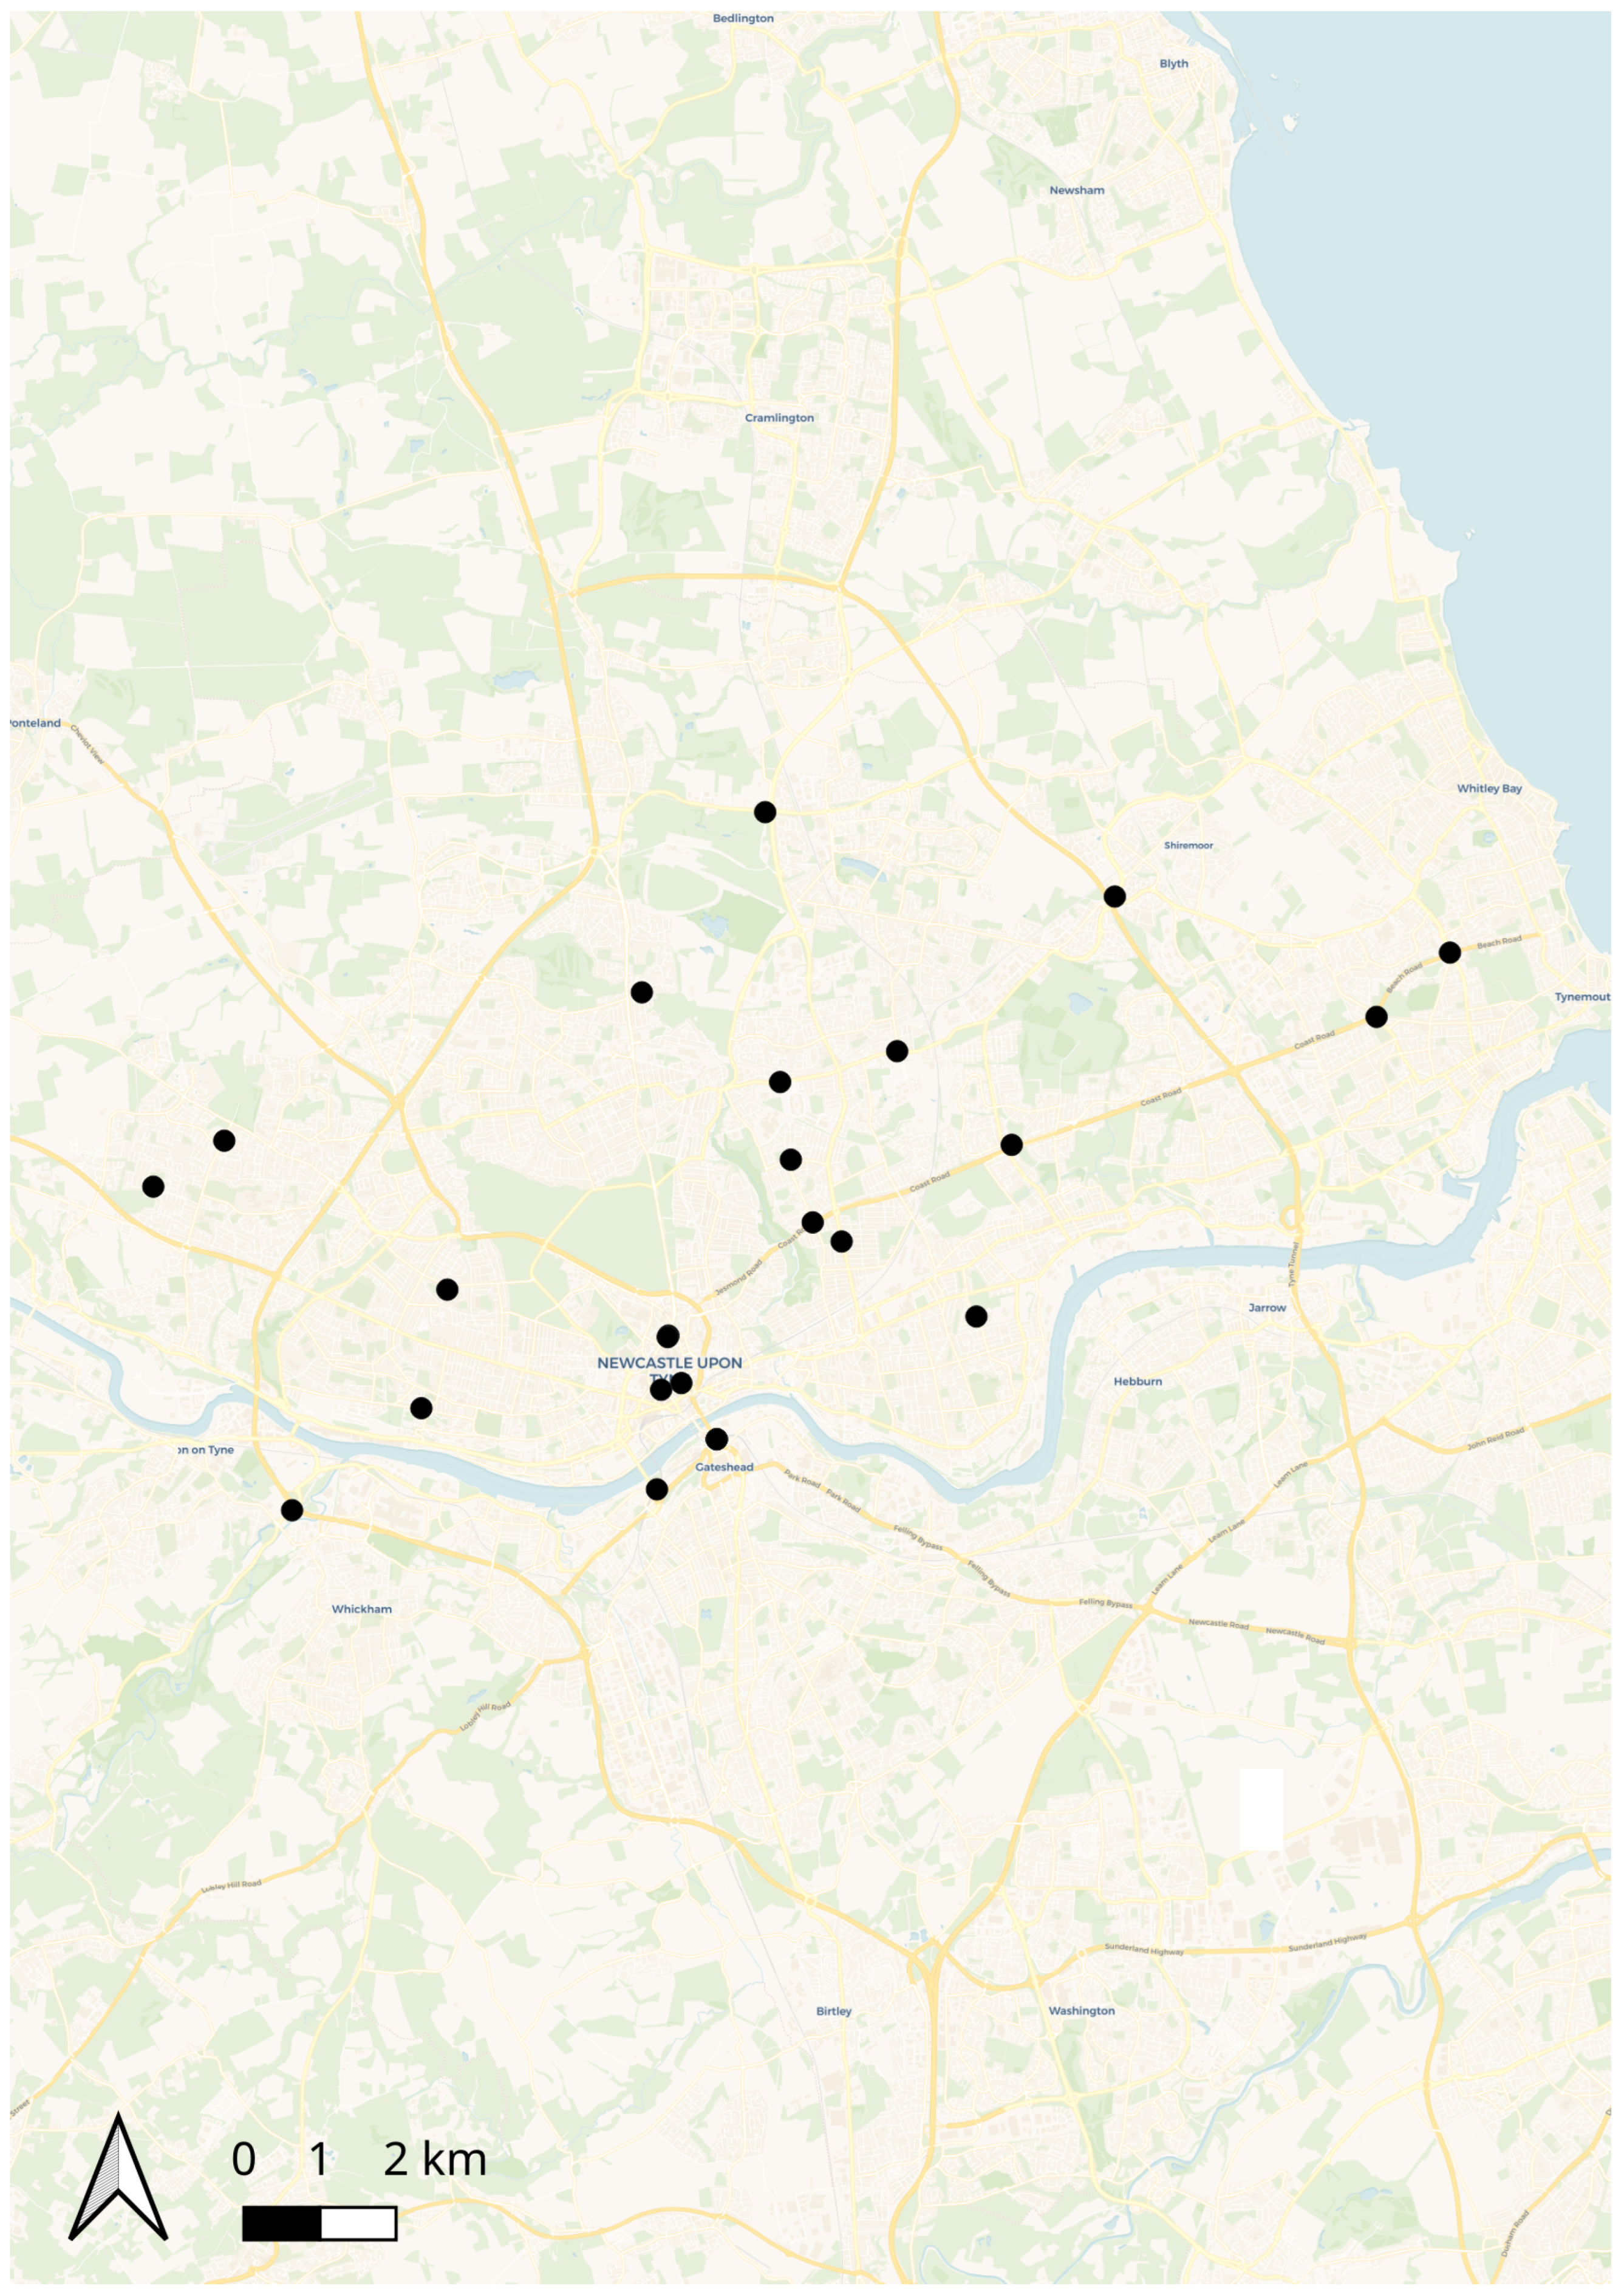
The air quality data was sourced from the UO data API, and although datasets are available for the period between 2013 and 2024, the year 2022 was selected for this study. This choice was based on the increasing number of sensors available for each year and the corresponding data availability. The annual air quality dataset for 2022 was filtered using the same process as applied to the Taiwanese and Beijing datasets, requiring that each sensor have at least 80% data availability. As all measurements were recorded in µg/m3, no conversions were required. After the filtering process, the resulting dataset comprised 25 sensors, covering an area of 87 km2, which are shown in Figure 3.

3.1.4. Data Pre-Processing

Although each dataset was initially filtered based on data availability, further pre-processing was necessary to ensure that all time series were complete and sampled at a uniform rate. This was achieved by resampling each sensor time series at an hourly interval, and if more than one data point was available for that hour, the mean value was calculated to represent that hour. This resampling was crucial, as not all sensors operated at the same sampling rate, with some recording data at minute-based intervals and others sampling from 15 min to one-hour intervals. This difference in sampling rates was most evident in the UO dataset. It is important to note that the maximum sampling rate for all sensors used in the study was one-hour intervals, therefore making it a sensible baseline to which all sensors could be resampled. Additionally, it is argued that an hourly-based sampling rate provides enough granularity to expose the unique characteristics of the air quality in each area while reducing the inherent noise in the datasets.
Following the resampling process, it was observed that some sensors still exhibited missing data, though the amount of missing data was less than 20%, with the majority of sensors having at least 90% available. While previous studies have employed various data imputation techniques, such as using the mean value of the series and linear interpolation methods, this study adopted an imputation approach based on using the previous week’s data at the same hour. This method was chosen, as it is suggested that using the data from the previous week, depending on availability, at the same hour of the day is likely to be more representative than large-scale averaging techniques.
Table 1 highlights the difference in spatial scale and sensor density between the three datasets, with Taiwan having the lowest sensor density and Newcastle having the highest, despite having significantly fewer sensors. Table 2 highlights the difference in air quality characteristics across the three geographies, with pollutant concentrations reflecting expected variations due to emission intensity and urban density. All pollutant concentrations were standardised to μg/m3 for consistency across regions.

3.2. Model Descriptions

The following provides brief descriptions of the four deep learning algorithms utilised in the study, increasing in complexity and forecasting ability.

Feedforward Neural Network

A feedforward neural network (FNN), also known as a Multi-Layer Perceptron, is the simplest of the four algorithms used in the study and is designed to accept a single input vector which goes through a series of linear and nonlinear transformations to produce a final vector representing the forecast for the target variable. The size of the target vector is always 24, due to this study always looking to produce a 24 h forecast; however, the size of the input vector, based on context length use of exogenous variables such as air quality, location and meteorological factors, is determined through hyperparameter tuning, which is discussed further in Section 3.4. In addition to using a hyperparameter tuning framework to determine the optimal inputs, the architecture of the network is also determined through this tuning process, with the range of possible layers being from 1 to 5, with each layer having up to 128 neurons. The ReLU activation function is always used at each layer, along with using the Adam optimiser, with the learning rate of the optimiser also being discovered during hyperparameter tuning. The mean squared error (MSE) loss function was used to quantify the difference between the predicted and actual values, ensuring that the model minimises large errors by penalising them more heavily.

3.3. Long-Short Term Recurrent Neural Network

The FNN discussed previously is arguably limited in its ability to forecast air quality due to its lack of inherent temporal modelling capabilities and serves as a basis for the simplest of benchmarks. Recurrent neural networks, designed specifically for capturing temporal dependencies not easily achieved in FNNs, have demonstrated good results in the literature. The success of these RNNs is due to their ability to capture information across the time domain by maintaining a hidden state which is updated on each timestep. This hidden state update process allows the network to retain important information from recent history while also being able to attend to more recent data within the time series. While the first RNN models achieved success, they were limited in their ability to capture long dependencies due to the exploding and vanishing gradient problems [36]; however, the introduction of long short-term memory, which improves on RNNs by introducing gating mechanisms to allow the network to attend more to the historic data and also the most recent data, through improved hidden state update mechanisms, improved the RNN substantially [37]. In this study, the LSTM algorithm is used to train and produce air quality forecasts. Similarly to the FNN, the timestep inputs, such as context length and use of exogenous data are determined through hyperparameter tuning discussed in Section 3.4, and the resulting forecast is always 24 in length to produce a 24 h forecast.

3.3.1. DeepAR

While LSTMs have demonstrated success in air quality forecasting, LSTMs are limited in their ability to produce a range of potential forecasts and result in single point estimates. As the result of air quality forecasts may be used to manage infrastructure or update dynamic data-driven policies, it is important to account for uncertainty and other possible outcomes. The DeepAR algorithm builds upon LSTM by introducing probabilistic forecasting, enabling the model to predict the parameters of a probability distribution instead of generating single-point forecasts. This probabilistic approach allows DeepAR to produce forecasts that account for uncertainty, providing a full distribution of possible outcomes at each time step. This is achieved by predicting parameters for a distribution, such as the mean and variance for a Gaussian distribution, which are then sampled from after the prediction process to produce many possible outcomes. In addition to this probabilistic update to LSTMs, the authors of the DeepAR algorithm [38] also introduce an autoregressive component, which conditions each forecaster value on the previous prediction. The authors suggest that by incorporating the previous prediction back into the network when producing the next forecast, it leads to more stable, realistic forecasts. The final addition to the LSTM architecture leading to DeepAR is the use of embedding networks to encode static exogenous data such as locations and sensor IDs, instead of directly feeding them into the recurrent aspect of the network. This allows the network to learn improved embeddings for the exogenous variables, leading to a model that can learn global and local patterns based on these inputs. Similarly to the previous algorithms discussed, the DeepAR algorithm is trained using the Adam optimiser with a learning rate determined by hyperparameter tuning, along with its inputs, such as exogenous data and context length, being determined throughout this tuning process.

3.3.2. Temporal Fusion Transformer

Although the DeepAR algorithm improves upon the LSTM by introducing probabilistic forecasting and improved embeddings of exogenous data, the network is still recurrent-based, meaning it can struggle with long-term dependencies due to the hidden state update process. The Temporal Fusion Transformer (TFT) [39] is a significant departure from the recurrent-based neural networks discussed previously due to its use of attention, which allows for more sophisticated handling of temporal dependencies. While RNN-based models discussed previously rely on fixed-size context vectors which are updated sequentially per time step, the TFT employs a multi-head attention mechanism, enabling the model to focus on different aspects of the input data simultaneously. This attention-based architecture allows for more accurate forecasting by selectively weighing the importance of timesteps and features, thereby capturing both short- and long-term temporal patterns more effectively. Not only is attention incorporated into the TFT algorithm, but the use of gating and residual connections is also introduced into the network, allowing the model to dynamically determine the relevance of input features and filter out those which do not contribute positively to the forecasts.
Similarly to DeepAR, TFT is a probabilistic forecasting model which aims to predict the parameters of distributions to then sample from. This allows the network to produce many possible outcomes, allowing the users of the model to derive confidence intervals and account for uncertainty in its predictions. In this research, the TFT algorithm also produces a 24 h forecast, with its inputs being determined by the hyperparameter tuning process discussed in Section 3.4. The model is trained using the Adam optimiser with the learning rate determined during the tuning process.

3.4. Experimental Setup

The experimental design of this study was intentionally structured around three geographically and environmentally distinct datasets to assess how forecasting models perform under contrasting conditions. By including regions that differ in pollution intensity, emission sources, climate, and sensor network design, the experiments provide a broader understanding of how model performance, feature relevance, and optimal configurations vary across contexts. This approach allows us to evaluate not only algorithmic performance within each region but also the extent to which findings from one environment generalise to others with different air quality dynamics.
We describe the approach as spatiotemporal because each model ingests (i) hourly time series for each monitoring station (temporal dynamics) and (ii) station-level spatial metadata (spatial differentiation). In practice, models are trained jointly across all stations within a region (multi-series training), and the inputs include station identifiers (encoded via embeddings in DeepAR/TFT), geographic coordinates (longitude and latitude), and per-station meteorological covariates (e.g., temperature, wind). This setup allows the networks to share statistical strength across locations while learning station-specific effects, capturing both temporal evolution and spatial heterogeneity. We do not construct explicit spatial graphs or adjacency matrices in this work, as richer spatial structures are left to future research.

3.4.1. Hyperparameter Tuning and Feature Selection

While each forecasting algorithm discussed varies significantly from the others, the training process for each of these models is very similar, and so a tuning program was developed which explored parameters and trained each network in the same fashion, only differing slightly in the available parameters to optimise for each network.
As each dataset contains the same target variables (CO, NO2, O3, PM2.5, PM10), along with exogenous data (sensor ID, sensor location, wind direction, temperature), the feature selection process selects a random subset of exogenous data to include, which may also include all air quality data. This exploration process allowed us to determine which target variable benefits the most from all possible inputs and architectures. In addition to this input feature selection process, the learning rate for each algorithm was explored, with the possible range of values ranging from 1 × 10 5 to 1 × 10 2 . The context length of the input vector was also tuned during this exploration process, allowing for the model to receive up to 72 h of historic data to produce the 24 h forecast.
While some hyperparameters such as inputs, context length and learning rate are common hyperparameters to all algorithms, each algorithm also has a set of hyperparameters which can be tuned, such as the number of attention heads in TFT and the number of layers in the FNN.
It is also important to note that certain pollutants, particularly PM2.5 and PM10, are highly correlated due to their physical and chemical relationships. This correlation raises the possibility of applying dimensionality reduction techniques such as Principal Component Analysis (PCA) to reduce feature redundancy. However, both PM2.5 and PM10 were modelled separately in this study for several reasons. Firstly, despite their correlation, they are treated as distinct pollutants in regulatory frameworks, with different exposure limits and public health implications. Secondly, they may exhibit different temporal dynamics due to differences in particle size distribution, emission sources, and atmospheric behaviour, meaning that separate forecasts provide more actionable information for policymakers and health authorities. Finally, modelling them independently allows for the direct assessment of feature relevance and model behaviour for each pollutant. Future work could explore PCA or similar pre-processing approaches to investigate how dimensionality reduction impacts model performance, interpretability, and computational efficiency.

3.4.2. Training and Evaluation

To train each network, the datasets were sub-divided into training, validation, and testing, using an 80%/10%/10% split. Each model would produce a forecast for each sensor, meaning that when training the model, the network would be given a sensor’s historic readings and exogenous data based on the current hyperparameter configuration and produce a forecast. The average Root Mean Squared Error (RMSE) of all forecasts was used to determine the overall performance ability of each network.
RMSE was selected as the primary evaluation metric in this study due to its strong sensitivity to larger errors and its common use in time series forecasting tasks. By penalising larger deviations more heavily than smaller ones, RMSE provides an informative measure of how well a model captures the magnitude of air quality variations, which is critical in applications where significant mispredictions can have substantial public health or policy consequences. Additionally, its widespread adoption in the air quality forecasting literature facilitates direct comparison with existing work. However, it is acknowledged that complementary metrics such as Mean Absolute Error (MAE) or correlation coefficients could offer additional perspectives on forecast performance, for example, by providing more interpretable error magnitudes or quantifying the strength of linear relationships. These alternative metrics were not computed in this study but will be considered in future work to provide a more comprehensive evaluation of model performance.
The Adam optimiser was used, with the learning rate also being tuned in the hyperparameter process. Early stopping of 10 was used to prevent the networks from training longer than necessary without improvements.
It is important to note that models in this study were trained and evaluated within each geographic region independently, and cross-regional training or transfer learning experiments were not conducted. This decision was intentional, as the focus of this work was to assess and understand forecasting performance under the specific spatial, meteorological, and emission characteristics of each region. Given the substantial heterogeneity across the Taiwan, Beijing, and Newcastle datasets, including differences in pollutant dynamics, sensor density, and data collection protocols, evaluating models within each region provides a clearer assessment of their behaviour in context-specific settings. Nevertheless, exploring cross-regional transferability and the potential of transfer learning approaches represents an important avenue for future work, particularly for developing forecasting systems that can adapt to new locations with limited local data.

4. Results

In this section, the findings of the research are presented, showing the optimal parameters and model configurations for each of the datasets and target pollutants. It should be noted that pollutant coverage differs slightly between regions due to variations in sensor availability and data completeness. Only pollutants with sufficient temporal coverage and reliable measurements were retained for analysis to ensure comparability of results.

4.1. Taiwan

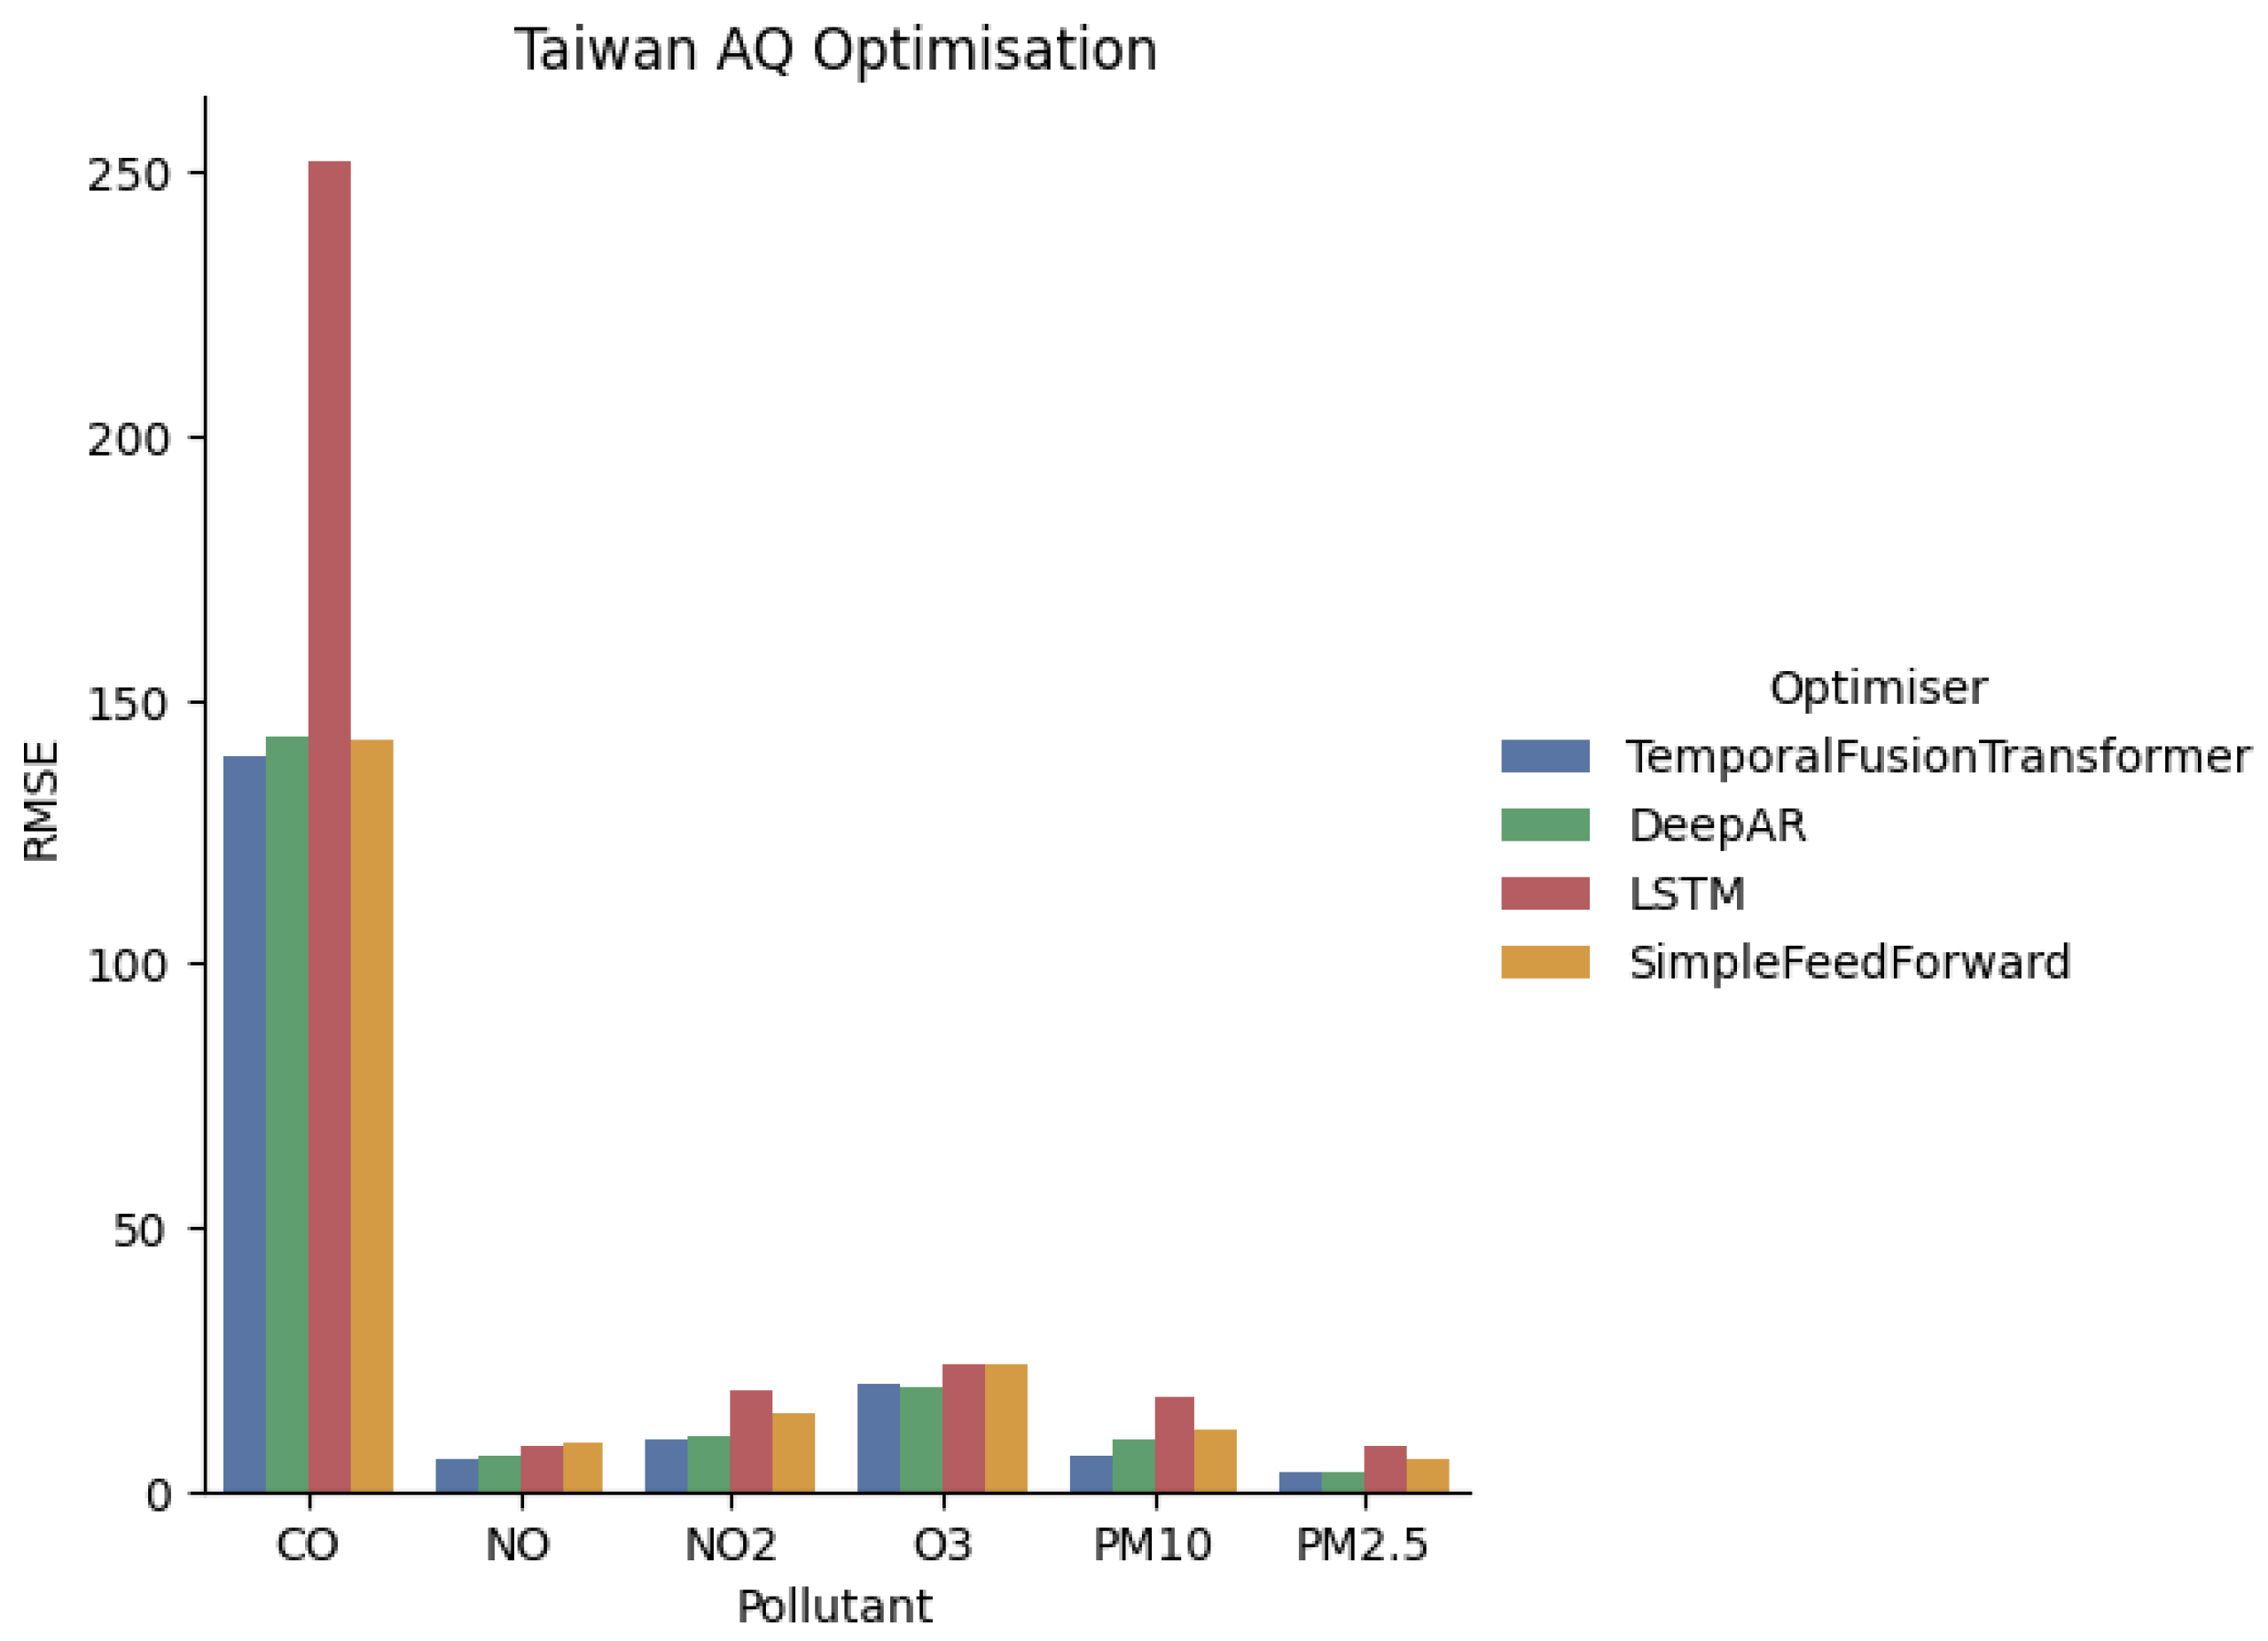
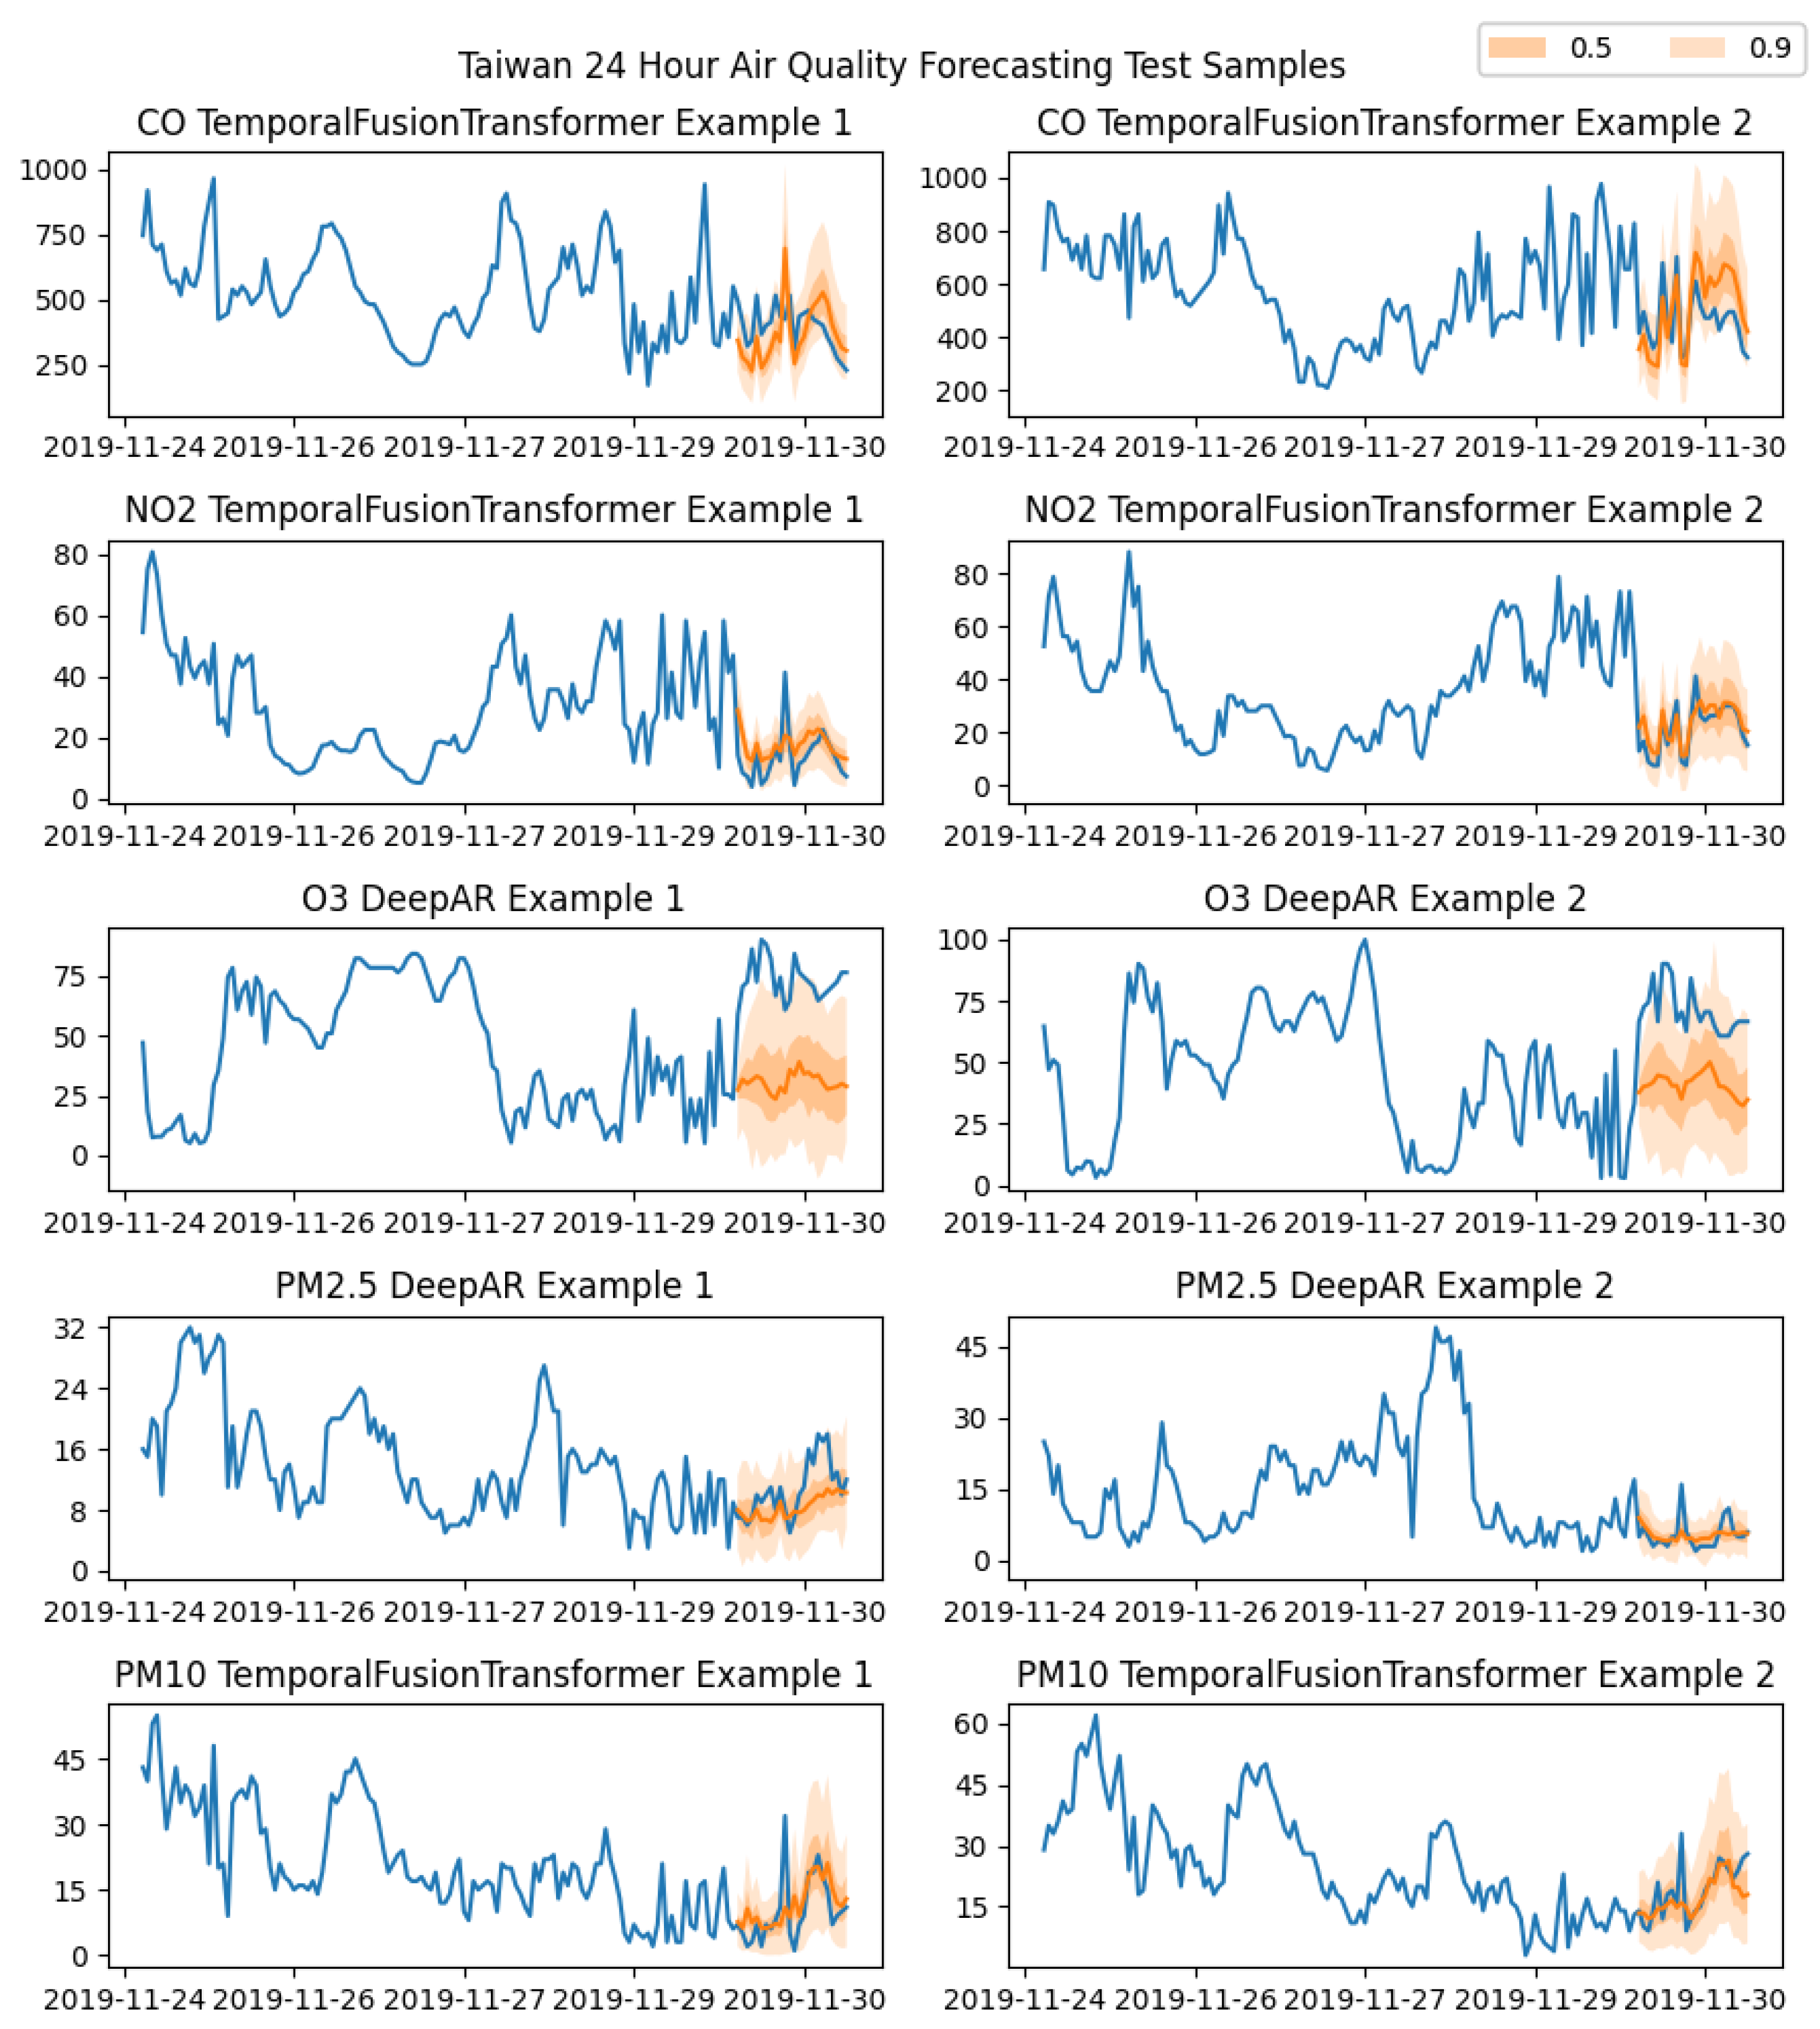
The results for Taiwan are presented in Figure 4 and Figure 5 along with the optimal hyperparameter configurations for each algorithm being shown in Table 3. Figure 4 highlights the average RMSE for the best hyperparameter configurations, while Figure 5 shows illustrative cases where the best-performing model per pollutant captures the broad diurnal structure and some short-term fluctuations. Residual errors remain around rapid transitions, and uncertainty bands widen during higher-variability periods, indicating reduced confidence. Across pollutants, DeepAR and TFT often ranked among the stronger models, but performance was not uniformly superior in all cases.

4.2. Beijing

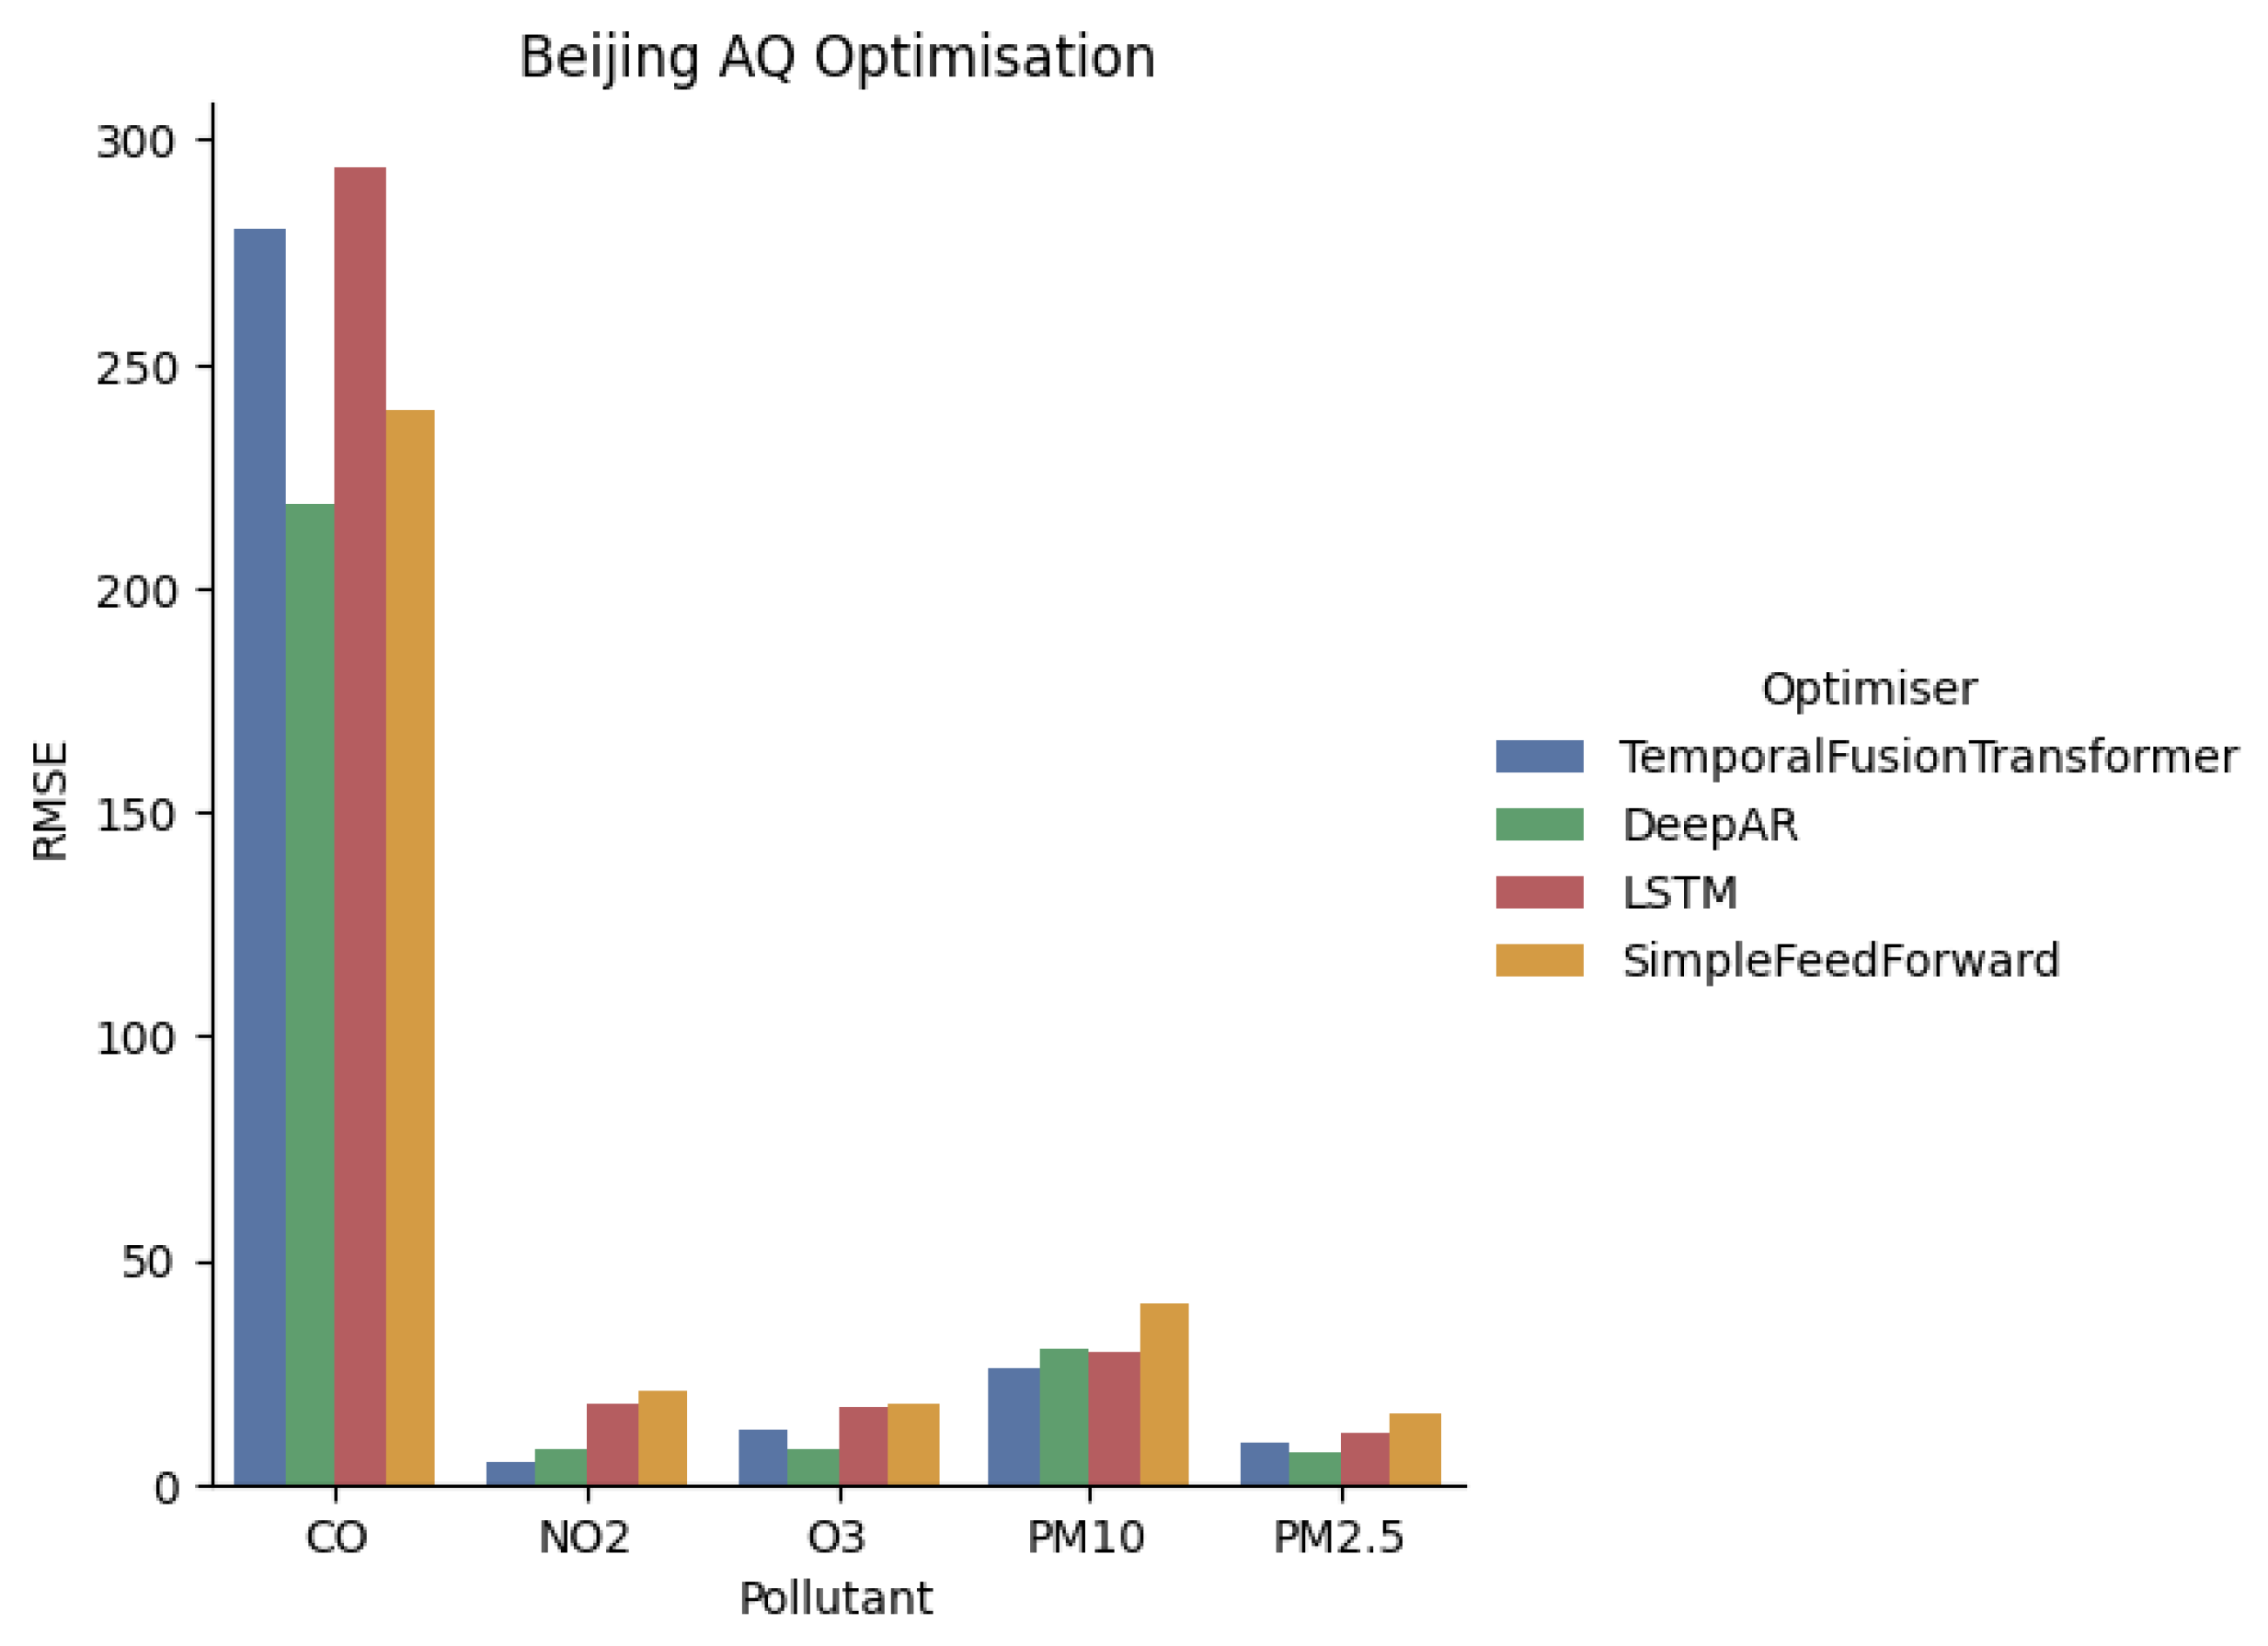
Figure 6 and Figure 7 present the findings for the Beijing dataset along with Table 4 showcasing the optimal hyperparameter configurations. Figure 6 shows the average RMSE for each of the best configurations while Figure 7 shows example forecasts. As shown in Figure 7, TFT and DeepAR provide representative examples of stronger performance, particularly for O3 and NO2. Nevertheless, there are instances of under- or over-shooting during peak conditions, and mixed behaviour across pollutants, consistent with the bar chart comparison.

4.3. Urban Observatory

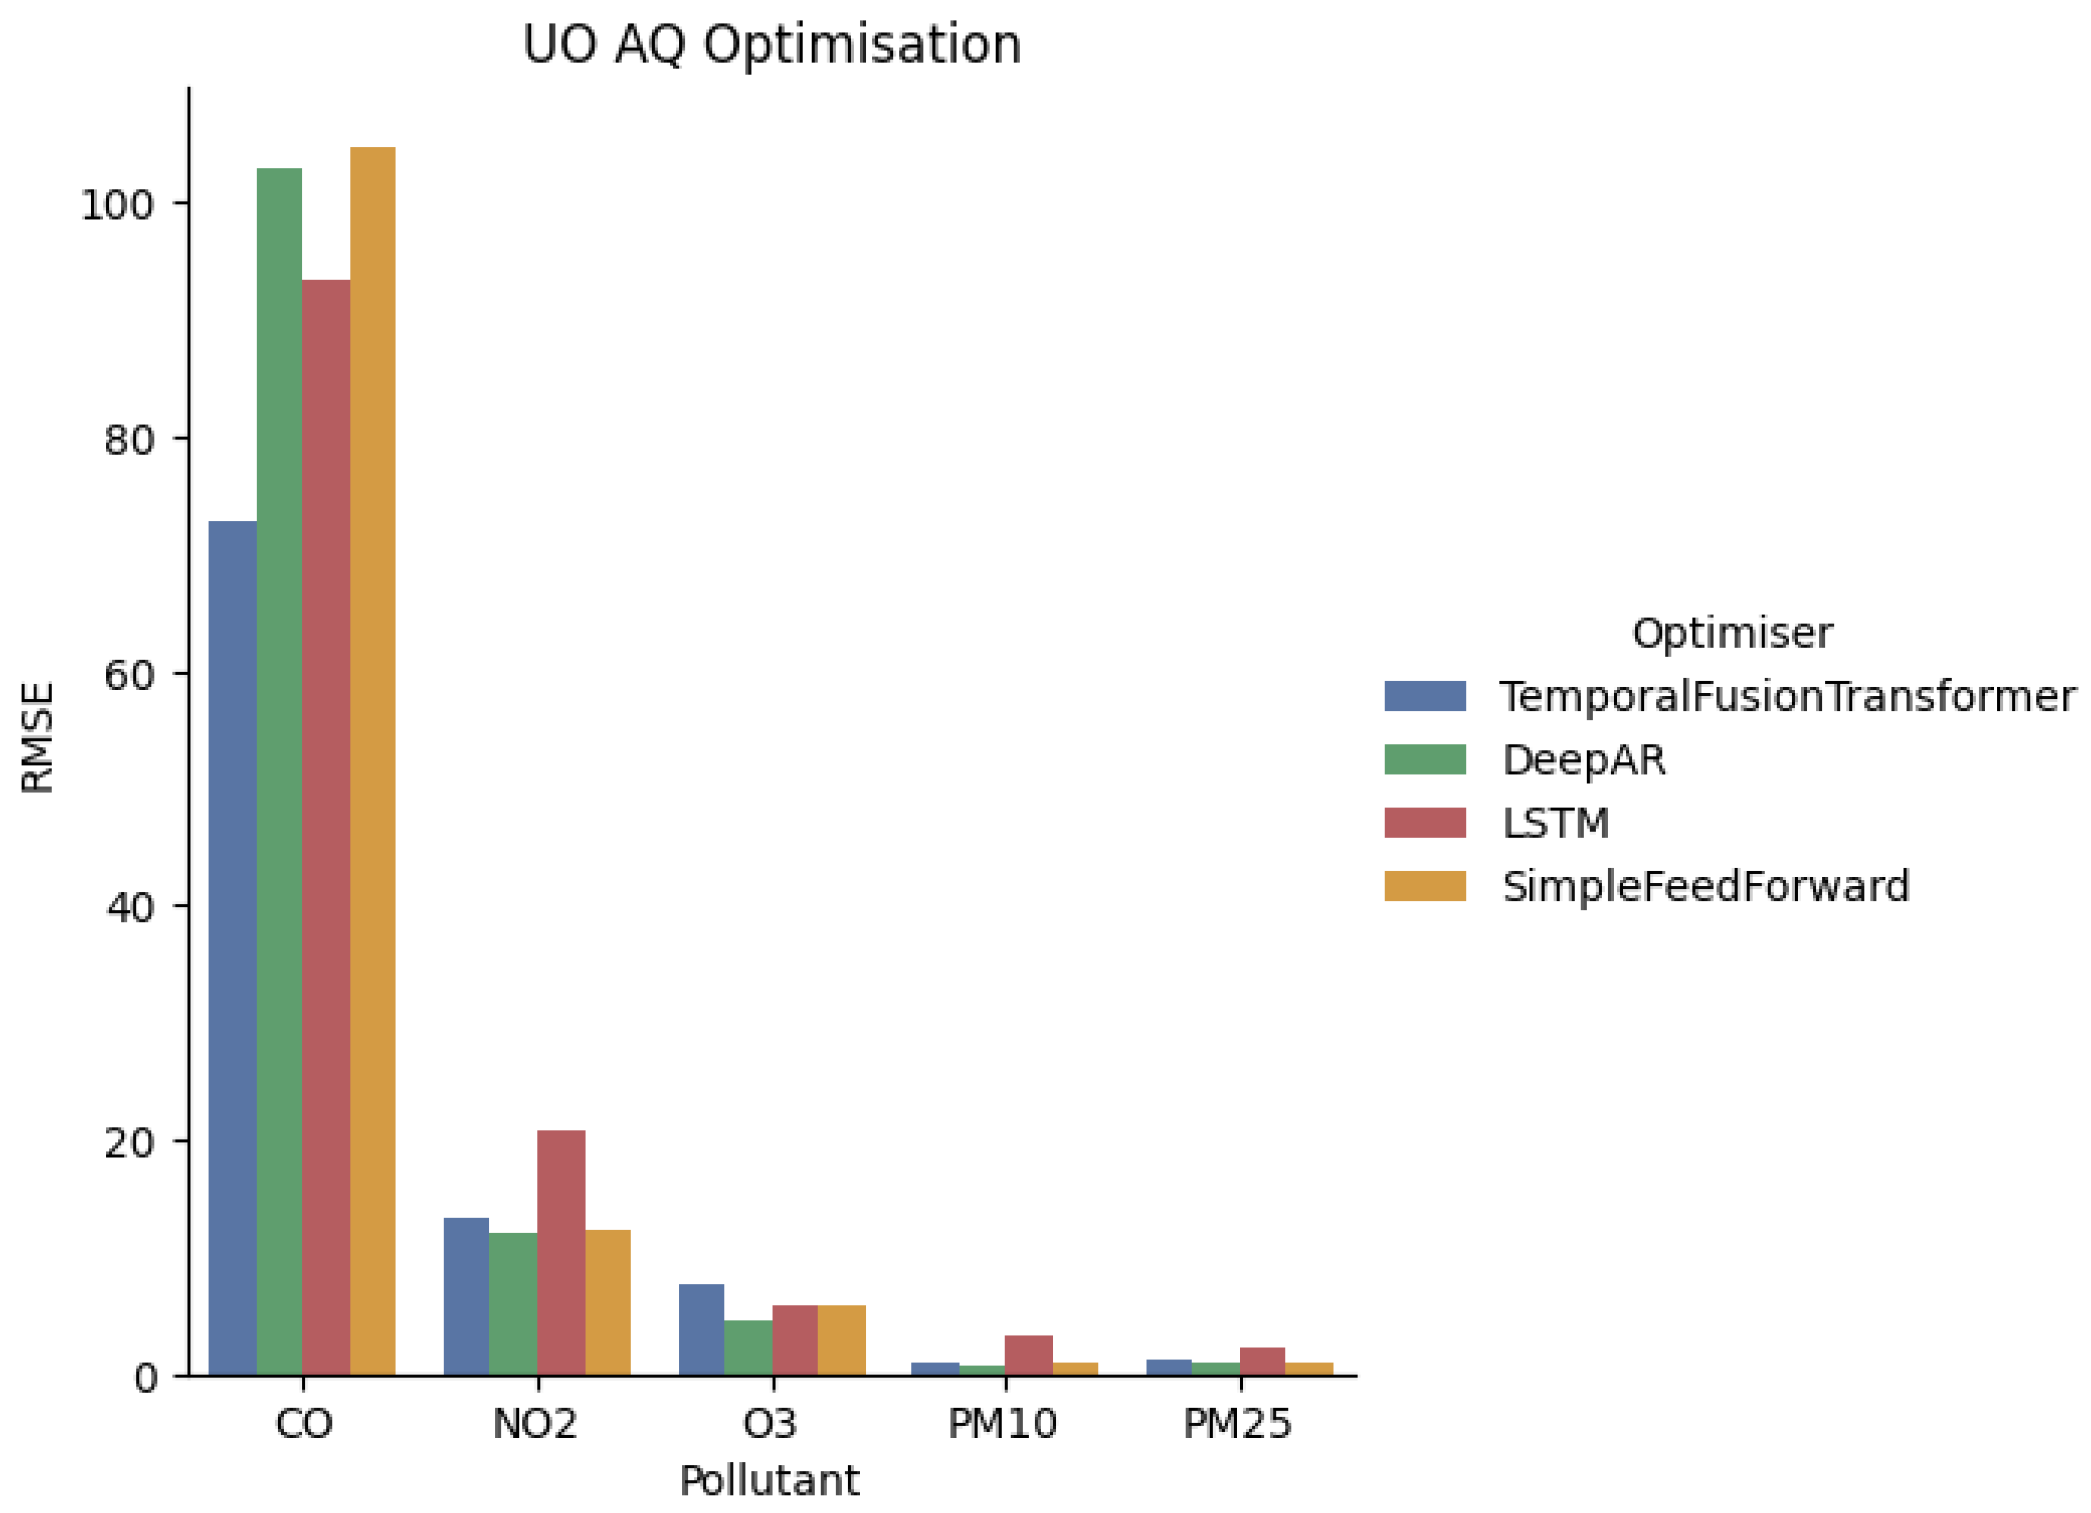
The Newcastle upon Tyne results are presented in Figure 8 and Figure 9, which showcase the best performing hyperparameter configurations and example forecasts. Additionally, the optimal hyperparameter configurations for the Newcastle dataset are shown in Table 5. As shown in Figure 9, DeepAR provides stable forecasts in these illustrative cases, particularly for PM10 and PM2.5, while some peak events remain challenging. The examples reflect patterns seen in the aggregate metrics, with modest differences between models and pollutant-dependent behaviour.

5. Discussion

5.1. Model Selection

Of the four algorithms evaluated, TFT and DeepAR consistently demonstrated the best performance, with TFT outperforming the other algorithms for six of the seven pollutants in Taiwan and three of the six pollutants in Beijing. Interestingly, the DeepAR algorithm was the most performant for the Newcastle dataset, with DeepAR being the optimal model for four of five pollutants. This result is unsurprising, given the additional inductive biases inherent in these more advanced algorithms compared to their simpler counterparts. While these two advanced algorithms typically achieved better performance, it is important to note that the TFT and DeepAR were not universally better in all scenarios, with LSTM outperforming DeepAR when predicting PM10 in Beijing and LSTM achieving better performance than TFT when predicting PM2.5 in the Newcastle dataset. Having said this, however, it is clear from the findings that for accuracy-related tasks, TFT and DeepAR provide the best forecasting abilities.
Even though TFT and DeepAR were the most performant, it is worth considering the requirements of the algorithm to determine its true benefit and utility in air quality forecasting. While TFT and DeepAR primarily base their forecasts on historic information, these algorithms can incorporate future information to produce forecasts, meaning that the algorithms rely on future information which may not be available in practice and in turn also rely on predicted values. For example, if the model includes weather forecasts to aid in predicting air quality, the error within the weather forecast will likely result in increased error in the forecasting model. Therefore, this assumption of having all information available for these algorithms to perform correctly proves impractical and can lead to an overestimation of forecast performance, giving the impression of greater predictive capability than is realistically achievable. Therefore, looking to improve on how forecasted pollutants can be used as input features for other forecasting algorithms is an area of further research that is not addressed in this study.
Although there was consistency observed in the models chosen, there was very little consistency in context lengths across the three datasets. For example, algorithms trained on the Taiwan dataset typically favoured a context length of three days, whereas the Newcastle dataset only required approximately one day of historic information. Each pollutant across the three datasets typically utilised a different context length. For example, when forecasting NO2, Taiwan utilised a context length of 72, Beijing used a length of 56, and Newcastle used a length of 12. These differences between the datasets, variables and context lengths can be observed for all variables, suggesting no discernible pattern to determine the optimal context length, and are instead specific to the area and pollutant. Beyond model architecture and temporal context, another important aspect of forecasting performance concerns how accuracy is measured and interpreted.
While RMSE was used as the sole evaluation metric in this study, it is recognised that additional metrics could enrich the interpretation of model performance. Measures such as MAE would provide a more intuitive understanding of average forecast error magnitudes, while correlation-based metrics could offer insight into how well models capture temporal patterns in pollutant dynamics. The absence of these complementary metrics is a limitation of the current work and will be addressed in future research, where a broader set of evaluation measures will be employed to provide a more comprehensive assessment of forecasting models. Beyond the choice of evaluation metrics, another critical dimension of model assessment is how performance behaves under different pollution conditions.
Another limitation of the current work is that model performance was evaluated across the entire dataset without explicitly considering differences under varying pollution levels. Forecasting behaviour can differ substantially during high pollution episodes, where pollutant dynamics are often influenced by complex, non-linear interactions between meteorological factors, emission sources, and atmospheric processes. As a result, models that perform well under typical conditions may exhibit degraded performance during severe pollution events, which are often the periods of greatest public health concern. Future work should therefore incorporate stratified evaluation approaches, such as assessing performance separately for low, moderate, and high pollution conditions, to better understand how model accuracy and uncertainty behave under extreme scenarios. Such analysis could provide valuable insights into the reliability and robustness of forecasting systems precisely when accurate predictions are most critical for decision-making and public health response.
In addition to this, the models were not evaluated in cross-regional scenarios, such as training on data from one location and testing on another. This was an intentional design choice, as the primary objective was to investigate forecasting behaviour and optimal configurations within distinct regional contexts rather than assess model generalisability across heterogeneous environments. However, understanding how models trained in one city perform when applied to another, particularly when pollutant dynamics, meteorological conditions, and sensor network characteristics differ substantially, is a valuable future direction. Techniques such as transfer learning or domain adaptation could enable models to leverage knowledge learnt in data-rich regions to improve forecasting in data-scarce locations, ultimately enhancing the scalability and applicability of air quality forecasting systems.
Despite these limitations, the inclusion of three geographically and environmentally distinct datasets remains one of the key contributions of this study. By conducting a systematic evaluation across Taiwan, Beijing, and Newcastle upon Tyne, the research demonstrates how forecasting behaviour, optimal configurations, and even the most suitable algorithm are strongly influenced by local conditions. For instance, TFT achieved the best performance in Taiwan and Beijing, where pollutant behaviour exhibits strong seasonal and industrial patterns, whereas DeepAR performed best in Newcastle, where higher spatial resolution and differing pollutant dynamics may favour its autoregressive and probabilistic structure. Variations in pollutant concentrations, meteorological conditions, and sensor densities across the datasets also explain the observed differences in optimal context lengths and covariate relevance. These findings highlight that conclusions drawn from a single-region study may not generalise to other locations, reinforcing the importance of cross-context evaluation for developing forecasting models that are robust, transferable, and applicable across diverse urban environments. Moreover, the strong performance of DeepAR across multiple contexts underscores the practical value of probabilistic forecasting approaches, which provide uncertainty estimates essential for resilient decision-making under heterogeneous conditions.

5.2. Covariate Selection

When forecasting each of the core pollutants, it was noted that each pollutant typically favoured one or more covariates that increased forecasting accuracy, and this observation was consistent across the three datasets. When forecasting CO, NO2 was used by all three forecasting models, suggesting that NO2 is highly useful in forecasting this pollutant. The latitude was used in both the Beijing and Newcastle datasets but was not utilised in the Taiwan dataset, suggesting that this feature can prove useful but is not strictly necessary to achieve accurate forecasts. Wind speed was used for both Taiwan and Beijing and was not available in the Newcastle dataset. Due to the nature of air pollution, it is likely that the Newcastle dataset would have also taken advantage of the wind speed covariate. Particulate matter measurements appear to be useful in forecasting CO, although Taiwan utilised PM2.5 measurements, while the other two datasets utilised PM10. This may suggest that particulate matter and NO2 are the most useful when predicting CO.
Across all three datasets, CO was utilised as a covariate to improve forecasting accuracy for NO2, along with PM2.5 being used across all three. Additionally, wind speed and direction were shown to improve forecasts, and while the Newcastle dataset does not offer this measurement, it would be reasonable to assume it would be used given the nature of air pollution.
The optimal models for the three datasets when forecasting O3 opted to use NO2 as a covariate, suggesting that similarly to CO, NO2 is useful in forecasting O3. CO and PM were shown to be useful in the Taiwan and Beijing datasets but were not utilised in the Newcastle forecasting, which may suggest that their predictive relevance is influenced by local emission profiles and meteorological dynamics or that other covariates in Newcastle captured similar information more effectively.
When predicting PM10 values, the optimal model for each of the datasets utilised PM2.5 as a covariate, which is not surprising due to the nature of particulate matter and PM2.5 also being accounted for in PM10 measurements. Interestingly, PM2.5 is the only common covariate across the three datasets for forecasting this pollutant, suggesting meteorological variables, CO, NO2, and O3 do not provide any increase in forecasting PM10.
When forecasting PM2.5, all three models utilised the longitude variable, while two of the three chose not to use the latitude. Similarly to PM10, there are no other variables that are common to all three datasets, suggesting that meteorological variables along with CO and NO2 offer little in improving forecasting accuracy. Having said this, Beijing and Newcastle did use the O3 variable, which may suggest that O3 could be useful in certain contexts but is not universal.
Finally, it is important to acknowledge the strong correlation observed between PM2.5 and PM10, which is well-documented in the literature and arises from their shared emission sources and physical composition. Despite this relationship, both pollutants were modelled independently in this study for several reasons. Firstly, PM2.5 and PM10 are regulated separately, with different health impacts and policy thresholds, meaning that separate forecasts provide more actionable information for air quality management and public health decision-making. Secondly, while correlated, they do not always evolve identically over time, as differences in particle size distribution and atmospheric behaviour can lead to distinct temporal dynamics. Modelling them separately, therefore, allows the forecasting models to capture these subtle but meaningful differences. Nevertheless, dimensionality reduction techniques such as Principal Component Analysis (PCA) could be explored in future work to assess whether reducing feature redundancy might improve model interpretability, reduce computational complexity, or reveal latent pollutant patterns without compromising predictive accuracy.
Although the present study is spatiotemporal, models were trained on hourly sequences and included station-level metadata (ID embeddings, coordinates) and per-station meteorology. The spatial representation used here is relatively coarse and does not fully capture the complex spatial determinants of air quality. More informative spatial features, such as distance to major roads, proximity to industrial areas, land use classification, or site type (e.g., urban background, roadside, industrial), have been shown to significantly enhance model performance in air quality forecasting by providing richer contextual information about emission sources and dispersion environments [40,41]. Longitude and latitude were used in this study primarily due to their universal availability across all three datasets, their simplicity and their frequent use in prior machine learning research as baseline spatial features. However, future work should explore the integration of more detailed spatial descriptors to better capture the underlying drivers of pollutant variability and further improve the generalisability and interpretability of forecasting models.

5.3. Applications to Sensor Networks

The findings presented above highlight several important considerations for predicting air quality and ultimately influence the applicability of forecasting in air quality management systems and sensor networks. Firstly, the performance of forecasting models varies depending on the pollutant and location, and while some similarities between configurations are observed, it is clear that a one-size-fits-all solution does not exist, and certain aspects of the configuration, such as context length, must be discovered via some local training process. This would then allow those deploying the network to gain insights into the optimal context length and to not rely on the existing literature to define these parameters. Furthermore, the selection of covariates also appears to be pollutant and location specific, although there appears to be less variation when compared to context lengths, and some features, such as using NO2 when predicting CO, are consistent. Therefore, those deploying these networks should look to incorporate the capturing of these covariates that have been shown to be consistent when targeting a specific pollutant, but it is noted that the accuracy achieved by capturing and utilising this information may outweigh the costs and again is application, location and pollutant specific.
The results achieved do suggest that short-term air quality forecasting is achievable, but there is often a large margin of error and uncertainty, and therefore probabilistic forecasting should always be used, and one should not rely on single point estimates. As shown by the results presented in the results, the confidence intervals can vary, and therefore the mean average of the forecast and also the variance should be used in decision-making.
The cross-regional evaluation conducted in this study further reinforces the importance of tailoring forecasting systems to the specific environmental and operational contexts in which they will be deployed. Differences observed between Taiwan, Beijing, and Newcastle highlight that pollutant dynamics, spatial resolution, and sensor network design can all influence which model architecture, context length, and covariates are most effective. This underscores the need for adaptive model selection strategies when deploying air quality forecasting systems in new regions, rather than relying on configurations derived from studies in different contexts. Furthermore, the demonstrated utility of probabilistic approaches such as DeepAR suggests that future forecasting systems should prioritise not only predictive accuracy but also the ability to communicate uncertainty, enabling more resilient decision-making in dynamic and data-limited real-world scenarios. By considering these cross-context insights during system design and deployment, air quality forecasting can become both more accurate and more broadly applicable across diverse urban environments.

6. Conclusions

Accurately forecasting air quality could bring benefits to society by providing early warning detection systems and improving air quality management through data-driven policy-making. While much of the literature has been written on the forecastability of air quality using deep learning techniques, much of this literature is primarily focused on the development of algorithms, with a narrow selection of datasets being used. This research aims to build on this existing research by evaluating four forecasting algorithms across three diverse air quality datasets, offering insights into parameters and covariates useful for developing these systems across different geographic regions.
Four forecasting algorithms were explored, which included a simple feedforward neural network, a long short-term memory recurrent neural network, DeepAR, and a Temporal Fusion Transformer. Each algorithm was optimised using a hyperparameter selection process which aimed to discover not only most useful context length for predicting these pollutants but also feature selection, determining the most useful covariates such as metrological variables and additional pollutants. It was found that TFT and DeepAR were consistently better across the three datasets, although there were discernible patterns for context length, suggesting that each location and pollutant should be analysed when creating a forecasting system to discover the optimal value. Additionally, while some pollutants did suggest a consistent use of covariate to improve accuracy, such as CO favouring NO2 across the three datasets, other pollutants weren’t as consistent. Therefore, while this and other research suggest specific covariates per pollutant, mileage may vary and is pollutant and location specific.
While TFT and DeepAR do achieve the best accuracy, it is noted in the research that these algorithms will present challenges in practical settings due to their reliance on future information which may not be available, meaning they must also be forecasted, which can incorporate additional error. Further research is required to determine how such advanced algorithms could be used in a practical context. In addition to this, only a small dataset of one year in length was utilised, and only a single forecast horizon of 24 h was considered. Further research is needed to determine whether a change in forecast horizon can lead to an overall, more useful system for air quality forecasting.

Author Contributions

Conceptualization, A.B. and P.J.; Data curation, A.B.; Formal analysis, A.B.; Investigation, A.B.; Methodology, A.B.; Project administration, A.B. and P.J.; Software, A.B.; Supervision, P.J.; Visualization, A.B.; Writing—original draft preparation, A.B.; Writing—review and editing, P.J., S.M. and E.S. All authors have read and agreed to the published version of the manuscript.

Funding

This work was supported by the United Kingdom Research and Innovation’s (UKRI) Engineering and Physical Sciences Research Council (EPSRC) Centre for Doctoral Training in Geospatial Systems under grant number EP/S023577/1.

Data Availability Statement

The data supporting the findings of this study are available from the corresponding author upon request.

Acknowledgments

The authors gratefully acknowledge support from the Engineering and Physical Sciences Research Council (EPSRC) and the Centre for Doctoral Training in Geospatial Systems at Newcastle University. The authors also thank the Urban Observatory team for enabling access to their sensor infrastructure and open data resources.

Conflicts of Interest

The authors declare no conflicts of interest.

References

  1. World Health Organization. Health Impacts: Types of Pollutants. 2024. Available online: https://www.who.int/teams/environment-climate-change-and-health/air-quality-and-health/health-impacts/types-of-pollutants (accessed on 10 June 2024).
  2. Liu, N.M.; Grigg, J. Diesel, children and respiratory disease. BMJ Paediatr. Open 2018, 2, e000210. [Google Scholar] [CrossRef] [PubMed]
  3. Polezer, G.; Tadano, Y.S.; Siqueira, H.V.; Godoi, A.F.; Yamamoto, C.I.; de André, P.A.; Pauliquevis, T.; Andrade, M.d.F.; Oliveira, A.; Saldiva, P.H.; et al. Assessing the impact of PM2.5 on respiratory disease using artificial neural networks. Environ. Pollut. 2018, 235, 394–403. [Google Scholar] [CrossRef] [PubMed]
  4. Mo, Z.; Fu, Q.; Zhang, L.; Lyu, D.; Mao, G.; Wu, L.; Xu, P.; Wang, Z.; Pan, X.; Chen, Z.; et al. Acute effects of air pollution on respiratory disease mortalities and outpatients in Southeastern China. Sci. Rep. 2018, 8, 3461. [Google Scholar] [CrossRef] [PubMed]
  5. Slama, A.; Śliwczyński, A.; Woźnica, J.; Zdrolik, M.; Wiśnicki, B.; Kubajek, J.; Turżańska-Wieczorek, O.; Gozdowski, D.; Wierzba, W.; Franek, E. Impact of air pollution on hospital admissions with a focus on respiratory diseases: A time-series multi-city analysis. Environ. Sci. Pollut. Res. 2019, 26, 16998–17009. [Google Scholar] [CrossRef]
  6. Hayes, R.B.; Lim, C.; Zhang, Y.; Cromar, K.; Shao, Y.; Reynolds, H.R.; Silverman, D.T.; Jones, R.R.; Park, Y.; Jerrett, M.; et al. PM2.5 air pollution and cause-specific cardiovascular disease mortality. Int. J. Epidemiol. 2020, 49, 25–35. [Google Scholar] [CrossRef]
  7. Kim, J.B.; Prunicki, M.; Haddad, F.; Dant, C.; Sampath, V.; Patel, R.; Smith, E.; Akdis, C.; Balmes, J.; Snyder, M.P.; et al. Cumulative lifetime burden of cardiovascular disease from early exposure to air pollution. J. Am. Heart Assoc. 2020, 9, 14944. [Google Scholar] [CrossRef]
  8. Mannucci, P.M.; Harari, S.; Franchini, M. Novel evidence for a greater burden of ambient air pollution on cardiovascular disease. Haematologica 2019, 104, 2349–2357. [Google Scholar] [CrossRef]
  9. Lelieveld, J.; Klingmüller, K.; Pozzer, A.; Pöschl, U.; Fnais, M.; Daiber, A.; Münzel, T. Cardiovascular disease burden from ambient air pollution in Europe reassessed using novel hazard ratio functions. Eur. Heart J. 2019, 40, 1590–1596. [Google Scholar] [CrossRef]
  10. Wang, N.; Mengersen, K.; Tong, S.; Kimlin, M.; Zhou, M.; Wang, L.; Yin, P.; Xu, Z.; Cheng, J.; Zhang, Y.; et al. Short-term association between ambient air pollution and lung cancer mortality. Environ. Res. 2019, 179, 108748. [Google Scholar] [CrossRef]
  11. Bai, L.; Shin, S.; Burnett, R.T.; Kwong, J.C.; Hystad, P.; van Donkelaar, A.; Goldberg, M.S.; Lavigne, E.; Weichenthal, S.; Martin, R.V.; et al. Exposure to ambient air pollution and the incidence of lung cancer and breast cancer in the Ontario Population Health and Environment Cohort. Int. J. Cancer 2020, 146, 2450–2459. [Google Scholar] [CrossRef]
  12. Tseng, C.H.; Tsuang, B.J.; Chiang, C.J.; Ku, K.C.; Tseng, J.S.; Yang, T.Y.; Hsu, K.H.; Chen, K.C.; Yu, S.L.; Lee, W.C.; et al. The Relationship Between Air Pollution and Lung Cancer in Nonsmokers in Taiwan. J. Thorac. Oncol. 2019, 14, 784–792. [Google Scholar] [CrossRef] [PubMed]
  13. Turner, M.C.; Andersen, Z.J.; Baccarelli, A.; Diver, W.R.; Gapstur, S.M.; Pope, C.A.; Prada, D.; Samet, J.; Thurston, G.; Cohen, A. Outdoor air pollution and cancer: An overview of the current evidence and public health recommendations. CA Cancer J. Clin. 2020, 70, 460–479. [Google Scholar] [CrossRef] [PubMed]
  14. Liao, Q.; Zhu, M.; Wu, L.; Pan, X.; Tang, X.; Wang, Z. Deep learning for air quality forecasts: A review. Curr. Pollut. Rep. 2020, 6, 399–409. [Google Scholar] [CrossRef]
  15. Zaini, N.; Ean, L.W.; Ahmed, A.N.; Malek, M.A. A systematic literature review of deep learning neural network for time series air quality forecasting. Environ. Sci. Pollut. Res. 2022, 29, 4958–4990. [Google Scholar] [CrossRef]
  16. Zhang, Y.; Bocquet, M.; Mallet, V.; Seigneur, C.; Baklanov, A. Real-time air quality forecasting, part I: History, techniques, and current status. Atmos. Environ. 2012, 60, 632–655. [Google Scholar] [CrossRef]
  17. Ren, X.; Mi, Z.; Georgopoulos, P.G. Comparison of Machine Learning and Land Use Regression for fine scale spatiotemporal estimation of ambient air pollution: Modeling ozone concentrations across the contiguous United States. Environ. Int. 2020, 142, 105827. [Google Scholar] [CrossRef]
  18. Wang, S.; McGibbon, J.; Zhang, Y. Predicting high-resolution air quality using machine learning: Integration of large eddy simulation and urban morphology data. Environ. Pollut. 2024, 344, 123371. [Google Scholar] [CrossRef]
  19. Zhang, L.; Liu, Y.; Zhao, F. Important meteorological variables for statistical long-term air quality prediction in eastern China. Theor. Appl. Climatol. 2018, 134, 25–36. [Google Scholar] [CrossRef]
  20. Zhang, Y.; Wang, Y.; Gao, M.; Ma, Q.; Zhao, J.; Zhang, R.; Wang, Q.; Huang, L. A Predictive Data Feature Exploration-Based Air Quality Prediction Approach. IEEE Access 2019, 7, 30732–30743. [Google Scholar] [CrossRef]
  21. Agirre-Basurko, E.; Ibarra-Berastegi, G.; Madariaga, I. Regression and multilayer perceptron-based models to forecast hourly O3 and NO2 levels in the Bilbao area. Environ. Model. Softw. 2006, 21, 430–446. [Google Scholar] [CrossRef]
  22. Corani, G. Air quality prediction in Milan: Feed-forward neural networks, pruned neural networks and lazy learning. Ecol. Model. 2005, 185, 513–529. [Google Scholar] [CrossRef]
  23. Cabaneros, S.M.S.; Calautit, J.K.S.; Hughes, B.R. Hybrid artificial neural network models for effective prediction and mitigation of urban roadside NO2 pollution. Energy Procedia 2017, 142, 3524–3530. [Google Scholar] [CrossRef]
  24. Caselli, M.; Trizio, L.; De Gennaro, G.; Ielpo, P. A simple feedforward neural network for the PM 10 forecasting: Comparison with a radial basis function network and a multivariate linear regression model. Water Air Soil Pollut. 2009, 201, 365–377. [Google Scholar] [CrossRef]
  25. Cordova, C.H.; Portocarrero, M.N.L.; Salas, R.; Torres, R.; Rodrigues, P.C.; López-Gonzales, J.L. Air quality assessment and pollution forecasting using artificial neural networks in Metropolitan Lima-Peru. Sci. Rep. 2021, 11, 24232. [Google Scholar] [CrossRef]
  26. Das, B.; Dursun, Ö.O.; Toraman, S. Prediction of air pollutants for air quality using deep learning methods in a metropolitan city. Urban Clim. 2022, 46, 101291. [Google Scholar] [CrossRef]
  27. Shahriar, S.A.; Choi, Y.; Islam, R.; Zanganeh Kia, H.; Salman, A.K. Evaluating the Efficacy of Deep Learning and Hybrid Models in Forecasting PM2.5 Concentrations in Texas: A 7-Day Predictive Analysis. 2024. Available online: https://ssrn.com/abstract=4709966 (accessed on 15 March 2024).
  28. Jiang, F.; Han, X.; Zhang, W.; Chen, G. Atmospheric PM2.5 prediction using DeepAR optimized by sparrow search algorithm with opposition-based and fitness-based learning. Atmosphere 2021, 12, 894. [Google Scholar] [CrossRef]
  29. Bahdanau, D. Neural machine translation by jointly learning to align and translate. arXiv 2014, arXiv:1409.0473. [Google Scholar]
  30. Vaswani, A. Attention is all you need. Adv. Neural Inf. Process. Syst. 2017. [Google Scholar]
  31. Zhu, C.; Tang, Y. An Empirical Analysis of the Long Short Term Memory and Temporal Fusion Transformer Models on Regional Air Quality Forecast. In Proceedings of the 2023 International Conference on Cyber-Physical Social Intelligence (ICCSI), Xi’an, China, 20–23 October 2023; IEEE: Piscataway, NJ, USA, 2023; pp. 497–502. [Google Scholar]
  32. Zhang, Z.; Zhang, S. Modeling air quality PM2.5 forecasting using deep sparse attention-based transformer networks. Int. J. Environ. Sci. Technol. 2023, 20, 13535–13550. [Google Scholar] [CrossRef]
  33. Zhao, S.; Yu, Y.; Yin, D.; He, J.; Liu, N.; Qu, J.; Xiao, J. Annual and diurnal variations of gaseous and particulate pollutants in 31 provincial capital cities based on in situ air quality monitoring data from China National Environmental Monitoring Center. Environ. Int. 2016, 86, 92–106. [Google Scholar] [CrossRef]
  34. Alexandrino, K.; Zalakeviciute, R.; Viteri, F. Seasonal variation of the criteria air pollutants concentration in an urban area of a high-altitude city. Int. J. Environ. Sci. Technol. 2021, 18, 1167–1180. [Google Scholar] [CrossRef]
  35. James, P.; Smith, L.; Jonczyk, J.; Harris, N.; Komar, T.; Puussaar, A.; Clement, M.; Dawson, R. Urban Observatory Data Newcastle (Version 4). Newcastle University. 2020. Available online: https://doi.org/10.25405/data.ncl.c.5059913.v4 (accessed on 15 March 2024).
  36. Hochreiter, S. The vanishing gradient problem during learning recurrent neural nets and problem solutions. Int. J. Uncertain. Fuzziness Knowl.-Based Syst. 1998, 6, 107–116. [Google Scholar] [CrossRef]
  37. Hochreiter, S.; Schmidhuber, J. Long short-term memory. Neural Comput. 1997, 9, 1735–1780. [Google Scholar] [CrossRef]
  38. Salinas, D.; Flunkert, V.; Gasthaus, J.; Januschowski, T. DeepAR: Probabilistic forecasting with autoregressive recurrent networks. Int. J. Forecast. 2020, 36, 1181–1191. [Google Scholar] [CrossRef]
  39. Lim, B.; Arık, S.Ö.; Loeff, N.; Pfister, T. Temporal fusion transformers for interpretable multi-horizon time series forecasting. Int. J. Forecast. 2021, 37, 1748–1764. [Google Scholar] [CrossRef]
  40. Han, Y.; Zhang, Q.; Li, V.O.; Lam, J.C. Deep-AIR: A hybrid CNN-LSTM framework for air quality modeling in metropolitan cities. arXiv 2021, arXiv:2103.14587. [Google Scholar]
  41. Le, V.D.; Bui, T.C.; Cha, S.K. Spatiotemporal deep learning model for citywide air pollution interpolation and prediction. In Proceedings of the 2020 IEEE International Conference on Big Data and Smart Computing (BigComp), Busan, Republic of Korea, 19–22 February 2020; IEEE: Piscataway, NJ, USA, 2020; pp. 55–62. [Google Scholar]
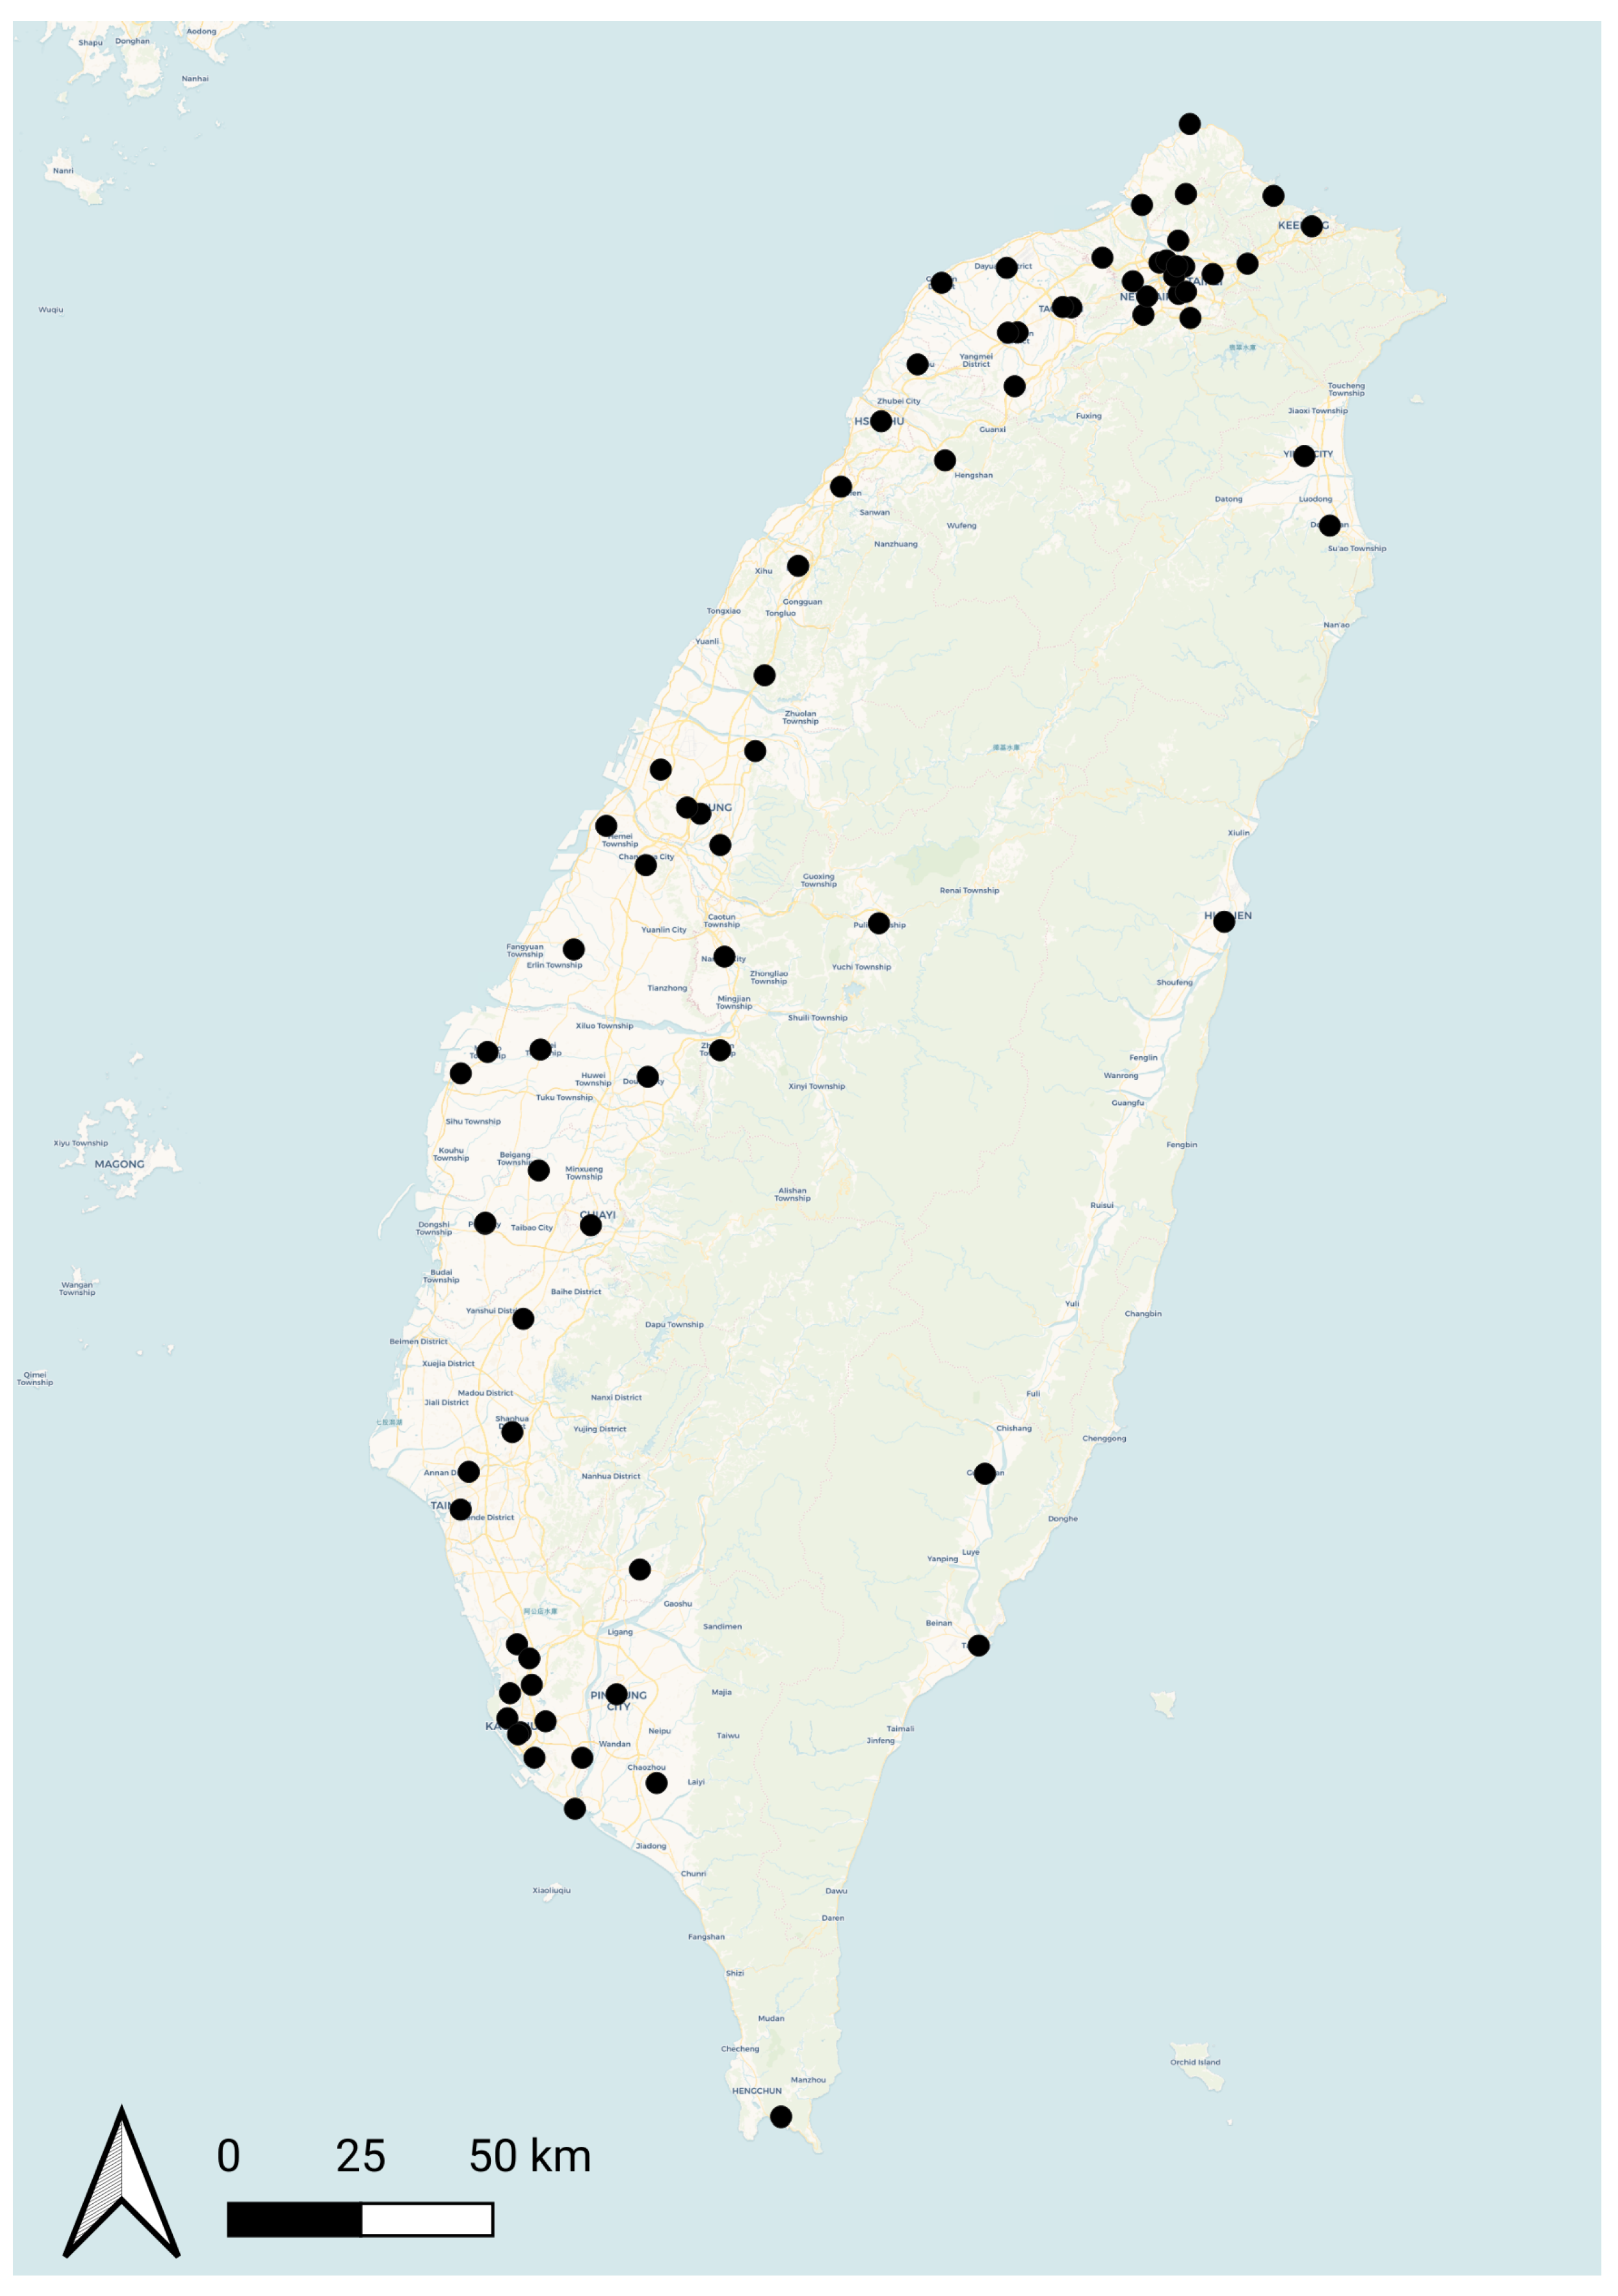
Figure 1. Air quality sensor locations across the Taiwan region.
Forecasting 07 00066 g001
Figure 2. Air quality sensor locations across the Beijing region.
Forecasting 07 00066 g002
Figure 3. Air quality sensor locations across the Newcastle upon Tyne region.
Forecasting 07 00066 g003
Figure 4. Average RMSE achieved for each of the best hyperparameter configurations for each algorithm for each pollutant in Taiwan. Findings show that Temporal Fusion Transformer and DeepAR consistently outperformed LSTM and feedforward neural networks, with Temporal Fusion Transformer achieving the best results for the majority. Blue = TFT, Green = DeepAR, Red = LSTM, Orange = FNN.
Forecasting 07 00066 g004
Figure 5. Taiwan example 24 h forecasts on two unseen sensors in the test dataset, highlighting the ability of each of the the best models for each pollutant. Blue = actual observations, Orange = model forecast, dark and light orange bands = 0.5 and 0.9 confidence intervals respectively.
Forecasting 07 00066 g005
Figure 6. Average RMSE achieved for each of the best hyperparameter configurations for each algorithm for each pollutant in Beijing. Findings show that Temporal Fusion Transformer and DeepAR consistently outperformed LSTM and feedforward neural networks, with Temporal Fusion Transformer achieving the best results for the majority. Blue = TFT, Green = DeepAR, Red = LSTM, Orange = FNN.
Forecasting 07 00066 g006
Figure 7. Beijing example 24 h forecasts on two unseen sensors in the test dataset, highlighting the ability of each of the the best models for each pollutant. Blue = actual observations, Orange = model forecast, dark and light orange bands = 0.5 and 0.9 confidence intervals respectively.
Forecasting 07 00066 g007
Figure 8. Average RMSE achieved for each of the best hyperparameter configurations for each algorithm for each pollutant in Newcastle upon Tyne. Findings show that Temporal Fusion Transformer and DeepAR consistently outperformed LSTM and feedforward neural networks, with Temporal Fusion Transformer achieving the best results for the majority. Blue = TFT, Green = DeepAR, Red = LSTM, Orange = FNN.
Forecasting 07 00066 g008
Figure 9. Newcastle upon Tyne example 24 h forecasts on two unseen sensors in the test dataset, highlighting the ability of each of the best models for each pollutant. Blue = actual observations; orange = model forecast; dark and light orange bands = 0.5 and 0.9 confidence intervals, respectively.
Forecasting 07 00066 g009
Table 1. Air quality datasets temporal and spatial scale statistics. All datasets cover a complete annual cycle to capture seasonal air quality dynamics.
LocationStart DateEnd DateSensorsArea km2Density
Taiwan01-01-201931-12-20196933,2540.002
Beijing01-01-201731-12-20173581670.004
Newcastle01-01-202231-12-202225870.29
Table 2. Air pollutants summary statistics.
LocationCO ( μ , σ )NO2 ( μ , σ )O3 ( μ , σ )PM2.5 ( μ , σ )PM10 ( μ , σ )
Taiwan397.94, 192.3322.55, 15.7260.32, 37.2018.08, 12.8436.08, 23.59
Beijing968.66, 1068.3145.91, 32.2356.21, 54.1757.57, 60.4681.30, 61.33
Newcastle276.47, 109.2932.60, 18.0126.77, 24.465.02, 7.977.44, 8.93
Table 3. Best model configurations based on hyperparameter tuning for each algorithm for each pollutant. Optimal context lengths suggest that approximately three days of historic data is required to achieve optimal predictions. NO is shown to be a useful predictor for CO, O3, PM10, PM2.5 and PM10. The longitude has a large influence in predicting many of the pollutants, with the latitude being of less relevance. Wind speed appears to be more useful than wind direction.
VariableAlgorithmRMSECLLatLonCONONO2O3PM10PM2.5Wind
Direction
Wind Speed
COTFT0.1565---YY--Y-Y
DeepAR0.1654Y--Y--Y---
SFF0.1972-------Y-Y
LSTM0.2527-Y-YY--YYY
NOTFT6.0871-Y---YYY--
DeepAR7.2467YY---Y-Y-Y
LSTM8.3751YYY-----Y-
SFF9.3517-Y--YY-Y-Y
NO2TFT9.9272Y-Y--Y-YYY
DeepAR9.9969--YY--YY--
SFF14.4469-Y-Y--Y-YY
LSTM19.1040YYY---YYY-
O3TFT16.1263-YYYY--Y-Y
DeepAR19.8162-YYYY-Y--Y
SFF24.2371-YY----Y--
LSTM24.2453Y-YY---Y--
PM10TFT6.5572-Y-Y---Y--
DeepAR8.7914-Y----Y---
SFF11.9172---Y-Y--YY
LSTM17.8367Y-Y-Y-----
PM2.5DeepAR3.3872-YY----Y--
TFT3.5372---Y-Y-Y--
SFF5.9568Y-YYY--YY-
LSTM8.6754-Y-Y-Y--Y-
Table 4. Best model configurations based on hyperparameter tuning for each algorithm for each pollutant in Beijing. Optimal context lengths suggest that approximately two days of historic data is required to achieve optimal predictions, though the variance of these context lengths are large. O3 is shown to be a useful predictor for CO, NO2 and PM2.5. CO is also shown to be a useful predictor for NO2, O3 and PM10. Latitude is shown to be a useful predictor, with the the longitude being slightly less useful according to the results.
Include Feature
VariableAlgorithmRMSECLLatLonCONO2O3PM2.5PM10HumidityAir PressureTemperatureWind DirectionWind Speed
COTFT0.1316Y--YY-Y-Y-YY
DeepAR0.1428---YY-Y-----
SFF0.2536-Y--Y----YY-
LSTM0.3330-Y--YYYYY--Y
NO2TFT4.7756--Y-YYY---YY
DeepAR7.4620Y---YY-----Y
LSTM17.5866-Y----------
SFF21.0228Y----YY-Y---
O3DeepAR7.4269--YY-YY-Y-Y-
TFT11.8941YYYY-Y---Y--
LSTM16.8872------YY---Y
SFF18.0828Y-------YY-Y
PM10TFT25.5153Y-Y--Y---Y--
LSTM29.4647YYYY---YYY--
DeepAR30.2259---Y-Y---YYY
SFF40.1959-YY--Y--Y---
PM2.5DeepAR7.3513YY-YY-------
TFT9.4528--Y-Y-Y-YY--
LSTM11.0938YY--Y-Y-YYY-
SFF15.4552--Y-Y-YYY--Y
Table 5. Best model configurations based on hyperparameter tuning for each algorithm for each pollutant in Newcastle upon Tyne. Findings suggest that for CO and PM10, a history of approximately 64 h is required, whereas NO2, O3 and PM2.5 require approximately 20 h. DeepAR is shown to be the dominant model for the Newcastle dataset. O3 is shown to be useful in predicting CO, PM10 and PM2.5, along with the longitude being shown to be useful for many of the pollutants. Temperature and humidity are shown to be useful for the majority of models tested.
VariableAlgorithmRMSECLLatLonCONO2O3PM2.5PM10HumidityAir PressureTemperature
COTFT72.8966Y--YY-Y--Y
LSTM93.4056YY---Y-YY-
DeepAR102.8315YY-YY-YY-Y
SFF104.6615YY-YY----Y
NO2DeepAR12.1212-YY--YYY-Y
SFF12.3467YYY-YY-YY-
TFT13.2465Y-Y--Y---Y
LSTM20.8349-Y---Y-YY-
O3DeepAR4.6727---Y------
SFF5.7571YYY----Y--
LSTM5.7957Y----Y-Y-Y
TFT7.6014-Y-Y-Y--YY
PM10DeepAR0.8262----YY----
TFT1.0426-YYYYY-Y--
SFF1.0438--Y--Y--YY
LSTM3.2639----Y--YYY
PM2.5DeepAR0.9520-Y-YY--Y-Y
SFF0.9934-Y-Y--Y--Y
TFT1.1025Y-Y-Y--Y--
LSTM2.3546-Y-YY-YYYY
Disclaimer/Publisher’s Note: The statements, opinions and data contained in all publications are solely those of the individual author(s) and contributor(s) and not of MDPI and/or the editor(s). MDPI and/or the editor(s) disclaim responsibility for any injury to people or property resulting from any ideas, methods, instructions or products referred to in the content.