Abstract
Research shows that Google Trend indices can improve tourism-demand forecasts. Given the impact of the recent pandemic, this may prove to be an important predictor of tourism recovery in countries that are still struggling to recover, including South Africa. The purpose of this paper is firstly, to build on previous research that indicates that Google Trends improves tourism-demand forecasting by testing this within the context of tourism recovery. Secondly, this paper extends previous research by not only including Google Trends in time-series forecasting models but also typical tourism-demand covariates in an econometric specification. Finally, we test the performance of Google Trends in forecasting over a longer time period, because the destination country is a long-haul destination where more lead time may be required in decision-making. Additionally, this research contributes to the body of knowledge by including lower frequency data (quarterly) instead of the higher frequency data commonly used in current research, while also focusing on an important destination country in Africa. Due to the differing data frequencies, the MIDAS modelling approach is used. The MIDAS models are compared to typical time-series and naïve benchmarks. The findings show that monthly Google Trends improve forecasts on lower frequency data. Furthermore, forecasts that include Google Trends are more effective in forecasting one to two quarters ahead, pre-COVID. This trend changed after COVID, when Google Trends led to improved recovery forecasts even over a longer term.
1. Introduction
Recent years have seen an increase in the use of Big Data in forecasting studies, and tourism forecasting is no exception. According to [1], Big Data can be defined using the 4V concept—namely, big data is characterised by volume, variety, velocity and value. The rationale for using Big Data in tourism forecasting studies is based on the proposition that it reflects the preferences and decision-making processes of tourists [2]. According to [3], four types of Big Data can be identified in the tourism-demand literature, namely, web search data, online textual data, online photo data and social media data.
The most predominant type of Big Data found in tourism forecasting studies is web search data. Ref. [4] report that web search data from Google and Baidu search engines are most frequently employed, with [5] paving the way by using Google Trends data to forecast Hong Kong tourism. Since then, data from these search engines have been used to not only forecast tourism demand for countries and cities but also hotel demand [4]. The recent COVID-19 pandemic that disrupted tourism around the world caused a structural break in tourist arrivals to all countries. Given the impact that the recent pandemic had on the tourism industry, Big Data may prove to be an important predictor of tourism recovery in countries that are still struggling to recover. One such country is South Africa, where tourism demand is still well below its pre-pandemic levels, it having recovered just more than 80% of pre-pandemic levels by the end of 2023.
Arrivals from Africa are South Africa’s main tourism source markets, accounting for 75% of all tourist arrivals, with neighbouring countries accounting for the lion’s share. In terms of the remaining 25% of overseas arrivals (2019 figures), the country’s main tourism source markets are the UK (14.4%), the USA (14.2%), Germany (12.2%), France (6.3%), the Netherlands (5.5%), Australia (4.2%) and India (3.6%). In terms of recovery, arrivals from Africa have recovered quicker than overseas arrivals (84% versus 79%), underscoring the importance of improving recovery forecasting.
The purpose of this paper is, firstly, to build on previous research that indicates that Google Trends has the potential to improve tourism-demand forecasting by testing this within the context of tourism recovery after a shock. Secondly, this paper extends previous research by not only including Google Trends in time-series forecasting models but also including typical tourism-demand covariates in an econometric forecasting specification. Finally, we test the performance of Google Trends in forecasting over a longer time period because the destination country is a long-haul destination where more lead time may be required in decision-making.
The rationale for including Google Trends data in forecasting tourism arrivals can be found in the notion that potential tourists use the internet to plan their travel activities [5]. Therefore, the internet has become an important source of information for potential tourists and, according to [6], it signals tourists’ consumption preferences and informs their decision-making. It is therefore not surprising that [1] reports that forecasting using web search data is more prevalent in tourism than in any other subject area.
When considering only tourism demand (and not papers that focus only on hotel demand, which is a subset of tourism demand), web search data has been used to forecast demand for countries, regions/provinces, cities and attractions. In terms of country research, tourism to Spain was investigated by [7,8]. Ref. [9] forecasted tourism arrivals to South Korea, [10] China, the USA, [11] Austria, [12] Germany, and [13] to China, Turkey and the US. Table 1 provides a brief overview of the country, web search engine, data frequency and estimation methods used in these studies.
In terms of regions/provinces/states, tourism to Hong Kong leads the way and has been studied by [4,5,14,15,16,17]. Ref. [2] forecasted tourism arrivals to Hainan, China, [18] Macau, China [19], Taiwan, China, and [20] the Caribbean. Table 2 provides a summary of these studies in terms of data frequency, search data and estimation method.
The research focussing on forecasting tourism to cities is substantial, with Beijing, China, the most popular city, studied by [21,22,23,24,25]. While most of these studies used the Baidu Index, refs. [23,25] used both the Baidu and Google Indices in their studies. Ref. [26] forecasted tourism to four Taiwan cities. For European cities, [27] forecasted tourist arrivals to Prague using Google Trends data, [28] tourism to Vienna and [29] forecasted tourism to Vienna and Barcelona. These studies are summarised in Table 3.

Table 1.
Forecasting tourism to countries using web search data.
Table 1.
Forecasting tourism to countries using web search data.
| Countries | Author | Web Search Engine | Data Frequency | Estimation Method |
|---|---|---|---|---|
| Spain | Artola et al. (2015) [7] | Monthly | ARIMAX | |
| Maximo and Jose (2018) [8] | Monthly | AR-X | ||
| South Korea | Park et al. (2016) [9] | Monthly | ARIMAX | |
| China | Lv et al. (2018) [10] | Google and Baidu | Weekly and Monthly | SEAN * regression |
| Wang et al. (2020) [13] | Monthly | ANN-based, SARIMA | ||
| USA | Lv et al. (2018) [10] | Google and Baidu | Weekly and Monthly | SEAN * regression |
| Wang et al. (2020) [13] | Monthly | ANN-based, SARIMA | ||
| Turkey | Wang et al. (2020) [13] | Monthly | ANN-based, SARIMA | |
| Austria | Önder (2017) [29] | Monthly | ADLM, Naïve, AR, Holt-Winters | |
| Spain | Önder (2017) [29] | Monthly | ADLM, Naïve, AR, Holt-Winters | |
| Germany | Bokelman and Lessmann (2019) [12] | Monthly | SARIMA, DLM * |
* SEAN = stacked autoencoder with echo-state (ANN-based); DLM = distributed lag model.
Table 2.
Forecasting tourism to regions/provinces using web search data.
Table 2.
Forecasting tourism to regions/provinces using web search data.
| Regions/Provinces | Author | Web Search Engine | Data Frequency | Estimation Method |
|---|---|---|---|---|
| Hong Kong | Gawlik et al. (2011) [14] | Monthly | Weighted linear regression | |
| Choi and Varian (2012) [5] | Monthly | AR-X | ||
| Wen et al. (2019) [6] | Baidu | Monthly | ARIMA, ARIMAX, NAR, NARX, Hybrid | |
| Bai and Hao (2021) [15] | Baidu and Google | Monthly | Random Walk, ARIMAX, SVR, ANN, Two-step DB-ensemble DBN | |
| Li and Law (2020) [16] | Monthly | AR, Empirical Mode Decomposition ARX | ||
| Wen et al. (2021) [17] | Baidu | Monthly | Naïve, ETS, SARIMA, SARIMAX, MIDAS | |
| Xie et al. (2021) [4] | Baidu and Google | Monthly | ARIMA, BPNN, SVR, LSSVR, MA-LSSVR | |
| Hainan, China | Yang et al. (2015) [2] | Baidu and Google | Monthly | ARIMAX |
| Macau, China | Hu and Song (2021) [18] | Monthly | ANN | |
| Taiwan | Huarng and Yu (2019) [19] | Monthly | Algorithms | |
| Caribbean | Bangwayo–Skeete and Skeete (2015) [20] | Monthly | AR-MIDAS |
Tourism to specific attractions is also forecasted using search data with [30] forecasting tourism to the Miao Village in China, [31] forecasting demand for five London museums, [26,32] to Mount Siguniang, China, [33] to the Forbidden City, Beijing, and [21,34] to Jiuzhaigou, China.
Table 3.
Forecasting tourism to cities using web search data.
Table 3.
Forecasting tourism to cities using web search data.
| Cities | Author | Web Search Engine | Data Frequency | Estimation Method |
|---|---|---|---|---|
| Beijing | Li et al. (2017) [21] | Baidu | Monthly | ARMA, Dynamic Factor Model |
| Li et al. (2018b) [22] | Baidu | Monthly | BPNN | |
| Sun et al. (2019) [23] | Baidu and Google | Monthly | Extreme Machine Learning (EML), ARIMA, ARIMAX, ANN, SVR, LSSVR | |
| Li et al. (2021) [24] | Baidu | Monthly | ARIMA, ARMIAX, ML | |
| Sun et al. (2022) [25] | Monthly | SN, SARIMA, SES, ARDL, SARIMAX, MLP, B-MLP, KELM, B-KELM, and SAKE | ||
| Wu et al. (2023) [35] | Baidu | Monthly | SARIMA-MIDAS, DFM, ETS, SNaive | |
| Taiwan cities | Hu & Wu (2022) [26] | Monthly | Grey models (AI) and combinations | |
| Prague | Havranek and Zeynalov (2019) [27] | Weekly and Monthly | MIDAS | |
| Vienna | Önder and Günter (2016) [28] | Monthly | ADLM, Naïve, AR, Holt-Winters | |
| Önder (2017) [29] | Monthly | ADLM, Naïve, AR, Holt-Winters | ||
| Barcelona | Önder (2017) [29] | Monthly | ADLM, Naïve, AR, Holt-Winters |
From the tables above, some clear patterns can be identified. Firstly, there is a paucity of studies focussing on forecasting tourism to Africa, with Asia and Europe attracting most of the research interest. Secondly, the studies mainly use monthly data with monthly forecasts, with some utilising weekly data as well. Although not shown in the tables, forecasting attraction demand mainly uses daily and weekly data. The reason for this can be found in the assertion that web search data may be helpful in predicting the present, in other words, for nowcasting [5]. Consequently, the current body of research tends to focus more on forecasting the near future than forecasting the longer term or using quarterly data.
The tables thirdly provide a brief overview of the various forecasting methods employed. When considering country tourism forecasts, two methods dominate the research, namely, artificial neural networks or (ANN)-based methods and time-series methods, specifically ARIMA-type models and their extension to include web search data (ARX and ARIMAX). The only exceptions are [12,29], who used autoregressive distributed lag and distributed lag models, where various lags of the web search index are included. Noteworthy is the fact that none of the studies include any typical tourism demand or economic variables in the specification.
The same trend is visible in the provincial/regional and city tourism forecasts. The most predominant forecasting methods remain time-series-based methods (SARIMA, AR, ARX, ARIMA and ARIMAX) and ANN methods, with machine learning methods also becoming popular. In addition, mixed data sampling (MIDAS) was used by [17,20,27,35]. Similar to the country studies, none of the research considers other typical tourism demand or economic variables in the forecasting models, except [25], who include price and income data, and [35], who include economic index data.
Only two papers consider web search data in forecasting tourism over the COVID-19 period. One paper, by [36], uses hotel demand as the dependent variable and found that Google Trends does not improve the accuracy of demand recovery forecasts but concludes that it might be more useful for longer-haul destinations. The second paper [35] forecasted Chinese tourism recovery to Hong Kong. They found that web search data significantly enhances the recovery forecasting accuracy.
The current research addresses the gaps identified above by focussing on tourism to an African country, namely, South Africa, and specifically focussed on forecasting tourism recovery after COVID-19. In addition, we use mixed data sampling with monthly Google Trends data combined with quarterly tourist arrivals, price and income data. We therefore forecast over a longer time horizon and assess the efficacy of search data in improving forecasts over the medium-term. Additionally, this research contributes to the body of knowledge by including lower-frequency data (quarterly) instead of the higher-frequency data commonly used in current research, while also focusing on an important destination country in Africa.
2. Materials and Methods
As indicated, the objective of this research is to determine whether Google trend data improves the prediction of tourism-demand recovery in light of the COVID pandemic that started in 2020.
The data used in this research were tourist arrivals for the main source markets to South Africa and GDP and CPI data on a quarterly basis from 2004 Q1 to 2023 Q4. The data were sourced from Statistics South Africa (arrivals data, https://www.statssa.gov.za/ accessed on 30 March 2024) and the OECD (https://www.oecd.org/en/data.html accessed on 30 March 2024) and IFS databases (https://data.imf.org/?sk=4c514d48-b6ba-49ed-8ab9-52b0c1a0179b accessed 30 March 2024) for the GDP and CPI data, respectively. The focus was on arrivals from the UK, the USA, Germany, France, the Netherlands, Australia and India. The Google Trends data (web search, travel category) for these source markets are available on a monthly basis from January 2004 to May 2024. In addition, another set of Google Trends data was added to determine whether news searches (all categories) on South Africa from source markets improved the forecasts. These data are available from January 2008 to May 2024.
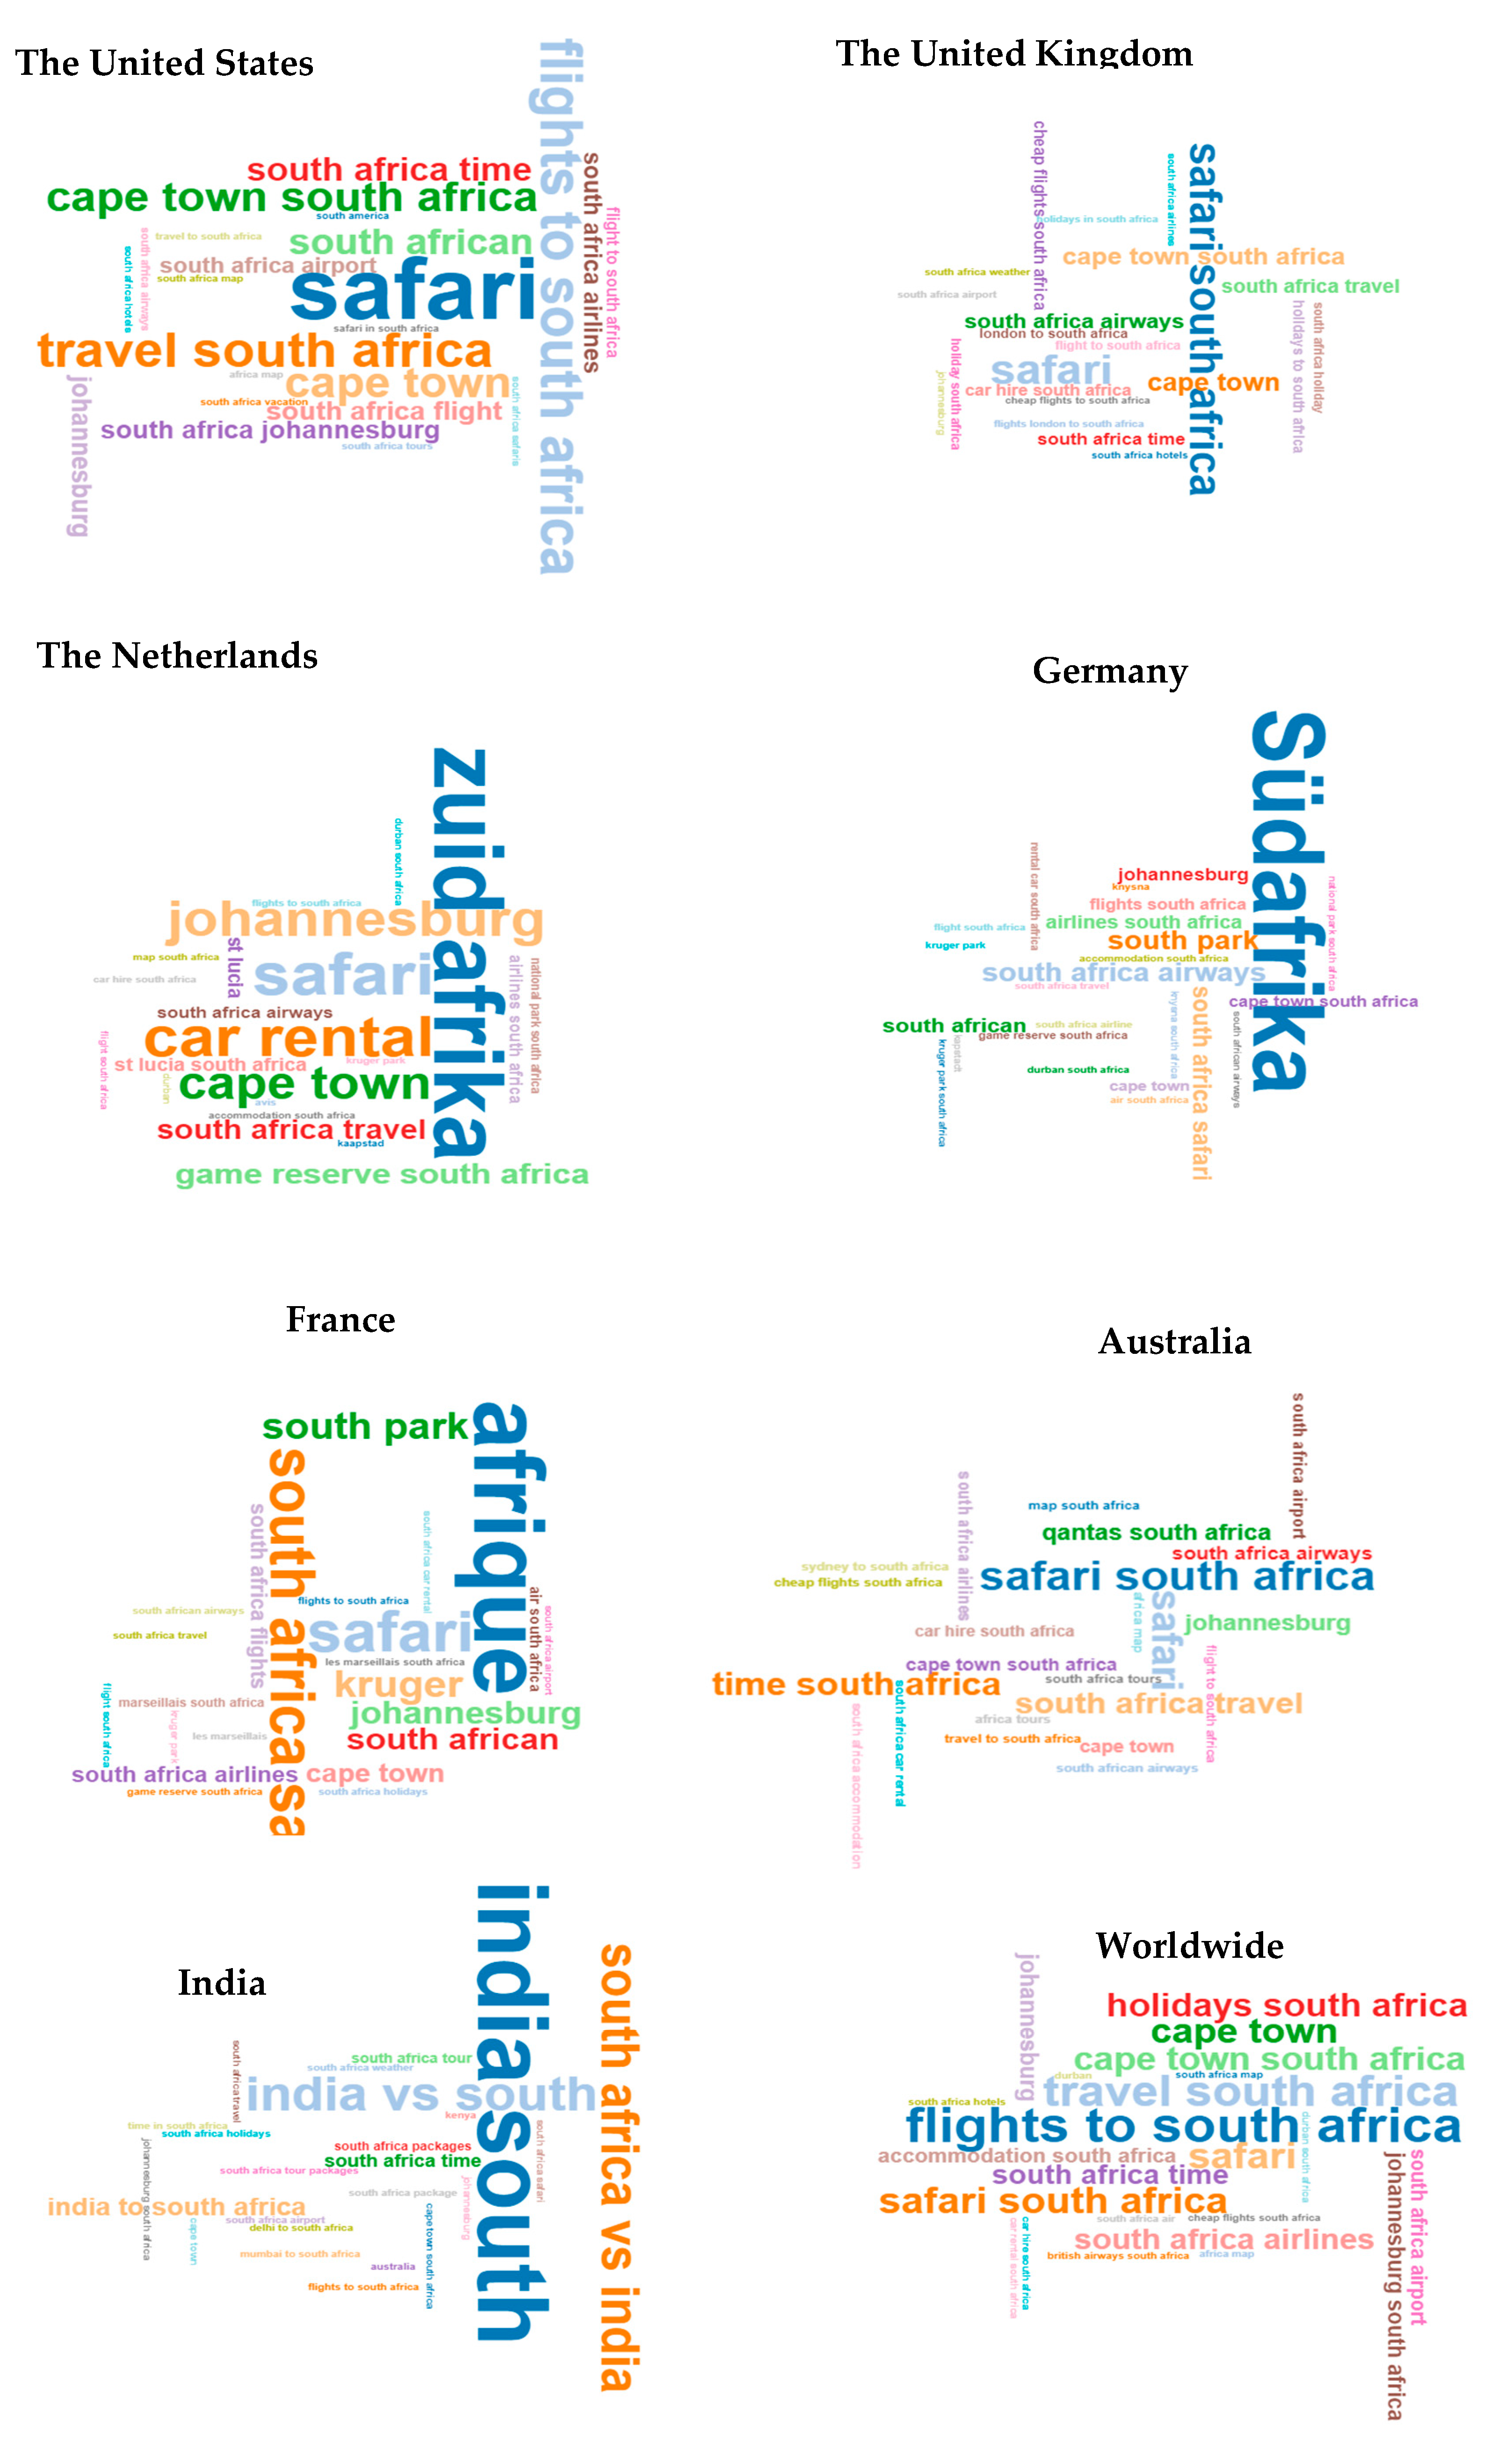
The search query for the Google Trends data for web searches was South Africa under the travel category for each source market. The related queries that fall under the travel category for each source market as well as for the worldwide search are shown in the word clouds below.
From Figure 1, apart from the general travel searches (flights, accommodation, travel, costs, holiday), it is evident that the South African source markets were interested in certain tourist attractions, such as South African safaris, Cape Town, Johannesburg, game reserves and the Kruger National Park. The searches for the Indian source market were mainly in terms of cricket.

Figure 1.
Related search queries per source market.
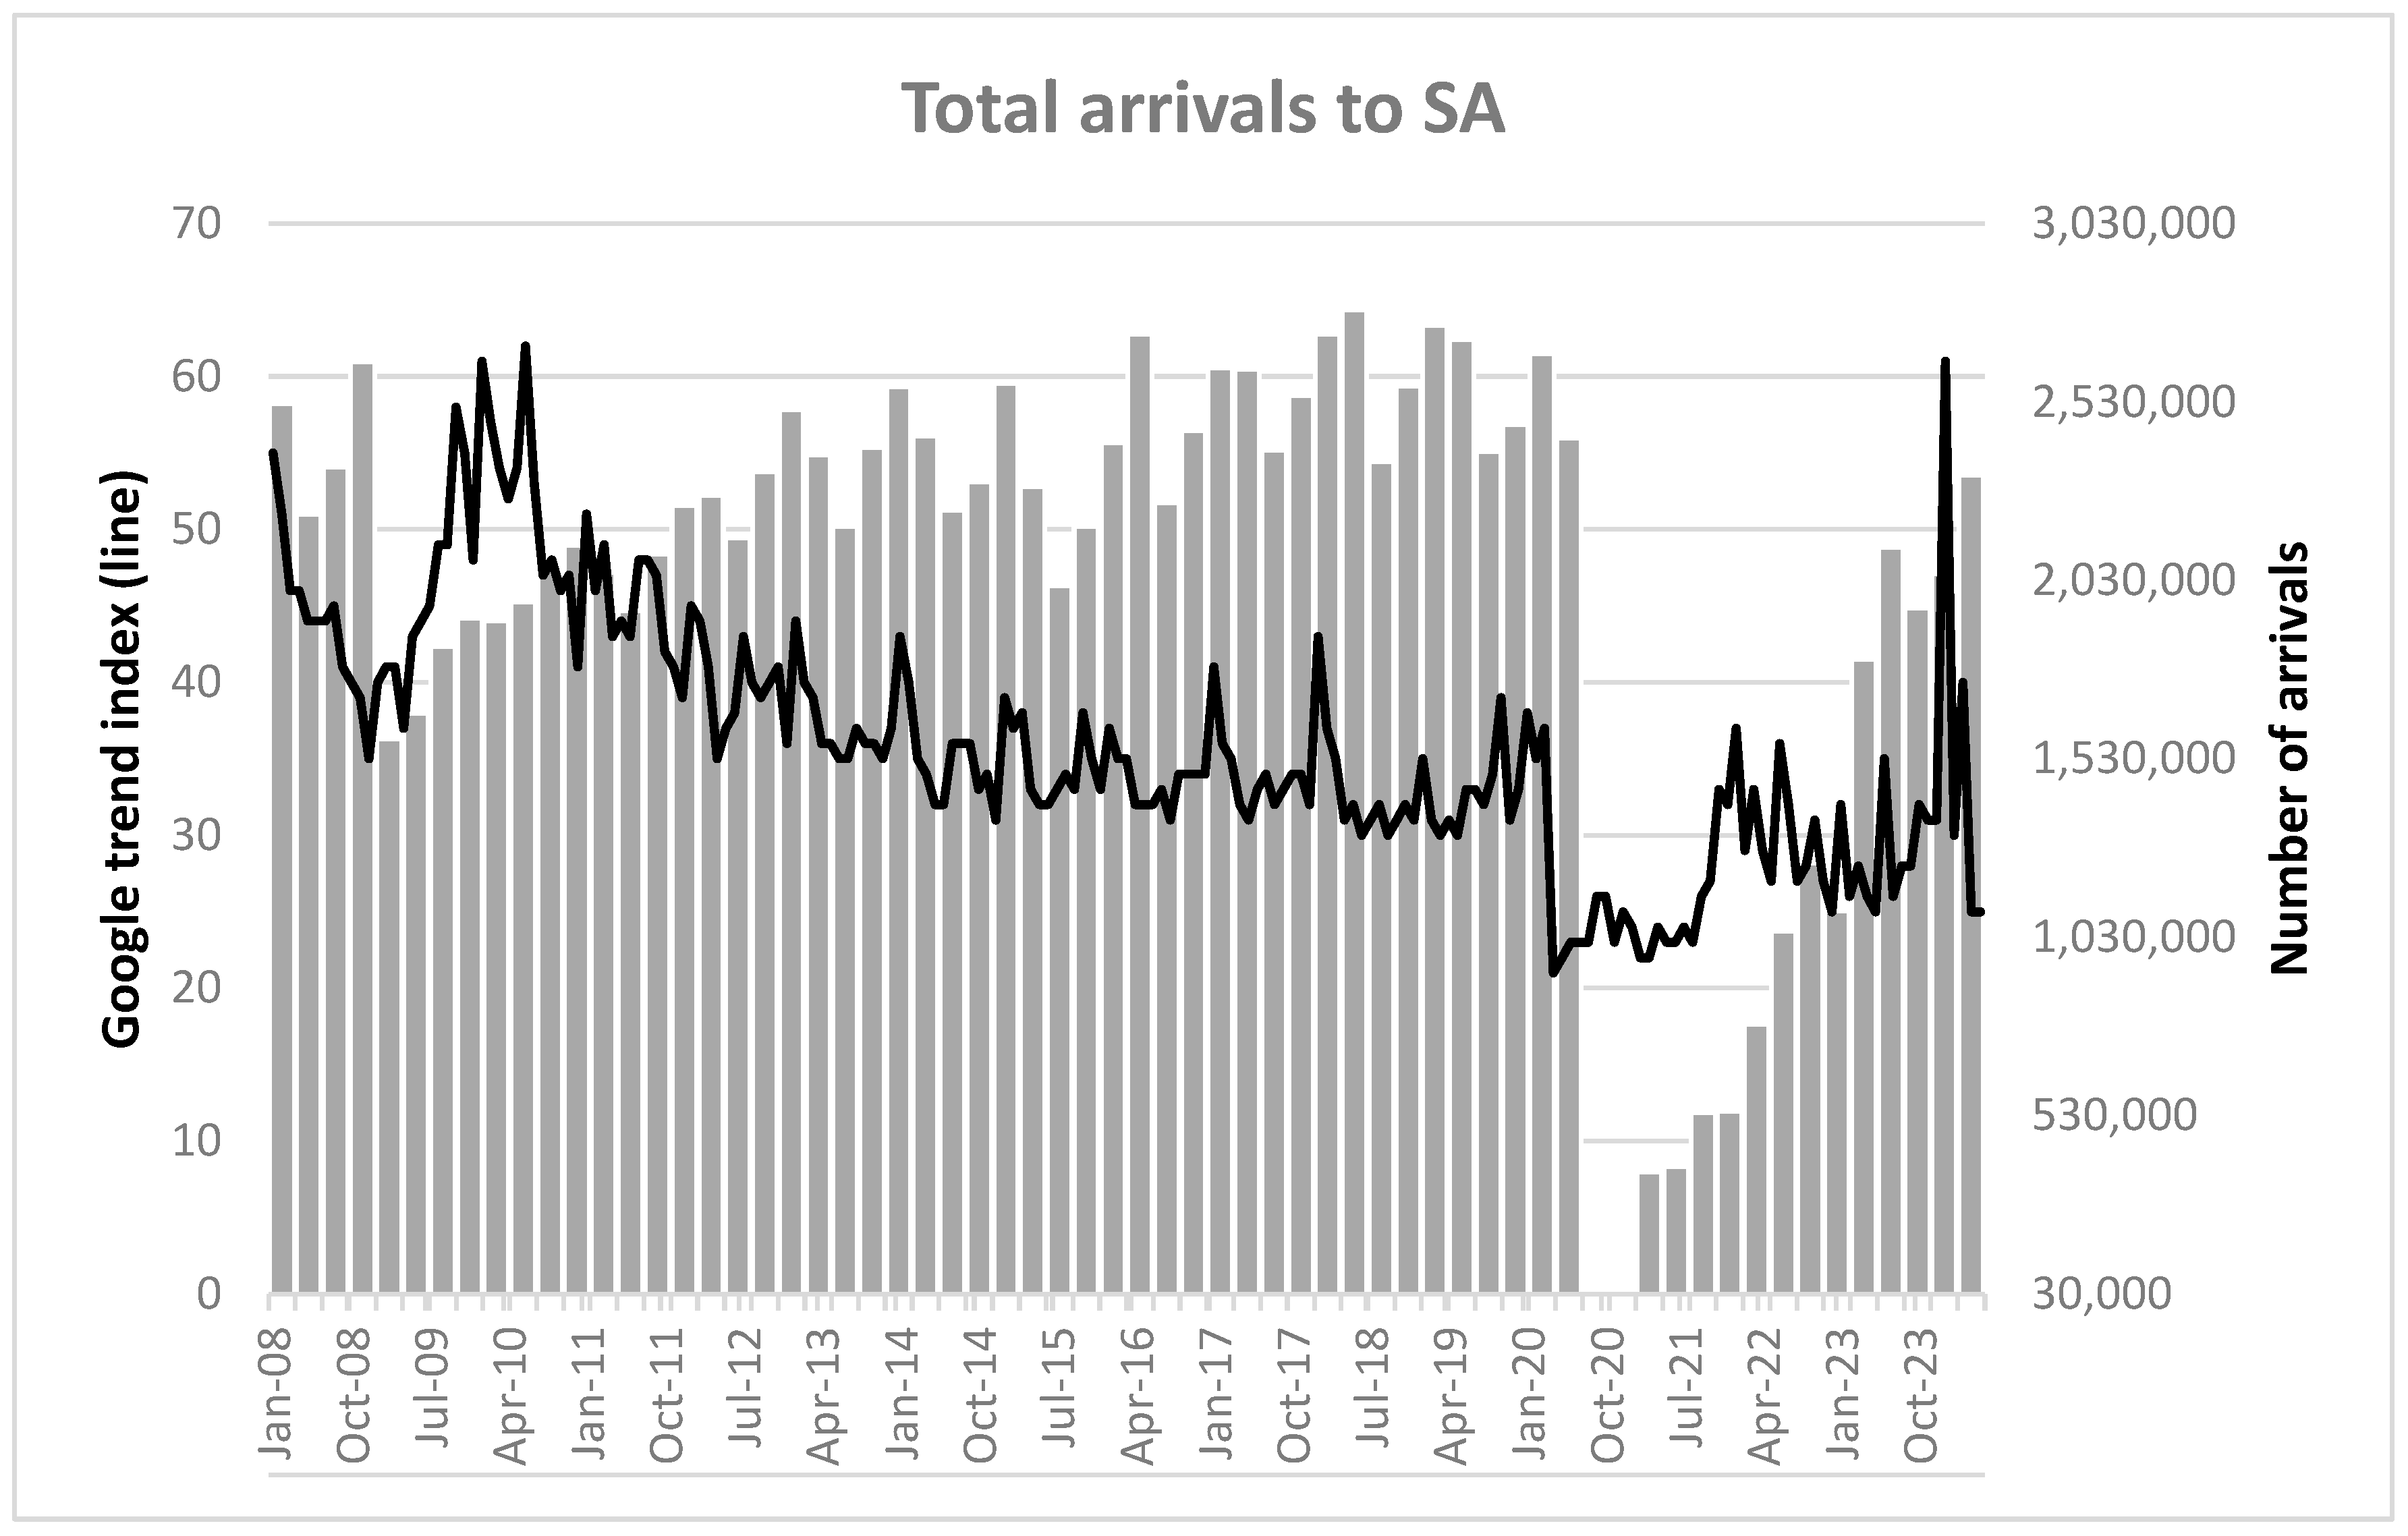
The scaled and normalised Google Trends data were used. Figure 2 plots the total overseas tourist arrivals and the Google web search data (monthly) to the destination country, South Africa. These figures show that there may be an association between the monthly search data and the monthly tourist arrivals, with the Google Trends series a leading indicator of tourist arrivals.
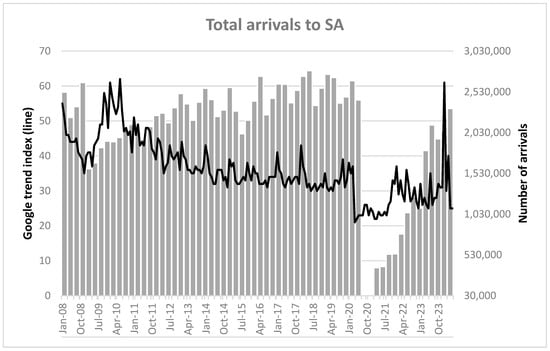
Figure 2.
Total arrivals vs. the Google Trend index.
In terms of methods, the naïve (without drift), ARIMA (1,1) optimized to convergence with the Berndt–Hall–Hall–Hausman and ARDL models, were used as the benchmark models. These models were expanded into an AR-MIDAS-web search model, an AR-MIDAS-web and news search model, an ARDL-MIDAS-web search model and an ARDL-MIDAS-web and news search model. The MIDAS approach was appropriate because it is able to incorporate mixed frequencies [20,28,37]; in this case, monthly Google Trends data, quarterly arrivals and price and income data.
The Augmented Dickey–Fuller test was used to determine the integration order of the time series. The breakpoint unit root test (ADF) was also used to account for the structural break in the data. The results rejected the null hypothesis of a unit root, and therefore, all the series were I (0).
The specification of the AR-MIDAS model for each source market is [20,28,37]:
In the model, represents tourist arrivals, the low frequency dependent variable (quarterly basis), and represents the lag of tourist arrivals; these variables are transformed in logarithmic form. represents the high-frequency independent variable on a monthly basis. denotes the lag operator for monthly lags of and represents the maximum lag order. This was set to , which means that four months of search queries have an impact on current tourist arrivals. represents the weighing function that can have several functional forms (e.g., Almon exponential, Almon polynomial, beta) that determine the weight of the temporal aggregation of the high-frequency observations. are the parameters to be estimated, and is the random error term.
As indicated above, two AR-MIDAS models were estimated for each source market, one including the Google Trends index (web search) under the travel category (MIDAS_W) and another including both the web and news search Google Trends indices (MIDAS_WN). The optimal specification for each country was determined using the Schwarz Criterion.
The alternative econometric model for tourism demand is the ARDL model:
where is arrivals, is income of the origin country, is relative prices and is an i.i.d. white-noise error term. because inflation measures the cost of living in the destination country, the variable is determined as follows:
where is the consumer price index of the origin country, and is the consumer price index of the destination country.
The ARDL model is expanded to include Google Trends data, and therefore, two ARDL-MIDAS models are estimated for each country—one with the monthly web search Google Trends index (ARDL_M_W) and another with both the web and news search Google Trends indices (ARDL_M_WN) [20,28,37]:
In the model, represents tourist arrivals, the low frequency dependent variable (quarterly basis), represents the lag of tourist arrivals, is arrivals, is income of the origin country and is relative prices. represents the high-frequency independent variable/s on a monthly basis. denotes the lag operator for monthly lags of , and represents the maximum lag order.
Given the focus on how the inclusion of Google searches improves the predictive power during a recovery period, the forecasts were evaluated pre- and post-COVID. Rolling forecasts were used due to the structural break in the data. A rolling window of 30 observations was used. The pre-COVID forecast evaluation was from 2014Q4 to 2019Q4, and the post-COVID forecast evaluation was from 2022Q1 to 2023Q4, due to most travel restrictions having been lifted in late 2021 or early 2022. The MAPE and RMSE methods were used to evaluate the forecasts on h = 1, 2, 4, 8 and 12, with four quarters being one year.
3. Results
The forecast evaluations between the benchmark models and the models including Google Trends indices (i.e., MIDAS_W, MIDAS_WN, ARDL_M_W, ARDL_M_WN) are shown in Table 4 and Table 5 below.
Table 4.
Forecast evaluation pre-COVID.
Table 5.
Forecast evaluation post-COVID.
For the pre-COVID forecast evaluations in Table 4, the results are as follows:
The addition of Google trends as an additional explanatory variable outperformed on three forecast horizons for the US source market (h = 2, 8, 12). For forecasts over a longer forecasting horizon (h = 8, 12), the addition of the news search query as an additional explanatory variable improved the forecasts. This may be an indication that prior to COVID, news from South Africa influenced longer-term travel decisions (i.e., 8- to 12-quarters ahead) through changes in perceptions of the country.
For the UK, the MIDAS_ARDL models outperformed on h = 1, 2 and 4, and for h = 1, 2, the addition of the news search improved the forecast. Because the UK is traditionally South Africa’s most important international source market, Google searches may be more related to logistical travel concerns (see Figure 1) than perceptions about the country. A similar trend is visible for tourists from the Netherlands, which is also traditionally an important source market for South Africa and was a previous coloniser. The MIDAS_ARDL models outperformed on all five forecast horizons, with the addition of the news search variable improving h = 1, 2.
For the German source market, the MIDAS_ARDL with the additional news search variable outperformed on the shorter forecast horizons, h = 1, 2, which is more in line with other research that shows the significance of Google Trends data in shorter-term forecasts. For the Indian source market, the MIDAS with the web search variable outperformed on h = 8, which is more aligned with the results from the US source market and may be an indication that Google was used in the decision whether or not to travel to South Africa pre-COVID.
Contrary to the other source markets, the benchmark models outperformed the MIDAS models on all forecast horizons for the French and Australian source markets. This shows that prior to COVID, the underlying trends in the data were sufficient in forecasting future tourism from these two source markets.
Table 5 shows the forecast evaluations for the post-COVID period after the structural break due to the COVID pandemic. The results show the following:
For the US source market, the MIDAS web search models outperformed on all forecast horizons, and the addition of the news search improved h = 4. Post-COVID, web search data therefore became a more important source of information on which this market based their travel decisions in both the short- and long-term.
Similar to the results for the US, for the UK source market, the MIDAS models outperformed on all forecast horizons except for h = 12. The MIDAS_ARDL with the web and news search variables outperformed on h = 1, 2, and for the longer horizons (h = 4, 8), the MIDAS web search models outperformed. Compared to pre-COVID, web search data became important also in longer-term travel forecasts, which may be an indication of the increased uncertainty created by the COVID pandemic.
The MIDAS web and news model outperformed on all forecast horizons for the Netherlands source market, which is similar to the pre-COVID results for this market. Although, post-COVID, the inclusion of economic covariates did not improve the forecasting performance for tourist arrivals from the Netherlands.
For Germany, the MIDAS models outperformed on all forecast horizons; MIDAS_ARDL with web and news search outperformed on the shorter horizons (h = 1, 2, 4) and the MIDAS_WN for h = 8 and MIDAS_W for h = 12. This result may again indicate that, similar to the UK, web search data also became more important in the longer term due to the increased uncertainty caused by the pandemic. However, for India, MIDAS with web search outperformed on h = 2, 4, showing an improvement in short-term forecasts rather than the pre-COVID longer-term forecasts (h = 8).
In contrast to the pre-COVID forecast evaluation, the addition of Google Trends data did improve the forecasts for the French and Australian source markets. For the French source market, the MIDAS models outperformed on all forecast horizons except h = 2, and the addition of the news search variable improved the longer forecast horizons h = 8, 12. For Australia, the MIDAS_ARDL outperformed on h = 8, 12; the addition of the news search variable improved h = 8. This again highlights the increased importance of web search data for information about South Africa after the pandemic.
Figure 3 and Figure 4 compare the forecasting performance of the various models over the different forecasting horizons. Figure 3 shows that pre-COVID, with h = 1, 2, the MIDAS_ARDL with the Google Trends web and news search indices was the best model in three of the seven instances, with the ARIMA model and ARDL model in second and third places. Over the longer term, the naïve model was difficult to outperform, and only the MIDAS_ARDL model that included the web search Google index appeared as the best model in two instances over h = 4 and once when h = 8, 12. Figure 3 and Figure 4 compare the forecasting performance of the various models over the different forecasting horizons. Figure 3 shows that pre-COVID, with h = 1, 2, the MIDAS_ARDL with the Google Trends web and news search indices was the best model in three of the seven instances, with the ARIMA model and ARDL model in second and third places. Over the longer term, the naïve model was difficult to outperform, and only the MIDAS_ARDL model that included the web search Google index appeared as the best model in two instances over h = 4 and once when h = 8, 12.
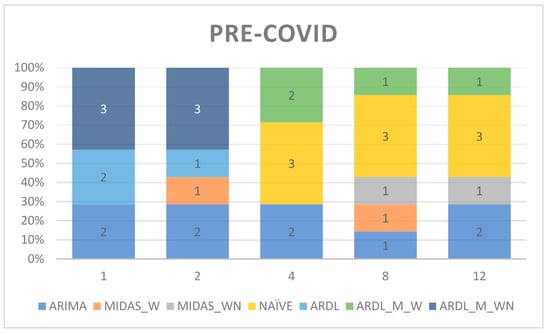
Figure 3.
Best forecasting models over different forecasting horizons pre-COVID.

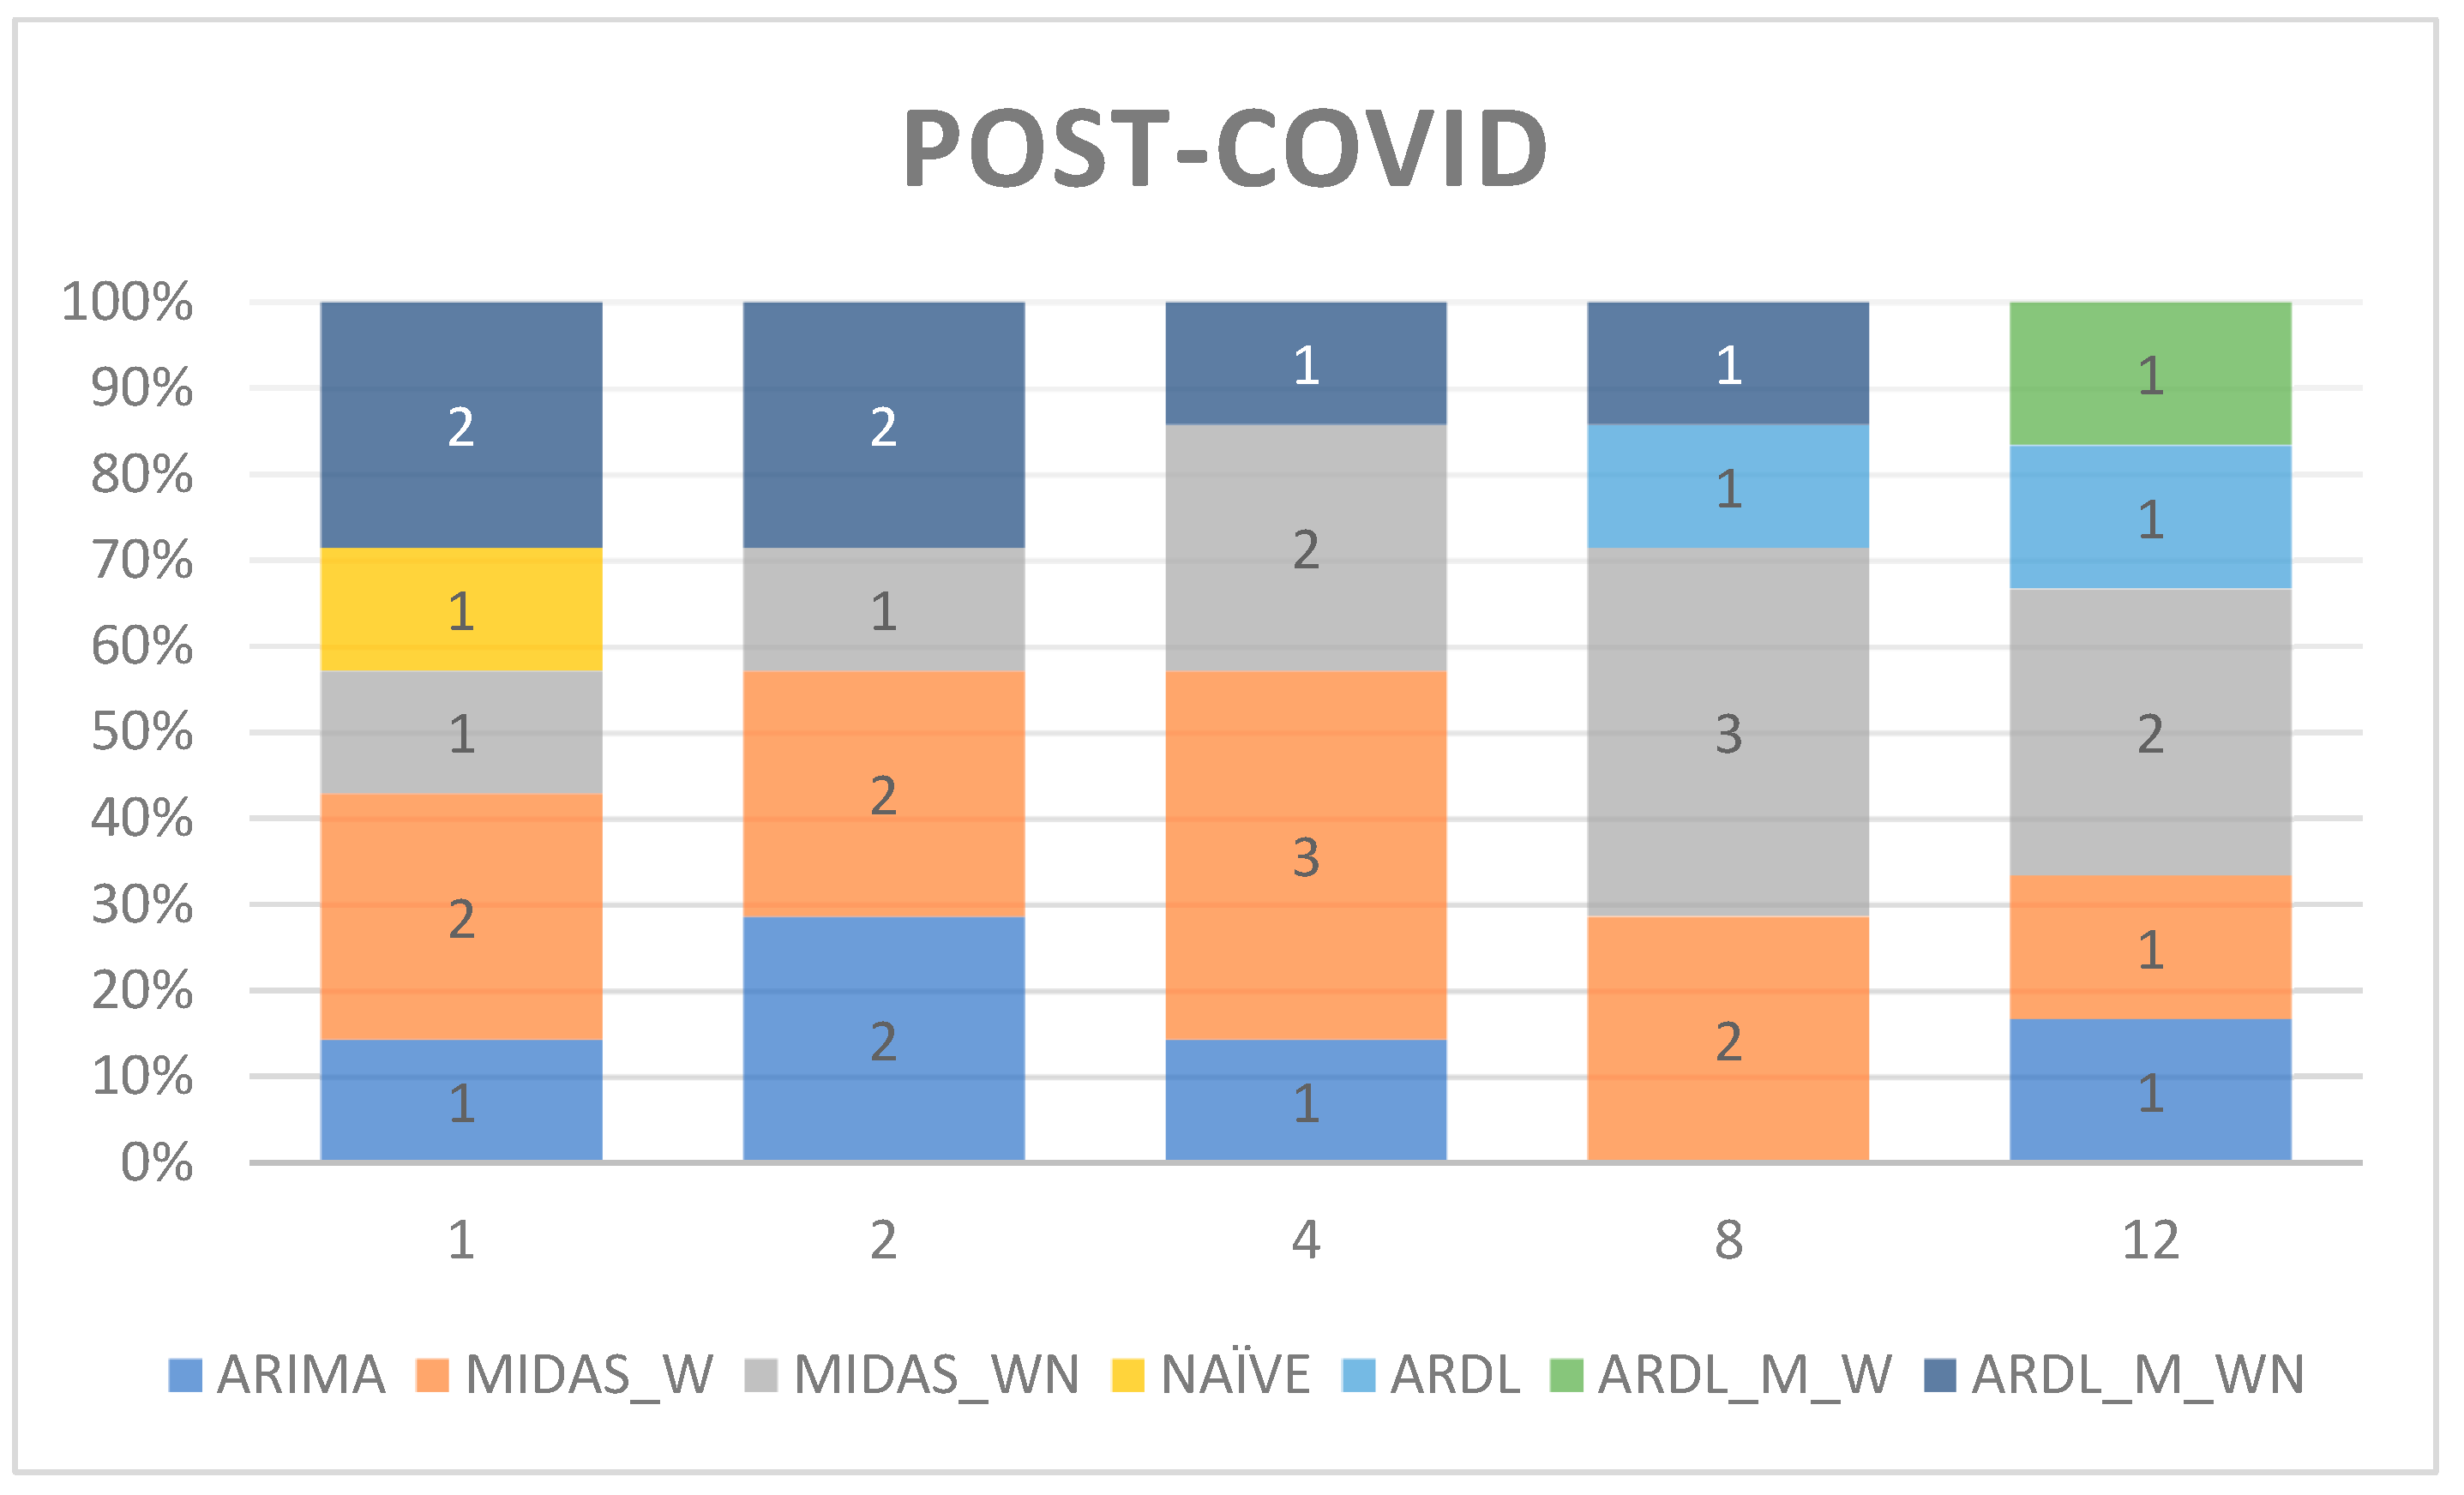
Figure 4.
Best forecasting models over different forecasting horizons, post-COVID.
Figure 4 shows the same figure but after COVID-19, and it is evident that the models that include Google search data outperformed the other models consistently. For example, over h = 1, 2, 8, 12, five out of the seven winning forecasts included Google Trends data. For h = 4, this improved to six out of the seven forecasts.
When one compares the models that included economic variables (ARDL-based models) with the pure time-series models pre-COVID, the ARDL models as a group fared better in forecasting tourism to South Africa in the shorter term, i.e., one- and two-quarters. Over one to three years, the time series models outperformed. Post-COVID, this trend continued, but instead of the naïve model faring well for the time-series methods, the MIDAS models that included web search data were the clear winners.
4. Discussion and Conclusions
This research set out to answer three questions, and the results are consequently considered within the context of the questions.
Firstly, does Google Trends have the potential to improve tourism-demand forecasting during recovery after a shock? Overall, the results show that for the pre-COVID period, the MIDAS models that included Google Trends data outperformed the benchmarks in 40% (14/35) of the pre-COVID forecast models, and post-COVID, this percentage increased to 77% (27/35). This shows that adding Google Trends data as an explanatory variable does improve forecast during recovery. These results are in line with the findings of previous research that show that search engine data improves tourism-demand forecasts. Specifically, it confirms research by [35] that web search data improves tourism recovery forecasts, contradicting results by [36].
Secondly, does the inclusion of typical tourism-demand covariates in an econometric forecasting specification together with Google Trends data lead to improved forecasts? To test this, MIDAS-ARDL models were estimated, and the results show that in the majority of forecasts over all time horizons pre- and post-COVID, the inclusion of Google Trends data improved the forecasting accuracy of the ARDL model.
Compared to time-series forecasts, the ARDL-based models forecast better over the shorter term, with one and two quarters ahead forecasting results, both pre- and post-COVID, and in more instances than not being the best forecasts. It is noteworthy that the ARDL-based models were never the best forecasting model for the Indian and Australian source markets pre-COVID. Post-COVID, this situation changed for these source markets, and these models delivered the most accurate forecasts, especially over the longer term. In contrast, the MIDAS-ARDL models were always the best in forecasting tourist arrivals from the Netherlands in normal (non-recovery) times.
Finally, can Google Trends improve forecasting over a longer time period? Most research on Google Trends and tourism demand is done on monthly or higher-frequency data [24]. This research considers quarterly forecasts and forecasts for up to three years (12 quarters). The rationale for this can be found in the reality that South Africa is not a well-known destination, and the country is a long-haul destination where more lead time may be required in decision-making.
This research shows that monthly Google Trends also improves forecasts on lower-frequency data (quarterly) using a mixed data-sampling framework. The results show that, pre-COVID, forecasts that included Google Trends were more effective in forecasting one to two quarters ahead than further into the future. This trend changed after COVID, where Google Trends led to improved recovery forecasts even over the longer term (4-12 quarters ahead). Additionally, this research incorporates web and/or news search indices as suggested by [29]. The addition of the news search variable improved the forecasts with the web search data by 43% (6/14) pre-COVID and by 59% (16/27) post-COVID.
In conclusion, this paper makes a significant contribution to current research by showing the significance of Google Trends data in (i) improving tourism-forecasting recovery after a shock to the tourism industry, (ii) forecasting tourism using low-frequency data and (iii) forecasting over a longer time horizon. It is also the first time that Google Trends data have been used in forecasting tourism to an African destination, which opens up future research avenues to explore in terms of tourism forecasting in African destinations.
Our research is, however, not without limitations. This research focuses only on one destination, namely, South Africa, and only models intercontinental arrivals, even though neighbouring countries are South Africa’s main tourism source markets. This is due to the limited availability of Google Trends and also, in some instances, economic data from these countries. In fact, even Google Trends search data are quite limited, limiting what could be done with them, which indicates that South Africa is a lesser-known destination that attracts fewer international internet searches. However, even with these limitations, our research shows that the inclusion of Big Data such as Google Trends can enhance tourism forecasting. Therefore, even for lesser-known destinations, it makes a difference. Future research could therefore also expand the current research by including other Big Data sources that would allow the use of, among others, sentiment analysis. Further research is needed to explain why post-COVID Google forecasts work better than pre-COVID. Additionally, it would be interesting to also verify whether forecasts that include Google indices improve long-term forecast horizons rather than short-term forecast horizons, as well as for other long-haul destinations.
Author Contributions
Conceptualization, A.S. and I.B.; methodology, I.B.; validation, A.S., formal analysis, I.B.; investigation, A.S.; writing—original draft preparation, A.S.; writing—review and editing, A.S. and I.B. All authors have read and agreed to the published version of the manuscript.
Funding
This research received no external funding.
Data Availability Statement
Secondary data were used, and the data are publicly available. The data were sourced from Statistics South Africa (arrivals data, https://www.statssa.gov.za/ accessed on 30 March 2024) and the OECD (https://www.oecd.org/en/data.html accessed on 30 March 2024) and IFS databases (https://data.imf.org/?sk=4c514d48-b6ba-49ed-8ab9-52b0c1a0179b accessed on 30 March 2024).
Conflicts of Interest
The authors declare no conflicts of interest.
References
- Li, J.; Xu, L.; Tang, L.; Wang, S.; Li, L. Big data in tourism research: A literature review. Tour. Manag. 2018, 68, 301–323. [Google Scholar] [CrossRef]
- Yang, X.; Pan, B.; Evans, J.A.; Lv, B. Forecasting Chinese tourist volume with search engine data. Tour. Manag. 2015, 46, 386–397. [Google Scholar] [CrossRef]
- Wu, D.C.; Zhong, S.; Qiu, R.T.; Wu, J. Are customer reviews just reviews? Hotel forecasting using sentiment analysis. Tour. Econ. 2021, 28, 795–816. [Google Scholar] [CrossRef]
- Xie, G.; Li, X.; Qian, Y.; Wang, S. Forecasting tourism demand with KPCA-based web search indexes. Tour. Econ. 2021, 27, 721–743. [Google Scholar] [CrossRef]
- Choi, H.; Varian, H. Predicting the present with Google Trends. Econ. Rec. 2012, 88, 2–9. [Google Scholar] [CrossRef]
- Wen, L.; Liu, C.; Song, H. Forecasting tourism demand using search query data: A hybrid modelling approach. Tour. Econ. 2019, 25, 309–329. [Google Scholar] [CrossRef]
- Artola, C.; Pinto, F.; de Pedraza García, P. Can internet searches forecast tourism inflows? Int. J. Manpow. 2015, 36, 103–116. [Google Scholar] [CrossRef]
- Camacho, M.; Pacce, M.J. Forecasting travellers in Spain with google search volume indices. Tour. Econ. 2018, 24, 434–448. [Google Scholar] [CrossRef]
- Park, S.; Lee, J.; Song, W. Short-term forecasting of Japanese tourist inflow to South Korea using Google trends data. J. Travel Tour. Mark. 2016, 34, 357–368. [Google Scholar] [CrossRef]
- Lv, S.-X.; Peng, L.; Wang, L. Stacked autoencoder with echo-state regression for tourism demand forecasting using search query data. Appl. Soft Comput. 2018, 73, 119–133. [Google Scholar] [CrossRef]
- Önder, I.; Gunter, U.; Scharl, A. Forecasting Tourist Arrivals with the Help of Web Sentiment: A Mixed-frequency Modeling Approach for Big Data. Tour. Anal. 2019, 24, 437–452. [Google Scholar] [CrossRef]
- Bokelmann, B.; Lessmann, S. Spurious patterns in Google Trends data—An analysis of the effects on tourism demand forecasting in Germany. Tour. Manag. 2019, 75, 1–12. [Google Scholar] [CrossRef]
- Wang, L.; Wu, B.; Zhu, Q.; Zeng, Y.R. Forecasting Monthly Tourism Demand Using Enhanced Backpropagation Neural Network. Neural Process. Lett. 2020, 52, 2607–2636. [Google Scholar] [CrossRef]
- Gawlik, E.; Kabaria, H.; Kaur, S. Predicting tourism trends with Google Insights. Accessed Dec. 2011, 1, 2012. [Google Scholar]
- Bai, H.; Hao, H. A novel two-step procedure for tourism demand forecasting. Curr. Issues Tour. 2021, 24, 1199–1210. [Google Scholar]
- Li, X.; Law, R. Forecasting Tourism Demand with Decomposed Search Cycles. J. Travel Res. 2019, 59, 52–68. [Google Scholar] [CrossRef]
- Wen, L.; Liu, C.; Song, H.; Liu, H. Forecasting Tourism Demand with an Improved Mixed Data Sampling Model. J. Travel Res. 2021, 60, 336–353. [Google Scholar] [CrossRef]
- Hu, M.; Song, H. Data source combination for tourism demand forecasting. Tour. Econ. 2019, 26, 1248–1265. [Google Scholar] [CrossRef]
- Huarng, K.-H.; Yu, T.H.-K. Application of Google trends to forecast tourism demand. J. Internet Technol. 2019, 20, 1273–1280. [Google Scholar]
- Bangwayo-Skeete, P.F.; Skeete, R.W. Can Google data improve the forecasting performance of tourist arrivals? Mixed-data sampling approach. Tour. Manag. 2015, 46, 454–464. [Google Scholar] [CrossRef]
- Li, X.; Pan, B.; Law, R.; Huang, X. Forecasting tourism demand with composite search index. Tour. Manag. 2017, 59, 57–66. [Google Scholar] [CrossRef]
- Li, S.; Chen, T.; Wang, L.; Ming, C. Effective tourist volume forecasting supported by PCA and improved BPNN using Baidu index. Tour. Manag. 2018, 68, 116–126. [Google Scholar] [CrossRef]
- Sun, S.; Wei, Y.; Tsui, K.L.; Wang, S. Forecasting tourist arrivals with machine learning and internet search index. Tour. Econ. 2019, 70, 1–10. [Google Scholar] [CrossRef]
- Li, X.; Law, R.; Xie, G.; Wang, S. Review of tourism forecasting research with internet data. Tour. Manag. 2021, 83, 104245. [Google Scholar] [CrossRef]
- Sun, S.; Li, Y.; Guo, J.E.; Wang, S. Tourism demand forecasting: An ensemble deep learning approach. Tour. Econ. 2022, 28, 2021–2049. [Google Scholar] [CrossRef]
- Hu, Y.-C.; Wu, G. The impact of Google Trends index and encompassing tests on forecast combinations in tourism. Tour. Rev. 2022, 77, 1276–1298. [Google Scholar] [CrossRef]
- Havranek, T.; Zeynalov, A. Forecasting tourist arrivals: Google Trends meets mixed-frequency data. Tour. Econ. 2021, 27, 129–148. [Google Scholar] [CrossRef]
- Önder, I.; Gunter, U. Forecasting Tourism Demand with Google Trends For a Major European City Destination. Tour. Anal. 2016, 21, 203–220. [Google Scholar] [CrossRef]
- Önder, I. Forecasting tourism demand with Google trends: Accuracy comparison of countries versus cities. Int. J. Tour. Res. 2017, 19, 648–660. [Google Scholar] [CrossRef]
- Liu, Y.-Y.; Tseng, F.-M.; Tseng, Y.-H. Big Data analytics for forecasting tourism destination arrivals with the applied Vector Autoregression model. Technol. Forecast. Soc. Chang. 2018, 130, 123–134. [Google Scholar] [CrossRef]
- Volchek, K.; Liu, A.; Song, H.; Buhalis, D. Forecasting tourist arrivals at attractions: Search engine empowered methodologies. Tour. Econ. 2018, 25, 425–447. [Google Scholar] [CrossRef]
- Li, X.; Li, H.; Pan, B.; Law, R. Machine Learning in Internet Search Query Selection for Tourism Forecasting. J. Travel Res. 2020, 60, 1213–1231. [Google Scholar] [CrossRef]
- Huang, X.; Zhang, L.; Ding, Y. The Baidu Index: Uses in predicting tourism flows–A case study of the Forbidden City. Tour. Manag. 2017, 58, 301–306. [Google Scholar] [CrossRef]
- Peng, L.; Wang, L.; Ai, X.Y.; Zeng, Y.R. Forecasting Tourist Arrivals via Random Forest and Long Short-term Memory. Cogn. Comput. 2020, 13, 125–138. [Google Scholar] [CrossRef]
- Wu, J.; Li, M.; Zhao, E.; Sun, S.; Wang, S. Can multi-source heterogeneous data improve the forecasting performance of tourist arrivals amid COVID-19? Mixed-data sampling approach. Tour. Manag. 2023, 98, 104759. [Google Scholar] [CrossRef]
- Yang, Y.; Fan, Y.; Jiang, L.; Liu, X. Search query and tourism forecasting during the pandemic: When and where can digital footprints be helpful as predictors? Ann. Tour. Res. 2022, 93, 103365. [Google Scholar] [CrossRef]
- Li, H.; Hu, M.; Li, G. Forecasting tourism demand with multisource big data. Ann. Tour. Res. 2020, 83, 102912. [Google Scholar] [CrossRef]

Disclaimer/Publisher’s Note: The statements, opinions and data contained in all publications are solely those of the individual author(s) and contributor(s) and not of MDPI and/or the editor(s). MDPI and/or the editor(s) disclaim responsibility for any injury to people or property resulting from any ideas, methods, instructions or products referred to in the content. |
© 2024 by the authors. Licensee MDPI, Basel, Switzerland. This article is an open access article distributed under the terms and conditions of the Creative Commons Attribution (CC BY) license (https://creativecommons.org/licenses/by/4.0/).