Article

Monitoring and Forecasting of Key Functions and Technologies for Automated Driving

by
Christian Ulrich
*,
Benjamin Frieske
,
Stephan A. Schmid
and
Horst E. Friedrich
German Aerospace Center (DLR), Institute of Vehicle Concepts, Pfaffenwaldring 38–40, 70569 Stuttgart, Germany
*
Author to whom correspondence should be addressed.
Retired.
Forecasting 2022, 4(2), 477-500; https://doi.org/10.3390/forecast4020027
Submission received: 1 April 2022 / Revised: 30 April 2022 / Accepted: 16 May 2022 / Published: 20 May 2022

Abstract

:
Companies facing transformation in the automotive industry will need to adapt to new trends, technologies and functions, in order to remain competitive. The challenge is to anticipate such trends and to forecast their development over time. The aim of this paper is to develop a methodology that allows us to analyze the temporal development of technologies, taking automated driving as an example. The framework consists of a technological and a functional roadmap. The technology roadmap provides information on the temporal development of 59 technologies based on expert elicitation using a multi-stage Delphi survey and patent analyses. The functional roadmap is derived from a meta-analysis of studies including 209 predictions of the maturity of automated driving functions. The technological and functional roadmaps are merged into a consolidated roadmap, linking the temporal development of technologies and functions. Based on the publication analysis, SAE level 5 is predicted to be market-ready by 2030. Contrasted to the results from the Delphi survey in the technological roadmap, 2030 seems to be too optimistic, however, as some key technologies would not have reached market readiness by this time. As with all forecasts, the proposed framework is not able to accurately predict the future. However, the combination of different forecast approaches enables users to have a more holistic view of future developments than with single forecasting methods.

1. Introduction

In order to remain competitive, companies need to continuously analyze not only the market and competitive environment but also the development of key technologies that form and enable the successful implementation of business models over time. As part of strategically aligned technology management, technology monitoring and forecasting have become a key part of the process [1,2]. Larger companies usually have their own departments for technology planning, while smaller and medium-sized enterprises (SME) often lack the resources to analyze the technological environment. They often solely rely on public technology information and product specifications from their (direct) customers in the supply chain. Support and knowledge transfer from academic research institutions is essential for SMEs to enhance their knowledge on how technologies can develop over time [1].
The aim of this study is to develop a methodology for meaningful forecasting of technology trends that can be used by a wide range of users. The methodology is exemplified with reference to vehicle automation technologies as the development of highly automated and autonomous vehicle concepts is part of current product and technology strategies of automotive manufacturers and major system suppliers worldwide (e.g., [3,4,5]). The results have been made publicly available to promote the transfer of knowledge from academic research to the automotive industry.

1.1. Literature Review

There are various approaches to forecasting the future development of existing or new technologies. The approaches can be categorized into 5 groups: monitoring, trend analysis, expert opinions, simulations and scenarios [6]. Each group features different strengths and weaknesses, which are discussed below, therefore suited to different target areas. The authors of [7,8] group the methods similarly. This section provides an overview of the five groups as well as a description of commonly used methods. Existing studies related to the automotive industry complement the overview.
(1)
Monitoring uses a large amount of information to inform a prediction of the development of technologies. Among others, methods of bibliometrics (patents and publications) [9,10,11,12,13,14,15,16,17], text mining [10,12,17,18] and social network analysis (SNA) [19,20] are used [6,7]. Text mining consists of the extraction of information from natural language sources. It is often combined with patent and publication analyses. Publication analyses use meta or content information, while patent analyses use structured patent classification data in addition [6,16]. The authors of [9] use patent analysis to identify technological areas relevant to self-driving vehicles. The authors of [10] also address self-driving technology but examine publications in addition to patents and further employ text mining. Both studies identify relevant technologies for self-driving vehicles but lack information on their temporal development. The authors of [11] use patents to derive the life cycle stages of technologies, thus providing information on their temporal development. In SNAs, linkages between different actors in a domain are examined in order to derive developments in the network. In [20], the author shows the connections of different automotive trends in a network based on a preceding patent analysis. Since this requires high computing effort, only patent abstracts were used. In [19], the authors identify analogous technologies from bibliometrics and SNA in order to subsequently derive the future development of various technologies of autonomous vehicles via S-curve models. The methods vary significantly in complexity depending on their implementation. SNAs and text mining requires in-depth knowledge of coding and machine learning.
(2)
Trend analysis and statistical methods use historical data to project future developments [6,7]. Trend analysis extrapolates past information, with the selection of the correct fitting curve significantly influencing the result [6]. In S-curve approaches, future developments are projected using growth curves of established technology. This approach generally performs well when life-cycle models of similar technologies are available [7]. These methods often build on those also applied for monitoring technologies, e.g., [11,19] (see above). In [21], the authors apply the web search analysis method: it examines web search traffic data on fuel cell vehicles to derive an indication of life cycle curves.
(3)
In case of insufficient quantitative or structured information available, expert elicitation methods are commonly used: interviews, surveys, Delphi surveys, workshops etc. [6,7,8]. While these are generally inexpensive and straightforward to implement, setting up a qualitatively and quantitatively adequate panel of experts is challenging. Moreover, experts’ opinions are subjective and can be incorrect [6]. Among expert surveys, Delphi surveys are most popular [8]: multiple experts are surveyed anonymously in several iterative rounds. Consolidated feedback of other experts’ opinions provided following each iteration can lead to changing experts’ opinions during the process; consensus may be created after several rounds. Compared to other expert methods, a well-conducted Delphi survey can increase the reliability of the results [22]. In the automotive sector, Refs. [23,24] use Delphi surveys to derive statements on drivers and barriers of car sharing as well as short-, medium- and long-term technological developments of sustainable production, respectively.
(4)
Models or simulations simplify real-world systems to derive insights and statements about their future behavior. Building reliable models is usually expensive and complex but provides the possibility to investigate developments in the context of changing conditions. Systems dynamics and agent-based modeling can, in contrast to simpler input-output models, simulate interactions in a complex environment and incorporate uncertainties [6,7,8]. In [25,26,27] the authors use models to simulate the development of the electric vehicle market. The authors of [28,29] simulate the market uptake of autonomous vehicles. The quality of the results strongly depends on the quality of the input data [8].
(5)
Scenarios represent possible conceptions of the future considering different assumptions. This allows a flexible representation of a range of future possibilities, even if the data basis is weak [6,7,8]. For example, Ref. [30] has conducted several workshops with experts to develop different scenarios for the introduction of autonomous vehicles and their implications on mobility behavior. However, scenarios are highly speculative and thus generally more unreliable than other technology forecasting methods [6,7,8].
Technology roadmapping, a descriptive method, is used to map possible pathways for introducing future technologies or products [6,18,31,32]. It is a method commonly used in industry for strategic planning in technology management. The roadmaps provide orientation and a basis for discussion for technical experts and management [32]. This approach has already been used and reviewed in detail in various works [32,33,34,35,36].
The methods applied in the areas of monitoring and trend analysis often use big data [6,18]. Big data analysis means that a large amount of heterogeneous data must be collected and processed. The heterogeneity generates noise in the analyses, which is why the data must be pre-processed [37,38,39]. As with all big data analyses, the difficulty lies in structuring the chaotic information and using only relevant information [6,39]. The use of big data from the web (e.g., social media content) is promising. However, this requires further research to improving suitable data mining algorithms and the algorithms’ efficiency [6,18]. In addition, various studies discuss the challenge of obtaining reliable results from big data analysis [37,38,40,41].
The most suitable method for forecasting technology trends and progress depends on the availability of data and findings on analogous technologies [8]. According to [7,8], expert Delphi surveys are a suitable choice if the data situation is not sufficiently high for other forecasting methods. In addition, results are improved when several methods are combined, since one method cannot deal with the complexity predictions usually entail [8]: e.g., [11,19].

1.2. Contribution of This Paper

In our view, there is a need to develop a new approach to technology forecasting that incorporates the following elements.
(1)
Some approaches already combine different methods. However, regardless of the methods used, statements about the future are subject to uncertainty [31,32]. Contrasting different methods could further increase certainty.
(2)
The complexity of the method should be appropriate for the user. The authros of [42] identify a need for “easily comprehensible, timely, and cheap sources of [technology forecasting] for small companies,” which may not be the case for sophisticated simulation models, software-based SNA and text mining.
(3)
A broader range of technologies required to achieve functions of self-driving vehicles should be examined, not only singular technologies. Depending on the level of detail, functions may represent different levels of automation (SAE level) or, with higher granularity, functions such as lane keep assist or adaptive cruise control.
(4)
A temporal indication of the development of the technologies should be provided, ideally based on their maturity levels.
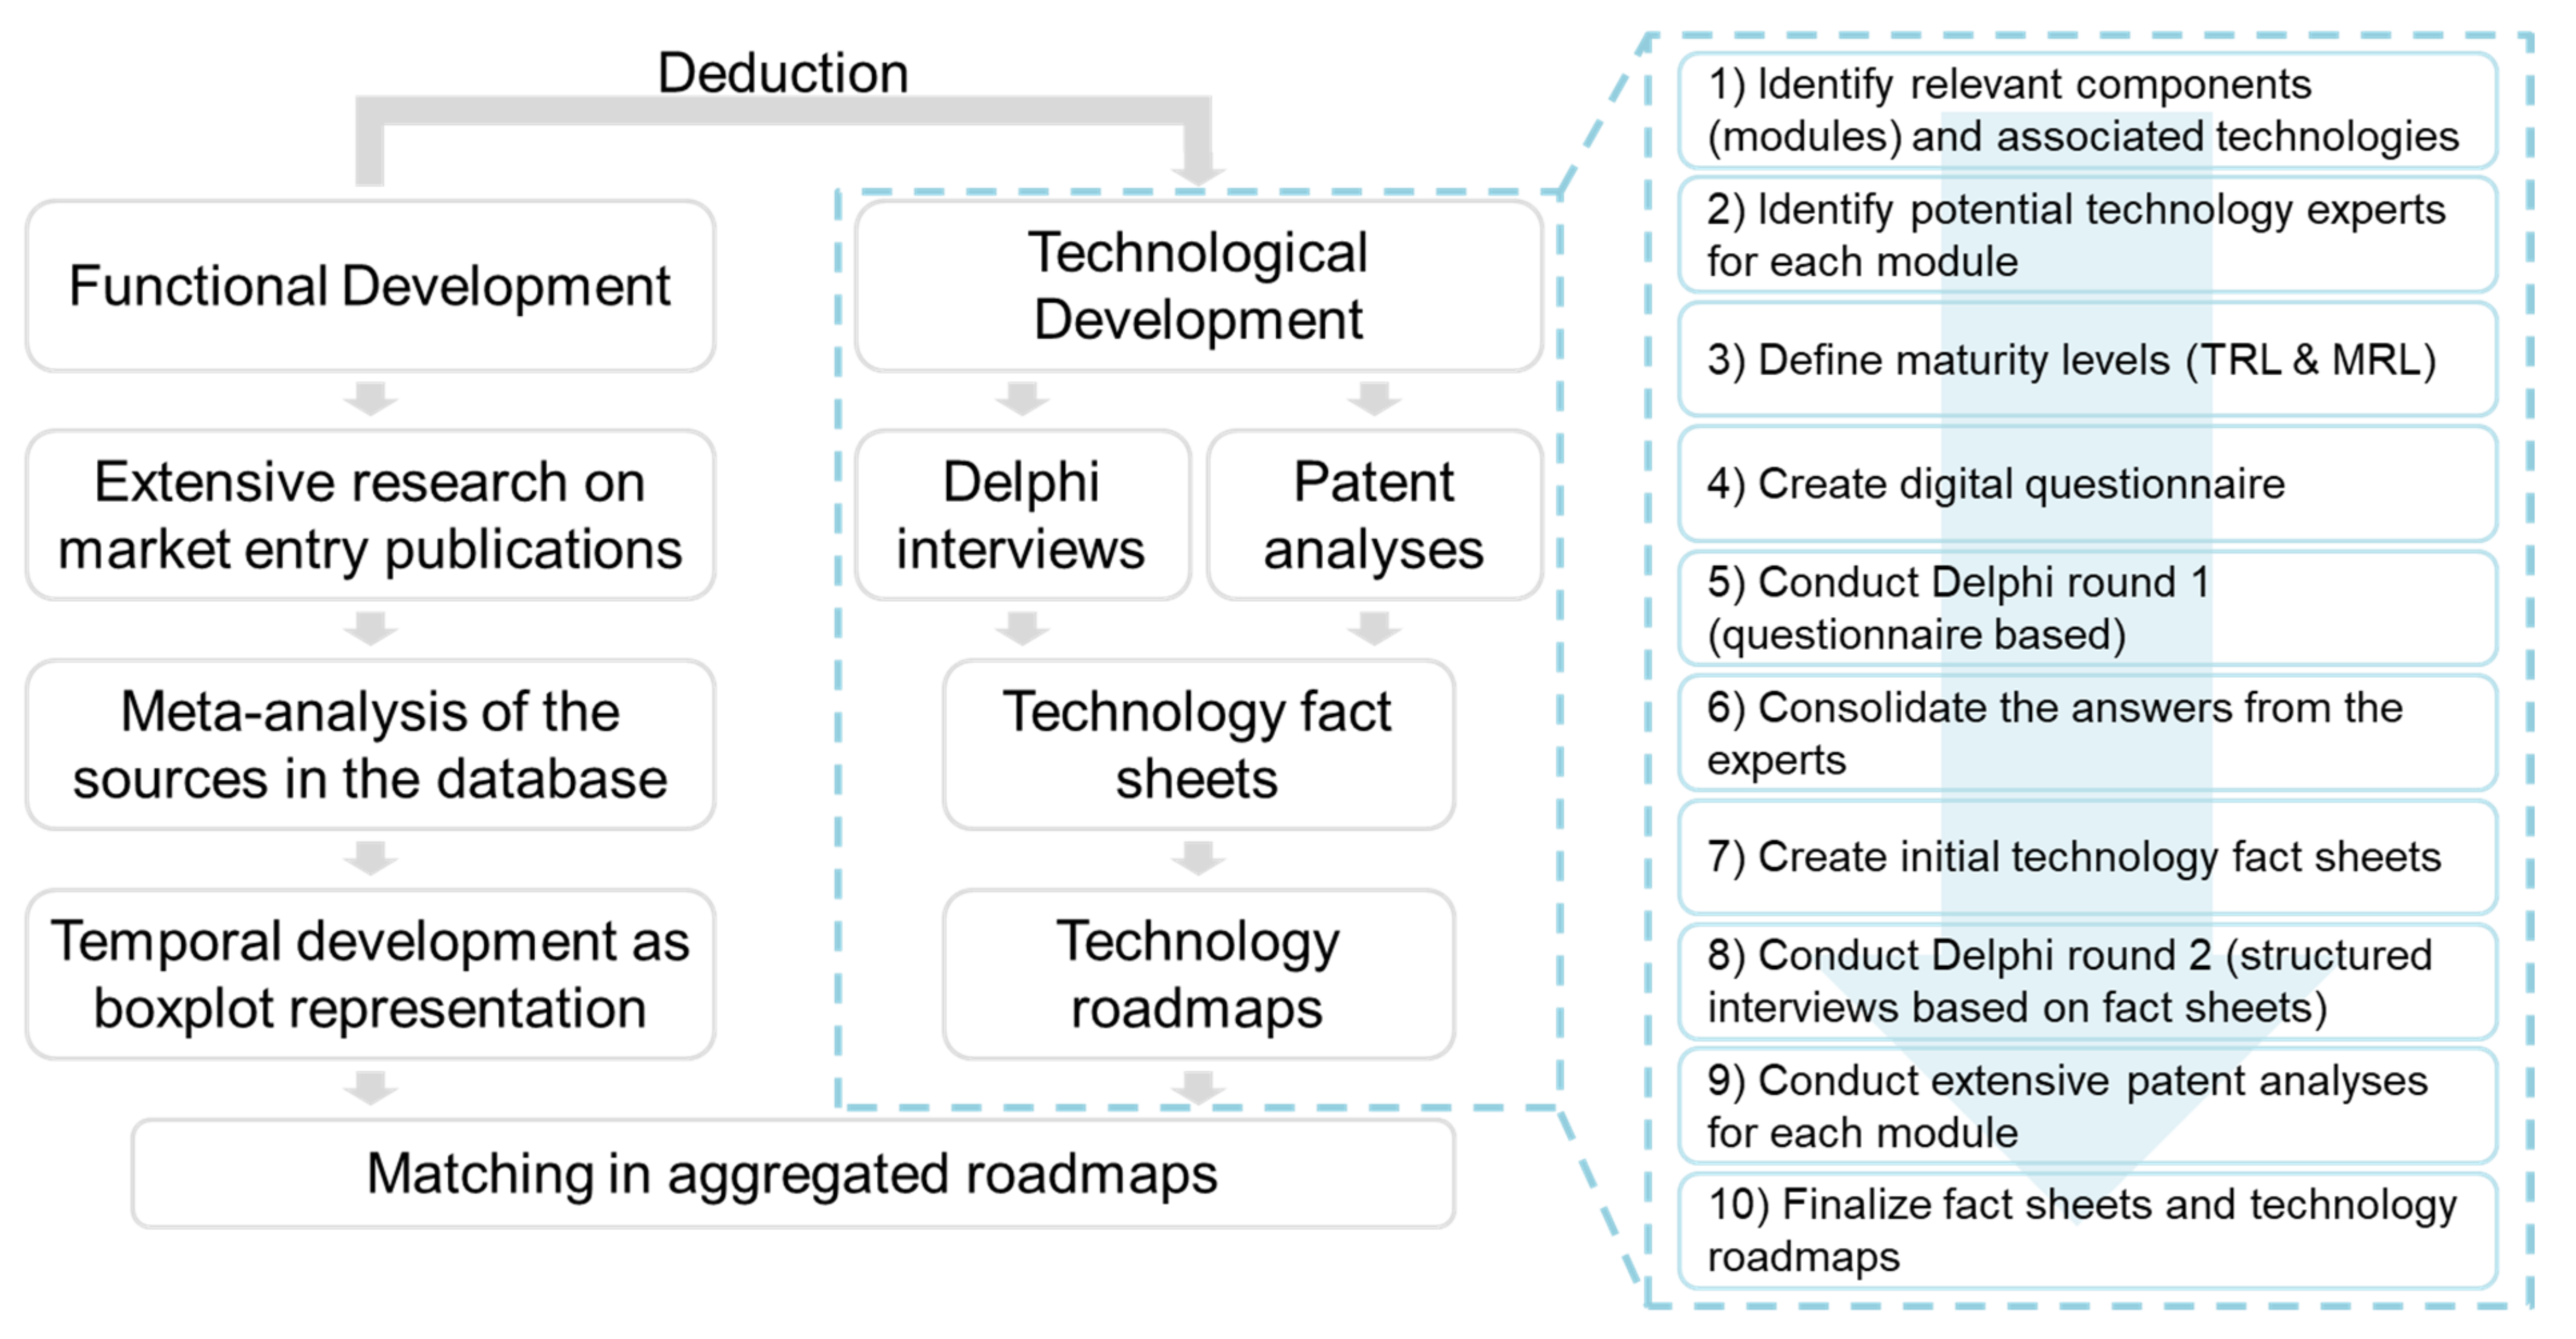
Existing approaches (Section 1.1) partly address these requirements but do not address all of them simultaneously: For example, Ref. [17] satisfies the first point (contrasting expert opinions and patent analyses combined with text mining) but not the other points (e.g., low complex methodology). Similarly, there are a number of studies that use relatively low-effort methodologies but do not provide explicit temporal development or lack counter validation.
This work therefore applies a combination of two complementary approaches: (1) forecasting at a functional level based on publication analysis and (2) technology roadmaps informed by a Delphi survey. The predictions resulting from both approaches are contrasted to reveal possible inconsistencies and thus improve the results’ reliability. This combines two approaches, both of which are moderate in terms of complexity and also suitable for the requirements of SMEs. The publication analysis addresses functions on the road to self-driving, while the technological analysis (Delphi) examines a wide range of individual technologies. This complements a top-down (functional level) approach with a bottom-up approach (technologies required for the functions) along a timeline with specific dates.
The remainder of the paper is organized as follows: Section 2 develops the methodology for this paper, which is applied in Section 3 to the exemplary case of self-driving road vehicles. The results are discussed in Section 4, while conclusions are given in Section 5.

2. Methodology

To improve the reliability of forecasts compared to standalone approaches, this work uses a consistent combination of different approaches. Ideally, the results obtained from different approaches verify each other. Otherwise, it identifies inconsistencies which can be further examined using the combined approach.
The work follows the methodological framework shown in Figure 1. In the functional development area, functions are first identified, followed by the derivation of their development over time based on a publication analysis. In the second, parallel section, a Delphi method and a patent analysis are used to create detailed technology fact sheets and technology roadmaps.
The results of both approaches are then aggregated and discussed as part of an overall roadmap. The proposed methodology is applied to technologies for automated driving of passenger cars. The procedure is transferable to different technology areas, however. Each methodological element is detailed in the following sections.

2.1. Publication Analysis for Functional Development

First, the relevant functions are derived from discussions with experts and literature research for the considered technology area. As mentioned above, this paper focuses on automated driving technology. A publication analysis is conducted to obtain predictions on the future development of these functions.
This analysis includes 67 studies published in the period from 2013 to 2021. These comprise national and international publications from OEMs, automotive suppliers, research institutions, policy departments and consulting companies (Figure 2).
Few publications provide temporal estimates of the occurrence of individual functions such as lane keep assist. In accordance with the SAE J3016 standard, the commonly known automation levels, SAE levels 0–5, are utilized as functions, as a more aggregated indication: Table 1.
The publication analysis results in 209 data points. The earliest or latest market entry date estimated by the respective authors for the individual automation levels is determined from the publications. If the publication does not provide a range, the data point is assigned to the category “earliest entry year.”
The unstructured format in which the statements are available (press releases; parts of illustrations; time span vs. discrete years) means that considerable effort for pre-processing the data is required [39], analogous to the challenges of dealing with large datasets presented in Section 1.1. The subsequent analysis is, in comparison, less time-consuming and can be easily automated.
The analysis is shown in Section 3.1, while a list of all analyzed publications is available in Table A1.

2.2. Delphi Survey and Patent Analyses for Technological Development

The “technological development” section, marked with a blue dashed frame in Figure 1, is complementary to the results from the “functional development” part. Expert interviews and literature research are used to identify relevant technologies and assign them to the functions. Next, a two-stage expert survey is conducted using the Delphi methodology. The core of the Delphi survey is assessing the development of technology and manufacturing maturity levels over time for relevant technologies. Extensive patent analyses complement this survey and verify or supplement the respondents’ findings. The results are consolidated in standardized, structured technology fact sheets and technology roadmaps.

2.2.1. Identification of Relevant Modules

The developments at module and component level result from the functions obtained in the first step (Section 2.1) via a top-down approach. This involves conducting an extensive literature search and expert interviews. A total of 59 technologies in 15 modules could be identified with respect to the scope of this work: focus on automation hardware technologies for passenger cars; no production, infrastructure or software technologies.
Modules on sensors (e.g., lidar and camera), actuators, by-wire systems, positioning, communication and microsystems are examined. For automation, of course, further components are required. However, these are not analyzed in this work but must be addressed in further work.

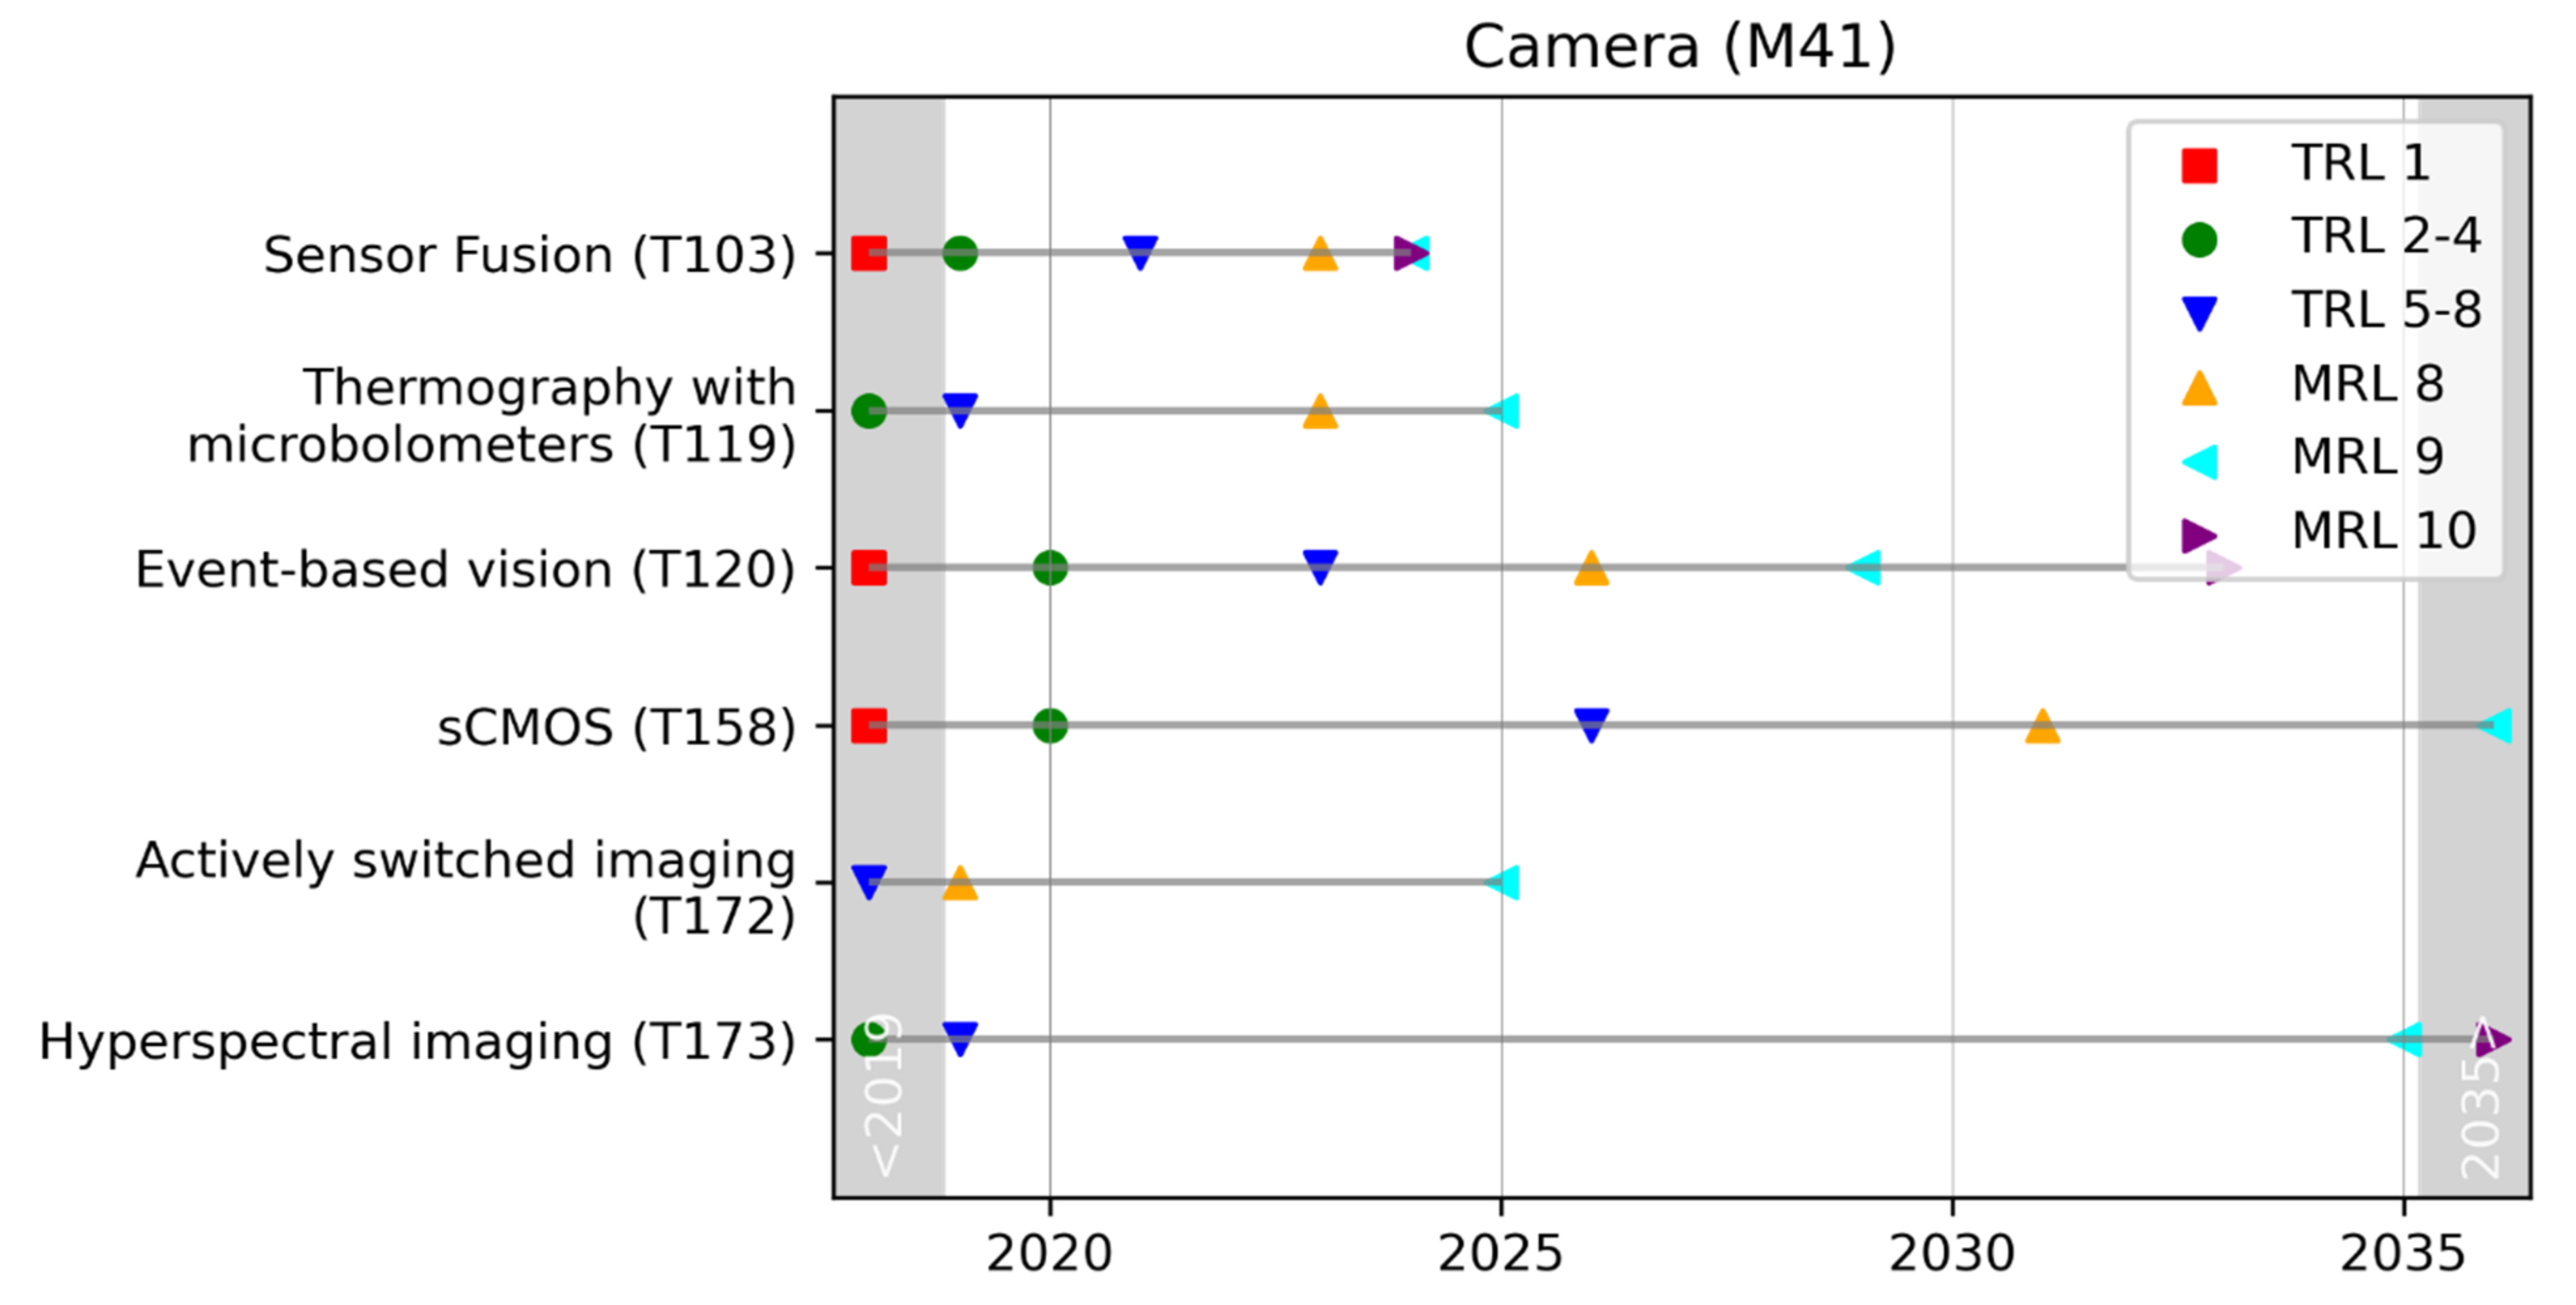
2.2.2. Practice-Oriented Classification of Maturity Levels

The work was carried out in close cooperation with the industry. Small and medium-sized enterprises (SME) shall especially benefit from the results. In consultation with them, the commonly used and known NASA-based technology readiness level (TRL) does not provide enough relevant information. Therefore, the classification of maturity levels in Table 2 is utilized instead. It represents the combination of TRL according to NASA [43] and manufacturing maturity levels (MRL) according to the Automotive Council UK [44]. The first three levels of the new classification group the technology maturity levels, while the last three levels are about different manufacturing maturity levels. While the first two levels are oriented towards basic research, the other levels beginning with TRL 5–8 are explicitly related to automotive application. Neither TRL nor MRL indicate the success of the technology on the market. Instead, the MRL only indicate how far the manufacturability has progressed.

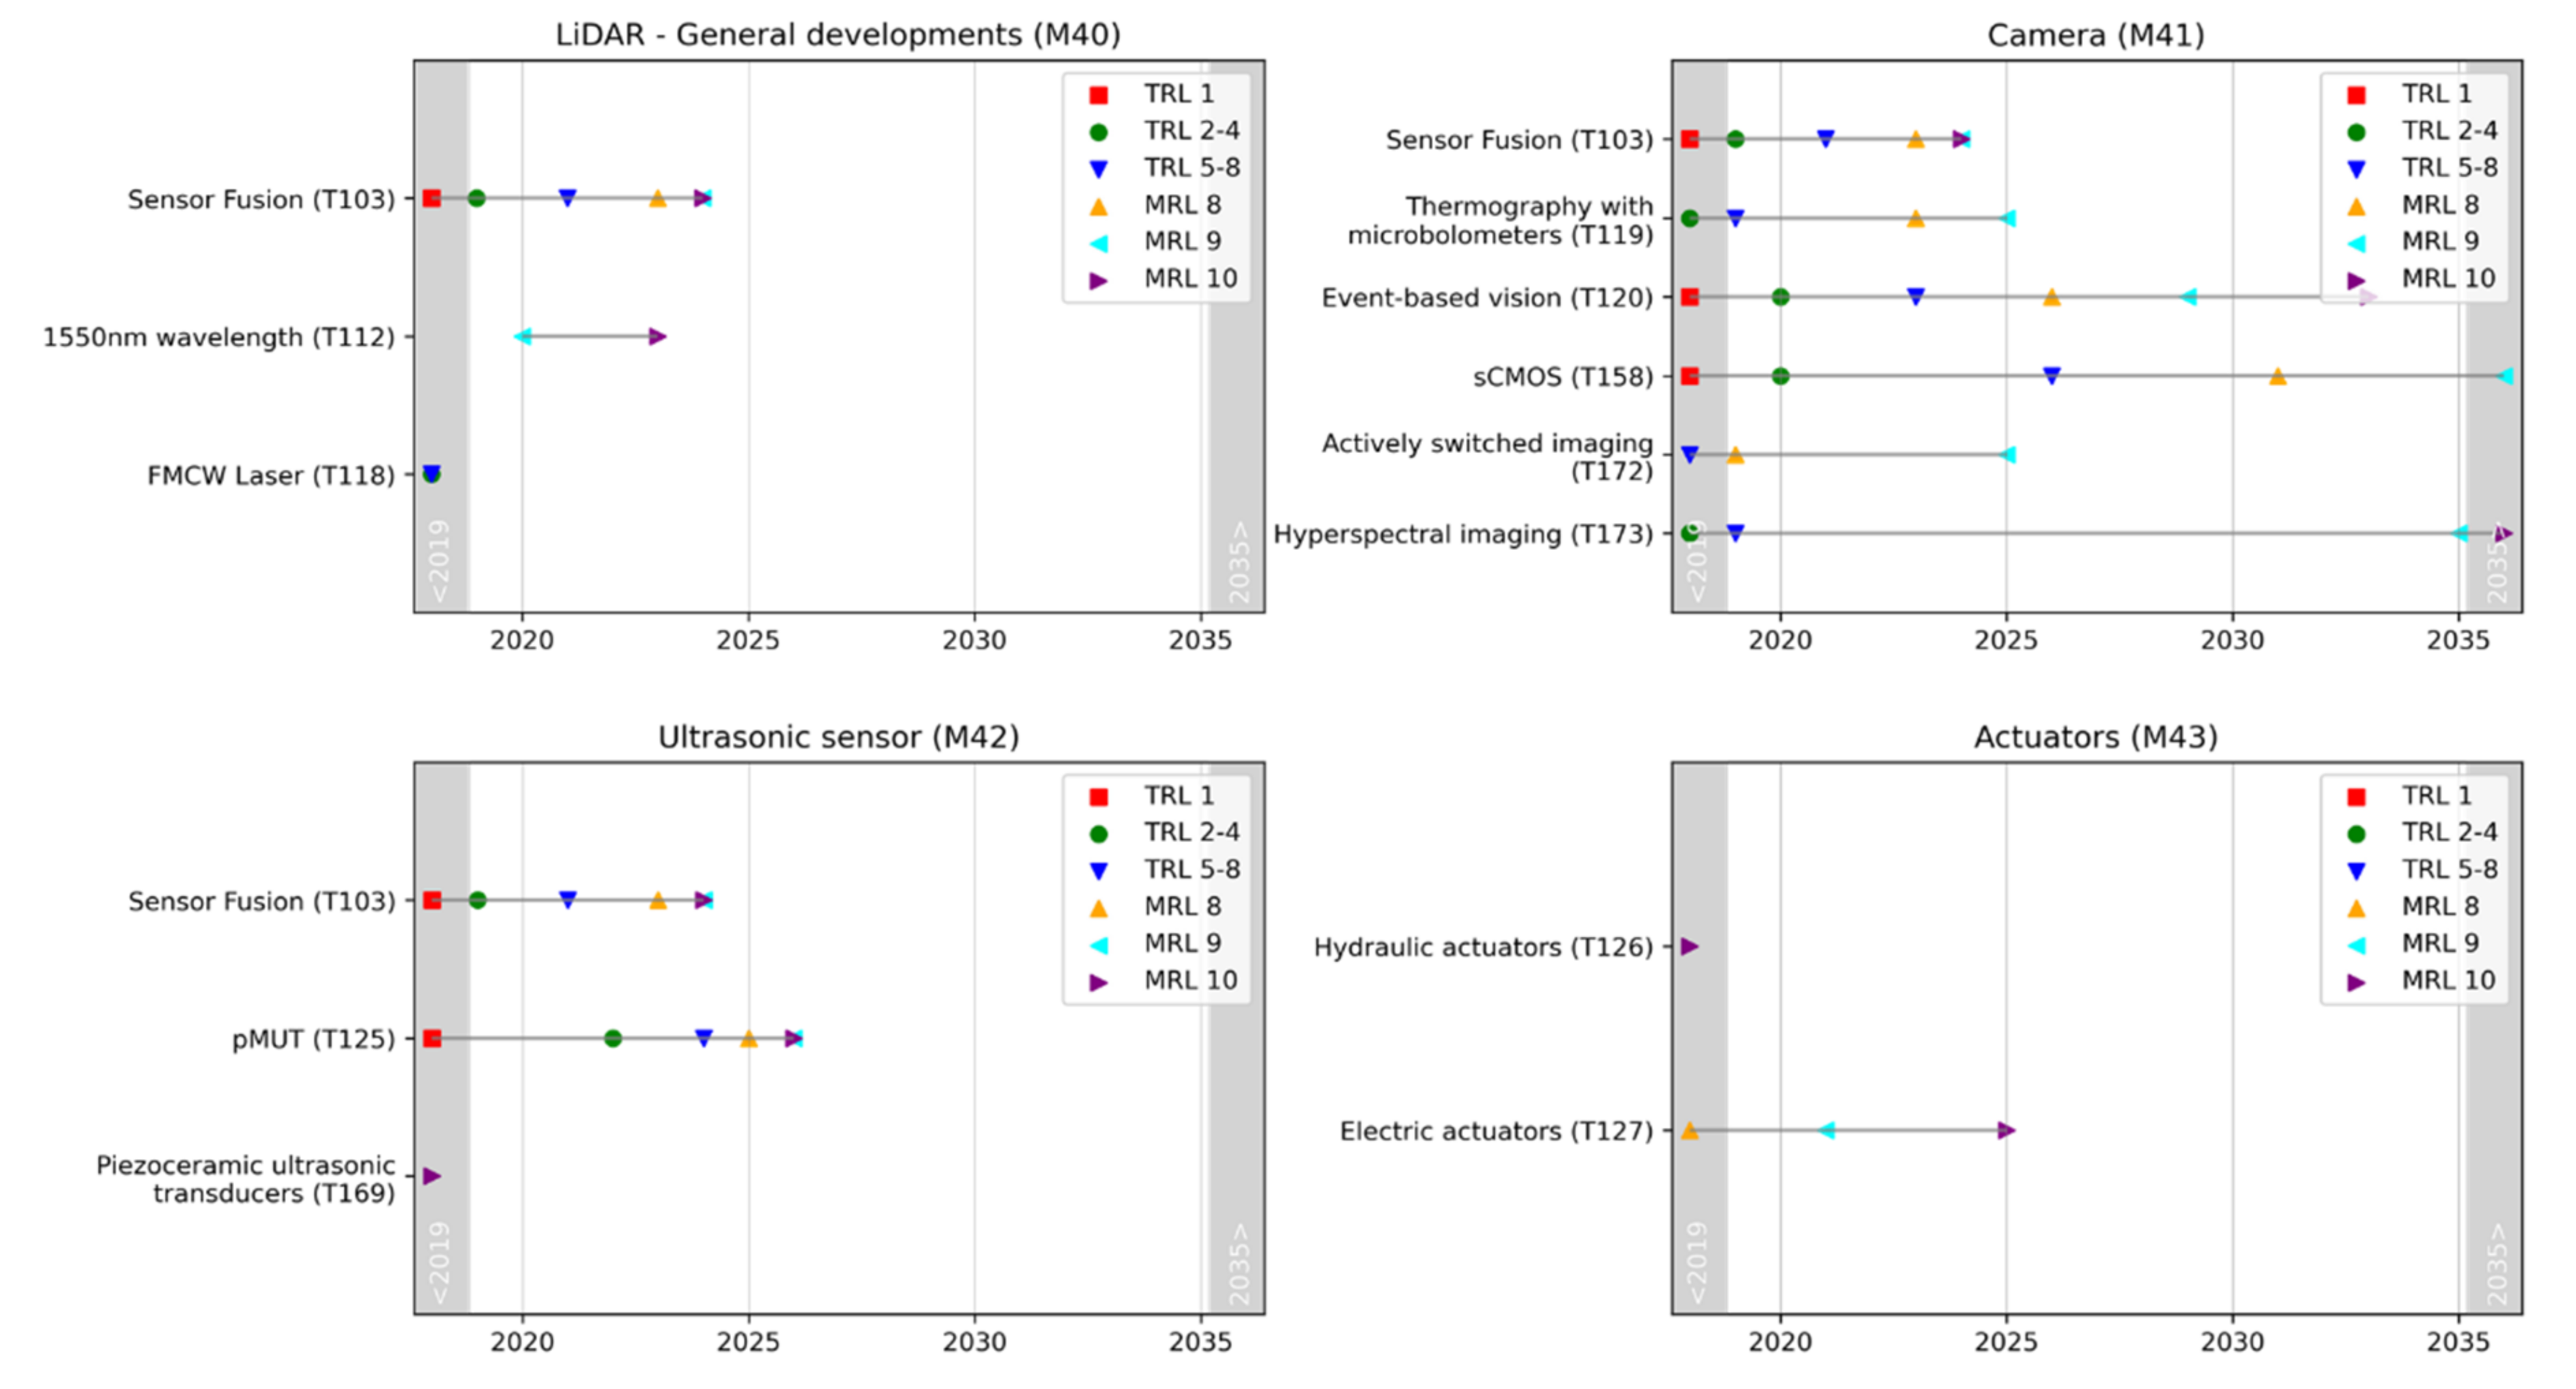
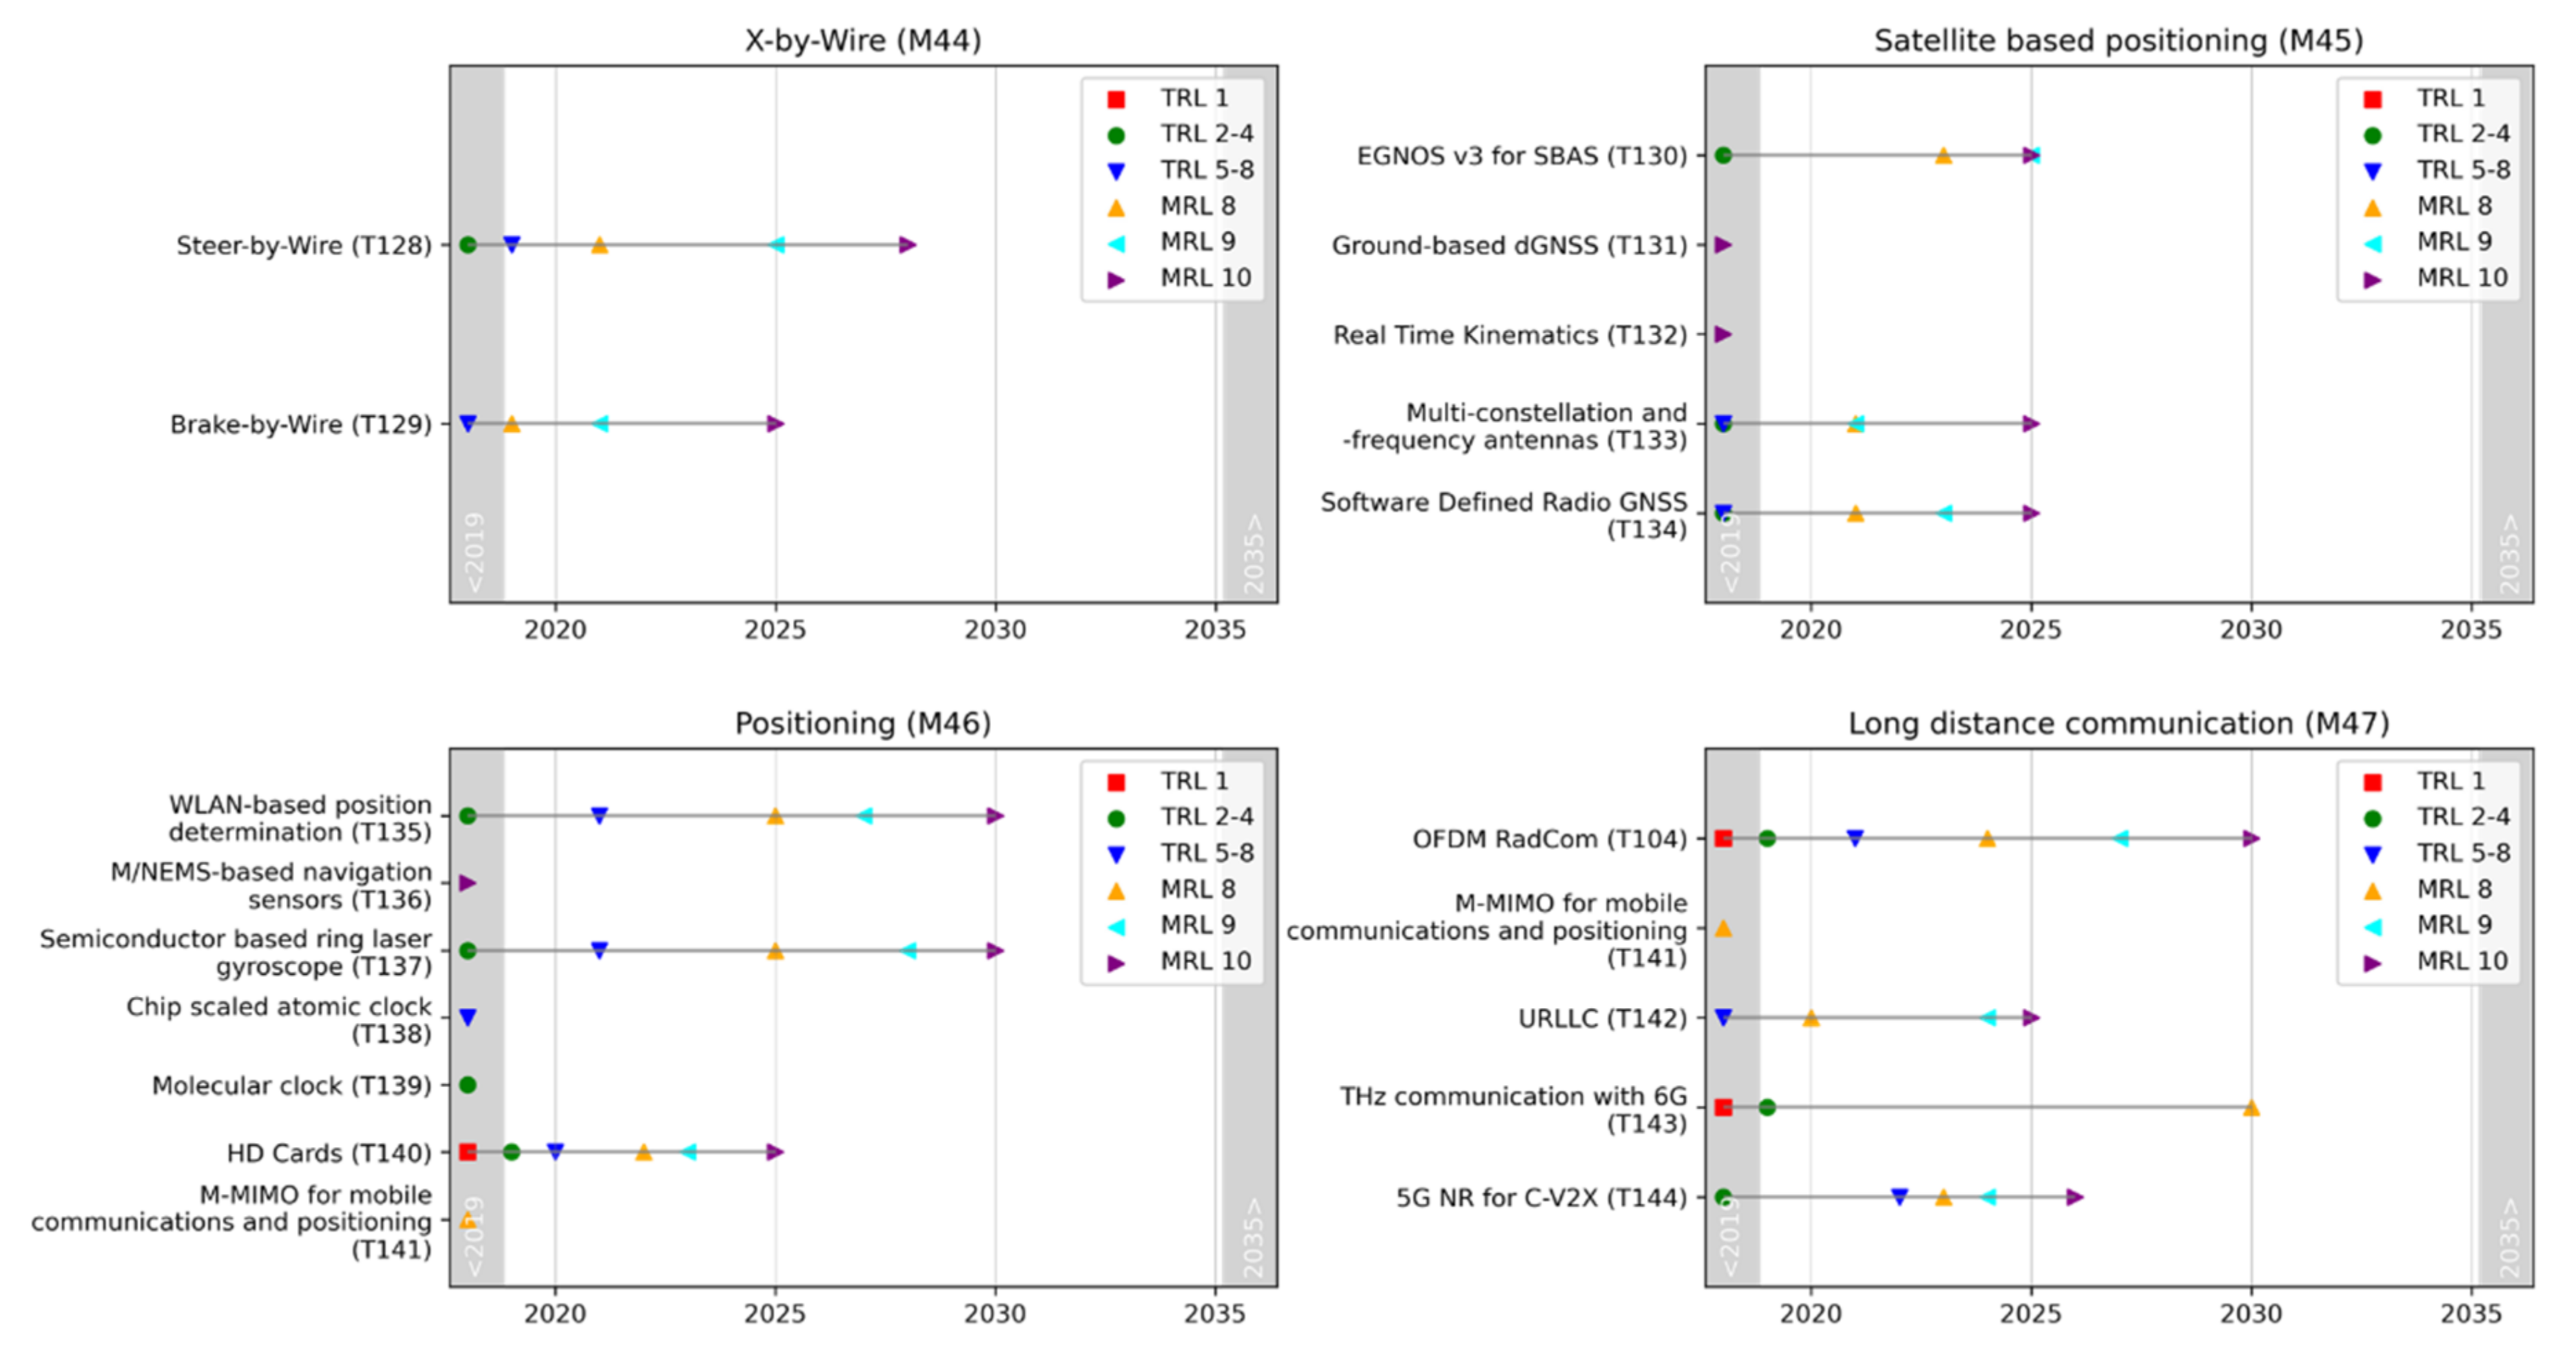
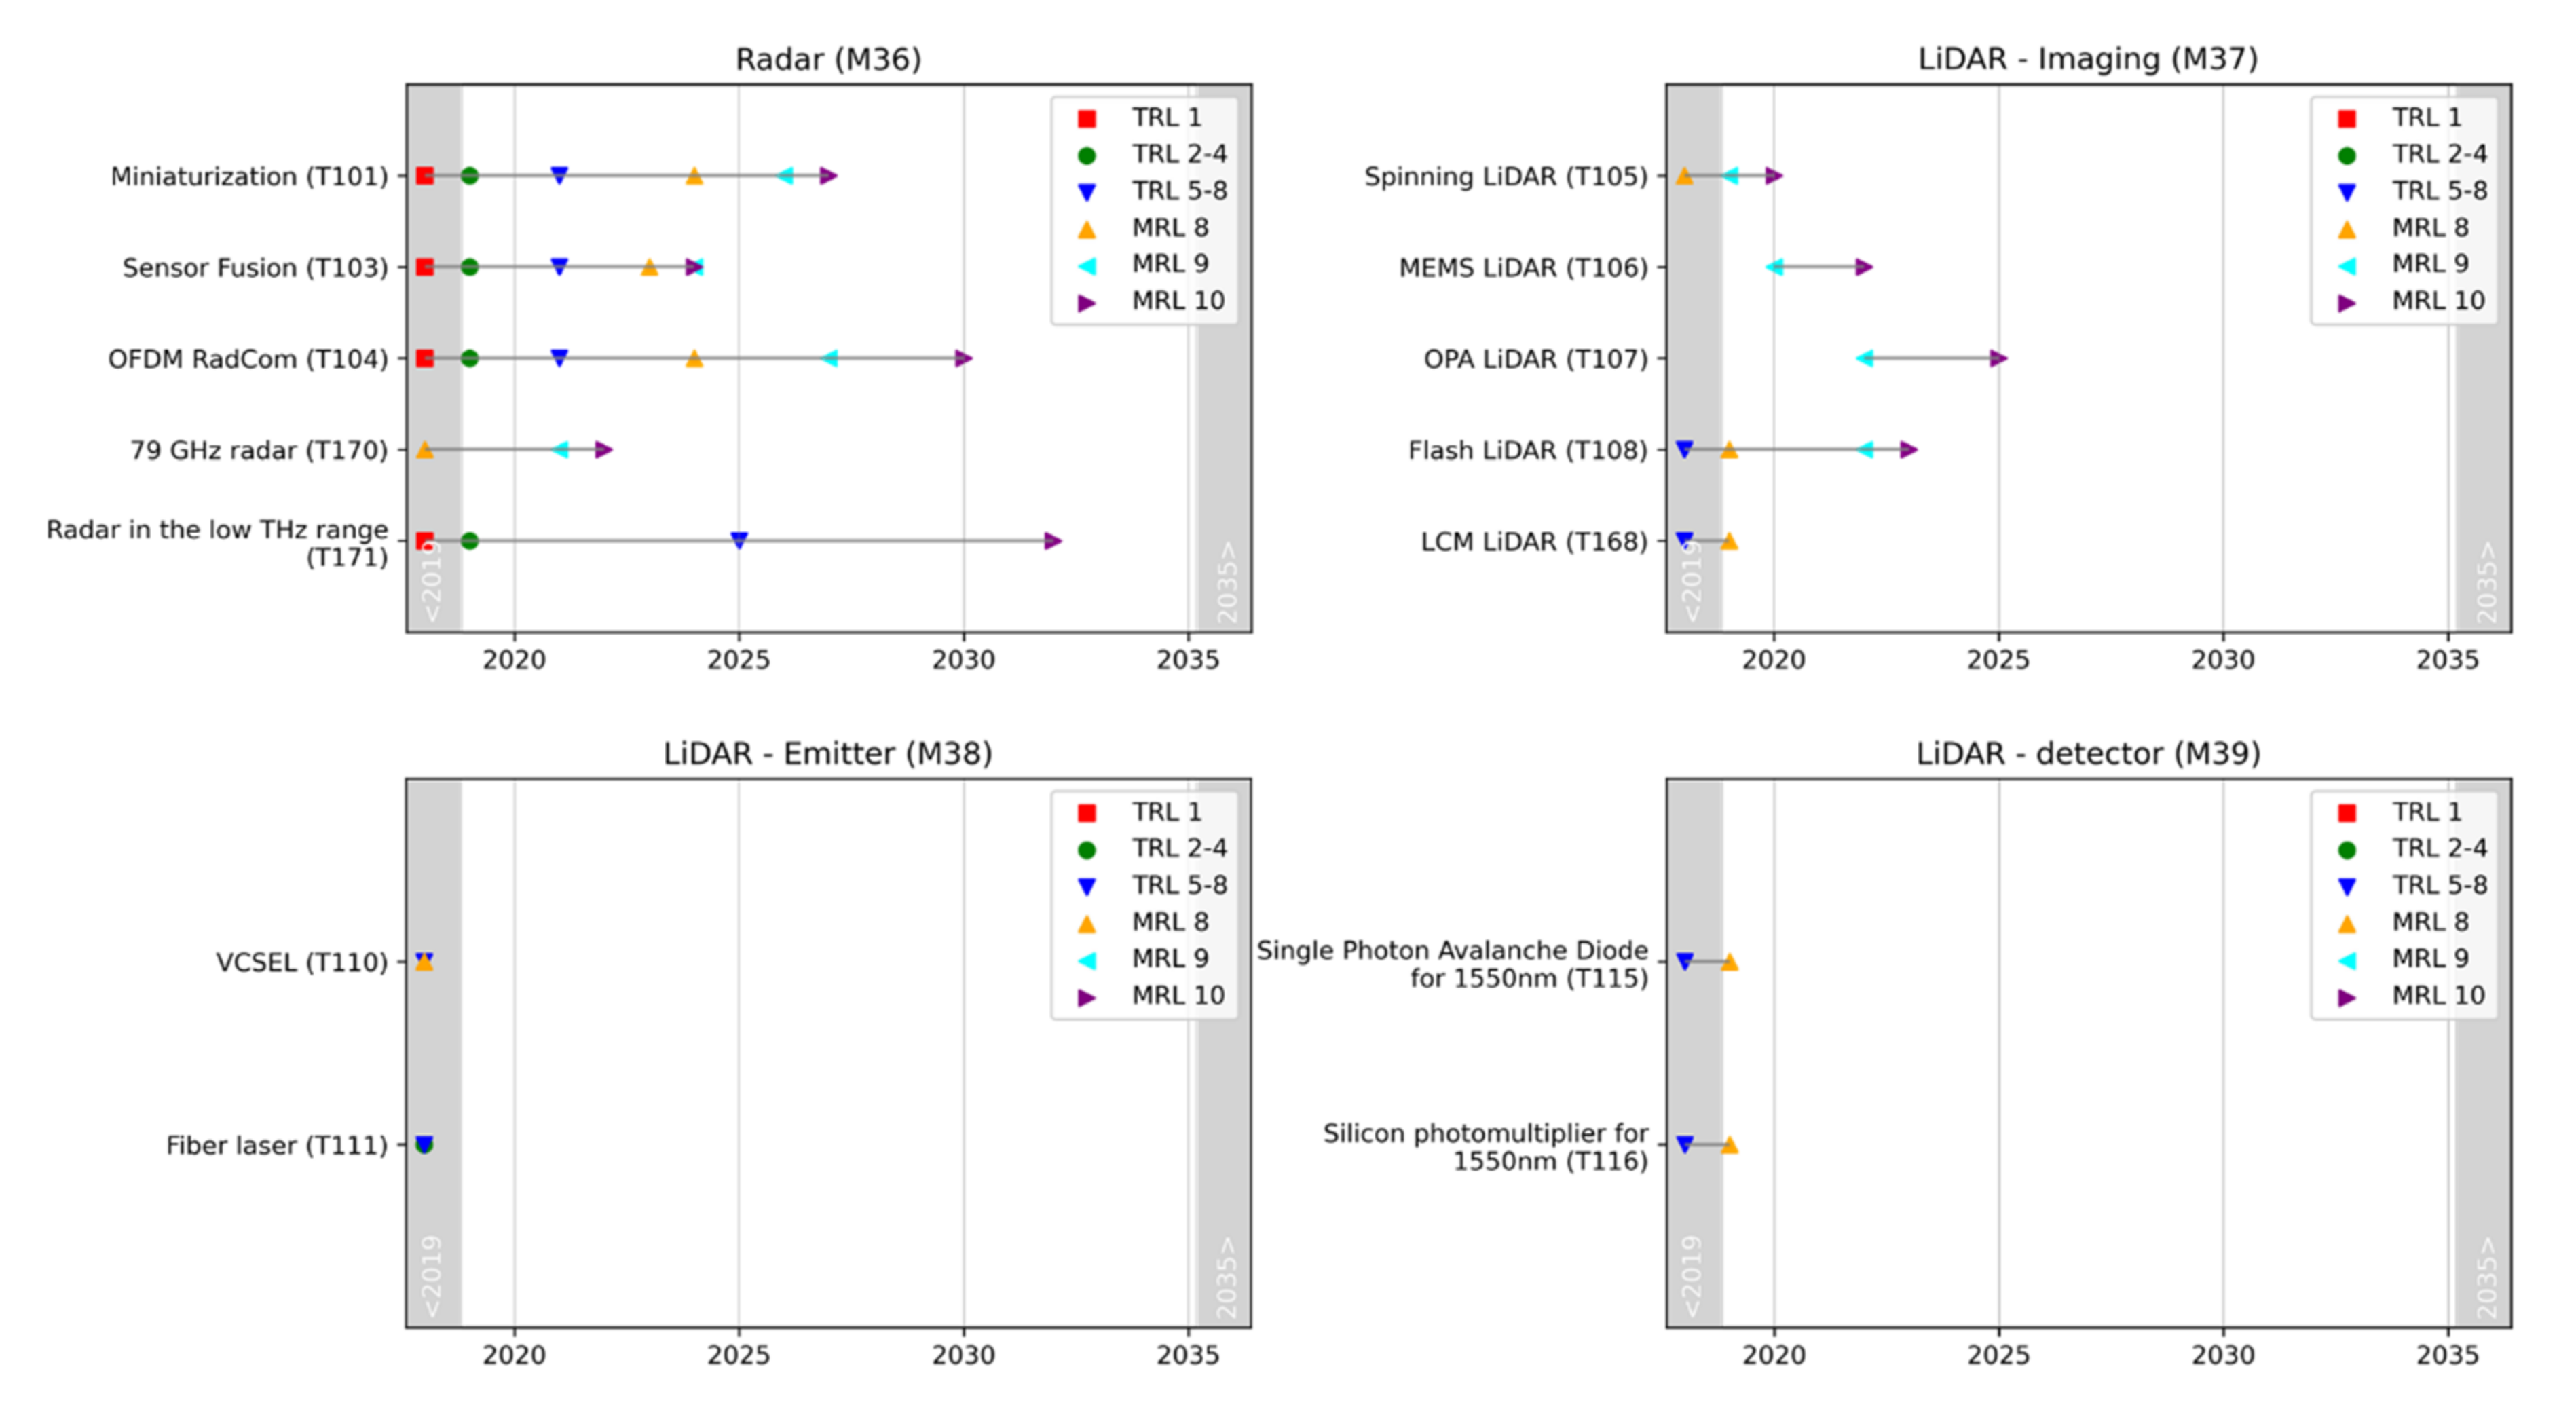
2.2.3. Structured Presentation in Technology Roadmaps

In alignment with the target user group, modules identified as relevant (Section 2.2.1) are described in a module catalog and supplemented by (1) a technology roadmap and (2) a patent analysis for the current state of research and application (see below). Fact sheets for each technology complement the roadmap visualization. A uniform and structured fact sheet format ensures that users will be able to obtain the relevant information immediately.
Technology roadmaps graphically summarize the development over time of all technologies belonging to a module. The time frame of the roadmaps extends from 2019 to 2035 and is divided into “short-term” (up to 2025), “medium-term” (2025–2030) and “long-term” (beyond 2030). Grey highlighted sections represent developments before 2019 or after 2035. The development of technologies is shown by maturity levels (Section 2.2.2) along a time axis. If markers are missing, it was not possible to obtain an assessment from the experts for this maturity level. If a timeline does not end with MRL10, this does not mean that the technology’s development has stopped but that no annual figures could be obtained for the subsequent maturity levels. The temporal development of the technologies presented in the roadmaps is derived from a Delphi survey with experts.

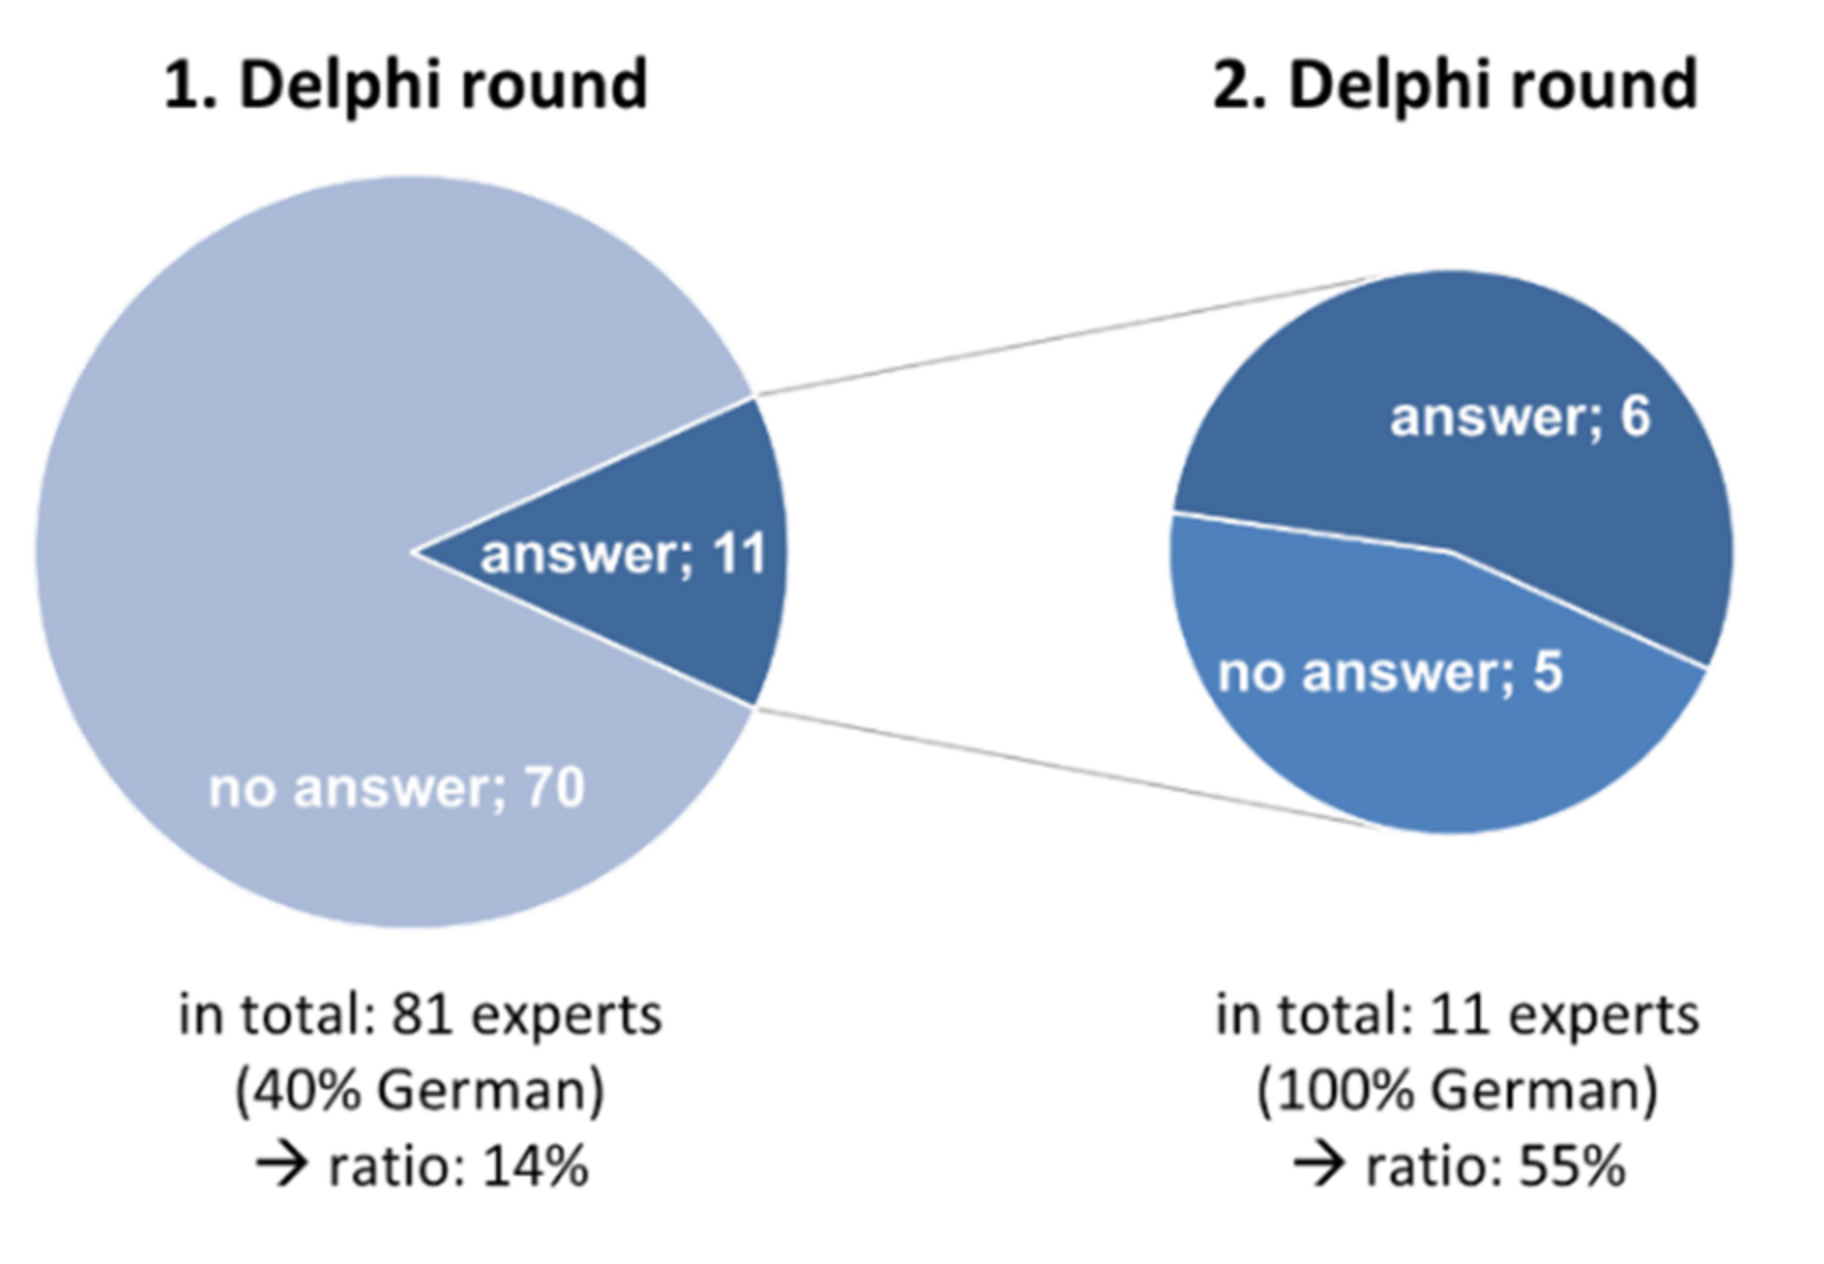
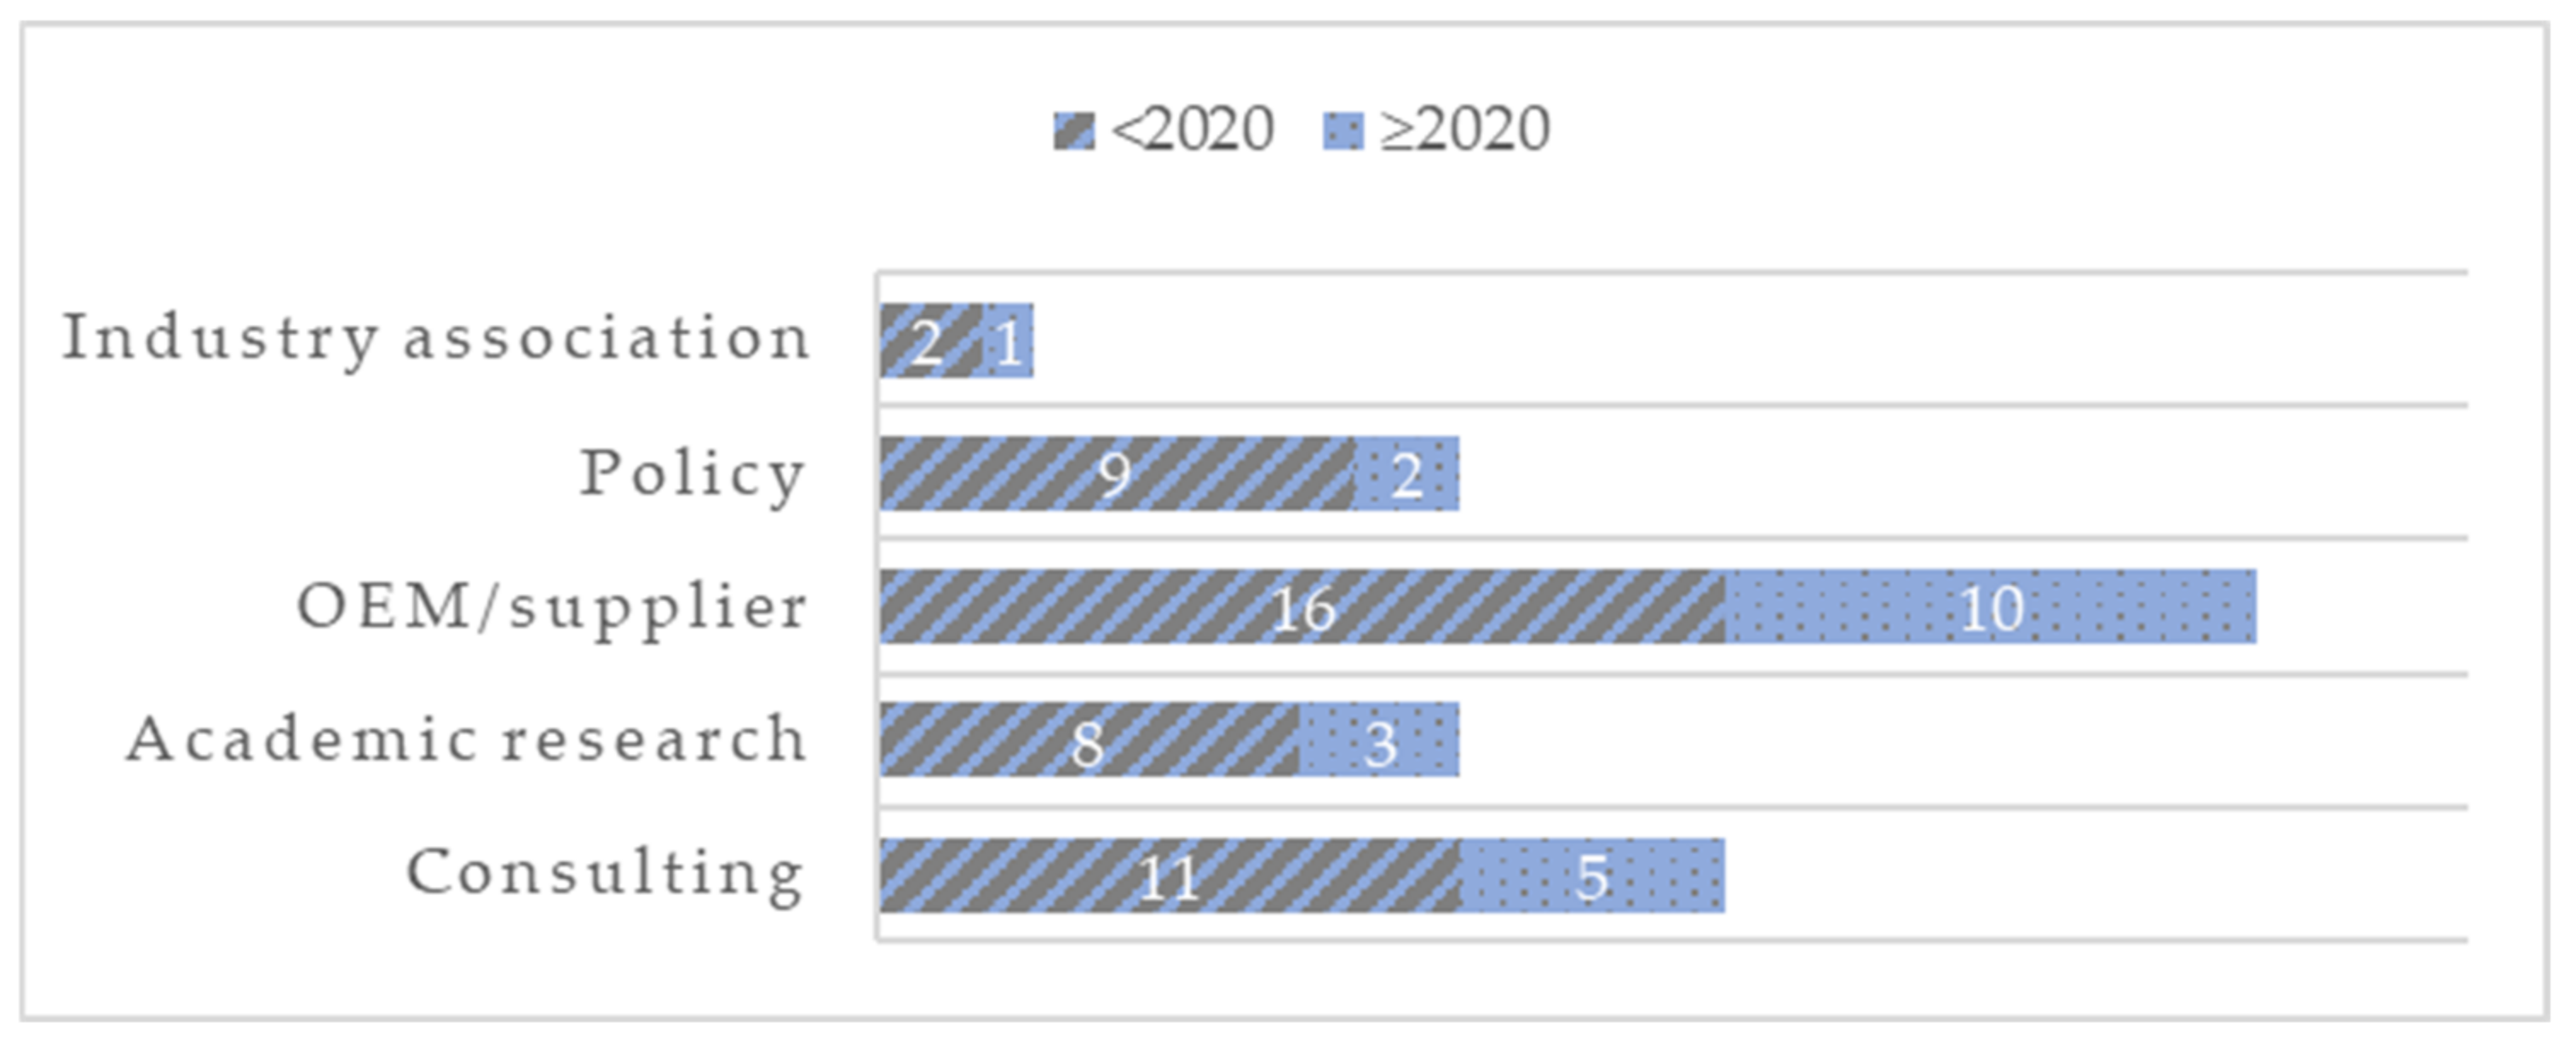
2.2.4. Delphi Survey

The Delphi method is used to generate the contents of the technology fact sheets and roadmaps. The Delphi expert survey was developed in the 1950s by the RAND Corporation in the USA and is used for technology forecasting based on the assessments of several experts [46]. These experts are interviewed several times in a multi-stage, anonymized process [22,47]. After each round, the answers are consolidated and compiled for the next round. Confronted with the answers of their colleagues, the experts are asked to reconsider, justify and confirm or change their initial answer. This process has to be conducted at least twice [22,46]. A well-conducted Delphi survey outperforms other expert opinion methods [22]. Characteristic features of a Delphi survey are, according to [46,47]:
  • Identification of experts in a Delphi panel (the initial base must be large enough so that, despite the expected shrinkage in each round, there are enough experts left in the last Delphi round);
  • Survey of the panel with a structured questionnaire;
  • Anonymity of the responses as well as of the experts;
  • Consolidation of the answers after each round of questioning, including reasons for drastic discrepancies;
  • (Multiple) repetition (min. two rounds) of the survey.
According to the process, the expert panel for this work is established first: Domain experts are identified with respect to the relevant modules (Section 2.2.1). For each module, authors most frequently mentioned in various online full-text scientific databases were identified in order to target highly qualified experts. Figure 3 shows the identification process on three databases: Scopus, Web of Science and IEEE Xplore.
In this work, a total of 81 experts were asked to participate in the Delphi expert panel. However, only 14% consented. Two iterations are conducted for the Delphi survey. In the first round of the process, a formalized questionnaire was answered anonymously by the expert panel. The questionnaire included mainly questions on the temporal development of the identified technologies’ maturity levels but also questions on the content for the fact sheets. The responses of all experts were consolidated after the first round. The consolidated results were then returned to the expert panel, with their initial responses of the first round for comparison. The second iteration of the Delphi survey was conducted as a telephone interview with a semi-structured interview guideline in order to improve the response rate, as suggested by [48]. This allowed 55% of the remaining Delphi panel consisting of 11 German experts to be successfully consulted (Figure 4). The interviewer reviewed with each expert individually possible differences between their initial answer and the panel’s consolidated answer. If no consensus could be achieved, the consensus of the majority was used as input for the roadmaps, but the differing answer of the outlier expert is mentioned in the fact sheets.
The low response rate is a major but well-known challenge of Delphi expert surveys [48,49]. A concern with the Delphi method is that the experts, as specialists for the respective modules, are more inclined to be optimistic about the development of the respective technologies [46,47]. In this work, the parallel design and comparison with publication analyses (Figure 1) addresses this challenge.
Using the two-stage Delphi process, 37 technologies were successfully verified. The remaining 22 technologies are based on an extensive literature review and the authors’ expertise. Whether a technology successfully passed the Delphi process is indicated in the fact sheets.

2.2.5. Patent Analysis

Enhancing the qualitative Delphi Study, a quantitative analysis of research and development (R&D) activities was carried out for each module using an in-depth analysis of patent applications in the respective technology fields. The goal is to identify the development of R&D intensities for each module over a time period of 15 years in order to provide SMEs with supplementary information on development trends and leading companies in the respective R&D fields. By combining IPC classes and search terms, individual search strategies were developed for each technology option being analyzed to achieve the best possible narrowing of results to road transport and passenger cars.
Transnational patent applications were identified in the database of the European Patent Office (EPO). As far as possible, the ten largest patent applicants for each technology option are listed in a column chart. Furthermore, other companies headquartered in Germany are listed and highlighted for this analysis.

3. Results

The following sections present the results obtained with the elaborated method and applied to automotive automation. With reference to the methodological structure in Figure 1, trends in functional development are examined first, followed by an analysis of technological developments. Each analysis is complemented by an estimate of complexity and implementation effort. Both intermediate results are merged into the final aggregated result in the Section 3.3: the overall roadmap, in which the results of both approaches are contrasted.

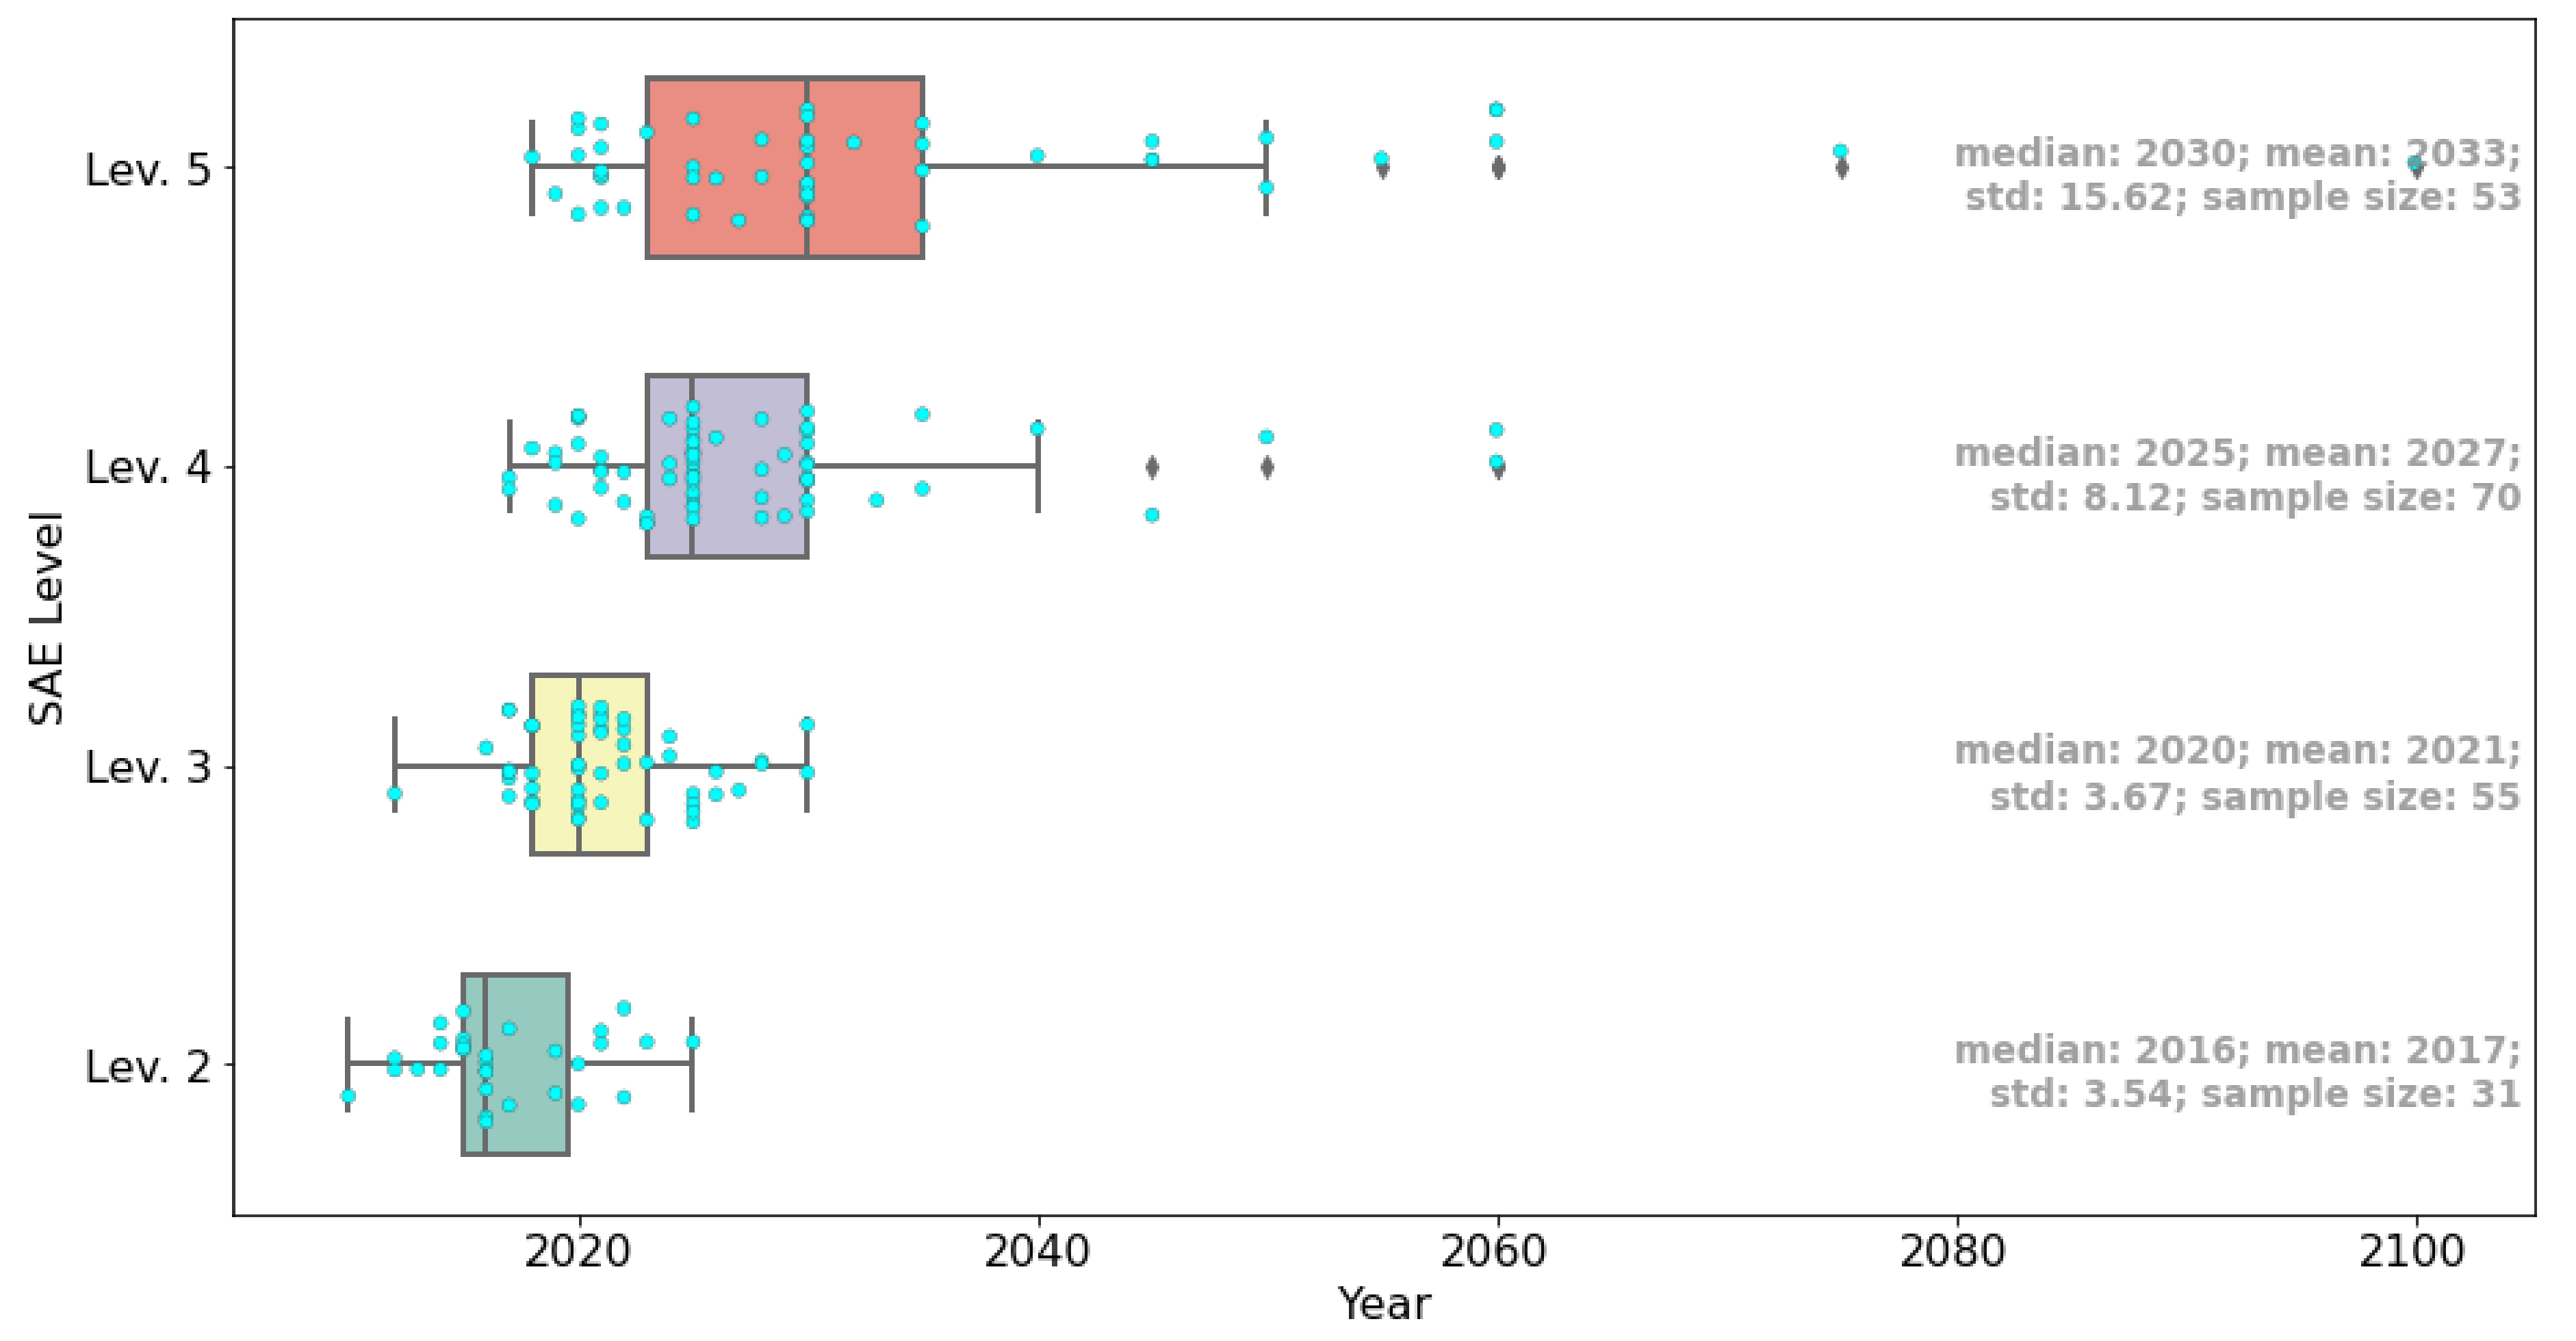
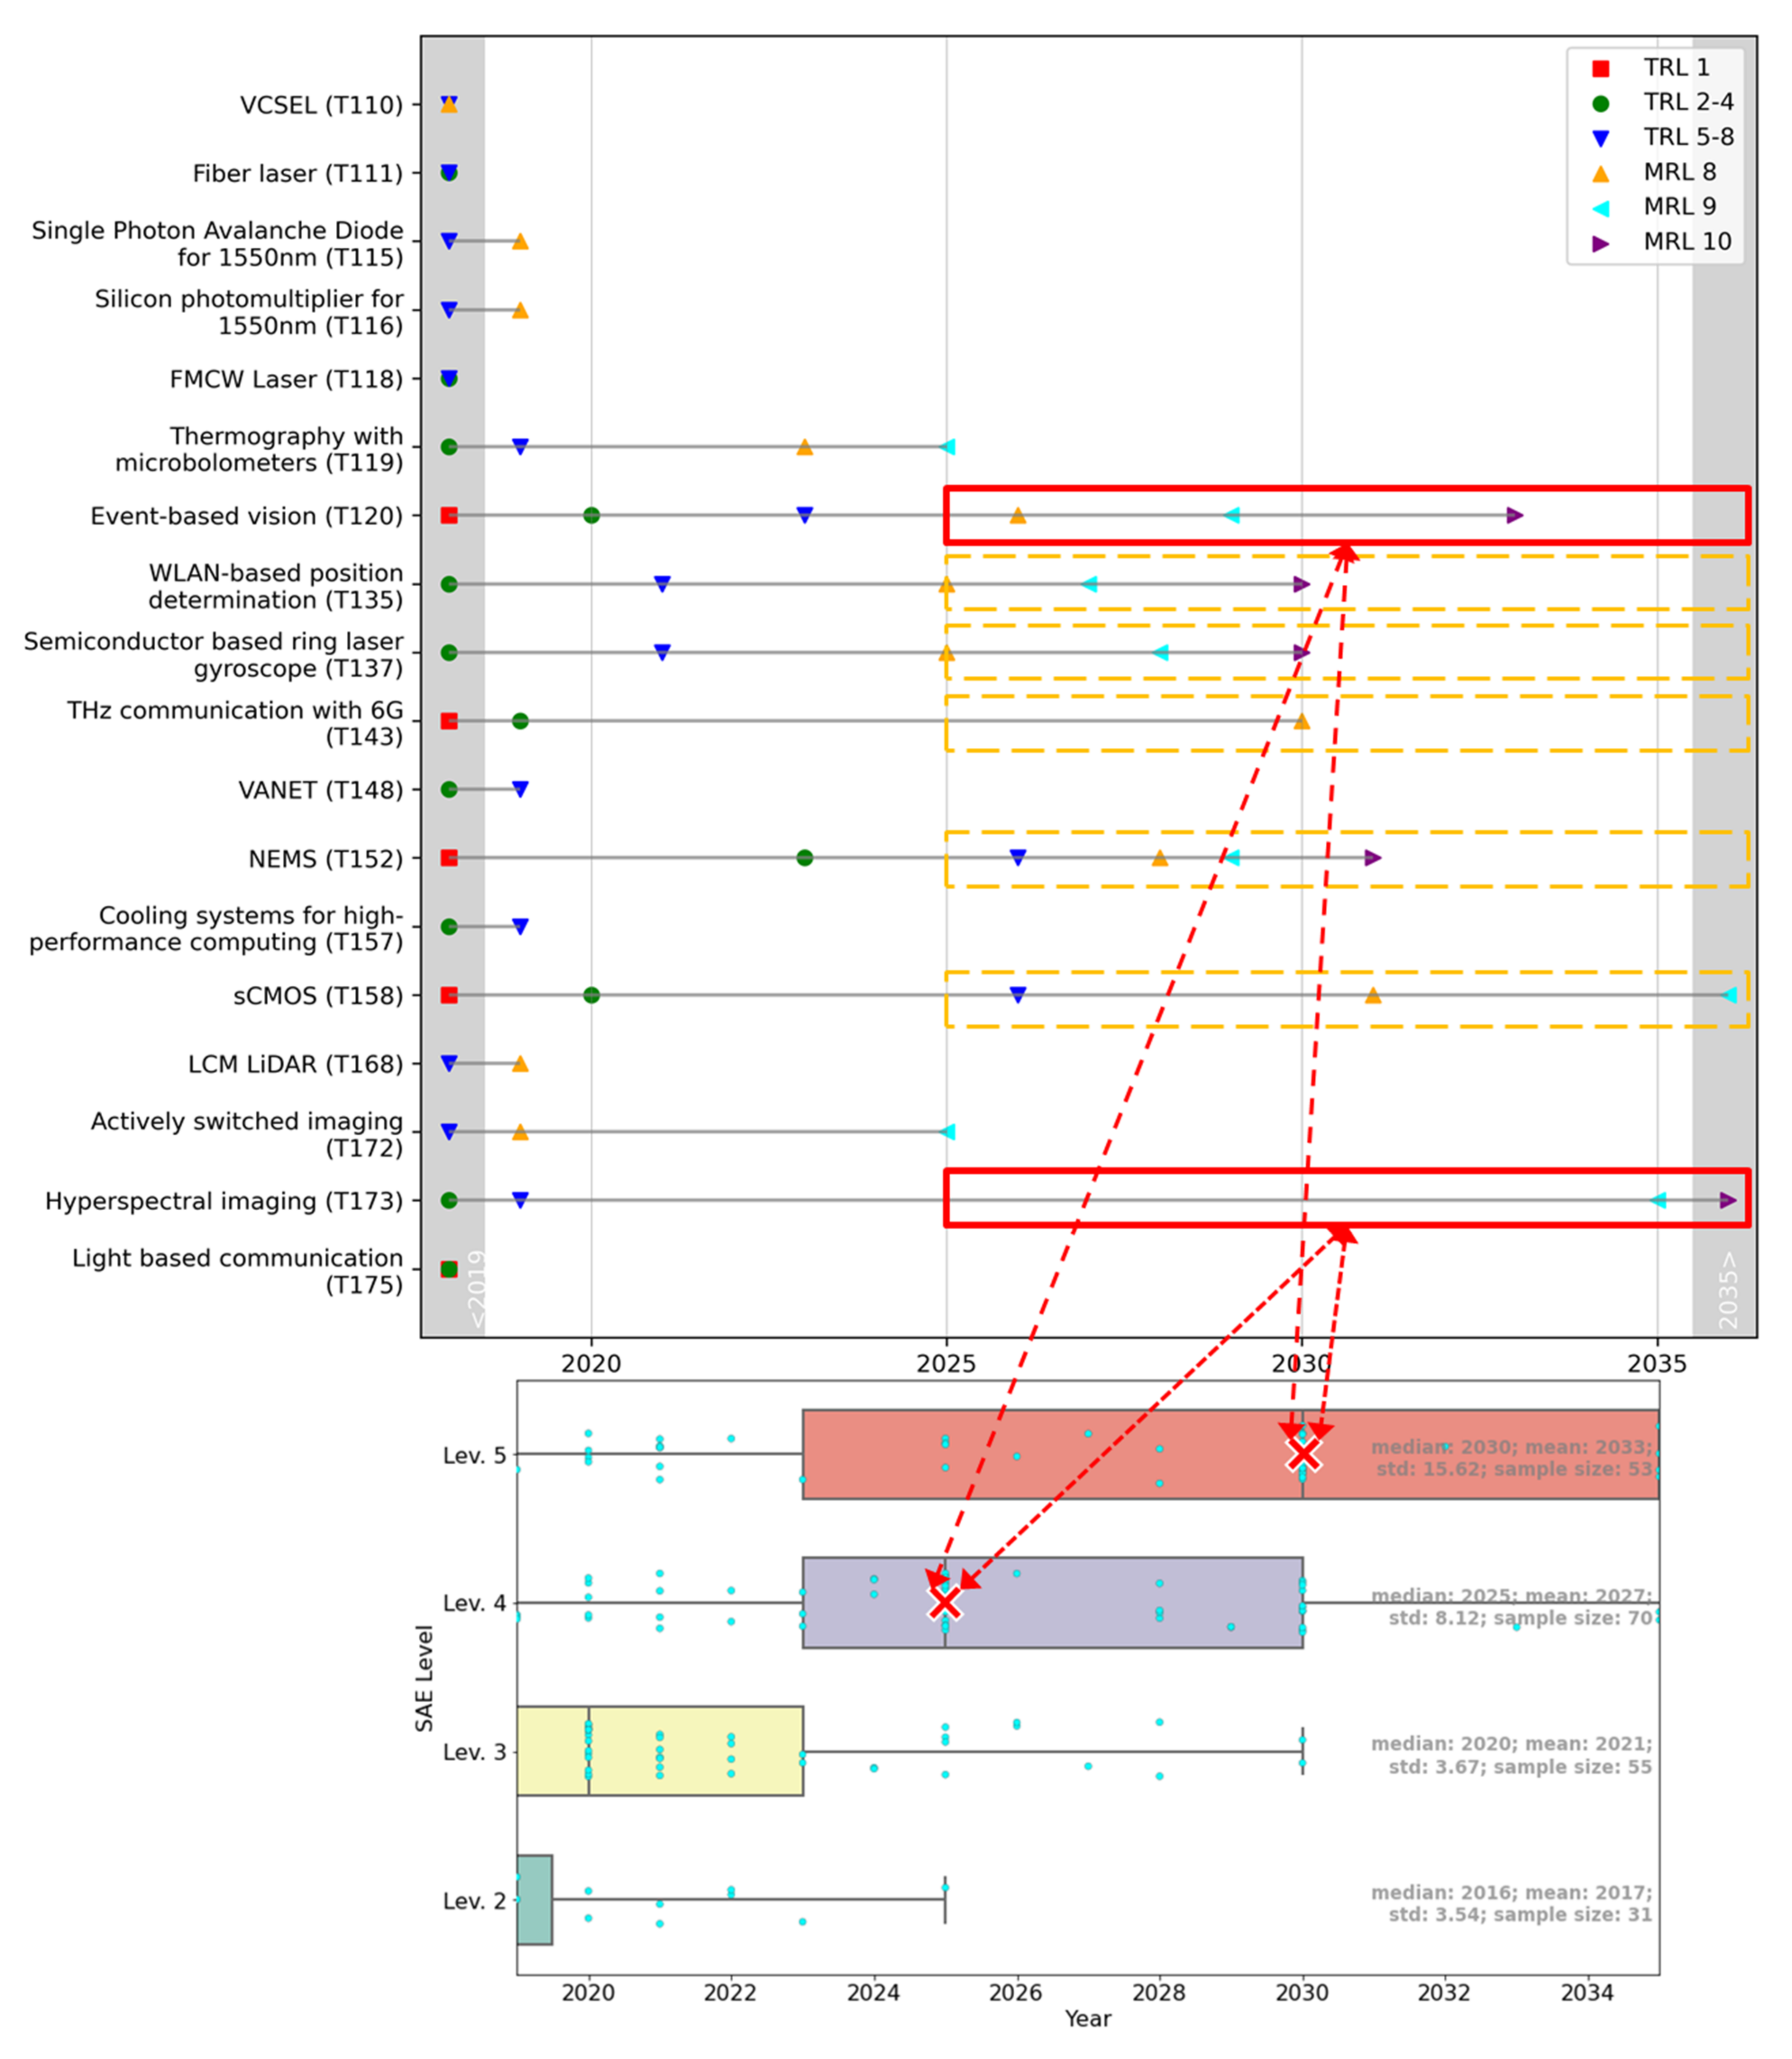
3.1. Trends in Functional Development

In Figure 5, boxplots of the various predictions on SAE levels 2–5 entry dates are shown. Neither publication dates nor source categories are filtered, i.e., all data points are included in this figure. The standard deviations for SAE levels 2 and 3 are significantly lower than for SAE level 4 (8.12), at 3.54 and 3.67, respectively, and even about 5 times smaller than for SAE level 5 (15.62). This was expected and is plausible since SAE level 2 has already been achieved, and SAE level 3 is close to market introduction. The more distant the function introduction, the more uncertain the prediction and the greater the scatter of the respective estimates. For SAE level 5, there are some extreme outliers (at the years 2055, 2060, 2075 and 2100) that confirm this behavior.
According to the medians, the following chronological development is derived from the sources as a whole: SAE level 2 has already been introduced, SAE level 3 should have been introduced as early as 2020 (which has not come to be true), followed 5 years later by SAE level 4, and finally another 5 years later by SAE level 5 in 2030.
A more in-depth analysis of the publication is shown in Figure 6 (top), filtering for sources published before and after 2020. The filtering reduced the sample size, however. The median for the top two SAE levels does not change when distinguished by publication year. However, SAE level 3 moves from 2020 to 2023, which is plausible in that there were no SAE level 3 passenger cars in 2020. One publication published in or after 2020 still determined the introduction of SAE level 2 after 2020. This is surprising as SAE level 2 is commonly agreed on to be already introduced before 2020 (e.g., Tesla (Austin, TX, USA) Autopilot or GM (Detroit, MI, USA) Super Cruise systems).
The press releases or assessments of the OEMs and suppliers are excluded in Figure 6, as they might have an overly optimistic outlook on the introduction of their new automation functions. However, the distribution of the results is only slightly more widespread, while the medians remain the same (compared to Figure 5). Only the mean values of the upper two SAE levels experience a shift of 1 and 5 years, respectively. For SAE level 5, this is due to outliers (especially the one in the year 2100) now being more significant in the calculation of the mean value.
The computational effort for this publication analysis is low. However, the continuous monitoring of the statements on introduction dates of different automation levels requires considerable (manual) effort. Not only are new predictions constantly being made but also the reliability of the sources must be validated and the chaotic, heterogeneous (big) data processed in a structured manner so that an automated analysis can be conducted. Monitoring could be automated with big data analyses. This requires a very high initial effort, however.

3.2. Trends in Technological Development

The development over time of the technologies relevant to automotive automation and their descriptions are based on the Delphi expert survey. The results are accessible via technology roadmaps and fact sheets; a web app visualizes the outcomes in an interactive format. In the following sections, roadmaps and supporting patent analyses are presented on the example of the camera module in the field of automation sensor technology.
The fact sheets providing in-depth information for each of the 59 technologies can be accessed via www.tkbw.de (accessed on 28 March 2022) or in the graphical, interactive web app: https://www.transformationswissen-bw.de/technologiekalender-app#/ (accessed on 28 March 2022). The tool was developed together with Touchwert® for the e-mobil BW GmbH (Stuttgart, Germany) as part of the “Strategiedialog Automobilwirtschaft BW” and “Transformationswissen BW” initiatives.

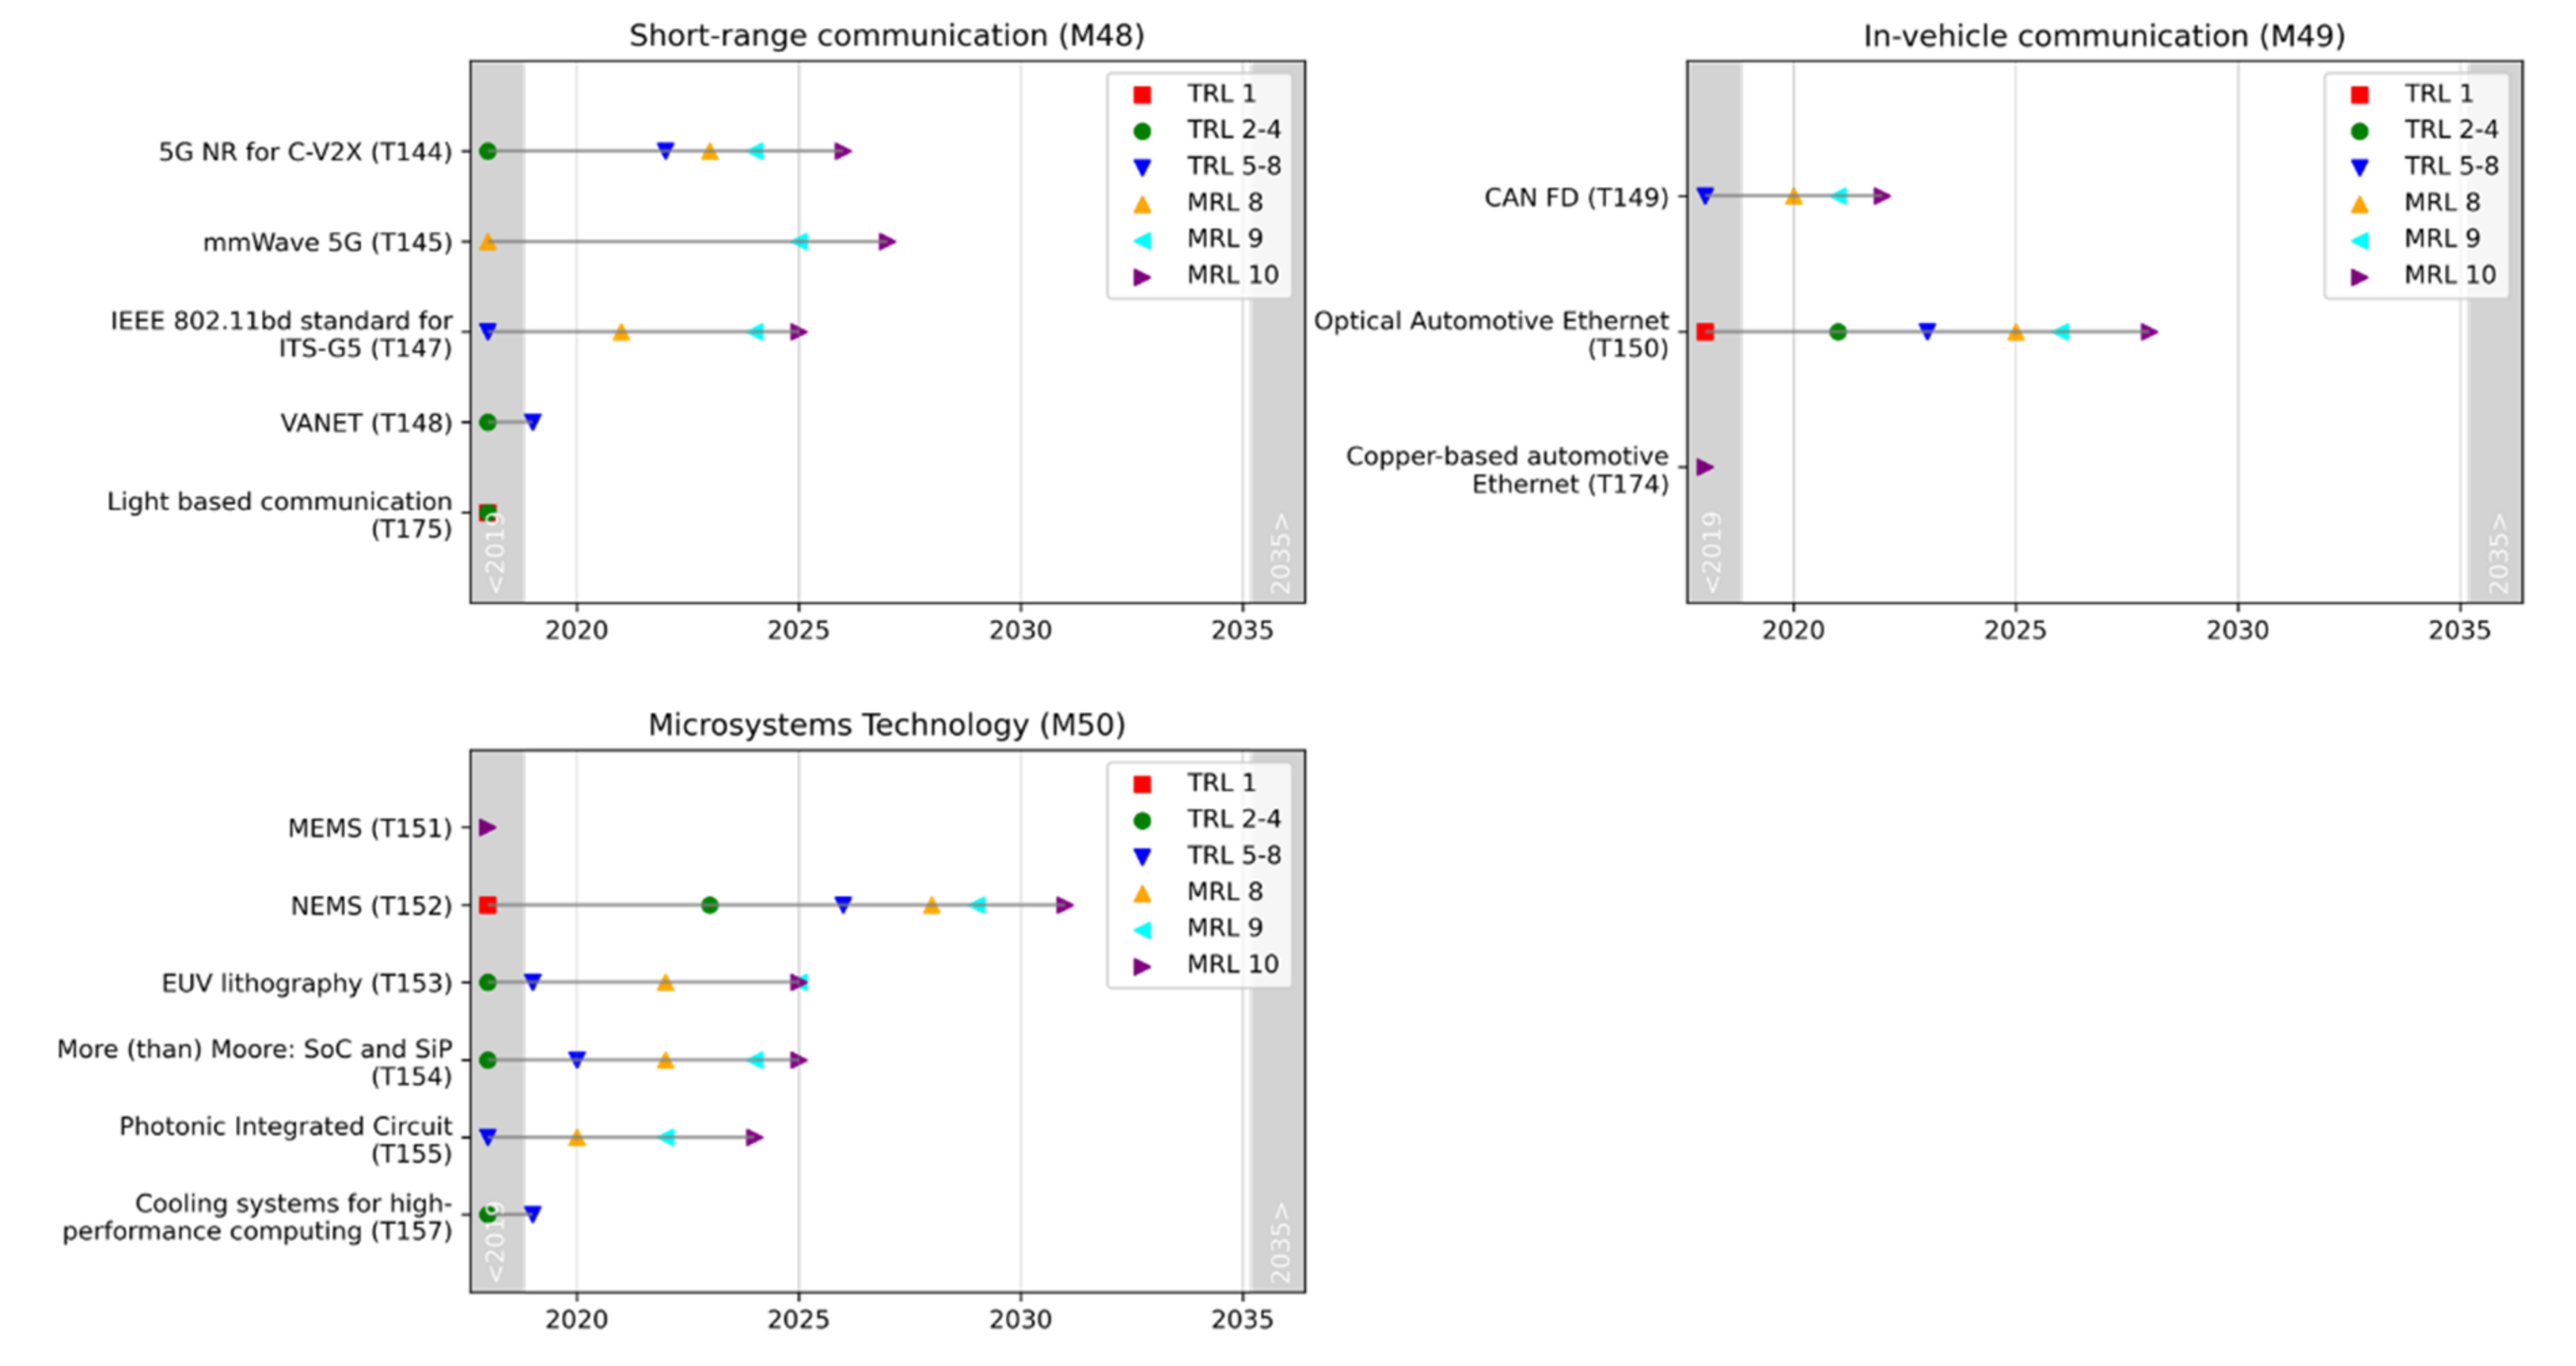
3.2.1. Roadmaps Based on Delphi Survey

Roadmaps illustrate the temporal development of technologies based on experts’ assessments. In the following, the exemplary roadmap of relevant camera technologies is shown, while the remaining 14 roadmaps can be found in Appendix A.
Figure 7 represents the roadmap for the camera module, which includes six key technology trends. Only one technology, “sensor fusion,” is expected to reach MRL 10 before 2025. More details on the technology can be accessed in the fact sheet. Some technologies, such as “sensor fusion,” may have already reached MRL10 with other specifications. Therefore, it is important to interpret the roadmaps not on its own (based only on the technology titles) but in close coordination with the descriptions in the fact sheets.
In the case of the other technologies of the camera module, the focus is on technological developments (TRL) in the short term; in the medium to long term, the main drivers are expected to be industrial manufacturing (MRL). “Event-based vision,” “hyperspectral imaging” and “scientific CMOS”, in particular, will reach MRL 9 and 10 comparatively late, well after 2030.
For example, “sCMOS” or “scientific CMOS” is the further development of the CMOS image sensor, which is already widely used in vehicles for environment detection in addition to the CCD technology. “sCMOS” features a very good signal-to-noise ratio, fast frame rates, a wide dynamic range, high resolution, high sensitivity and a large field of view. On the other hand, experts believe that the technology is still far too bulky, complex and expensive to be used in passenger cars in the foreseeable future. Rather, it is currently used in science [53,54,55].
In addition to improving image sensors, among other things, intensive research is being conducted on machine vision and artificial intelligence on the software side. On the hardware side, the acquisition of other frequency ranges (e.g., “hyperspectral imaging”) promises additional information of the environment such as road conditions [56,57,58,59].
The effort for the visualization of the results is only to be done once and can then be automated. In comparison, the effort for the preparation and execution of the Delphi survey is much higher. The preparation of the relevant technologies requires research as meaningful descriptions are needed so that all experts refer to the identical technology. The acquisition of the expert panel requires a lot of time and the response time of the experts when conducting the first Delphi round is long. The telephone interviews as well as reaching a consensus is work intensive for the conducting team.

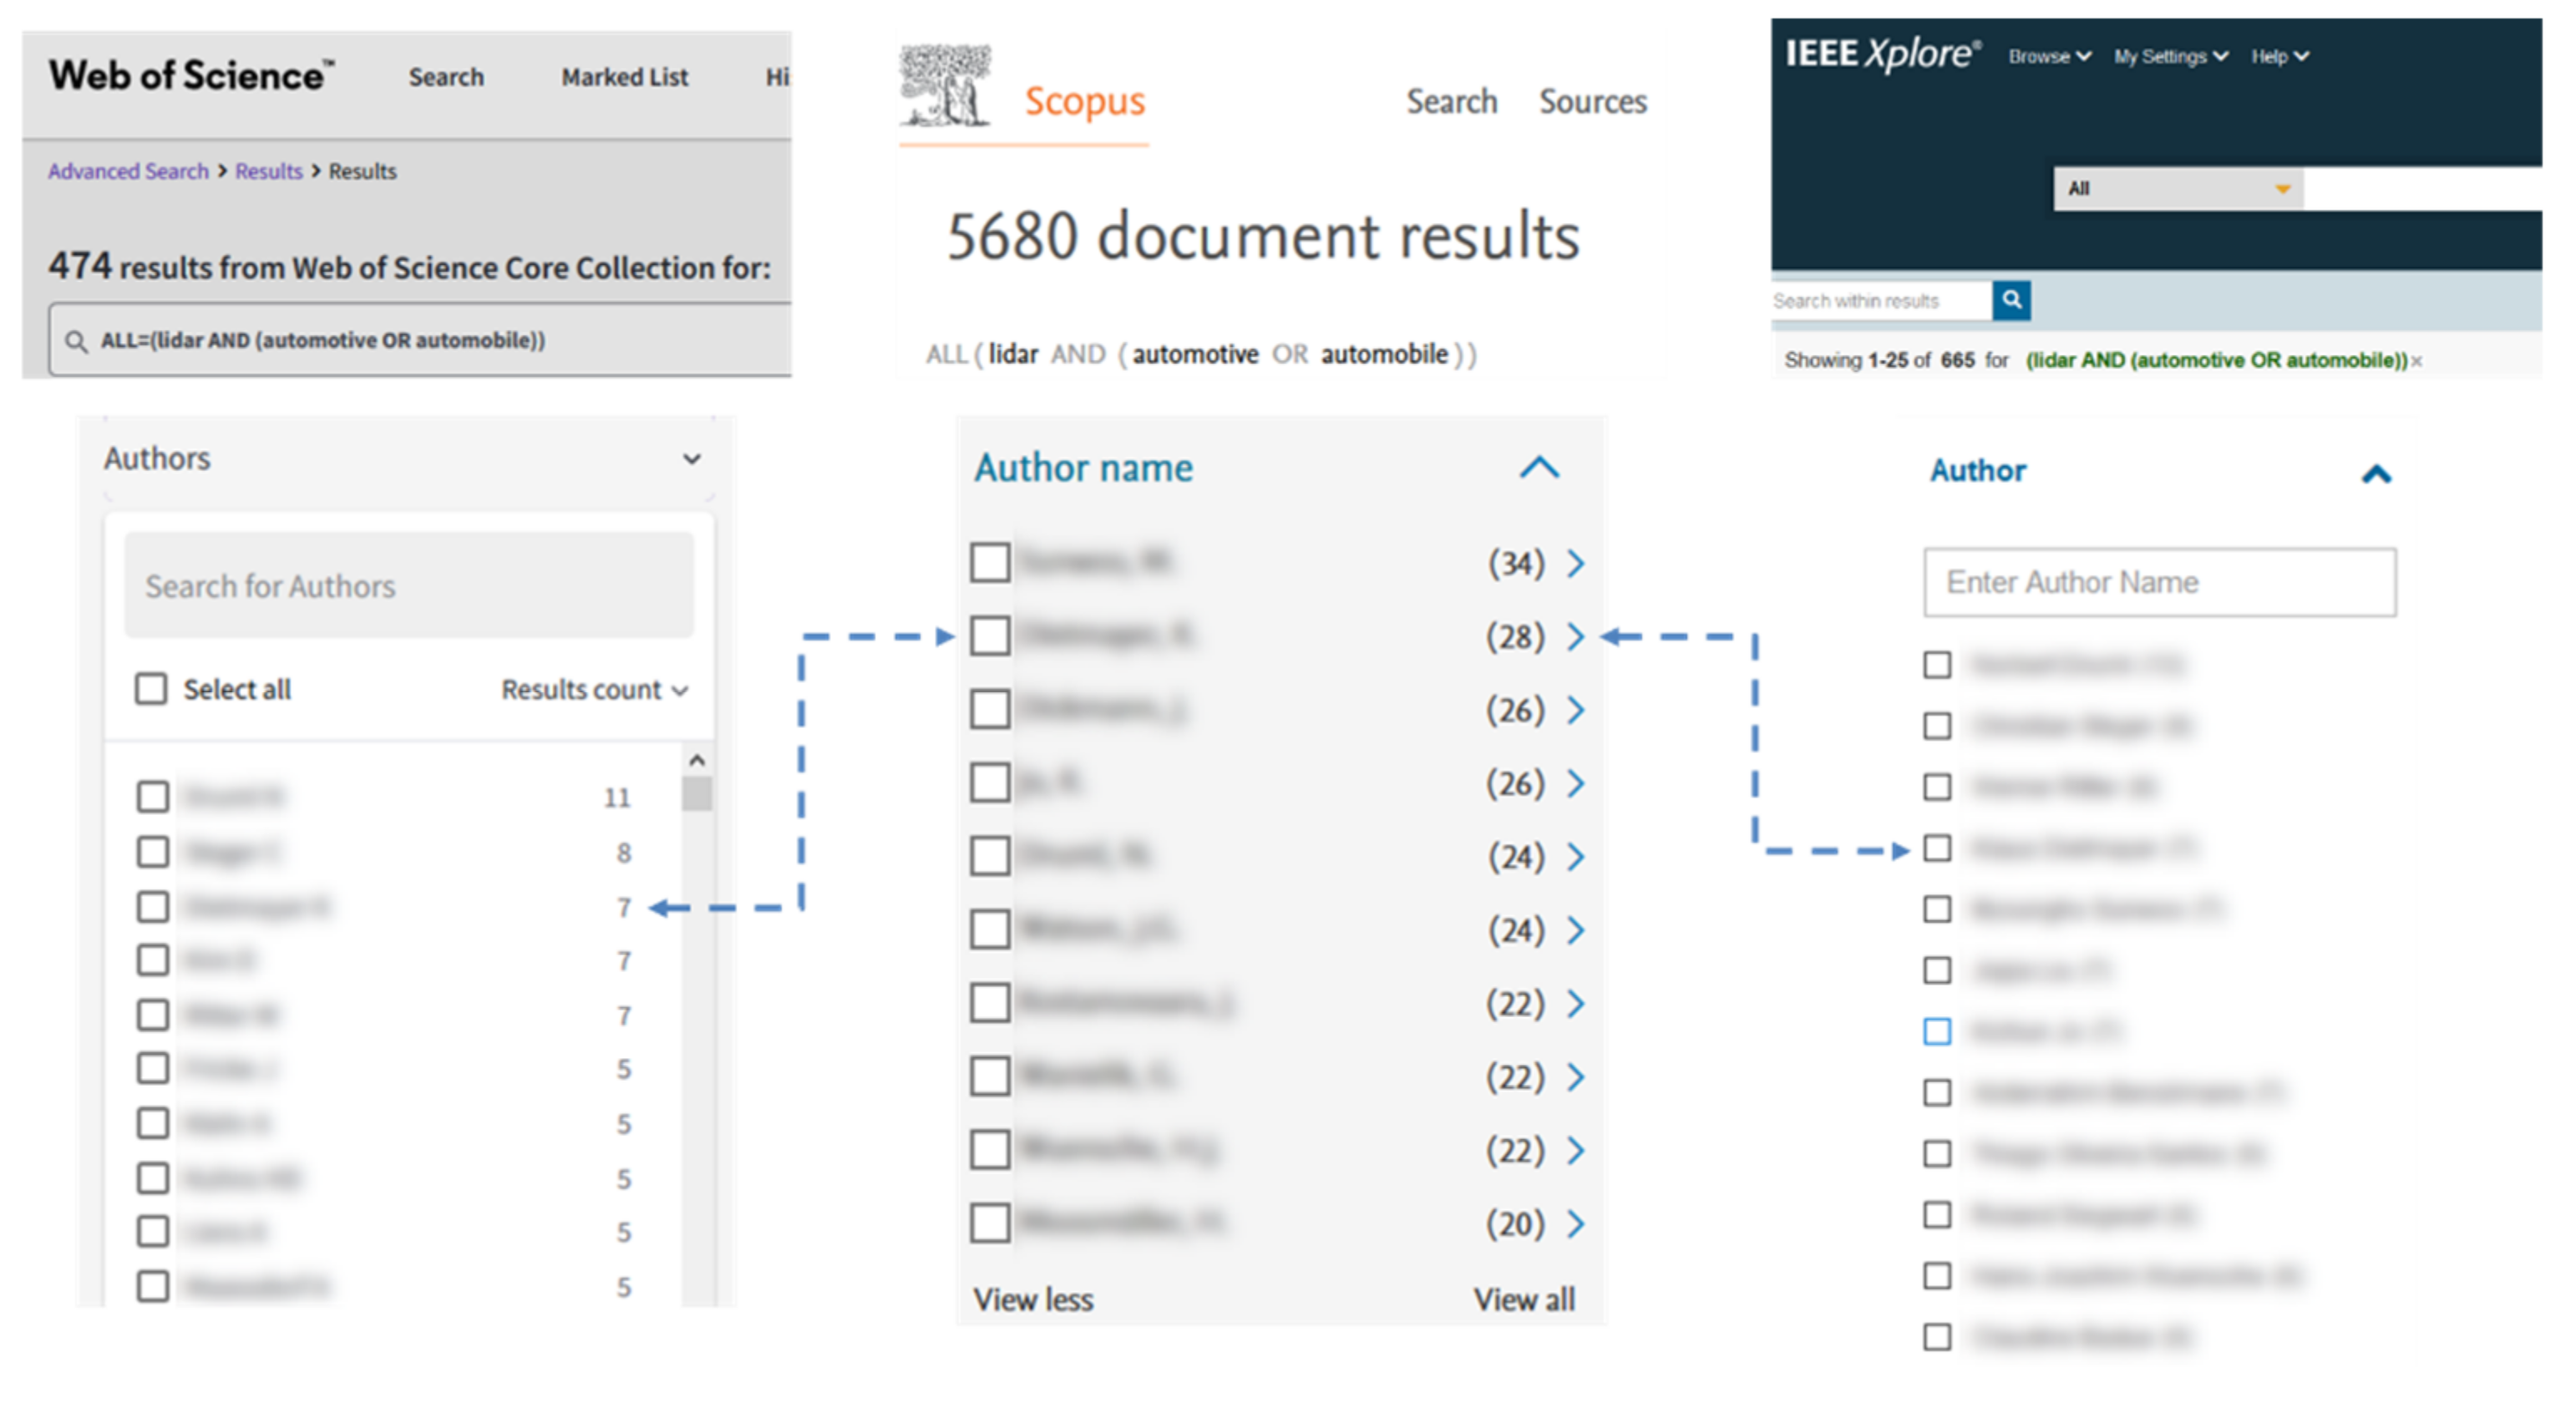
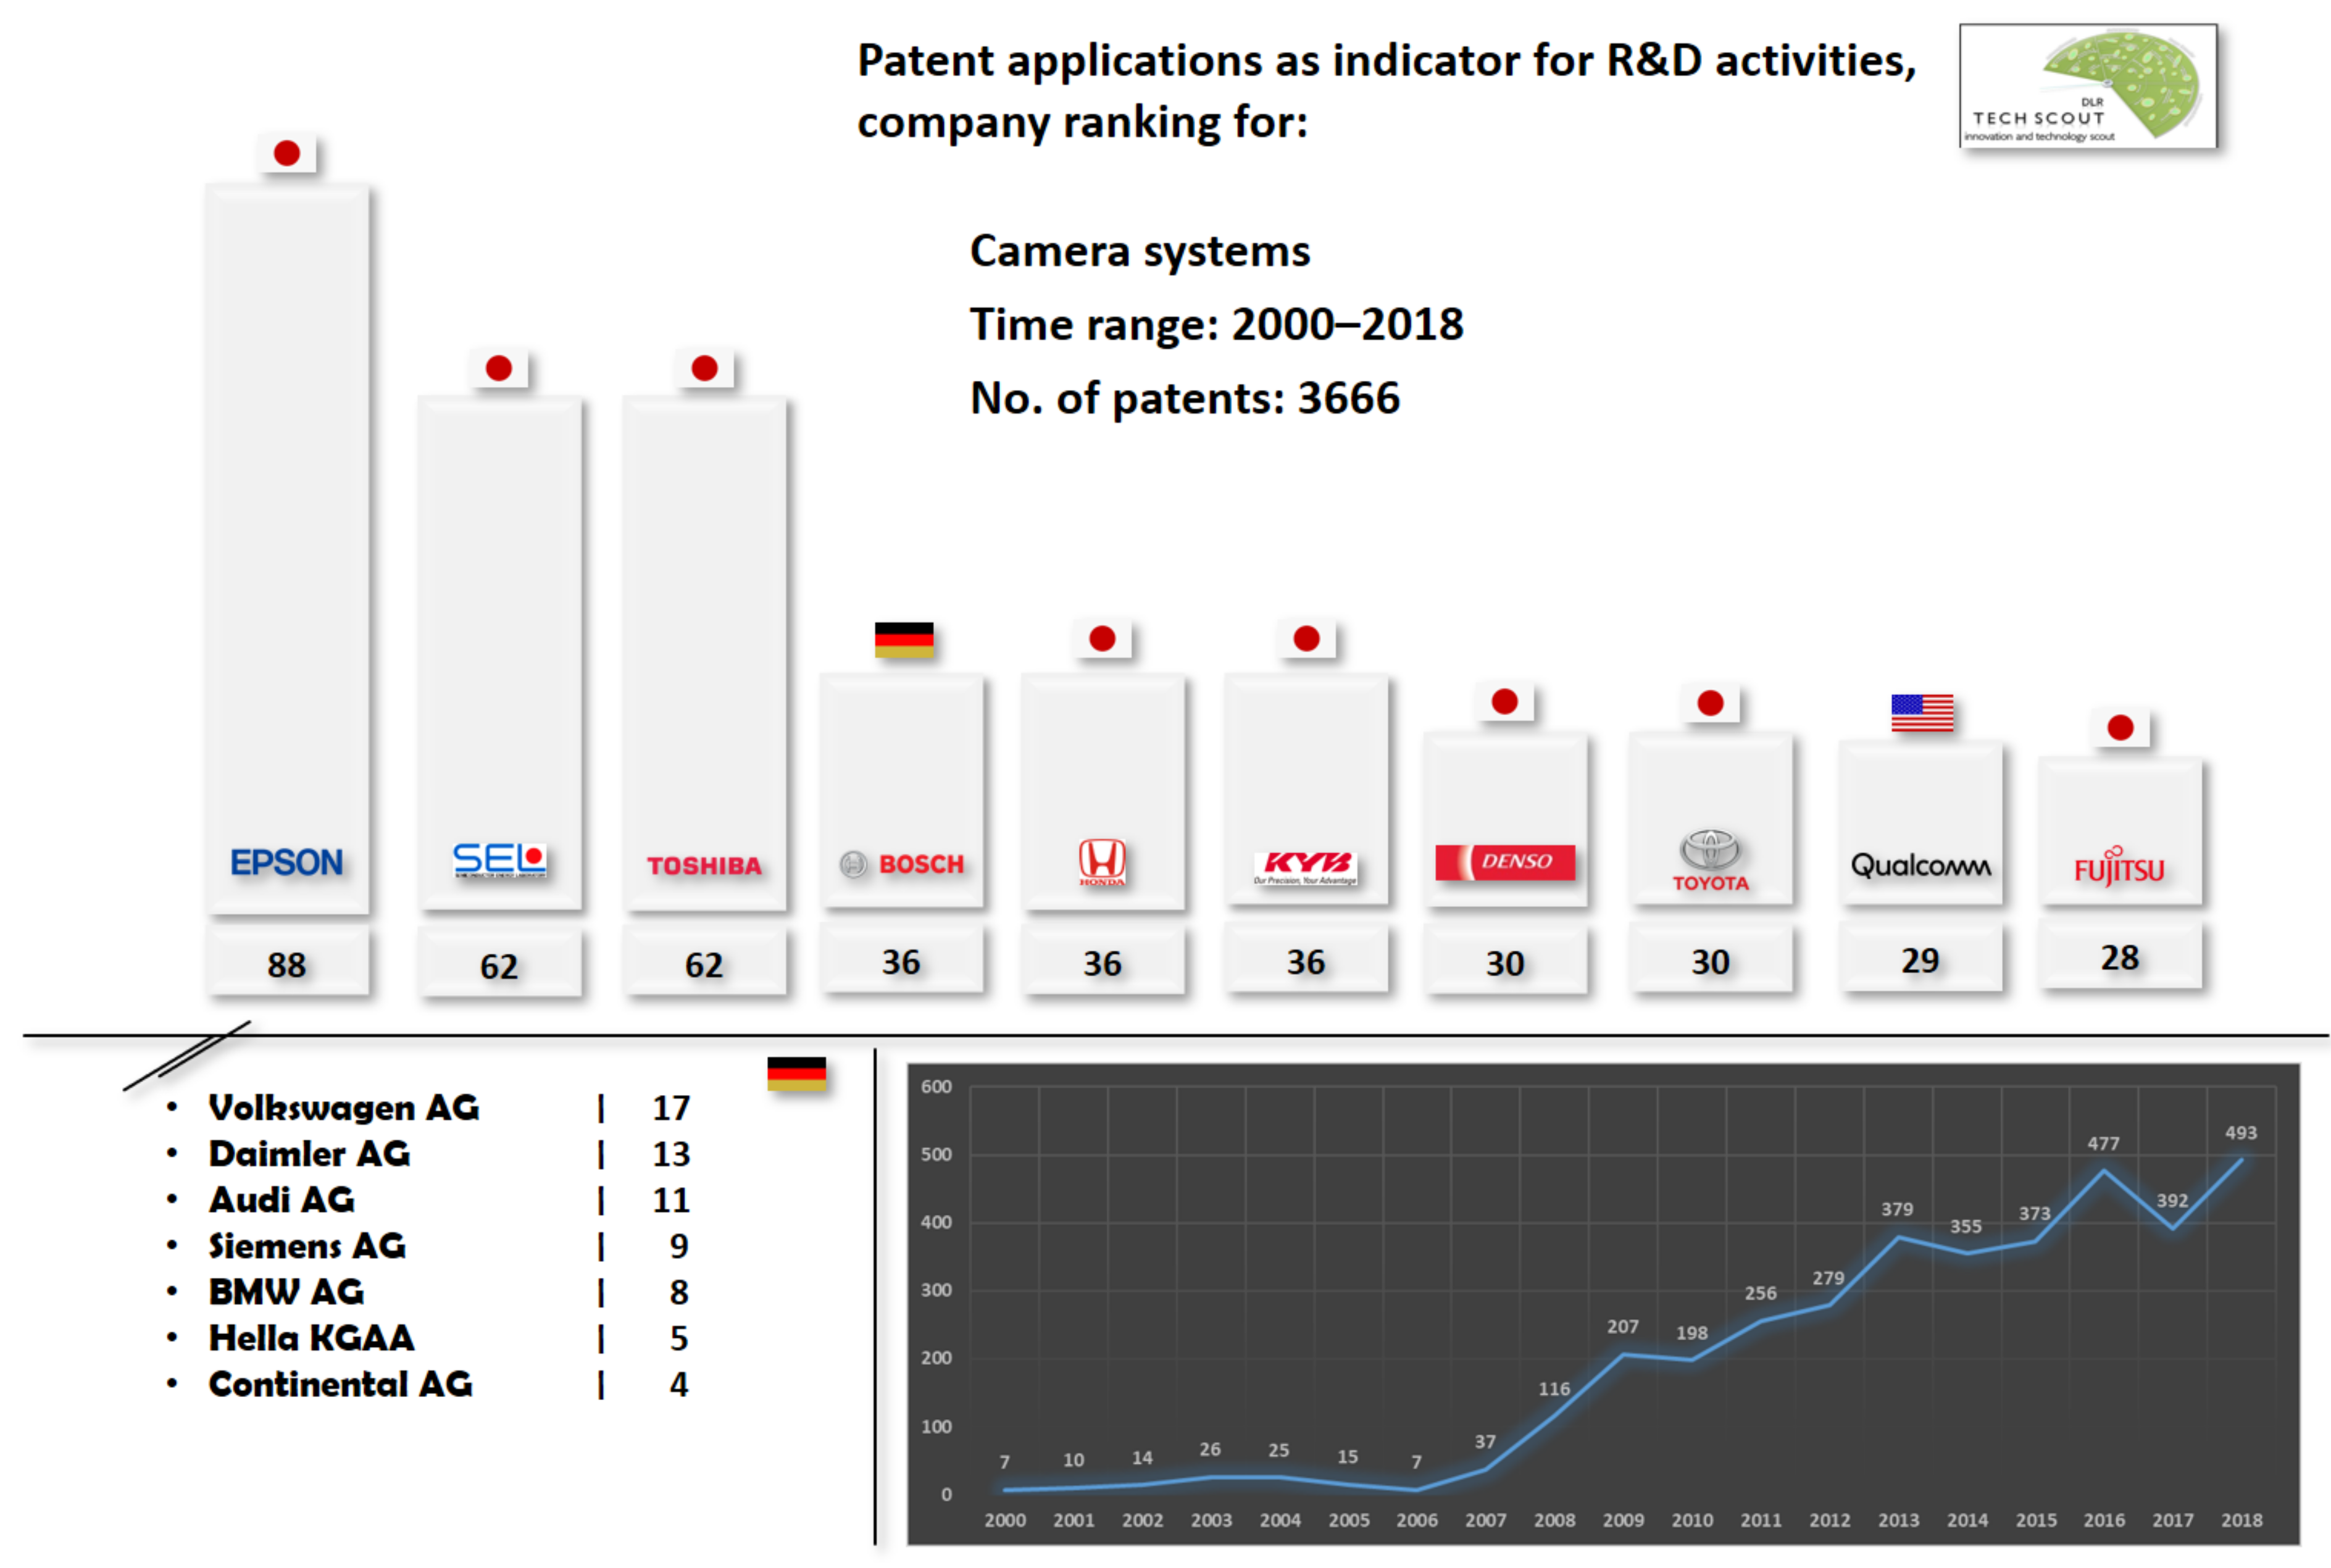
3.2.2. Patent Analyses

To enhance the information on trends in technological developments for SMEs in the respective technology fields of automated driving and their development over time, research and development activities were identified by conducting extensive patent analyses. In the following, the results of these analyses will be exemplarily displayed for the field of “camera systems.” The analysis covered all relevant patents applied globally within the period from 2000 to 2018 and was executed within the database of the European Patent Office (EPO).
As a result, a total of 3666 patents could be identified in this technology field (Figure 8), which were further analyzed in order to identify possible technology options as well as companies particularly driving the development in this technology field. The latter is especially important for small and medium sized enterprises evaluating the expansion of their product portfolios or searching for joint business opportunities with (new) partners.
As a result of the analysis, only Bosch as a German company is represented in the top ten worldwide. Overall, Japanese companies dominate the ranking by number of patents, and only one U.S. supplier, Qualcomm, is part of the ranking. Eight other German companies invest in technology development and are active in this area with patent applications.
Considering the trend in patent applications over time, a strong growth in R&D investment from 2007 onwards can be identified, with a further steady growth from 2010 to 2018. The peak of patents relating to automotive camera systems is reached in the last year of this analysis: 493 applications in 2018. It can be assumed that this trend will continue and even further intensify in the future, supporting the statements of the experts on TRL- and MRL-development in the Delphi survey.
The computational effort for this patent analysis is low when focusing on the interpretation on patent numbers and patent meta information (like date of application, assignee or priority country), on the one hand, and can intensify when analyzing patent content and property rights in detail, on the other hand. For this analysis and with the aim to identify R&D intensities, development trends over time, leading institutions in the respective technology fields as well as to identify technology options, the analysis of meta information is sufficient, and SMEs can cope well with this effort. However, the continuous monitoring of patent applications and especially the interpretation of patent content and property rights requires considerable (manual) effort. Not only are new patents constantly being applied but the relevance of the intellectual property claimed must be validated when individual patents are of special interest to the SME.

3.3. Aggregation of Functional and Technological Roadmaps

As shown in Figure 1, the “development path of automation functions” and the “path of technological development” are now being merged. Both representations are valuable roadmaps on their own. By superimposing the two independent roadmaps in this work, however, the basis for discussion can (1) be improved and validated and (2) provide additional information for valuable discussions between experts.
In Figure 9, all technological developments from the Delphi survey for which MRL 10 has not yet been reached by 2030 or whose future development could not be conclusively assessed are shown for the time horizon 2019 to 2035. The functional roadmap, trimmed to the corresponding time period, adjoins at the bottom: the SAE levels according to their market entry dates from the publication analysis.
Comparing the roadmaps in Figure 9, it is noticeable that some technologies only reach the final maturity levels after the potential introduction of the SAE levels 4 and 5. The technologies’ impact on the functions has to be linked to the automation levels to be able to interpret the results.
The technologies “event-based vision” and “hyperspectral imaging,” which are outlined in red, considerably reduce the computational effort required for environment detection and provide significantly more information about the environment, respectively. Their development can, therefore, be closely linked to the upper SAE levels, especially for SAE level 5.
The technologies surrounded by a yellow dashed line are not yet ready by 2025 or 2030 but are less essential or can be better substituted than the red highlighted ones.
For yet other technologies such as “cooling for high performance computing,” no future development path could be derived in the Delphi survey, but thermal management of computing units in vehicles is of significant importance, nevertheless. This is why technology roadmaps have to be updated regularly.
The compilation does not provide an immediate statement for reaching the market entry dates of the SAE levels; however, after analyzing the correlations between technologies and functions, a full market entry for SAE level 5 in 2030 seems too early.

4. Discussion

This study presented a method to improve the quality of technology forecasts, consisting of two parallel roadmaps: a functional roadmap and a technology roadmap. The output is a comparative roadmap, created by linking the two roadmaps depicting the functional and technological developments. The consolidation of the publication analysis for functional developments and Delphi process for technological developments method enables a deeper insight into the results compared to the use of a single forecasting method.
The functional roadmap presented in this study was created via a publication analysis of 67 sources from 2013 to 2021. Out a total of 209 predictions of automation functions (SAE levels 2–5), the potential market entry dates of individual automation levels were derived. Technology roadmaps were developed in parallel. For this purpose, relevant technologies were first derived considering different automated driving functions: 59 technologies in 15 modules. Using a two-stage Delphi process, a panel of experts was questioned on the technology and manufacturing maturity of these technologies. This process resulted in 15 technology roadmaps, further supported by patent analyses.
The method was applied to the development of technologies and functions for self-driving vehicles. As a result, the functional roadmap indicates that SAE levels 4 and 5 may be introduced in 2025 and 2030, respectively. However, the Delphi analysis of the technologies results in later dates (up to 3–4 years) as some technologies for automation functions may not be mature yet. This creates a valuable source of additional information for better estimating and discussing future technology developments. The method developed is not exclusive to the technology field of automated vehicles but can also be applied to any other technological field. As with any roadmap, the results do not claim that the future will develop exactly as expected but provides a much improved basis for discussion in expert and stakeholder workshops.
In Section 1, the need for a new approach to forecast the development of key functions and technologies for SMEs was derived. The work described in this paper addresses the individual research gaps of existing approaches simultaneously as follows:
(1)
While other works combine different technology forecasting methods for pre- or post-processing [11,19], the approach described in this paper utilizes two different approaches for a functional assessment on the one side and a technological evaluation on the other side. Contrasting the respective findings validates or disproves them. In any case, it creates a sophisticated basis for deep-dive discussions among technology and business experts.
(2)
The authors of [42] demand an easy-to-use and low-effort technology forecasting methodology for SMEs. The methodology proposed in our study does not require complex computing efforts. However, it can still be varied in its complexity: for example, the more experts that are included in the Delphi expert panel, the more time is needed to conduct the survey, thereby improving the reliability of results.
(3)
This method starts from the perspective of functional development and, subsequently, derives technologies that are required for achieving these functions. Thus, a broad range of relevant technologies is evaluated, rather than individual, isolated technologies.
(4)
Some existing research does not focus on the granular temporal development of technologies by year [9,10]. As this is a key insight for strategic planning in companies, the temporal development of the technologies’ maturity levels was evaluated until 2035.
The following section discusses existing limitations of this study and identifies corresponding suggestions for future research.
This study only considers developments for passenger cars, not commercial vehicles; moreover, only hardware, not software or infrastructure technologies, was included. In a next step, these fields should also be considered; especially software, as major developments are expected in this area, and it is essential for the implementation of automation functions. The analysis of technologies for the further development of automated vehicles in terms of vehicle concepts and vehicle structures would be useful, as automated vehicles can be used in other operating concepts and, therefore, have different requirements, including high durability in highly frequent operation (7 × 24). In addition, the high energy consumption of components for automation could be addressed, e.g., via further developments in lightweight construction. Fundamentally different vehicle concepts, like the on-the-road modular vehicle concept U-Shift [60], feature components that are not needed by conventional vehicles. The temporal development of these technologies as well as corresponding production technologies should be investigated in further work applying the method presented in this work to identify further potentials for SMEs.
The relationships between SAE level and technologies need to be further analyzed in future works. A higher granularity in functions, i.e., “congestion assistant” level rather than “SAE level 3” level, may provide a better understanding of developments.
In the case of publication analysis, a higher level of different filtering options promises a deeper understanding of the extent to which different source categories differ in their predictions. At the same time, the data basis needs to be continuously extended and updated.
The expert panel for the Delphi interviews consisted mainly of technology experts. In future work, the panel should be extended to include system and strategy experts in order to obtain a more holistic view of the development of the examined field.
The methodological basis, the combination of Delphi interviews and publication analyses, could be extended in future works, e.g., by S-curve approaches. This way, the aggregated results would benefit from the application of the technology life cycle theory.
Further, it is not sufficient to forecast technology developments only at one point in time. Due to the rapidly changing research findings and surrounding conditions of technologies, current predictions may already be inaccurate after a short amount of time. The findings on technological developments presented in this paper are from 2020; the publication analysis for functional development was updated in 2021. A continuous process is required in which the existing results must be constantly reviewed and new findings incorporated. Measures that can be taken to achieve this include regularly reactivating the Delphi expert panel to update the technology roadmaps.

5. Conclusions

The goal of this study was to develop a methodology for technology forecasting that allows forecasting with increased reliability and yet moderate complexity. In addition, the methodology was to be applied to an example and the results made publicly available to promote knowledge transfer from academia to industry.
The approach combines two roadmaps, one depicting the temporal development of functions based on publication analyses and one focusing on corresponding technologies based on the combination of Delphi survey and patent analyses. Finally, the results are combined in an aggregated roadmap. This aggregation allows us to contrast the results and highlight possible discrepancies. Thus, the quality of forecasts improves and an enhanced basis for expert discussions is provided offering more valuable information than single technology forecasting methods on their own. The approach uses methods that can also be applied by companies who do not have dedicated foresight departments.
The study applied the proposed methodology to automotive automation. The findings of the functional analysis suggest that SAE levels 4 and 5 will be ready for market introduction in 2025 and 20230, respectively. However, the technological analysis indicates that these predictions may be too optimistic.
The methodology must consider the connections between the functions and technologies in more detail to improve its accuracy in the future. Therefore, not only the aggregated SAE automation level should be analyzed but also the functions at a more detailed level. The methodology requires continuous updating of the results, as new publications and patents are published regularly, and experts’ opinions may change due to new (and/or unexpected) developments.
Further research could investigate automatic acquisition of information from publications using big data analysis algorithms. Further, the expert panel should be expanded to include more experts as well as experts from other sectors and technology fields. The counter validation part, which is key to this methodology, could be expanded to include other technology forecasting methods such as patent-based S-curve modeling.

Author Contributions

Conceptualization, C.U.; data curation, C.U.; formal analysis, C.U.; funding acquisition, S.A.S. and H.E.F.; investigation, C.U. and B.F.; methodology, C.U. and B.F.; project administration, C.U.; resources, C.U. and B.F.; software, C.U. and B.F.; supervision, S.A.S.; validation, S.A.S. and H.E.F.; visualization, C.U.; writing—original draft, C.U. and B.F.; writing—review & editing, C.U., B.F., S.A.S. and H.E.F. All authors have read and agreed to the published version of the manuscript.

Funding

The authors gratefully thank the e-mobil BW and the Ministry of Economics, Labor and Housing Baden-Württemberg (Ministerium für Wirtschaft, Arbeit und Wohnungsbau Baden-Württemberg) for partly funding this work within the “TKBW” project (grant number: 3-4332.62-DLR-IFF/16).

Institutional Review Board Statement

Not applicable.

Informed Consent Statement

Not applicable.

Data Availability Statement

Further technology roadmaps are published in Appendix A, while the remaining fact sheets and patent analyses can be accessed via the “TKBW” project homepage (www.tkbw.de, accessed on 19 March 2022), the web app (https://www.transformationswissen-bw.de/technologiekalender-app#/, accessed on 19 March 2022) or the publication database of “Transformationswissen BW” (https://www.transformationswissen-bw.de/wissensspeicher/publikationsdatenbank, accessed on 19 March 2022).

Conflicts of Interest

The authors declare no conflict of interest. The funders had no role in the design of the study; in the collection, analyses, or interpretation of data; in the writing of the manuscript; or in the decision to publish the results.

Appendix A

Table A1. Sources used for the publication analysis [Section 2.1].
SourceCategory
[61]OEM/supplier
[62]OEM/supplier
[63]Academic research
[64]OEM/supplier
[65]Consulting
[66]Consulting
[67]Policy
[68]Policy
[69]OEM/supplier
[70]Academic research
[71]Academic research
[72]Academic research
[73]OEM/supplier
[74]Consulting
[75]OEM/supplier
[76]Industry association
[77]Policy
[78]Policy
[79]Policy
[80]Policy
[81]Policy
[82]Policy
[83]Academic research
[84]Academic research
[85]OEM/supplier
[86]OEM/supplier
[87]OEM/supplier
[88]OEM/supplier
[89]Consulting
[90]Consulting
[91]Academic research
[92]Policy
[93]Consulting
[94]Consulting
[95]Academic research
[96]Academic research
[97]Consulting
[98]Consulting
[99]Consulting
[100]Academic research
[101]Consulting
[102]Policy
[103]Consulting
[104]Consulting
[105]Consulting
[106]Consulting
[107]Policy
[108]OEM/supplier
[109]Industry association
[110]Industry association
[111]OEM/supplier
[112]OEM/supplier
[113]Consulting
[114]OEM/supplier
[115]OEM/supplier
Figure A1. Technology roadmaps for each considered module; I/IV (source: own work visualized with the Python packages Matplotlib [51] and Pandas [52]) [Section 3.2].
Forecasting 04 00027 g0a1
Figure A2. Technology roadmaps for each considered module; II/IV (source: own work visualized with the Python packages Matplotlib [51] and Pandas [52]) [Section 3.2].
Forecasting 04 00027 g0a2
Figure A3. Technology roadmaps for each considered module; III/IV (source: own work visualized with the Python packages Matplotlib [51] and Pandas [52]) [Section 3.2].
Forecasting 04 00027 g0a3
Figure A4. Technology roadmaps for each considered module; IV/IV (source: own work utilizing the Python packages Matplotlib [51] and Pandas [52]) [Section 3.2].
Forecasting 04 00027 g0a4

References

  1. Laube, T. Methodik des Interorganisationalen Technologietransfers: Ein Technologie-Roadmap-Basiertes Verfahren für Kleine und Mittlere Technologieorientierte Unternehmen; University of Stuttgart: Stuttgart, Germany, 2009. [Google Scholar]
  2. Wildemann, H. Wissensmanagement und Unternehmenserfolg: Erfolgspotentiale, Einführungsstrategien und Organisation des Wissensmanagements. In Wissensmanagement in Produktion und Umweltschutz; Haasis, H.-D., Kriwald, T., Eds.; Springer: Berlin/Heidelberg, Germany, 2001; pp. 21–44. ISBN 978-3-642-63171-9. [Google Scholar]
  3. Woisetschläger, D.M. Consumer Perceptions of Automated Driving Technologies: An Examination of Use Cases and Branding Strategies. In Autonomous Driving; Maurer, M., Gerdes, J.C., Lenz, B., Winner, H., Eds.; Springer: Berlin/Heidelberg, Germany, 2016; pp. 687–706. ISBN 978-3-662-48847-8. [Google Scholar]
  4. Meyer, G.; Deix, S. Research and Innovation for Automated Driving in Germany and Europe. In Road Vehicle Automation: Based on an Expert Workshop Organized by the Transportation Research Board; Meyer, G., Beiker, S., Eds.; Springer: Cham, Switzerland, 2014; pp. 71–81. ISBN 978-3-319-05989-1. [Google Scholar]
  5. Gordon, T.J.; Lidberg, M. Automated driving and autonomous functions on road vehicles. Veh. Syst. Dyn. 2015, 53, 958–994. [Google Scholar] [CrossRef] [Green Version]
  6. Calleja-Sanz, G.; Olivella-Nadal, J.; Solé-Parellada, F. Technology Forecasting: Recent Trends and New Methods. In Research Methodology in Management and Industrial Engineering; Machado, C., Davim, J.P., Eds.; Springer International Publishing: Cham, Switzerland, 2020; pp. 45–69. ISBN 978-3-030-40895-4. [Google Scholar]
  7. Roper, A.T.; Cunningham, S.W.; Porter, A.L.; Mason, T.W.; Rossini, F.A.; Banks, J. Forecasting and Management of Technology, 2nd ed.; John Wiley & Sons: Hoboken, NJ, USA, 2011; ISBN 9780470440902. [Google Scholar]
  8. Firat, A.K.; Woon, W.L.; Madnick, S. Technological Forecasting—A Review; Composite Information Systems Laboratory (CISL), Massachusetts Institute of Technology (MIT): Cambridge, MA, USA, 2008; (CISL# 2008-15); Available online: http://web.mit.edu/smadnick/www/wp/2008-15.pdf (accessed on 28 March 2022).
  9. Ji, Y.; Zhu, X.; Zhao, T.; Wu, L.; Sun, M. Revealing Technology Innovation, Competition and Cooperation of Self-Driving Vehicles from Patent Perspective. IEEE Access 2020, 8, 221191–221202. [Google Scholar] [CrossRef]
  10. Li, Y.; Zhou, Y.; Ma, X.; Zhang, Y. Forecasting the Development of Self-Driving Technology in China by Multidimensional Information. J. Adv. Transp. 2021, 2021, 1693459. [Google Scholar] [CrossRef]
  11. Gao, L.; Porter, A.L.; Wang, J.; Fang, S.; Zhang, X.; Ma, T.; Wang, W.; Huang, L. Technology life cycle analysis method based on patent documents. Technol. Forecast. Soc. Chang. 2013, 80, 398–407. [Google Scholar] [CrossRef]
  12. Jung, S.; Kandadi, R.R.; Datta, R.; Benton, R.; Segev, A. Identification of Technology-Relevant Entities Based on Trend Curves. In Proceedings of the 9th International Conference on Information Technology Convergence and Services (ITCSE 2020), Vancouver, BC, Canada, 30–31 May 2020; AIRCC Publishing Corporation: Vancouver, BC, Canada, 2020; pp. 1–13. [Google Scholar]
  13. Wang, L.; Jiang, S.; Zhang, S. Mapping technological trajectories and exploring knowledge sources: A case study of 3D printing technologies. Technol. Forecast. Soc. Chang. 2020, 161, 120251. [Google Scholar] [CrossRef]
  14. Zhou, Y.; Dong, F.; Liu, Y.; Li, Z.; Du, J.; Zhang, L. Forecasting emerging technologies using data augmentation and deep learning. Scientometrics 2020, 123, 1–29. [Google Scholar] [CrossRef] [Green Version]
  15. Daim, T.; Lai, K.K.; Yalcin, H.; Alsoubie, F.; Kumar, V. Forecasting technological positioning through technology knowledge redundancy: Patent citation analysis of IoT, cybersecurity, and Blockchain. Technol. Forecast. Soc. Chang. 2020, 161, 120329. [Google Scholar] [CrossRef]
  16. Daim, T.U.; Rueda, G.; Martin, H.; Gerdsri, P. Forecasting emerging technologies: Use of bibliometrics and patent analysis. Technol. Forecast. Soc. Chang. 2006, 73, 981–1012. [Google Scholar] [CrossRef]
  17. Ranaei, S.; Karvonen, M.; Suominen, A.; Kässi, T. Patent-based technology forecasting: Case of electric and hydrogen vehicle. Int. J. Energy Technol. Policy 2016, 12, 20–40. [Google Scholar] [CrossRef]
  18. Kayser, V. Extending the Knowledge Base of Foresight: The Contribution of Text Mining. Master’s Thesis, Technische Universität Berlin, Berlin, Germany, 2016. [Google Scholar]
  19. Li, S.; Garces, E.; Daim, T. Technology forecasting by analogy-based on social network analysis: The case of autonomous vehicles. Technol. Forecast. Soc. Chang. 2019, 148, 119731. [Google Scholar] [CrossRef]
  20. Csizmazia, R.A. Identifying Automotive Industry Trends: Data Mining from Intellectual Property Databases. J. Bus. Manag. Stud. 2021, 3, 120–124. [Google Scholar] [CrossRef]
  21. Jun, S.-P.; Sung, T.-E.; Park, H.-W. Forecasting by analogy using the web search traffic. Technol. Forecast. Soc. Chang. 2017, 115, 37–51. [Google Scholar] [CrossRef] [Green Version]
  22. Rowe, G.; Wright, G. The Delphi technique as a forecasting tool: Issues and analysis. Int. J. Forecast. 1999, 15, 353–375. [Google Scholar] [CrossRef]
  23. Merfeld, K.; Wilhelms, M.-P.; Henkel, S.; Kreutzer, K. Carsharing with shared autonomous vehicles: Uncovering drivers, barriers and future developments—A four-stage Delphi study. Technol. Forecast. Soc. Chang. 2019, 144, 66–81. [Google Scholar] [CrossRef]
  24. Förster, B. Technology foresight for sustainable production in the German automotive supplier industry. Technol. Forecast. Soc. Chang. 2015, 92, 237–248. [Google Scholar] [CrossRef]
  25. Park, S.Y.; Kim, J.W.; Lee, D.H. Development of a market penetration forecasting model for Hydrogen Fuel Cell Vehicles considering infrastructure and cost reduction effects. Energy Policy 2011, 39, 3307–3315. [Google Scholar] [CrossRef]
  26. Propfe, B.; Kreyenberg, D.; Wind, J.; Schmid, S. Market penetration analysis of electric vehicles in the German passenger car market towards 2030. Int. J. Hydrogen Energy 2013, 38, 5201–5208. [Google Scholar] [CrossRef]
  27. Ehrenberger, S.; Seum, S.; Pregger, T.; Simon, S.; Knitschky, G.; Kugler, U. Land transport development in three integrated scenarios for Germany—Technology options, energy demand and emissions. Transp. Res. Part D Transp. Environ. 2021, 90, 102669. [Google Scholar] [CrossRef]
  28. Lavasani, M.; Jin, X.; Du, Y. Market Penetration Model for Autonomous Vehicles on the Basis of Earlier Technology Adoption Experience. Transp. Res. Rec. 2016, 2597, 67–74. [Google Scholar] [CrossRef]
  29. Yole Développement. The Automotive LiDAR Market. 2018. Available online: http://www.woodsidecap.com/wp-content/uploads/2018/04/Yole_WCP-LiDAR-Report_April-2018-FINAL.pdf (accessed on 19 March 2022).
  30. Milakis, D.; Snelder, M.; van Arem, B.; van Wee, B.; Correia, H.d.A.G. Development and transport implications of automated vehicles in The Netherlands: Scenarios for 2030 and 2050. Eur. J. Transp. Infrastruct. Res. 2017, 17, 63–98. [Google Scholar] [CrossRef]
  31. Halicka, K. Main Concepts of Technology Analysis in the Light of the Literature on the Subject. Procedia Eng. 2017, 182, 291–298. [Google Scholar] [CrossRef]
  32. Technologie-Roadmapping; Möhrle, M.G.; Isenmann, R. (Eds.) Springer: Berlin/Heidelberg, Germany, 2017; ISBN 978-3-662-52709-2. [Google Scholar]
  33. Abele, T. Verfahren für das Technologie-Roadmapping zur Unterstützung des Strategischen Technologiemanagements; Jost-Jetter: Heimsheim, Germany, 2006; ISBN 978-3-936947-94-6. [Google Scholar]
  34. Huang, L.; Zhang, Y.; Guo, Y.; Zhu, D.; Porter, A.L. Four dimensional Science and Technology planning: A new approach based on bibliometrics and technology roadmapping. Technol. Forecast. Soc. Chang. 2014, 81, 39–48. [Google Scholar] [CrossRef]
  35. Martin, H.; Daim, T.U. Technology roadmap development process (TRDP) for the service sector: A conceptual framework. Technol. Soc. 2012, 34, 94–105. [Google Scholar] [CrossRef]
  36. Phaal, R.; Farrukh, C.J.; Probert, D.R. Technology roadmapping—A planning framework for evolution and revolution. Technol. Forecast. Soc. Chang. 2004, 71, 5–26. [Google Scholar] [CrossRef]
  37. Gandomi, A.; Haider, M. Beyond the hype: Big data concepts, methods, and analytics. Int. J. Inf. Manag. 2015, 35, 137–144. [Google Scholar] [CrossRef] [Green Version]
  38. Thai, M.T.; Wu, W.; Xiong, H. Big Data in Complex and Social Networks; CRC Press: New York, NY, USA, 2017; ISBN 9781315396699. [Google Scholar]
  39. Michard, F.; Teboul, J.L. Predictive analytics: Beyond the buzz. Ann. Intensive Care 2019, 9, 46. [Google Scholar] [CrossRef]
  40. Sivarajah, U.; Kamal, M.M.; Irani, Z.; Weerakkody, V. Critical analysis of Big Data challenges and analytical methods. J. Bus. Res. 2017, 70, 263–286. [Google Scholar] [CrossRef] [Green Version]
  41. Najafabadi, M.M.; Villanustre, F.; Khoshgoftaar, T.M.; Seliya, N.; Wald, R.; Muharemagic, E. Deep learning applications and challenges in big data analytics. J. Big Data 2015, 2, 1. [Google Scholar] [CrossRef] [Green Version]
  42. Coates, V.; Farooque, M.; Klavans, R.; Lapid, K.; Linstone, H.A.; Pistorius, C.; Porter, A.L. On the Future of Technological Forecasting. Technol. Forecast. Soc. Chang. 2001, 67, 1–17. [Google Scholar] [CrossRef]
  43. NASA. Technology Readiness Level Definitions. 2010. Available online: https://www.nasa.gov/pdf/458490main_TRL_Definitions.pdf (accessed on 23 December 2020).
  44. Williamson, R.; Beasley, J. Automotive Technology and Manufacturing Readiness Levels. 2011. Available online: https://www.smmt.co.uk/wp-content/uploads/sites/2/Automotive-Technology-and-Manufacturing-Readiness-Levels.pdf (accessed on 28 March 2022).
  45. Ulrich, C.; Frieske, B.; Bickel, P.; Marthaler, F.; Stieler, S.; Schmid, S.; Ott, S. Analysis and Presentation of the Development Status of Vehicle Technologies for Electrification and Automation by Creating a Technology Calendar. In Proceedings of the 21th Internationales Stuttgarter Symposium; Bargende, M., Reuss, H.-C., Wagner, A., Eds.; Springer Fachmedien Wiesbaden: Wiesbaden, Germany, 2021; pp. 321–332. ISBN 978-3-658-33465-9. [Google Scholar]
  46. Ammon, U. Delphi-Befragung. In Handbuch Methoden der Organisationsforschung; Kühl, S., Strodtholz, P., Taffertshofer, A., Eds.; VS Verlag für Sozialwissenschaften: Wiesbaden, Germany, 2009; pp. 458–476. ISBN 978-3-531-15827-3. [Google Scholar]
  47. VDI. VDI 3780: Technikbewertung Begriffe und Grundlagen; Verein Deutscher Ingenieure: Düsseldorf, Germany, 2000. [Google Scholar]
  48. Hasson, F.; Keeney, S.; McKenna, H. Research guidelines for the Delphi survey technique. J. Adv. Nurs. 2000, 32, 1008–1015. [Google Scholar] [CrossRef] [Green Version]
  49. Hsu, C.-C.; Sandford, B.A. Minimizing Non-Response in The Delphi Process: How to Respond to Non-Response. Pract. Assess. Res. Eval. 2007, 12, 17. [Google Scholar] [CrossRef]
  50. Waskom, M. seaborn: Statistical data visualization. J. Open Source Softw. 2021, 6, 3021. [Google Scholar] [CrossRef]
  51. Hunter, J.D. Matplotlib: A 2D Graphics Environment. Comput. Sci. Eng. 2007, 9, 90–95. [Google Scholar] [CrossRef]
  52. McKinney, W. Data Structures for Statistical Computing in Python: Pandas. In Proceedings of the 9th Python in Science Conference, Austin, TX, USA, 28 June–3 July 2010; 2010; pp. 56–61. [Google Scholar]
  53. Ulrich, C.; Frieske, B.; Schmid, S.; Stieler, S.; Schwarz-Kocher, M.; Marthaler, F.; Ott, S.; Reinemann, J.; Bickel, P.; Schwarz, S.; et al. Technologiekalender Strukturwandel Automobil Baden-Württemberg (TKBW)—Technologiesteckbriefe. 2020. Available online: www.tkbw.de (accessed on 12 January 2021).
  54. Croucher, D. Camera Comparison: Prime 95B Scientific CMOS and EMCCD. 2017. Available online: https://www.photometrics.com/resources/technotes/pdfs/CameraComparison-Prime95B-sCMOS-and-EMCCD-TechNote.pdf (accessed on 24 August 2019).
  55. Wallace, J. Photonics Products: Scientific CMOS Cameras: sCMOS Cameras Reach New Levels of Capability. 2018. Available online: https://www.laserfocusworld.com/detectors-imaging/article/16555375/photonics-products-scientific-cmos-cameras-scmos-cameras-reach-new-levels-of-capability (accessed on 24 March 2022).
  56. Winkens, C.; Sattler, F.; Paulus, D. Hyperspectral Terrain Classification for Ground Vehicles. In Proceedings of the 12th International Joint Conference on Computer Vision, Imaging and Computer Graphics Theory and Applications; SCITEPRESS—Science and Technology Publications: Porto, Portugal, 2017; pp. 417–424. ISBN 978-989-758-226-4. [Google Scholar]
  57. Pinchon, N.; Cassignol, O.; Nicolas, A.; Bernardin, F.; Leduc, P.; Tarel, J.-P.; Brémond, R.; Bercier, E.; Brunet, J. All-Weather Vision for Automotive Safety: Which Spectral Band? In Advanced Microsystems for Automotive Applications 2018; Dubbert, J., Müller, B., Meyer, G., Eds.; Springer International Publishing: Cham, Switzerland, 2019; pp. 3–15. ISBN 978-3-319-99762-9. [Google Scholar]
  58. Takumi, K.; Watanabe, K.; Ha, Q.; Tejero-De-Pablos, A.; Ushiku, Y.; Harada, T. Multispectral Object Detection for Autonomous Vehicles. In Proceedings of the on Thematic Workshops of ACM Multimedia 2017—Thematic Workshops ’17, Mountain View, CA, USA, 23–27 October 2017; ACM Press: Mountain View, CA, USA, 2017; pp. 35–43. ISBN 978-1-4503-5416-5. [Google Scholar]
  59. Ulrich, C.; Frieske, B.; Schmid, S.; Stieler, S.; Schwarz-Kocher, M.; Marthaler, F.; Ott, S.; Reinemann, J.; Bickel, P.; Schwarz, S.; et al. Technologiekalender Strukturwandel Automobil Baden-Württemberg (TKBW)—Modulkatalog. 2020. Available online: www.tkbw.de (accessed on 11 January 2021).
  60. Münster, M.; Brost, M.; Siefkes, T.; Kopp, G.; Beeh, E.; Rinderknecht, F.; Schmid, S.; Osebek, M.; Scheibe, S.; Hahn, R.; et al. U-Shift II Vision and Project Goals. In 22. Internationales Stuttgarter Symposium: Automobil- und Motorentechnik, 1st ed.; Bargende, M., Reuss, H.-C., Wagner, A., Eds.; Springer Fachmedien Wiesbaden; Imprint Springer Vieweg: Wiesbaden, Germany, 2022; pp. 18–31. ISBN 978-3-658-37010-7. [Google Scholar]
  61. Chan, C.-Y. Advancements, prospects, and impacts of automated driving systems. Int. J. Transp. Sci. Technol. 2017, 6, 208–216. [Google Scholar] [CrossRef]
  62. Business Insider Deutschland. Artemis: Audi Gibt Einen Einblick in das Geheimprojekt um den A8-Nachfolger. 2021. Available online: https://www.businessinsider.de/wirtschaft/artemis-audi-gibt-einblick-in-das-geheimprojekt-um-den-a8-nachfolger-b/ (accessed on 9 September 2021).
  63. Boghani, H.; Papazikou, E.; Zwart, R.; Roussou, J.; Hu, B.; Filtness, A.; Papadoulis, A. Defining the Future of Passenger Car Transport: Deliverable D6.1 of the H2020 Project LEVITATE. 2019. Available online: https://levitate-project.eu/wp-content/uploads/2019/11/D6.1-Defining-the-future-of-passenger-car-transport.pdf (accessed on 9 September 2021).
  64. Crowe, S. AutoX Opens Robotaxi Service to Public in Shenzhen. 2021. Available online: https://www.therobotreport.com/autox-shenzhen-robotaxi-service-opens-to-public/ (accessed on 9 September 2021).
  65. Boston Consulting Group. Back to the Future: The Road to Autonomous Driving. 2015. Available online: https://de.slideshare.net/TheBostonConsultingGroup/the-road-to-autonomous-driving (accessed on 9 September 2021).
  66. Boston Consulting Group. Mobility. Available online: https://www.bcg.com/de-de/industries/public-sector/mobility (accessed on 9 April 2021).
  67. BMVI. Gesetz zum Autonomen Fahren Tritt in Kraft. Available online: https://www.bmvi.de/SharedDocs/DE/Artikel/DG/gesetz-zum-autonomen-fahren.html (accessed on 9 September 2021).
  68. BMVit. AustrianResearch, Development & Innovation Roadmap for Automated Vehicles. 2016. Available online: https://www.ffg.at/sites/default/files/downloads/call/austrian_roadmap_automated_vehicles.pdf (accessed on 9 September 2021).
  69. BMW. Autonomes Fahren. Available online: https://www.bmwgroup.com/de/innovation/technologie-und-mobilitaet/autonomes-fahren.html (accessed on 9 September 2021).
  70. CEDR. MANTRA. 2017. Available online: https://www.cedr.eu/download/D2.1-Vehicle-fleet-penetrations-and-ODD-coverage.pdf (accessed on 9 September 2021).
  71. Center for Automotive Research. Technology Roadmap: Intelligent Mobility Technologies. 2019. Available online: https://www.cargroup.org/wp-content/uploads/2019/09/Technology-Roadmap-White-Paper.pdf (accessed on 9 September 2021).
  72. Clavert, S.C.; Wilmink, I.R.; Soekroella, A.M.; van Arem, B. Considering knowledge gaps for automated driving in conventional traffic. In Proceedings of the Fourth International Conference on Advances in Civil, Structural and Environmental Engineering—ACSEE 2016; Institute of Research Engineers and Doctors: Rome, Italy, 2016; pp. 102–111. ISBN 978-1-63248-114-6. [Google Scholar]
  73. Daimler. Hochautomatisiertes Fahren: Die S-Klasse Fährt Voran. Available online: https://media.daimler.com/marsMediaSite/de/instance/ko/Hochautomatisiertes-Fahren-Die-S-Klasse-faehrt-voran.xhtml?oid=47164442 (accessed on 9 September 2021).
  74. Deloitte. Urbane Mobilität und Autonomes Fahren im Jahr 2035. 2019. Available online: https://www2.deloitte.com/de/de/pages/trends/urbane-mobilitaet-autonomes-fahren-2035.html (accessed on 13 October 2020).
  75. e.Go. e.GO Mover Erhält Straßenzulassung. 2021. Available online: https://mediacenter.e-go-mobile.com/de/newspool/pressemitteilung-e.go-mover-erhaelt-strassenzulassung/ (accessed on 9 September 2021).
  76. EPoSS. European Roadmap Smart Systems for Automated Driving. 2015. Available online: http://www.a3ps.at/site/sites/default/files/newsletter/2015/no08/EPOSS.pdf (accessed on 9 September 2021).
  77. ERTRAC. Automated Driving Roadmap. 2015. Available online: https://www.ertrac.org/uploads/documentsearch/id38/ERTRAC_Automated-Driving-2015.pdf (accessed on 9 September 2021).
  78. ERTRAC. Automated Driving Roadmap. 2017. Available online: https://www.ertrac.org/uploads/images/ERTRAC_Automated_Driving_2017.pdf (accessed on 9 September 2021).
  79. ERTRAC. Connected Automated Driving Roadmap, Brussels. 2019. Available online: https://www.ertrac.org/uploads/documentsearch/id57/ERTRAC-CAD-Roadmap-2019.pdf (accessed on 16 July 2019).
  80. Europäisches Parlament. Automated Vehicles in the EU. 2016. Available online: https://www.europarl.europa.eu/RegData/etudes/BRIE/2016/573902/EPRS_BRI(2016)573902_EN.pdf (accessed on 9 September 2021).
  81. Europäische Kommission. The Future of Road Transport: Implications of Automated, Connected, Low-Carbon and Shared Mobility; Publications Office of the European Union: Luxembourg, 2019; ISBN 9789276143185. [Google Scholar]
  82. Finnish Transport Agency. Road Transport Automation Road Map and Action Plan 2016–2020. 2016. Available online: https://julkaisut.vayla.fi/pdf8/lts_2016-19eng_road_transport_web.pdf (accessed on 9 September 2021).
  83. Krail, M.; Hellekes, J.; Schneider, U.; Dütschke, E.; Schellert, M.; Rüdiger, D.; Steindl, A.; Luchmann, I.; Waßmuth, V.; Flämig, H.; et al. Energie- und Treibhausgaswirkungen des Automatisierten und Vernetzten Fahrens im Straßenverkehr; Fraunhofer-Institut für System- und Innovationsforschung (ISI): Karlsruhe, Germany, 2019. [Google Scholar]
  84. Lalli, M. Autonomes Fahren und die Zukunft der Mobilität; Springer: Berlin/Heidelberg, Germany, 2020; ISBN 978-3-662-61811-0. [Google Scholar]
  85. Wayland, M. Cruise Expects GM to Begin Production of New Driverless Vehicle in Early 2023. 2021. Available online: https://www.cnbc.com/2021/05/13/gm-to-begin-production-of-new-driverless-cruise-vehicle-in-early-2023.html (accessed on 9 September 2021).
  86. Honda. Automated Drive. Available online: https://global.honda/innovation/automated-drive/detail.html (accessed on 9 September 2021).
  87. Honda. Honda to Begin Sales of Legend with New Honda SENSING Elite. Available online: https://global.honda/newsroom/news/2021/4210304eng-legend.html (accessed on 9 September 2021).
  88. Hyundai. Autonomous. Available online: https://tech.hyundaimotorgroup.com/mobility-device/autonomous/ (accessed on 9 September 2021).
  89. IDTechEx. Autonome Autos, Robotaxis & Sensoren 2022–2042. 2021. Available online: https://www.idtechex.com/de/research-report/autonomous-cars-robotaxis-and-sensors-2022-2042/832 (accessed on 9 September 2021).
  90. IHS Markit. Emerging Technologies. 2014. Available online: https://autotechinsight.ihsmarkit.com/_assets/sampledownloads/auto-tech-report-emerging-tech-autonomous-car-2013-sample_1404310053.pdf (accessed on 9 September 2021).
  91. Institute for Mobility Research. Autonomous Driving: The Impact of Vehicle Automation on Mobility Behaviour. 2016. Available online: https://www.bmwgroup.com/content/dam/grpw/websites/bmwgroup_com/company/downloads/de/2016/2016-BMW-Group-IFMO-Publikation-Dezember.pdf (accessed on 19 March 2022).
  92. Japan Automobile Manufacturers Association. On the Road to Automated Driving: A JAMA Overview of the Advances Made So Far and the Further Progress Required to Make Automated Driving a Reality. 2016. Available online: http://www.jama-english.jp/publications/On_the_road_to_automated_driving.pdf (accessed on 9 September 2021).
  93. KPMG International. Autonomous Vehicles Readiness Index. 2020. Available online: https://assets.kpmg/content/dam/kpmg/uk/pdf/2020/07/2020-autonomous-vehicles-readiness-index.pdf (accessed on 19 March 2022).
  94. KPMG. Connected and Autonomous Vehicles—The UK Economic Opportunity. 2015. Available online: https://assets.kpmg/content/dam/kpmg/images/2015/05/connected-and-autonomous-vehicles.pdf (accessed on 9 September 2021).
  95. Levinson, D. Climbing Mount Next: The Effects of Autonomous Vehicles on Society. 2015. Available online: https://conservancy.umn.edu/bitstream/handle/11299/172960/6%20MJLST_v162_Levinson_787-810.pdf?sequence=1&isAllowed=y (accessed on 9 September 2021).
  96. Litman, T. Autonomous Vehicle Implementation Predictions: Implications for Transport Planning. 2021. Available online: https://www.vtpi.org/avip.pdf (accessed on 9 September 2021).
  97. McKinsey & Company. How China Will Help Fuel the Revolution in Autonomous Vehicles. Available online: https://www.mckinsey.com/industries/automotive-and-assembly/our-insights/how-china-will-help-fuel-the-revolution-in-autonomous-vehicles (accessed on 9 September 2021).
  98. McKinsey & Company. Private Autonomous Vehicles: The Other Side of the Robo-Taxi Story. Available online: https://www.mckinsey.com/industries/automotive-and-assembly/our-insights/private-autonomous-vehicles-the-other-side-of-the-robo-taxi-story (accessed on 9 September 2021).
  99. McKinsey & Company. Autonomous Driving. Available online: https://www.mckinsey.com/features/mckinsey-center-for-future-mobility/overview/autonomous-driving (accessed on 9 September 2021).
  100. Roos, M.; Siegmann, M. Technologie-Roadmap für das Autonome Autofahren: Eine Wettbewerbsorientierte Technik- und Marktstudie für Deutschland. 2020. Available online: https://www.econstor.eu/bitstream/10419/222428/1/1724770225.pdf (accessed on 9 September 2021).
  101. Morgan Stanley. Autonomous Cars: Self-Driving the New Auto Industry Paradigm. 2013. Available online: https://studylib.net/doc/8717560/autonomous-cars--self-driving-the-new-auto-industry-paradigm (accessed on 9 September 2021).
  102. NHTSA. Human Factors Evaluation of Level 2 And Level 3 Automated Driving Concepts. 2014. Available online: https://www.nhtsa.gov/sites/nhtsa.gov/files/812043_hf-evaluationlevel2andlevel3automateddrivingconceptsv2.pdf (accessed on 9 September 2021).
  103. Wyman, O. The True Value of Autonomous Driving. 2015. Available online: https://www.oliverwyman.de/content/dam/oliver-wyman/global/en/2015/jul/Oliver-Wyman-6-11-Automotive-Manager-2015-Autonomous-Driving.pdf (accessed on 9 September 2021).
  104. Ptolemus. The Autonomous Vehicle Global Study. Available online: https://www.ptolemus.com/research/theautonomousvehicleglobalstudy2017/ (accessed on 9 September 2021).
  105. PWC. Digital Auto Report. Available online: https://www.strategyand.pwc.com/de/en/industries/automotive/digital-auto-report.html (accessed on 9 September 2021).
  106. Bernhart, W.; Ernst, C.-S. Israels Automotive & Smart Mobility Industry. 2018. Available online: https://www.rolandberger.com/en/Insights/Publications/Israel%27s-automotive-smart-mobility-industry.html (accessed on 9 September 2021).
  107. Sächsisches Staatsministerium für Wirtschaft, Arbeit und Verkehr. Auswirkung der Einführung des Autonomen Fahrens auf die Beschäftigung im Öffentlichen Personennahverkehr. 2021. Available online: https://publikationen.sachsen.de/bdb/artikel/37871/documents/58458 (accessed on 9 September 2021).
  108. Toyota. Toyota Automated Driving. 2020. Available online: https://automatedtoyota.com/docs/10/1a0b46b2c789165fdf296ad6d74e796f2b57837f9/ATwhitepaper.pdf (accessed on 9 September 2021).
  109. VDA. Automation: From Driver Assistance Systems to Automated Driving; Verband der Automobilindustrie e. V.: Berlin, Germany, 2015. [Google Scholar]
  110. VDA. Automatisiertes Fahren. Available online: https://www.vda.de/de/themen/innovation-und-technik/automatisiertes-fahren/automatisiertes-fahren.html (accessed on 9 September 2021).
  111. Volkswagen AG. Volkswagen Nutzfahrzeuge Treibt Die Entwicklung Autonomer Systeme für Mobility as a Service Voran. Available online: https://www.volkswagenag.com/de/news/2021/02/volkswagen-commercial-vehicles-moves-ahead-with-autonomous-drivi.html (accessed on 9 September 2021).
  112. Waymo. FAQ. Available online: https://waymo.com/faq/ (accessed on 9 September 2021).
  113. Yole Développement. Sensors and Data Management for Autonomous Vehicles. 2015. Available online: https://yole-i-micronews-com.osu.eu-west-2.outscale.com/uploads/2019/03/Yole_Sensors_and_Data_Management_for_Autonomous_Vehicles_October_2015_Sample.pdf (accessed on 23 August 2019).
  114. ZF-Friedrichshafen AG. Magazin. Available online: https://www.zf.com/corporate/de_de/magazine/magazin_artikel_viewpage_22123624.html (accessed on 9 September 2021).
  115. ZF-Friedrichshafen AG. In Fünf Schritten zum Selbstfahrenden Auto. Available online: https://www.zf.com/mobile/de/stories_2497.html (accessed on 9 September 2021).
Figure 1. Methodology developed for this work (source: own depiction).
Forecasting 04 00027 g001
Figure 2. Statistics on the analyzed publication (source: own depiction).
Forecasting 04 00027 g002
Figure 3. Process to identify the most qualified experts; for example, searching for the term “lidar AND (automotive OR automobile)” in the platforms Web of Science, Scopus and IEEE Xplore (source: own compilation with screenshots from the respective websites).
Forecasting 04 00027 g003
Figure 4. Statistics on the experts interviewed for the two-stage Delphi survey (source: own depiction).
Forecasting 04 00027 g004
Figure 5. Publication analysis on market introduction dates of different SAE automation levels; basic visualization using all publications and all publication dates (source: own work utilizing the Python packages Seaborn [50], Matplotlib [51] and Pandas [52]).
Forecasting 04 00027 g005
Figure 6. Publication analysis on market introduction dates of different SAE automation levels; filtering on publication dates and categories (source: own work utilizing the Python packages Seaborn [50], Matplotlib [51] and Pandas [52]).
Forecasting 04 00027 g006
Figure 7. Exemplary technology roadmap for the module “camera” (source: own work visualized with the Python packages Matplotlib [51] and Pandas [52]); corresponding roadmaps for the 14 other modules are created and given in the Appendix A.
Forecasting 04 00027 g007
Figure 8. Patent activities for the module “camera” (source: own analysis and depiction); corresponding patent analyses are created for the other modules in [59].
Forecasting 04 00027 g008
Figure 9. Matching function and technology roadmaps; top: extract of a cross-module roadmap with automation technologies which have development paths beyond 2030 or for which development could not be estimated beyond a certain year (source: own work visualized with the Python packages Matplotlib [51] and Pandas [52]); bottom: extract of Figure 5, cut to the timeframe from 2019 until 2035, so that it matches with the technology roadmap above (source: own work utilizing the Python packages Seaborn [50], Matplotlib [51] and Pandas [52]).
Forecasting 04 00027 g009
Table 1. Automation levels according to SAE J3016.
SAE LevelTitle
0No Driving Automation
1Driver Assistance
2Partial Driving Automation
3Conditional Driving Automation
4High Driving Automation
5Full Driving Automation
Table 2. Maturity levels utilized for assessing the temporal development of technologies (adapted with permission from [45]. 2021, Springer Fachmedien Wiesbaden GmbH).
LevelTitleDescription
TRL
1
Basic researchFundamental principles reported; scientific research conducted; performance predicted
TRL
2–4
Technological researchTechnology component and/or basic subsystem validated in the laboratory or in a test environment; basic concept observed in other industries; requirements and interactions with relevant vehicle systems identified
TRL
5–8
Product demonstrationTesting and demonstration phases completed; technology proven in its final form and under the expected conditions; performance validated
MRL
8
Initial productionInitial production up and running; manufacturing and quality processes proven in the production environment; early supply chain established and stable
MRL
9
Mass production capability demonstratedCapability for mass production demonstrated; key system design features stable and proven in testing and evaluation; materials available to meet projected volume production; manufacturing processes established
MRL
10
Successful mass production provenFull rate production demonstrated; engineering changes limited to quality and cost improvements; system, components, etc., are in volume production and meet all design, performance, quality and reliability requirements; all materials, manufacturing processes, inspection and test equipment are in volume production and controlled for quality assurance purposes
Publisher’s Note: MDPI stays neutral with regard to jurisdictional claims in published maps and institutional affiliations.

