Article

Prediction of Autonomy Loss in Alzheimer’s Disease

by
Anne-Sophie Nicolas
1,2,*,
Michel Ducher
2,3,
Laurent Bourguignon
1,2,4,
Virginie Dauphinot
4,5 and
Pierre Krolak-Salmon
4,5,6,7
1
UMR 5558, Laboratoire de Biométrie et Biologie Evolutive, CNRS, Claude Bernard Lyon 1 University, 43 Bd du 11 Novembre 1918, 69622 Villeurbanne, France
2
Department of Pharmacy, Groupement Hospitalier de Gériatrie, Hospices Civils de Lyon, 69005 Lyon, France
3
EMR 3738, Faculté de Médecine Lyon-Sud, Université Lyon 1, 69921 Oullin, France
4
Faculté de Médecine Lyon Est, Claude Bernard Lyon 1 University, 8 Avenue Rockefeller, 69008 Lyon, France
5
Clinical and Research Memory Center of Lyon (CMRR), Charpennes Hospital, University Hospital of Lyon, 69100 Villeurbanne, France
6
INSERM, U1028, UMR CNRS 5292, Research Center of Neurosciences of Lyon, University Lyon 1, 69100 Lyon, France
7
Clinical Research Center (CRC)-Vieillissement—Cerveau—Fragilité (VCF) (Aging–Brain–Frailty), Charpennes Hospital, University Hospital of Lyon, 69100 Villeurbanne, France
*
Author to whom correspondence should be addressed.
Forecasting 2022, 4(1), 26-35; https://doi.org/10.3390/forecast4010002
Submission received: 17 November 2021 / Revised: 24 December 2021 / Accepted: 24 December 2021 / Published: 27 December 2021
(This article belongs to the Special Issue Improved Forecasting through Artificial Intelligence)

Abstract

:
The evolution of functional autonomy loss leads to institutionalization of people affected by Alzheimer’s disease (AD), to an alteration of their quality of life and that of their caregivers. To predict loss of functional autonomy could optimize prevention strategies, aids and cost of care. The aim of this study was to develop and to cross-validate a model to predict loss of functional autonomy as assessed by Instrumental Activities of Daily Living (IADL) score. Outpatients with probable AD and with 2 or more visits to the Clinical and Research Memory Centre of the University Hospital were included. Four Tree-Augmented Naïve bayesian networks (6, 12, 18 and 24 months of follow-up) were built. Variables included in the model were demographic data, IADL score, MMSE score, comorbidities, drug prescription (psychotropics and AD-specific drugs). A 10-fold cross-validation was conducted to evaluate robustness of models. The study initially included 485 patients in the prospective cohort. The best performance after 10-fold cross-validation was obtained with the model able to predict loss of functional autonomy at 18 months (area under the curve of the receiving operator characteristic curve = 0.741, 27% of patients misclassified, positive predictive value = 77% and negative predictive value = 73%). The 13 variables used explain 41.6% of the evolution of functional autonomy at 18 months. A high-performing predictive model of AD evolution of functional autonomy was obtained. An external validation is needed to use the model in clinical routine so as to optimize the patient care.

1. Introduction and Objective

Alzheimer’s disease (AD) is the most common neurodegenerative disease and represents two thirds of dementia cases in the elderly population [1]. In 2015, about 46 millions of persons in the world were affected by AD. The prevalence may double every 20 years [2]. In 2008, according to the PAQUID study, France counted 850,000 persons living with AD [3].
AD is characterized by cognitive disorders, functional impairment and behavioral disorders. Functional impairment is initially manifested by a loss of autonomy in instrumental activities of daily living (IADL) and thereafter in basal activities of daily living (BADL) [4]. AD is the first cause of dependency of elderly people [3]. This neurodegenerative disease presents with a long asymptomatic period during, which, only characteristic neuropathological lesions, i.e., amyloid deposits and tau pathology, are observed in the brain. This phase, which may be associated with amyloid/tau pathology and neurodegenerescence biomarkers, is followed by a subjective cognitive decline phase centered on memory, a mild neurocognitive disorder phase and lastly, the stage of dementia also known as major neurocognitive disorder, which induces autonomy loss. This biological, neuroimaging and clinical continuum illustrates a long period of duration of the disease, which should favor multidomain and early interventions involving primary to tertiary prevention programs. As a result, multidomain data and models are crucially needed to better understand the natural course of the disease and the major drivers of the changes in condition associated with AD.
IADL assessment is common in clinical practice and research studies as a means of evaluating functional impairment in patients with dementia. In the national database of AD in France, the IADL score is part of the limited recorded data set on AD [5].
The loss of functional autonomy loss is variable from one individual to another, with different consequences in terms of his/her quality of life and that of relatives, caregiver’s burden, and increased hospitalizations and institutionalizations [6,7,8,9]. Currently, while there is no curative treatment for cure AD, management can slow the progression of the disease and prevent some complications. In France, the medical and paramedical costs (establishing the diagnosis, care of patients at home, care in health facilities or nursing homes) of AD come to 5.3 billion euros a year, making management of AD a major public health issue [10]. About 53% of these costs are related to hospitalizations due to complications of AD e.g., falls, behavioral disorders, malnutrition, depression. Informal support, i.e., personal care, assistance with dressing, walking, cleaning, budget management, has been estimated at 14 billion euros per year, on average [10].
A predictive model would anticipate an unfavorable evolution of functional autonomy and optimize the management of patients with AD, especially by helping to construct individualized intervention including new disease-modifying drugs, so as to maintain functional autonomy, which is essential to the planning of care needs.
Bayesian networks (BN) have found applications in multiple fields, such as biology, bioinformatics, image processing, social networks and financial analysis. While their use in medicine is still low, there is growing interest in developing a diagnostic and prog-nostic model to aid medical decision-making in the prediction of falls in aging patients [11], r the diagnosis of primary hyperaldosteronism [12] the prediction of pressure ulcers in intensive care units [13] or the diagnosis of acute appendicitis [14]. These models are very practical in the representation of uncertain knowledge and reasoning from incomplete information, especially insofar as they mimic the behavior of the physician. Langarizadeh et al. recently showed its effectiveness for the construction of predictive models in medicine [15].
BN has already been used with success in AD. Seixas et al. have built a model to help in diagnosis of dementia, AD and Mild Cognitive Impairment (MCI) [16]. Sun et al. have also successfully built a BN, using magnetic resonance imaging (MRI) and other de-mographic and patient health data as variables, in order to classify patients with MCI [17]. To date, despite the major impact on quality of life and costs of loss of functional autonomy, no study has been published regarding a relevant predictive model.
The aim of this study was to develop and to cross-validate a BN to predict loss of functional autonomy, as measured by IADL score.

2. Method

2.1. Study Design—Data

This is an analytical study based on data from an observational, longitudinal and prospective cohort.
Since 2011, the cohort includes all patients at all stages of neurocognitive disorders visiting the University Clinical and Research Memory Center (CMRR). The primary aim of this cohort is to evaluate predictive factors of loss of functional autonomy.
For the present study, the data of all patients of a memory center with at least 2 visits and diagnosed as probably with AD (diagnosis made according to the National Institute of Neurological and Communicative Disorders and Stroke—Alzheimer’s Disease and Related Disorders Association (NINCDS-ADRDA) criteria) were extracted from the database.
T0 corresponds to modalities of variables at the beginning of the analysis period. Variables included in the models were: sex, age, number of comorbidities, geographic location of the patient, family situation of the patient, MMSE score, IADL score, antipsychotic, anxiolytic, antidepressant, hypnotic, Alzheimer’s-specific drug prescriptions.
Target variable was IADL score evolution at the end of the analysis period as follows: degradation corresponded to a decrease of at least 1 point on IADL score and non-degradation modality for stable patients and for patients with a gain of points on IADL score.
Continuous variables were discretized into classes to be included in the model. The MMSE score (min 0 points—max 30 points) was discretized into 5 classes: less than 10; between 10 and 15; between 16 and 20; between 21 and 25; greater than 25. Discretization was performed with respect to the stages of the disease: severe AD (MMSE score less than 10); moderate AD (MMSE score between 10 and 20); mild AD (MMSE score greater than 20); and to take into account the possible association between the MMSE score and the loss of functional autonomy shown in the literature [18,19]. The number of comorbidities was discretized into 2 classes: less than 2; equal to or greater than 2 as in the study by Melis et al. [20]. Finally, age was discretized into 7 classes: under 65, 65 to 69, 70 to 74, 75 to 79, 80 to 84, 85 to 89 and equal to or over 90. The IADL score was not discretized due to the small number of modalities. An IADL score equal to 0 corresponds to a total loss of functional autonomy and an IADL score equal to 8 corresponds to total functional au-tonomy in activities of daily living [21].
Variables regarding psychotropic drug prescriptions were categorized in two modal-ities: yes or no. The Alzheimer-specific drug prescriptions were categorized in four modalities: no, cholinesterase inhibitor, cholinesterase inhibitor with memantine and memantine. Posology was not included because of the large number of missing values, superior to 20%.
Four models were built to evaluate best period for prediction of evolution of functional autonomy: at 6 months (T6), 12 months (T12), 18 months (T18) and 24 months (T24); the visits at 6 months, 12 months, 18 months and 24 months were consequently selected for analysis. The procedure was performed for visits with no missing data.

2.2. Construction and Validation—Bayesian Network

A BN is a directed acyclic graphic where nodes represent random variables and arrows represent the relationship between two random variables. Probability tables for each node conditional to the parent nodes (parameters) are calculated using conditional probability as defined by Bayes’ theorem.
To build BN we should build a structure (graph model) and estimate parameters (conditional probability table) of the model. As the computation of probabilities is always possible, the BN does not require any assumption (non-parametric approach).
To structure four BNs (T6, T12, T18 and T24), we used the tree-augmented Naïve (TAN) Bayes algorithm and the local metric score called entropy to find the best model for each prediction time. To learn model parameters, we used the maximum likelihood method.
The TAN algorithm is defined on the one hand by the fact that all variables are linked to a target variable and on the other hand by the fact that each variable is dependent on another variable. In this network each variable has two parents: target variable and another variable.
Predictive capabilities were evaluated by 10-fold cross validation method with the area Under the Receiver Operating Characteristic curve (AUC-ROC), positive predictive value (PPV), negative predictive value (NPV) and the rate of patients misclassified in our model via the confusion matrix. A sensitivity study was carried out to analyze percentage of information provided by each variable to explain target variable.
The construction and validation steps were carried out with the WEKA data-mining software (version 3.9). Sensitivity study was performed with NETICA software (version 6.04).

2.3. Comparison with Logistic Regression

The best model obtained by the tree-augmented Naïve (TAN) Bayes algorithm was compared to logistic regression with the enter method, usually considered as a reference for predictive models (AUC-ROC, rate of patients misclassified, PPV and NPV).

2.4. Statistical Analysis

A comparison of patients with AD from the initial cohort and patients included in the analysis was performed. Numeric variables were tested by the nonparametric Kruskal–Wallis test. For categorical variables, a Chi-square test was performed. Medcalc soft-ware (version 18.2.1) was used for statistical analysis. The degree of significance was de-fined by p < 0.05.

3. Results

Between January 2011 and November 2017, the database recorded 1016 patients who consulted at the memory center. Among them, 348 patients not affected by AD were excluded. Finally, after exclusion of patients with only one consultation, 485 patients were eligible for study (Figure 1).
No significant difference was found between the AD patients in the database and patients included in the analysis (study population) (Table 1). At the beginning of the analysis, the mean IADL score of the study population was 3.4 +/− 2.1 and the mean MMSE score was 18.2 ± 5.6. A majority of patients were women, living in the city of the memory center, and living with a family member at home. A majority of patients had no psychotropic drug prescription (antipsychotic, anxiolytic, antidepressant or hypnotic). In the study population, 37% of patients had no Alzheimer’s-specifics drug prescription and 41% of patients had cholinesterase inhibitor prescription.
The number of patients and visits included in each of the 4 models is specified in Table 2.
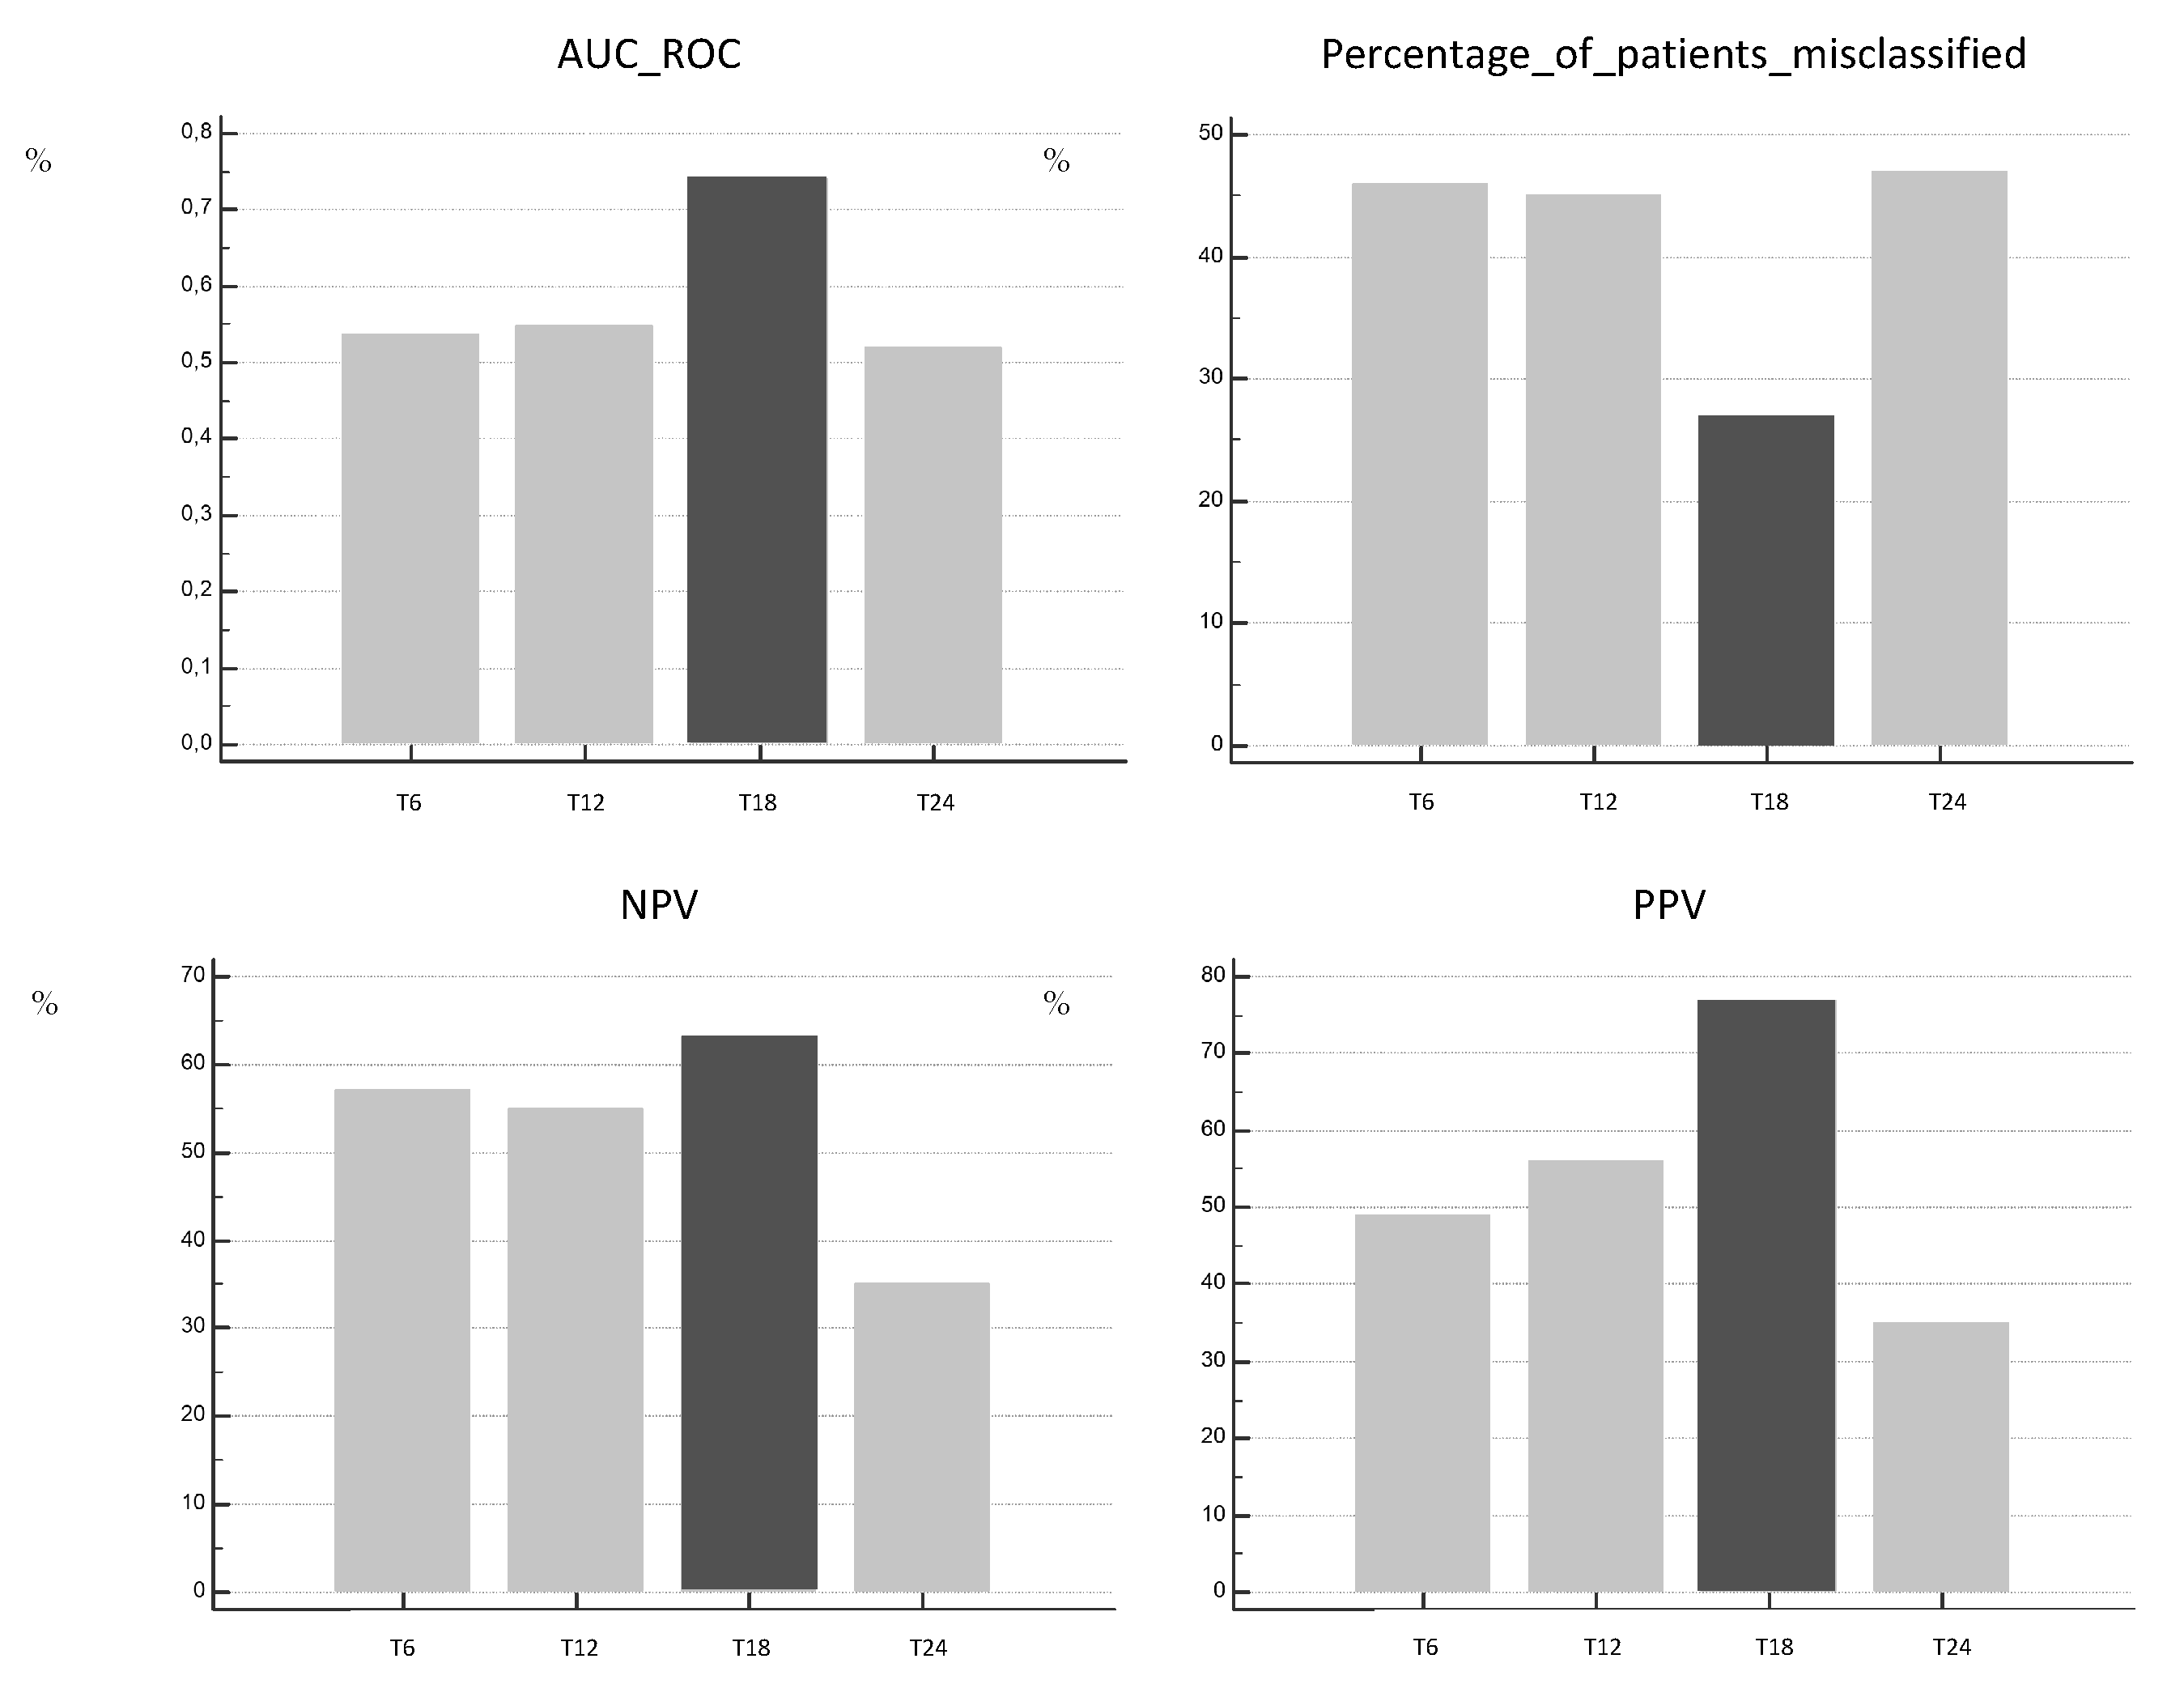
After internal validation by 10-fold cross-validation, the predictive model of the IADL score evolution at 18 months (T18) (Figure 2) showed the best performance with an AUC-ROC of 0.741, percentage of patients misclassified of 27%, PPV of 77% and NPV of 63%.
The predictions of each model obtained after 10-fold cross-validation are presented in Figure 3.
The sensitivity study of each model showed that the total percentage of information provided by each variable to explain the evolution of functional autonomy increased with prediction time: 12.5% in the T6 model, 20.0% in the T12 model, 41.6% in the T18 model and 74% in the T24 model. The variables to best explain the target variable were model-dependent, however, for each model, the IADL score at T0 provided the most in-formation. The age at T0 was one of the three main variables o explaining the evolution of functional autonomy regardless of prediction time. On the contrary, psychotropic drug prescription at T0 provided the least information.
The T18 model obtained by logistic regression (enter method) showed the following characteristics: AUC-ROC = 0.691; percentage of misclassification = 29%; PPV = 79% and NPV = 60%.

4. Discussion

Functional autonomy loss represents the main source of handicap in patients with AD. It ultimately leads to dependency resulting in a decline in the patient’s quality of life, caregiver burden, major cost of care and an increased risk of institutionalization. To predict this evolution of functional autonomy could optimize help and costs. The purpose of this work was to build and validate a BN model to specify the risk of functional autonomy loss of patients with AD. To our knowledge, no study had previously been published about a predictive model for loss of functional autonomy.
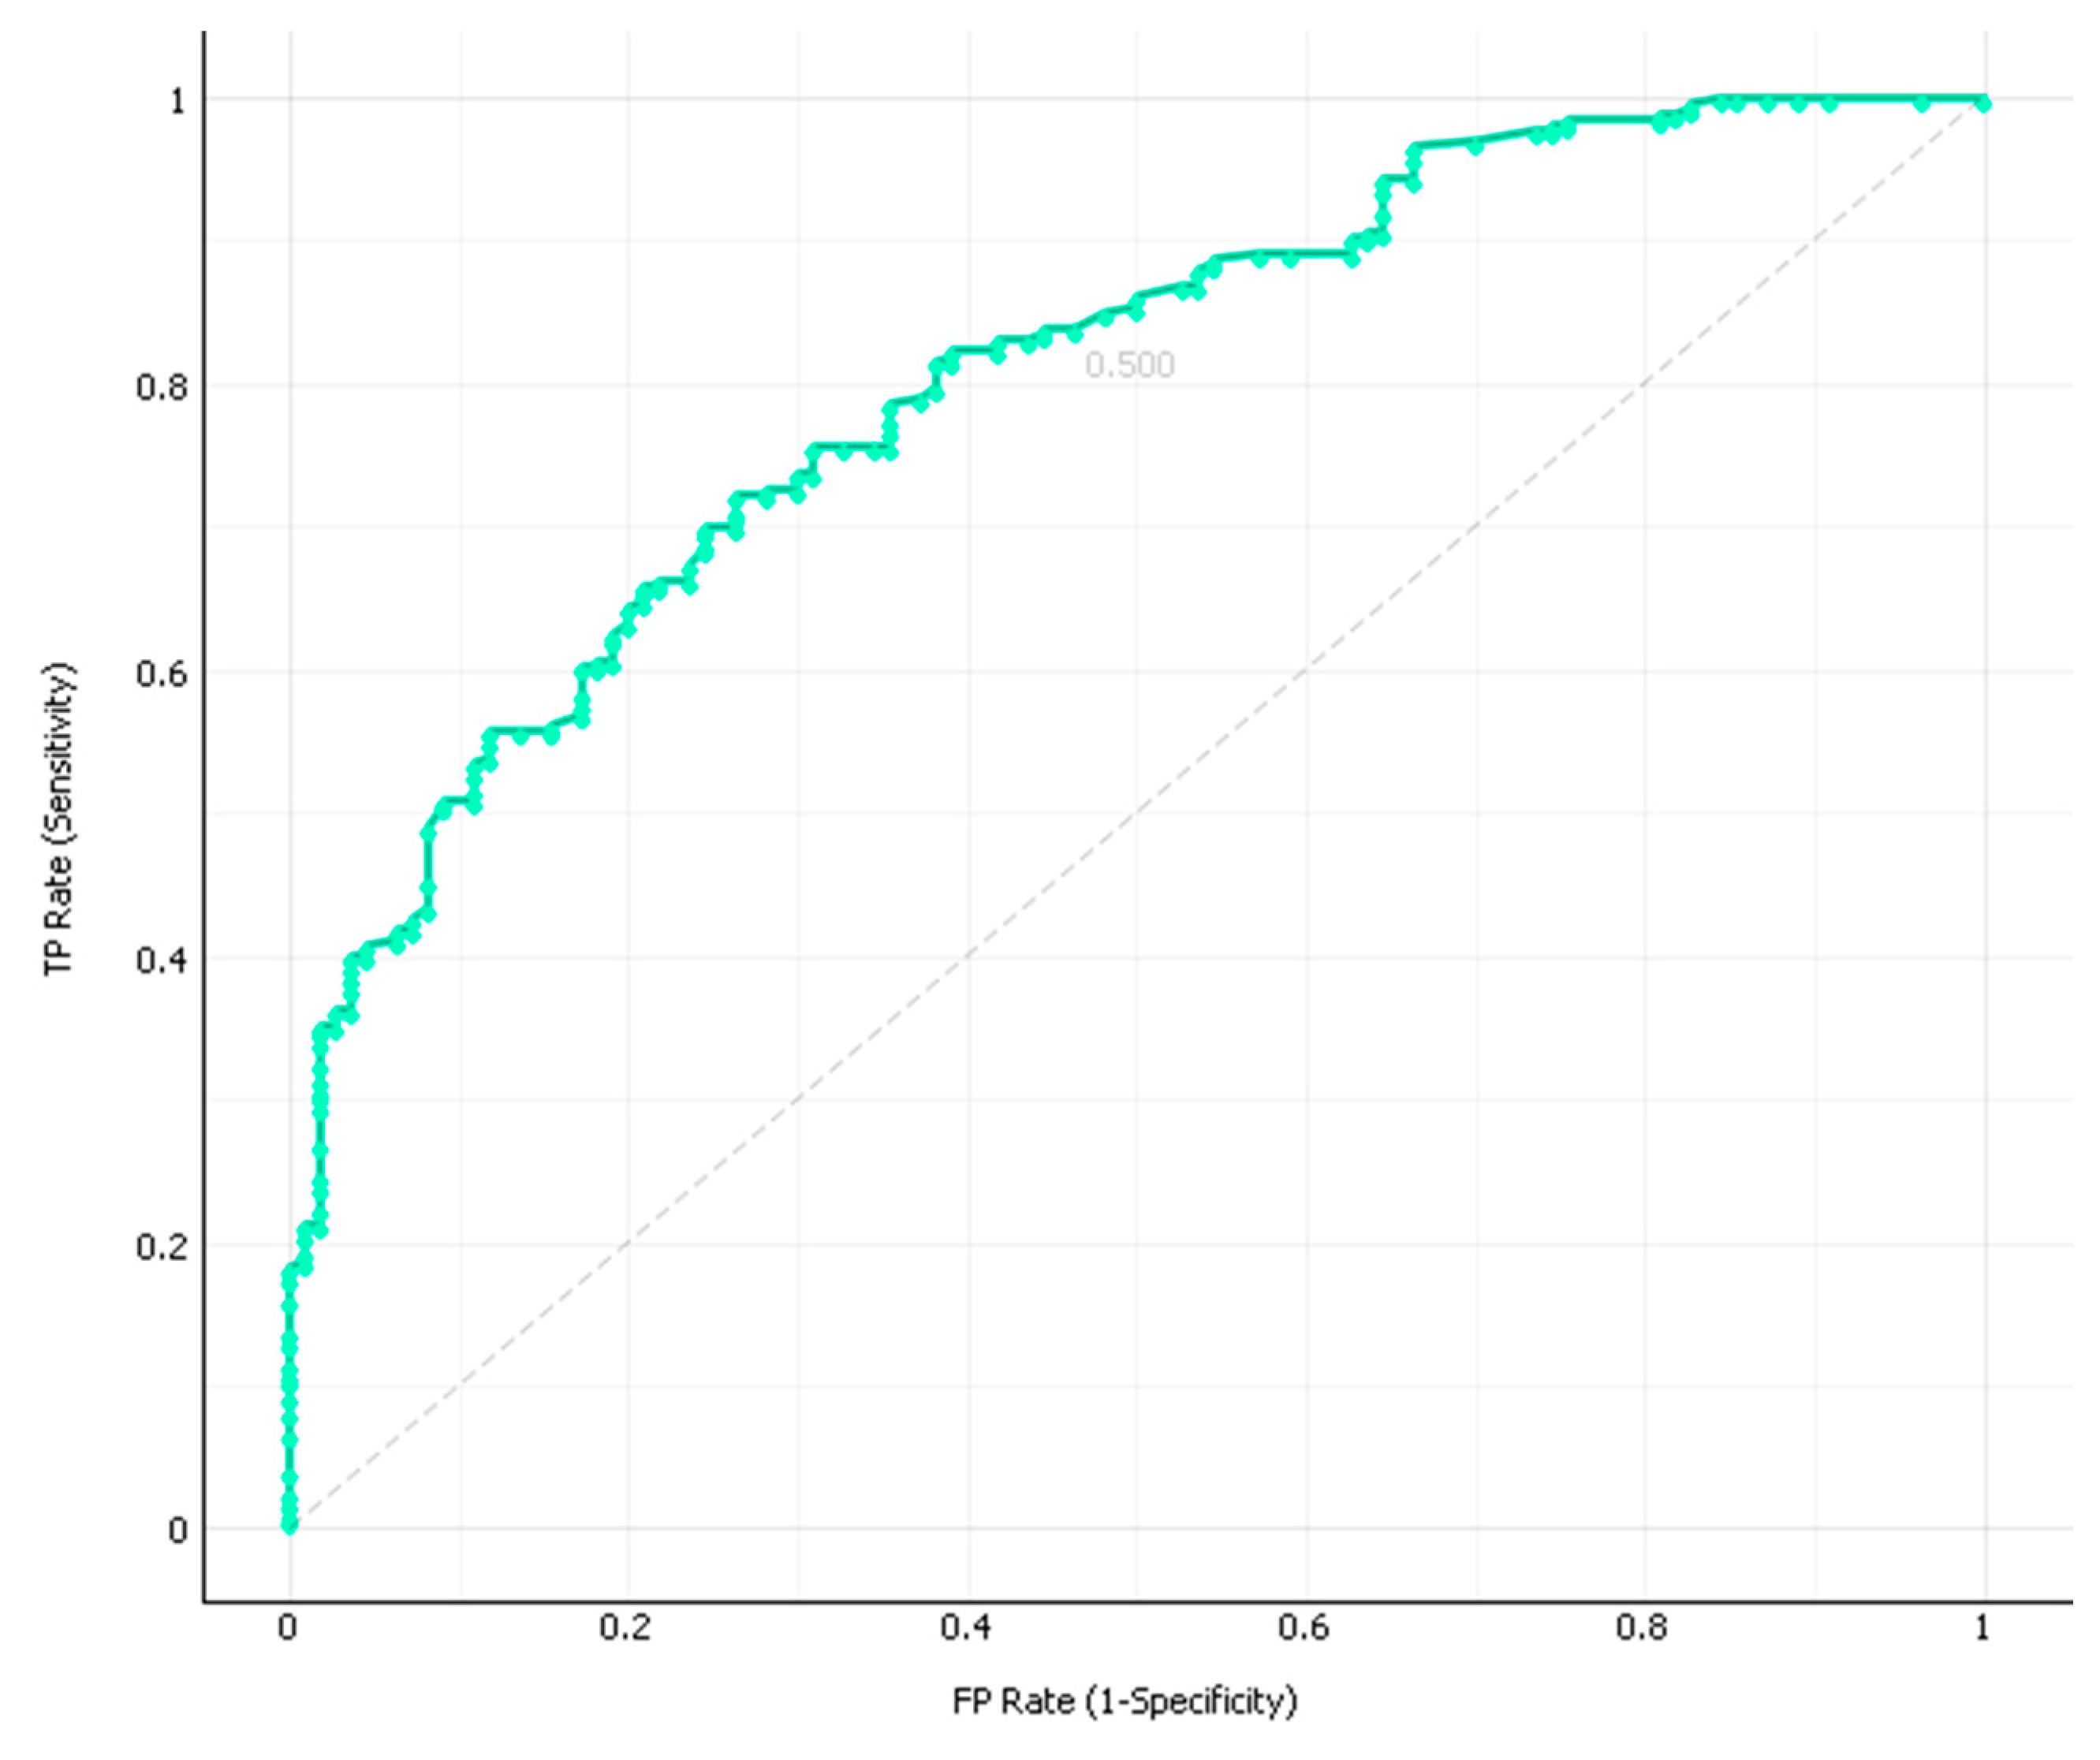
One of the built models correctly predicted the evolution of IADL score (AUC-ROC = 0.741 (Figure 4); rate of patients misclassified = 27%; PPV = 77% and NPV = 63%) at 18-month (T18). This performance, obtained after 10-fold cross validation, is encouraging and highlights the model’s interesting predictive capabilities. Compared to the usual logistic regression method, the T18 BN model showed slightly better performance on AUC of the ROC curve, PPV, NPV and error classification rate. The predictive performance obtained after 10-fold cross-validation increased to reach an optimum for the T18 model. This observation could be explained by the natural history of the disease with a slow evolution of loss of functional autonomy in AD patients at 6 months (T6 model) and 12 months (T12 model). Delva et al. concluded that there are relatively few data available to describe the natural course of functional decline in AD patients [22]. The poor performance of the T24 model could also be explained by a relatively lack of data in the cohort at that time. The more the prediction time increases, the fewer the number of visits, and a low number of visits is problematic for the robustness of 10-fold cross validation.
The sensitivity study showed that the variables included explained 41.6% of the functional autonomy loss at 18 months. The variables providing the most information relative to the evolution of the IADL score were different according to the prediction of the loss of functional autonomy. For all models, the IADL score 6 months before, 12 months before, 18 months before or 24 months before were the variables providing the most information to explain the degradation observed at the different times studied. As shown in the results, the longer the prediction time, the higher the total percentage of information provided by all the variables. This observation confirms the difficulty of predicting at 6 months and 12 months and demonstrates that the prediction of evolution at 24 months would probably be more optimal with a larger number of visits.
The study by Melis et al. demonstrated a more rapid decline of functional autonomy in patients with dementia and multimorbidity [20]. Mok et al. showed that the MMSE score was significantly correlated with the IADL score [23]. Lechowski et al. found a significant association between MMSE score and IADL score and between age and IADL score [19]. In the present study a link was likewise observed between the evolution of functional autonomy and age, MMSE score or number of comorbidities.
This work has some limitations, especially regarding the number of visits, which could be optimized to reinforce performance of the models. Indeed, artificial intelligence requires large databases to obtain robust models with good predictive qualities. An external validation with a sample of patients, other than the one used for the construction and internal validation of the network, would be needed before any clinical use of the models could be achieved. Data that were collected in clinical routine may have included input errors. In addition, the fact that comorbidities were not precisely documented prevents a detailed analysis of this variable.
Additional variables could be included in models, for example behavioral disorders or markers of cerebral atrophy. Behavioral disorders were found to be linked with loss of functional autonomy in the literature [24]. Markers of cerebral atrophy, markers of disease progression, could also be associated with a decline in functional autonomy [25]. Moreover, it would be interesting in a new study to evaluate the role of comorbidities in functional autonomy evolution, with the measurement of the CIRS-G (Cumulative illness rating scale geriatric) score [26,27] or Charlson index [28].

5. Conclusions/Relevance

To our knowledge this study presents the first model to predict the evolution of functional autonomy loss at 18 months in patients with AD. The results obtained through this work are promising and underscore the usefulness and high performance of BN artificial intelligence, in medicine, as a means of explaining multifactorial events such as functional autonomy loss in patients with AD. In addition, BN also has the advantage of being usable despite the absence of certain data concerning the patient, which often occurs in practice. This model would be a real step forward for optimized management of patients with AD: to anticipate dependency, to plan necessary aid and assistance, to provide access to clinical trials and future disease-modifying drugs, to anticipate institutionalization and to optimize rehabilitation focused on the maintenance of activities.

Author Contributions

Conceptualization, L.B. and M.D.; methodology, M.D.; validation, M.D., L.B. and P.K.-S.; investigation, V.D.; data curation, V.D.; writing—original draft preparation, A.-S.N.; writing—review and editing, A.-S.N., V.D., L.B., M.D., P.K.-S.; supervision, P.K.-S.; project administration, V.D. All authors have read and agreed to the published version of the manuscript.

Funding

This research received no external funding.

Institutional Review Board Statement

The authorization for manipulation the personal data has been granted by the French Data Protection Authority (CNIL: National Commission for Computing and Liberties): 06/08/2010). This study was approved by the ethics committee of Lyon Sud-Est III (CPP Lyon Sud-Est III: #2014-041 B)).

Informed Consent Statement

Informed consent was obtained from all subjects involved in the study.

Data Availability Statement

The authorization for manipulation the personal data has been granted by the French Data Protection Authority (CNIL: National Commission for Computing and Liberties): 06/08/2010). This study was approved by the ethics committee of Lyon Sud-Est III (CPP Lyon Sud-Est III: #2014-041 B)).

Conflicts of Interest

The authors have no conflict of interest to report.

References

  1. Alzheimer’s Association 2018 Alzheimer’s disease facts and figures. Alzheimers Dement 2018, 14, 367–429. [CrossRef]
  2. Alzheimer’s Disease International, Dementia Statistics. Available online: https://www.alz.co.uk/research/statistics (accessed on 14 April 2018).
  3. Dartigues, J.-F.; Helmer, C.; Letenneur, L.; Péres, K.; Amieva, H.; Auriacombe, S.; Orgogozo, J.-M.; Commenges, D.; Jacqmin-Gadda, H.; Richard-Harston, S.; et al. Paquid 2012: Illustration and overview. Geriatr. Psychol. Neuropsychiatr. Vieil. 2012, 10, 325–331. [Google Scholar] [CrossRef]
  4. Feldman, H.H.; Woodward, M. The staging and assessment of moderate to severe Alzheimer disease. Neurology 2005, 65, S10. [Google Scholar] [CrossRef]
  5. Le Duff, F.; Develay, A.E.; Quetel, J.; Lafay, P.; Schück, S.; Pradier, C.; Robert, P. French National Alzheimer dataBank (BNA) The 2008–2012 French Alzheimer plan: Description of the national Alzheimer information system. J. Alzheimers Dis. 2012, 29, 891–902. [Google Scholar] [CrossRef] [Green Version]
  6. Dauphinot, V.; Delphin-Combe, F.; Mouchoux, C.; Dorey, A.; Bathsavanis, A.; Makaroff, Z.; Rouch, I.; Krolak-Salmon, P. Risk factors of caregiver burden among patients with Alzheimer’s disease or related disorders: A cross-sectional study. J. Alzheimers Dis. 2015, 44, 907–916. [Google Scholar] [CrossRef] [Green Version]
  7. Crespo, M.; Hornillos, C.; de Quirós, M.B. Factors associated with quality of life in dementia patients in long-term care. Int. Psychogeriatr. 2013, 25, 577–585. [Google Scholar] [CrossRef]
  8. Balardy, L.; Voisin, T.; Cantet, C.; Vellas, B.; REAL. FR Group. Predictive factors of emergency hospitalisation in Alzheimer’s patients: Results of one-year follow-up in the REAL.FR Cohort. J. Nutr. Health Aging 2005, 9, 112–116. [Google Scholar]
  9. Wattmo, C.; Wallin, A.K.; Londos, E.; Minthon, L. Risk factors for nursing home placement in Alzheimer’s disease: A longitudinal study of cognition, ADL, service utilization, and cholinesterase inhibitor treatment. Gerontologist 2011, 51, 17–27. [Google Scholar] [CrossRef] [PubMed] [Green Version]
  10. Bérard, A.; Gervès, C.; Fontaine, R.; Aquino, J.-P.; Plisson, M. Combien coûte la maladie d’Alzheimer. Fond. Médéric Alzheimer 2015, 98, 9. [Google Scholar]
  11. Lalande, L.; Bourguignon, L.; Carlier, C.; Ducher, M. Bayesian networks: A new method for the modeling of bibliographic knowledge: Application to fall risk assessment in geriatric patients. Med. Biol. Eng. Comput. 2013, 51, 657–664. [Google Scholar] [CrossRef]
  12. Ducher, M.; Mounier-Vehier, C.; Lantelme, P.; Vaisse, B.; Baguet, J.-P.; Fauvel, J.-P. Reliability of a Bayesian network to predict an elevated aldosterone-to-renin ratio. Arch. Cardiovasc. Dis. 2015, 108, 293–299. [Google Scholar] [CrossRef]
  13. Kaewprag, P.; Newton, C.; Vermillion, B.; Hyun, S.; Huang, K.; Machiraju, R. Predictive models for pressure ulcers from intensive care unit electronic health records using Bayesian networks. BMC Med. Inform. Decis. Mak. 2017, 17, 65. [Google Scholar] [CrossRef] [PubMed]
  14. Sakai, S.; Kobayashi, K.; Nakamura, J.; Toyabe, S.; Akazawa, K. Accuracy in the diagnostic prediction of acute appendicitis based on the Bayesian network model. Methods Inf. Med. 2007, 46, 723–726. [Google Scholar] [CrossRef] [PubMed]
  15. Langarizadeh, M.; Moghbeli, F. Applying Naive Bayesian Networks to Disease Prediction: A Systematic Review. Acta Inf. Med. 2016, 24, 364–369. [Google Scholar] [CrossRef]
  16. Seixas, F.L.; Zadrozny, B.; Laks, J.; Conci, A.; Muchaluat Saade, D.C. A Bayesian network decision model for supporting the diagnosis of dementia, Alzheimer’s disease and mild cognitive impairment. Comput. Biol. Med. 2014, 51, 140–158. [Google Scholar] [CrossRef] [PubMed] [Green Version]
  17. Sun, Y.; Lv, S.; Tang, Y. Construction and Application of Bayesian Network in Early Diagnosis of Alzheimer Disease’s System. In Proceedings of the 2007 IEEE/ICME International Conference on Complex Medical Engineering, Gold Coast, QLD, Australia, 13–15 July 2007; pp. 924–929. [Google Scholar]
  18. Lechowski, L.; De Stampa, M.; Tortrat, D.; Teillet, L.; Benoit, M.; Robert, P.H.; Vellas, B.; REAL. FR Group. Predictive factors of rate of loss of autonomy in Alzheimer’s disease patients. A prospective study of the REAL.FR Cohort. J. Nutr. Health Aging 2005, 9, 100–104. [Google Scholar]
  19. Lechowski, L.; Dieudonne, B.; Tortrat, D.; Teillet, L.; Robert, P.H.; Benoit, M.; Forette, B.; Vellas, B. Role of behavioural disturbance in the loss of autonomy for activities of daily living in Alzheimer patients. Int. J. Geriatr. Psychiatry 2003, 18, 977–982. [Google Scholar] [CrossRef]
  20. Melis, R.J.F.; Marengoni, A.; Rizzuto, D.; Kivipelto, M.; Angleman, S.; Fratiglioni, L. The influence of multimorbidity on clinical progression of dementia in a population-based cohort. Alzheimers Dement 2013, 11, P261. [Google Scholar] [CrossRef] [PubMed] [Green Version]
  21. Lawton, M.P.; Brody, E.M. Assessment of older people: Self-maintaining and instrumental activities of daily living. Gerontologist 1969, 9, 179–186. [Google Scholar] [CrossRef]
  22. Delva, F.; Auriacombe, S.; Letenneur, L.; Foubert-Samier, A.; Bredin, A.; Clementy, A.; Latxague, C.; Puymirat, E.; Ballan, G.; Delabrousse-Mayoux, J.-P.; et al. Natural history of functional decline in Alzheimer’s disease: A systematic review. J. Alzheimers Dis. 2014, 40, 57–67. [Google Scholar] [CrossRef]
  23. Mok, W.Y.W.; Chu, L.W.; Chung, C.P.; Chan, N.Y.; Hui, S.L. The relationship between non-cognitive symptoms and functional impairment in Alzheimer’s disease. Int. J. Geriatr. Psychiatry 2004, 19, 1040–1046. [Google Scholar] [CrossRef]
  24. Tekin, S.; Fairbanks, L.A.; O’Connor, S.; Rosenberg, S.; Cummings, J.L. Activities of Daily Living in Alzheimer’s Disease: Neuropsychiatric, Cognitive, and Medical Illness Influences. Am. J. Geriatr. Psychiatry 2001, 9, 81–86. [Google Scholar] [CrossRef] [PubMed]
  25. Frisoni, G.B.; Fox, N.C.; Jack, C.R.J.; Scheltens, P.; Thompson, P.M. The clinical use of structural MRI in Alzheimer disease. Nat. Rev. Neurol. 2010, 6, 67–77. [Google Scholar] [CrossRef] [PubMed] [Green Version]
  26. Berrut, G.; Decker, L. Comprehensive assessment of comorbidity in the elderly. Geriatr. Psychol. Neuropsychiatr. Viei. 2015, 13, 7–12. [Google Scholar] [CrossRef] [PubMed]
  27. Miller, M.D.; Paradis, C.F.; Houck, P.R.; Mazumdar, S.; Stack, J.A.; Rifai, A.H.; Mulsant, B.; Reynolds, C.F., 3rd. Rating chronic medical illness burden in geropsychiatric practice and research: Application of the Cumulative Illness Rating Scale. Psychiatry Res. 1992, 41, 237–248. [Google Scholar] [CrossRef]
  28. Charlson, M.E.; Pompei, P.; Ales, K.L.; MacKenzie, C.R. A new method of classifying prognostic comorbidity in longitudinal studies: Development and validation. J. Chronic. Dis. 1987, 40, 373–383. [Google Scholar] [CrossRef]
Figure 1. Flowchart.AD = Alzheimer’s disease.
Forecasting 04 00002 g001
Figure 2. Structure of the T18 Bayesian Network. CMRR = University Clinical and Research Memory Center of Lyon. IADL = instrumental activities of daily living. MMSE = Mini-mental state examination. ChEI = cholinesterase inhibitor. EBIXA = Name of the specialty memantine.
Forecasting 04 00002 g002
Figure 3. Performance after cross-validation of predictive models of loss of functional autonomy at 6 months (T6), at 12 months (T12), at 18 months (T18) and at 24 months (T24). AUC-ROC = area under the curve of the receiving operator characteristic curve. NPV = Negative predictive value (percentage). PPV = Positive predictive value (percentage).
Forecasting 04 00002 g003
Figure 4. Roc curve after 10-fold cross validation of T18 Bayesian network.
Forecasting 04 00002 g004
Table 1. Clinical and demographic characteristics at baseline.
VariablesAll AD Patients (n = 668)AD Patients with ≥2 Visits (n = 485)p
Age82.1 ± 6.1382.1 ± 6.2n.s
Sex (Female)61.464.3n.s
Geographic location
CMRR city81.482.1n.s
<50 km not in CMRR city16.515.7n.s
>50 km1.81.9n.s
Out of region0.30.4n.s
Family situation
Lived with someone63.063.9n.s
Lived alone33.432.8n.s
Lived out of home3.02.9n.s
Lived at home without other information0.40.4n.s
Other0.10.0n.s
Comorbidities: number1.3 ± 1.71.3 ± 1.7n.s
IADL score3.3 ± 2.13.4 ± 2.1n.s
MMSE score18.1 ± 5.818.2 ± 5.6n.s
Antidepressant drug prescription (No)62.162.3n.s
Antipsychotic drug prescription (No)94.995.3n.s
Anxiolytic drug prescription (No)84.184.9n.s
Hypnotic drug prescription (No)97.396.9n.s
Alzheimer’s specific-drug prescription
No41.537.1n.s
ChEI38.040.8n.s
ChEI and memantine (EBIXA)3.64.7n.s
Two ChEIs0.70.6n.s
Memantine (EBIXA)16.216.7n.s
CMRR = University Clinical and Research Memory Center. IADL = instrumental activities of daily living. MMSE = Mini-mental state examination. ChEI = cholinesterase inhibitor. ChEIs = cholinesterase inhibitors. Values expressed % or mean ± SD. n = number of patients. n.s = non-significant.
Table 2. Group composition (number of visits and patients).
GroupNumber of Visits InitiallyVisits ExcludedNumber of Visits Included
T630768239 (153 patients)
T1226150211 (159 patients)
T181091891 (74 patients)
T24641351 (43 patients)
T6 = model to predict evolution of functional autonomy at 6 months. T12 = model to predict evolution of functional autonomy at 12 months. T18 = model to predict evolution of functional autonomy at 18 months. T24 = model to predict evolution of functional autonomy at 24 months.
Publisher’s Note: MDPI stays neutral with regard to jurisdictional claims in published maps and institutional affiliations.