Abstract
Thunderstorms are complex weather phenomena that cause substantial power outages in a short period. This makes thunderstorm outage prediction challenging using eventwise outage prediction models (OPMs), which summarize the storm dynamics over the entire course of the storm into a limited number of parameters. We developed a new, temporally sensitive outage prediction framework designed for models to learn the hourly dynamics of thunderstorm-caused outages directly from weather forecasts. Validation of several models built on this hour-by-hour prediction framework and comparison with a baseline model show abilities to accurately report temporal and storm-wide outage characteristics, which are vital for planning utility responses to storm-caused power grid damage.
1. Introduction
Severe storms pose a serious threat to electric distribution networks, generating great repair costs and disrupting quality of life for millions of Americans every year [1]. Several increasingly sophisticated outage prediction models (OPMs) were developed and validated in recent years for hurricanes [2,3,4,5,6,7,8], thunderstorms [9,10,11,12], rain and wind [9,10,11], snow [13] and ice storms [13,14]. Except for an isolated case [7] that studied the dynamics of Hurricane Irene, all other studies focused on the prediction of storm total outages. A missing aspect of the literature is the prediction of outage dynamics during thunderstorms, which are the most common type of damaging storms in many areas of the world. In fact, as noted by several authors, the impacts of thunderstorms are particularly difficult to predict due to the small-scale dynamics, which are not well represented in both numerical weather prediction models and current OPMs.
Modeling the magnitude and timing of weather impact on the electric distribution network represents critical information for estimating the time to outage restoration [4,15,16]. This type of impact modeling can also be used to evaluate the effectiveness of electric grid hardening activities such as tree trimming [17]. Advancing outage prediction precision is therefore necessary for storm preparedness among power utilities. The most important factors responsible for the advancement in model accuracy and precision are the increasing temporal and spatial resolution of publicly available weather data [18,19], the incorporation of additional geographic datasets [6,20,21,22], and the proliferation of nonparametric [8,23], probabilistic [24], and failure rate methods [25,26,27].
Early methods for power outage prediction leveraged statistical approaches such as generalized linear models [28] or generalized linear mixed models [14] and focused only on a few storm types such as ice storms or hurricanes [29]. Later, researchers explored hybrid models, such as stacking models together in an ensemble with binary models to predict whether at least one outage would occur followed by regression models that predict the count of outages [5], and nonparametric decision tree ensembles that could be adapted and generalized to a variety of storm types [9,10,11]. The models developed in these last three studies were employed by Eversource Energy to plan responses to damage caused by storms in New England since 2015.
All these prior studies summarize weather features from time series, rather than leveraging the dynamical information inherent in the raw data. While aggregated features are useful for some statistical and machine learning models that cannot directly use time series data, feature engineering is often time-consuming and the resultant features represent the source data with lower fidelity. Thus, most models do not account for weather-electric-grid interactions at fine time scales, and lose information in the feature engineering process.
Recent advancements in weather prediction methods and machine learning techniques make possible a new and more dynamic modeling framework for forecasting impacts from storms that change quickly in meteorological character and interact locally with power grid infrastructure. Our method represents atmospheric conditions and their impacts on the power grid at high temporal resolution. We leverage this data with a variety of statistical and machine learning models, including Poisson regression, k-nearest neighbors (KNN), random forest, and a long short-term memory (LSTM) neural network model [30,31,32,33,34] to forecast hourly dynamics of power outages over the course of a thunderstorm. We show validation results, including comparison to a baseline eventwise OPM [9,10,11], demonstrating that utilities can use these predictions to plan the number of crews and timing of crew deployment.
Our study is outlined as follows. Section 2 introduces the publicly available weather data source: High-Resolution Rapid Refresh (HRRR), and the outage data collected by the local electric utility (Eversource Energy-CT). Also described are the data processing steps used to inform a variety of temporally conscious models detailed in Section 3. Finally, the model evaluation methodology is presented with the results of these dynamic OPMs and an eventwise OPM in Section 4, followed by a discussion of model performance in Section 5, and concluding remarks about the contributions of this study and future work in Section 6.
2. Data Sources and Processing
2.1. Weather Data
We use historical High-Resolution Rapid Refresh (HRRR) atmospheric forecasts produced by NOAA and archived by the University of Utah [35]. The Rapid Refresh (RAP) atmospheric model on which HRRR is updated hourly provides the temporal resolution our models use to correlate severe weather and outage occurrences over the course of a storm. HRRR, on top of RAP, incorporates radar observations every 15 min to reach a 3-km spatial resolution.
For the purpose of predicting outages caused by thunderstorms, we focus on reflectivity at 1000 m and six surface-level features: wind gust, atmospheric pressure, relative humidity, wind speed, convective available potential energy (CAPE), and convective inhibition (CIN). Sustained winds and wind gusts break branches and trees, causing damage to the grid. Relative humidity can help distinguish frontal from post-frontal showers. Atmospheric pressure, CAPE, and CIN are related to atmospheric instability, thunderstorm intensity, and the likelihood of gusts reaching the surface. For model training, we extract each of these features at zero-hour forecasts from the pixel containing the center of each town in the Eversource-CT service territory.
The HRRR archived dataset begins in mid-July of 2016. Only the months during which thunderstorms are likely to occur—April through September—are selected. Although incorporation of the other months of the year would more than double the size of this dataset, these months are very unlikely to harbor thunderstorm occurrences, their inclusion would violate assumptions of geospatial constancy inherent to the modeling framework (e.g., the presence of leaves on trees), and the selected HRRR features would include non-thunderstorm meteorological conditions. Thus, these months were excluded from the model. We also excluded 200 h during and after an outlier tornado in May 2018, which caused outages lasting more than a week unrelated to weather as the grid underwent repairs. In total, we have weather forecasts and corresponding outage counts (described in the Section 2.2) for 10456 h. In addition to these observations, we imputed a total of 19 missing hours of HRRR archived forecasts linearly with respect to the last known hour and next known hour of forecasts.
2.2. Outage Data
The proprietary Eversource outage dataset consists of real-time customer-reported outage occurrences organized by its Outage Management System (OMS), which is also used to generate service tickets for directing repair crews. We define an outage as damage to a component of the power grid. OMS specialists use customer phone calls and limited sensor data to determine when outages occurred, and associate outage reports in the OMS database with the suspected geographic locations of the infrastructure assets at fault.
Since customers cannot be expected to immediately report outage occurrences, historical outage counts have an inherent lag behind severe weather, especially for storms that occur at night when customers are less likely to notice and report power outages. It can also be difficult for specialists to pinpoint assets at fault based only on current reports. Because of the networked nature of the grid, the damages most superficial in the network are perceptible. Damages deeper in the network can hide behind more superficial damages, and detecting them is very difficult until those superficial damages are repaired. Although Eversource has no means by which to record real-time outage occurrences, an analysis of the reported outage lag is shown in terms of wind speed in Figure 1. The greatest cross-correlation is observed with an outage lag behind wind speed of 1 h. Even this cross-correlation is low, indicating the lag of reported outages behind winds is highly variable. To help compensate for this, we include the cyclically encoded hour consisting of two features: and , where h is the hour of day, as features in our models, whose designs, described in Section 3, are also relevant to addressing this issue.
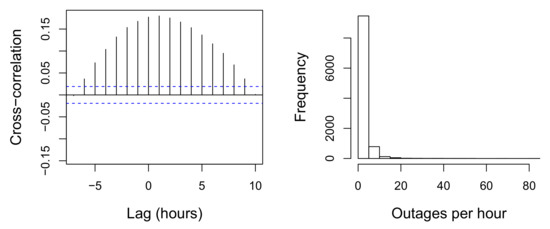
Figure 1.
Cross-correlation of wind speed, averaged at each hour across town centroids, and customer-reported outages (left); horizontal dashed lines indicate the threshold for statistical significance, which is the 95 percent confidence interval when the underlying true correlation values are zero. Histogram of outages per hour across the study period (right).
For this study, 27 thunderstorm events were identified in CT between July 2016 (the start of the HRRR archive) and September 2018. These events caused both an elevated number of outages and were observed to have meteorological characteristics consistent with thunderstorms as reported by local METAR weather stations. Station data is downloaded and parsed from the Integrated Surface Dataset, hosted by NOAA’s National Centers for Environmental Information (NCEI). Observations of a short-lived peak in wind gusts, combined with intense precipitation, a sharp drop in air temperature, and/or reports of lightning or thunder were indicative of a thunderstorm event. Outages from previous hours are not included as features to predict the next hour’s outages—a live outage reporting system is thus unnecessary for the dynamic predictive framework that we present.
2.3. Feature Representation Framework
Under the time-indexed framework that was developed (Figure 2), geospatial features (e.g., soil type, topography, land use) inherent to some eventwise models are eliminated. The framework also requires no information about the power system. Instead, weather variables are described for each town. The model is left to learn implicitly the characteristics of each town within the service territory, essentially producing an outage model for each town. This feature representation forgoes the intensive selection and processing of geospatial data, yielding intuitive models in which terrain and infrastructure conditions are assumed to remain static in the long term.
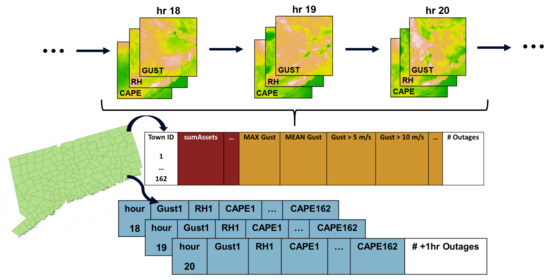
Figure 2.
Illustration of 3 hrs. of CT thunderstorm weather conditions over three variables, translated into the eventwise OPM framework (middle) and the temporally dynamic framework (bottom). In the eventwise framework, the processed dataset consists, for each storm, of static geospatial features and statistical aggregations of weather features over the course of the storm. This data is indexed by town ID. In the temporally dynamic framework, the dataset consists of direct timeseries samples of the weather features. The index is time, and town IDs are associated with each weather feature. A toy data sample in the temporally dynamic framework is illustrated with a 2-hr. lookback, predicting outages one hour ahead.
The issue of a limited training set is exacerbated by the large feature space created by this framework: with the extraction and geospatial tagging methodology, the set of selected weather features is generated for each town in the forecast domain. Doing so results in a total of 7 weather features × 162 towns = 1134 geospatial weather features. Principal components analysis (PCA) is applied across all time points in the training set of each iteration of the leave-one-storm-out (LOSO) cross-validation (described in Section 4) to deal with this feature expansion. Using PCA, we reduce our 1134 features to a new set of 100 features with values at each time point. The PCA components consistently preserve about 95 percent of the variance of the original feature set. The small variance impact of such a drastic dimensional reduction can be explained by the high degree of spatial correlation between features describing the same weather variables across towns as well as the correlation between the atmospheric conditions themselves.
3. Dynamic OPMs
We applied a variety of standard statistical and machine learning models consisting of Poisson regression, KNN, random forest, and an LSTM to predict the outage count at each hour. Of the regression models we considered, Poisson regression, KNN, and random forest are not explicitly designed to work on sequences of features over time. Instead, to the zero-hour weather forecasts at each hour, we added the zero-hour features states from 0 to l hours in the past. We determined the optimal lag period to use for the proceeding analysis with these models by considering the LOSO cross-validated squared correlation () between actual and predicted hourly and storm-total outages across settings of l between 0 and 10 (Figure 3). Under the LOSO cross-validation scheme [11], we define a storm window as an 18-hour period containing the thunderstorm. For each storm, the training set consists of all hours in our dataset excluding the storm window, and the test set consists of only those 18 h. A lag setting of is optimal with respect to both correlation metrics in cross-validation, is consistent with the cross-correlation analysis between winds and outage reports (Figure 1), and is statistically significant with respect to a zero-lag model (analysis of deviance test with reference distribution; ). The setting was thus used for the Poisson regression, KNN, and random forest models in the proceeding analyses.
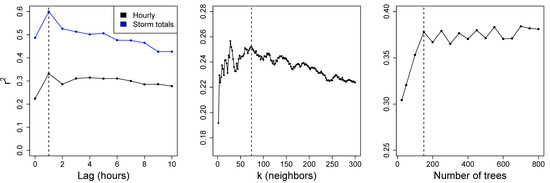
Figure 3.
Mean LOSO cross-validated squared correlation between actual and predicted outages using Poisson regression on feature sets with varying lags (left), KNN at settings of (middle); random forest at several settings of the number of trees (right). Selected values are marked by vertical dashed lines.
In addition to the lag period, there are hyperparameters specific to KNN, random forest, and LSTM that should be tuned according to the reference data set. Before applying KNN, we must select the number of observations k nearest the input data point whose outage counts are averaged to yield the prediction. We did so by performing a grid search over all even settings of k between 2 and 300 with respect to LOSO cross-validated between hourly actual and predicted outages; we thereby selected (Figure 3). This setting yields a model that is less variable with respect to the bias-variance tradeoff than models with lesser settings of k that appear comparable or even superior in performance, and is therefore less prone to overfitting. We searched the number of trees in the random forest in the same manner, selecting 150 trees for the sake of parsimony despite marginal improvements in hourly outage correlation by forests with more trees.
LSTMs are capable of and intended for mapping time series of features to, for example, a scalar output such as outage counts. Under an LSTM design, each l-hour weather feature window is batched as a single sample. The feature space can thus be described as sequences of l weather time steps. These sequence samples are then associated with next-hour total outages across CT as the response. We chose as the lookback period for the LSTM as there exists significant cross-correlation of actual outages with state-average wind for lags up to 9 h (Figure 1). The weather forecasts for the lookback period, in addition to the weather forecasts for the current hour, are used to produce the LSTM predictions hereafter. We tuned the architecture of the LSTM, namely the number of hidden layers and the number of nodes per layer, according to a grid search over these parameters. As with the traditional statistical and machine learning models, we used the mean hourly to evaluate performance. However, for tractability, we performed LOSO cross-validation on a total of three thunderstorms, with low (storm “a”), medium (storm “x”), and high (storm “p”) impacts. Based on this search (Supplementary Data File 1), we selected an architecture consisting of 128 LSTM nodes followed by three hidden layers of 128, 64, and 16 regular fully connected nodes, respectively (Supplementary Table S1). Because of the variability of fitting neural networks under different initial conditions, we use the average hourly predictions of five fittings of the LSTM in the results following. The operation of an LSTM unit within a neural network is described mathematically in a dedicated section of the Supplementary Materials.
4. Results
4.1. An Eventwise OPM for the Northeastern United States
To assess the merits of the dynamic, temporally conscious OPMs we introduced, we also include in this study a modified version of an existing eventwise OPM for the northeastern United States. The University of Connecticut (UConn) OPM is an eventwise OPM optimized to predict total storm-caused outages [9,10,11]. It is an operational model used by Eversource Energy to inform response decisions ahead of severe weather events in CT, MA, and NH. We created a modified version of the UConn OPM whose training data is limited to the time period of this data, and whose weather features are derived from HRRR for fair comparison with the dynamic OPMs. Thus, this model is distinct from the UConn OPM described in the literature, and will henceforth be referred to as the Event-OPM. Data from the seven previously mentioned weather features of zero-hour HRRR forecasts at each hour of the 18-h thunderstorms are used as the source weather data for the Event-OPM. The training data is processed at the grid cell level, and features describing infrastructure, land cover, elevation, and vegetation are calculated for each grid cell. Weather features, e.g., wind speed, are aggregated over the course of each storm window for each grid cell. The feature representation is geospatially, not temporally, indexed. There is an entry in the training data for each grid cell for each storm event such that as there are 27 storms and 1385 grid cells in the domain, there are entries in the Event-OPM dataset.
Many grid-cell features are calculated in relation to the infrastructure. Both land cover (NLCD 2011) and elevation data (USGS 1-Arc Second DEM) values are extracted from the area within 60 m of overhead power lines. We calculate the percentage of developed (NLCD types 22, 23, 24) and deciduous forest (NLCD type 41) land cover pixels, as well as the mean elevation of the DEM pixels. To describe infrastructural assets, cutouts, reclosers, and poles are counted within each grid-cell. The leaf area index (LAI) is looked up for each entry from a climatological LAI database computed from 17 years of MODIS observations [11].
Because the Event-OPM renders outage predictions at a coarse temporal resolution, hourly weather data has to be statistically summarized to develop features for modeling. These features include the maximum and total values for 10-m wind speed, wind gust, 1000-m reflectivity, and precipitation derived from 1000-m reflectivity using the Marshall-Palmer Z-R Relationship. The mean value of these features during the four hour peak in wind speed (when the storm is the strongest) were also used. Furthermore, we use the mean relative humidity, range of relative humidity, maximum CAPE, and minimum CIN in this model.
The Event-OPM consists of two tree-based machine learning algorithms to produce outage predictions. We use the floating point outputs of random forest and Bayesian additive regression trees (BART) [36,37], as well as these outputs rounded off to integers to get a set of four predictions for each grid cell. Linear optimization of each model’s outputs with respect to the Nash-Sutcliffe model efficiency coefficient (NSE) [38] is used to combine these models into an ensemble.
4.2. Comparisons of Performance
We now consider the relative performance of the OPMs we presented, both eventwise and dynamic, with respect to several metrics evaluated on the LOSO cross-validation design described in Section 3. There are three categories of performance that are relevant to storm outage predictions: the distribution of the outage time series, the marginal hourly occurrence of outages, and the total number of outage occurrences accumulated over the course of the storm. For time series and hourly metrics, the Event-OPM is assumed to predict outages uniformly over each storm period.
We are careful to not solely consider the hourly error in quantitatively evaluating the ability of dynamic OPMs to describe thunderstorm outage trends. Due to the properties of the Eversource OMS data (namely the significant noise in the hourly outage counts), such an evaluation would mostly consider these models’ understanding of when outages are registered by the OMS system, and not necessarily its understanding of the trends in actual outage occurrences. Instead, we introduce three high-level, distributional characteristics important for utility response planning which are more robust to noise than metrics that measure error only at the hourly level. The expected hour of peak outages is able to provide utilities with an idea of when repair crews should be deployed, and the spread of outages and severe outage duration (SOD) are indications of how long crews should be active (Equations (A1)–(A3) in Appendix A). We present a series of metrics relevant to each of these categories in Table 1.

Table 1.
The performance of each model across several metrics and averaged across storms. From left to right: mean absolute error (MAE) in , MAE in , the of SOD predictions, hourly and NSE, and storm-total , NSE, and MAPE. The MAPE is unavailable for stormwise total outage predictions because there are hours with zero actual outages. Some correlation metrics could not be computed for some models because of constant predictions. The best model for each metric is bolded.
Figure 4 displays a comparison of actual and predicted outages for each hour during the 27 storms in the dataset. The KNN predictions were relatively uniform and are produced separately in Supplementary Figure S2 for readability. Based on outage patterns displayed in Figure 4, one may propose a naïve baseline model that predicts the center hour of the event window as the time to peak. However, in an operational setting the event trigger and the outage peak do not occur at a consistent point relative to the storm duration. Because of the unpredictability of the operational configuration of the event window, such an eventwise OPM would be incapable of providing neither naïve nor informed predictions about the expected time of peak outages for a given storm. For this reason, the skill apparently demonstrated by the Event-OPM with respect to predicting is prone to large uncertainty: the predicted of this model is the expectation of a uniform distribution of outages, i.e., the center hour of the event window.
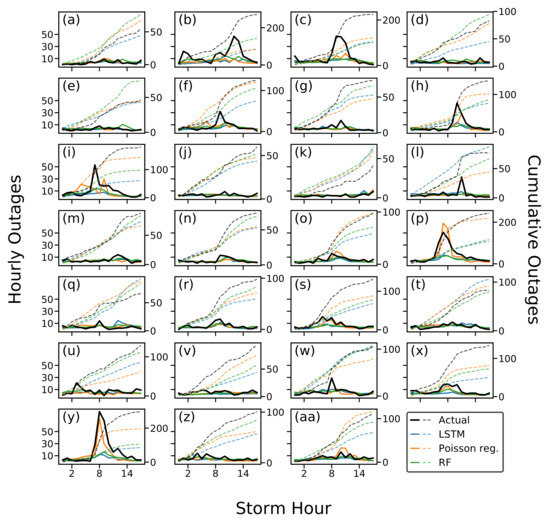
Figure 4.
Hourly (solid) and cumulative (dashed) outages for 27 CT thunderstorms, each lasting 18 h, with corresponding LOSO cross-validated predictions by dynamic models.
5. Discussion
Across the full series of metrics of prediction accuracy, consisting of those related to the time series distribution of outage occurrences, marginal hourly outage occurrences, and storm totals, it appears that the temporally conscious perspective of dynamic OPMs can make substantial improvements over existing eventwise OPMs. The Poisson regression, KNN, random forest, and LSTM models all show substantial improvements relative to the baseline eventwise OPM in predicting the spread of the outage distribution, and often even in total storm outages.
Of the dynamic OPMs, the Poisson regression demonstrates the best performance across most facets of outage prediction, especially total storm outages. It is also capable of capturing unusually large peaks in outages which the other models do not, particularly in storms “p” and “y” (Figure 4). The dynamic OPMs that we developed and the baseline OPM that we tested represent a wide range of model complexity, from KNN regression to an LSTM neural network with thousands of parameters. That Poisson regression regularly outperforms this array of models suggests the assumption of log-linearity between weather features and outage occurrences is a good approximation to true weather-grid interactions. This finding is in agreement with those of a recent study on snow and ice OPMs, in which a Poisson regression model outperformed random forest and BART for a large class of storms [13]. A forecasting error simulation on a well-predicted held out storm suggests that the predictions of the LSTM and random forest are robust to forecasting error (Supplementary Figure S3), although these models may not be as suitable for extrapolation to relatively extreme weather events as linear models (Figure 4). KNN appears largely invariant to perturbations in the features, which we surmise is due to the sparsity of observations in high-dimensional feature spaces such as ours. It is likely that the accuracy of more complex thunderstorm OPMs (e.g., the Event-OPM, LSTM, random forest) in predicting total outage outages will grow steadily as the number of training storms increases [39].
We sought to characterize the association between the meteorological properties and uncertainties of each storm in our dataset and the corresponding average performance of the dynamic OPMs we used to model them. Namely, those storms which are more organized, present a storm front with a strong and consistent gradient of wind gusts, and have cohesive reflectivity are generally better predicted by the dynamics OPMs, as opposed to storms that are isolated systems without distinctive fronts (Figure 5, Supplementary Figures S4 and S5). These storms may also exhibit spatial and temporal weather forecasting errors that propagate to outage prediction. For example, during storm “u” (Figure 5), the outages occurred in the Danbury area, but the HRRR weather forecasts did not predict severe weather in that area, but rather near Litchfield, nearly fifty kilometers away, where there were not many outages.
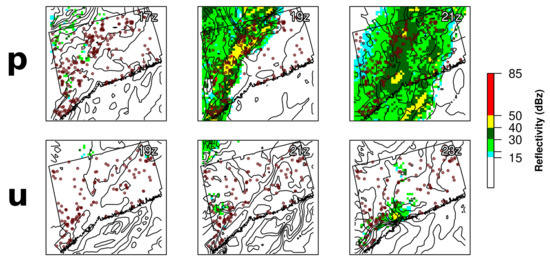
Figure 5.
HRRR-simulated zero-hour reflectivity and contours of wind speed at three hours, overlaid with outage occurrences accumulated over the 18-h period of a well-predicted storm (“p”; average hourly ) on 17 July 2018 (top), and a poorly predicted storm (“u”; average hourly ) on 8 August 2018 (bottom). The center plot for each storm illustrates the hour of peak outages, with the left two hours before, and the right two hours later.
6. Conclusions
A major contribution of this work has been the development of a framework to holistically and flexibly represent spatiotemporal weather features as they pertain to meteorological impacts. These techniques are adaptable to a variety of spatiotemporal, transient, and chaotic systems, where feature engineering is expensive, or where there is a desire to maintain the structure inherent to unengineered data. More specifically, this study demonstrates that it is possible to render moderately accurate temporal forecasts of thunderstorm outages not provided by eventwise OPMs. Using our approach, utilities are able to plan how many repair crews should be deployed, as well as when and for how long those crews should be deployed. All of the models we developed were built on a nationally available weather forecasting resource. The dynamic framework can be directly applied to any region in the US for which outage data at a reasonably fine temporal resolution exists. We suggest continuation of this work to include customer outages from non-utility sources as a way to demonstrate scalability of this framework beyond the US northeastern states.
We showed that dynamic OPMs can substantially outperform complex eventwise OPMs in terms of predicting total thunderstorm outages by comparing against a version of a state-of-the-art eventwise OPM modified for this noisy and data-limited problem. Our results indicate that complex machine models, some dynamic OPMs we developed among them, are not yet superior for high-resolution thunderstorm datasets such as the one used in this study, but that generalized linear models provide a good approximation of weather-grid interactions as these datasets grow. Simulation results suggest that linear models are particularly susceptible to forecast errors. Extensions of the dynamic framework may derive probabilistic estimates of outages that account for uncertainty in the weather inputs and modeling. Our meteorological analysis of poorly and well-predicted highlights the need to understand how spatial and temporal errors in weather forecasts of convective events propagate to OPMs.
We employed a leave-one-storm-out evaluation technique. There are two main sources of contamination from future periods in the training set: changes in power infrastructure and climatic trends. Climatic trends are by definition long-term and not prevalent in a dataset of only three years. Of greater concern are infrastructure conditions, which may be significantly impacted by tree trimming programs and other upgrades to grid resilience [17,22]. Future work with longer datasets may incorporate an objective date/time feature or employ evaluation procedures that maintain the chronological order of training and test data.
Future studies may attempt to increase the spatial resolution of dynamic thunderstorm OPMs. Although statewide outage predictions are valuable in operational settings for determining how many crews to stage, predictions on the town or division level can help utilities determine where to stage them. The main limitation for adopting this forecasting approach in this study was the small size of the dataset. This limitation is exacerbated by the large number of features created by associating each weather feature with each town in the service territory, but may be remedied in future work by computer vision approaches.
Supplementary Materials
The following are available online at https://www.mdpi.com/2571-9394/2/2/8/s1. The hourly weather and outage data used in this study, as well as the computer code for the dynamic OPMs are freely available at: https://github.com/berkalpay/dynamic-tstorm-opm.
Author Contributions
Conceptualization, B.A.A., D.W., and E.A.; Data curation, B.A.A. and P.W.; Formal analysis, B.A.A., D.C., and E.A.; Funding acquisition, E.A.; Investigation, B.A.A. and P.W.; Methodology, B.A.A., D.W., G.L., and E.A.; Project administration, D.W. and E.A.; Software, B.A.A. and P.W.; Validation, B.A.A.; Visualization, B.A.A. and P.W.; Writing—Original draft, B.A.A., P.W., D.C., and G.L.; Writing—Review & editing, B.A.A., D.W., P.W., D.C., G.L., and E.A. All authors have read and agreed to the published version of the manuscript.
Funding
Eversource Energy, the Eversource Energy Center at the University of Connecticut, and the University of Connecticut’s Holster Scholarship.
Acknowledgments
We thank Eversource Energy for its contribution of data to this study. HRRR forecasts are produced by the National Oceanic and Atmospheric Administration.
Conflicts of Interest
E.A., D.C., D.W., and P.W. hold stock in ACW Analytics.
Appendix A
We can evaluate the performance of OPMs with regard to the predicted outage distribution by considering each 18-h thunderstorm outage time series as a probability mass. The expected hour of peak outages of a particular storm can thus be computed as
and the variance of the outage distribution as
where is the length in hours of the storm and is the outage count at hour i of the storm. We define the severe outage duration as the number of hours, during a given storm, with more than 10 outages, i.e.,
where if , and otherwise.
References
- Campbell, R.J. Weather-Related Power Outages and Electric System Resiliency; Congressional Research Service, Library of Congress: Washington, DC, USA, 2012. [Google Scholar]
- Liu, H.; Davidson, R.A.; Rosowsky, D.V.; Stedinger, J.R. Negative binomial regression of electric power outages in hurricanes. J. Infrastruct. Syst. 2005, 11, 258–267. [Google Scholar] [CrossRef]
- Han, S.R.; Guikema, S.D.; Quiring, S.M.; Lee, K.H.; Rosowsky, D.; Davidson, R.A. Estimating the spatial distribution of power outages during hurricanes in the Gulf coast region. Reliab. Eng. Syst. Saf. 2009, 94, 199–210. [Google Scholar] [CrossRef]
- Nateghi, R.; Guikema, S.D.; Quiring, S.M. Comparison and validation of statistical methods for predicting power outage durations in the event of hurricanes. Risk Anal. Int. J. 2011, 31, 1897–1906. [Google Scholar] [CrossRef] [PubMed]
- Guikema, S.D.; Quiring, S.M. Hybrid data mining-regression for infrastructure risk assessment based on zero-inflated data. Reliab. Eng. Syst. Saf. 2012, 99, 178–182. [Google Scholar] [CrossRef]
- Nateghi, R.; Guikema, S.; Quiring, S.M. Power outage estimation for tropical cyclones: Improved accuracy with simpler models. Risk Anal. 2014, 34, 1069–1078. [Google Scholar] [CrossRef] [PubMed]
- Yue, M.; Toto, T.; Jensen, M.P.; Giangrande, S.E.; Lofaro, R. A Bayesian Approach Based Outage Prediction in Electric Utility Systems Using Radar Measurement Data. IEEE Trans. Smart Grid 2017, 9, 6149–6159. [Google Scholar] [CrossRef]
- Wanik, D.; Anagnostou, E.; Astitha, M.; Hartman, B.; Lackmann, G.; Yang, J.; Cerrai, D.; He, J.; Frediani, M. A Case Study on Power Outage Impacts from Future Hurricane Sandy Scenarios. J. Appl. Meteorol. Climatol. 2018, 57, 51–79. [Google Scholar] [CrossRef]
- Wanik, D.; Anagnostou, E.; Hartman, B.; Frediani, M.; Astitha, M. Storm outage modeling for an electric distribution network in Northeastern USA. Nat. Hazards 2015, 79, 1359–1384. [Google Scholar] [CrossRef]
- He, J.; Wanik, D.W.; Hartman, B.M.; Anagnostou, E.N.; Astitha, M.; Frediani, M.E. Nonparametric Tree-Based Predictive Modeling of Storm Outages on an Electric Distribution Network. Risk Anal. 2017, 37, 441–458. [Google Scholar] [CrossRef]
- Cerrai, D.; Wanik, D.W.; Bhuiyan, M.A.E.; Zhang, X.; Yang, J.; Frediani, M.E.; Anagnostou, E.N. Predicting Storm Outages Through New Representations of Weather and Vegetation. IEEE Access 2019, 7, 29639–29654. [Google Scholar] [CrossRef]
- Kabir, E.; Guikema, S.D.; Quiring, S.M. Predicting Thunderstorm-Induced Power Outages to Support Utility Restoration. IEEE Trans. Power Systems 2019, 34, 4370–4381. [Google Scholar] [CrossRef]
- Cerrai, D.; Koukoula, M.; Watson, P.; Anagnostou, E.N. Outage prediction models for snow and ice storms. Sustain. Energy Grids Netw. 2020, 21, 100294. [Google Scholar] [CrossRef]
- Guikema, S.D.; Davidson, R.A.; Liu, H. Statistical models of the effects of tree trimming on power system outages. IEEE Trans. Power Deliv. 2006, 21, 1549–1557. [Google Scholar] [CrossRef]
- Wanik, D.; Anagnostou, E.; Hartman, B.; Layton, T. Estimated Time of Restoration (ETR) Guidance for Electric Distribution Networks. J. Homel. Secur. Emerg. Manag. 2018, 15. [Google Scholar] [CrossRef]
- Walsh, T.; Layton, T.; Wanik, D.; Mellor, J. Agent Based Model to Estimate Time to Restoration of Storm-Induced Power Outages. Infrastructures 2018, 3, 33. [Google Scholar] [CrossRef]
- Cerrai, D.; Watson, P.; Anagnostou, E.N. Assessing the effects of a vegetation management standard on distribution grid outage rates. Electr. Power Syst. Res. 2019, 175, 105909. [Google Scholar] [CrossRef]
- Benjamin, S.G.; Weygandt, S.S.; Brown, J.M.; Hu, M.; Alexander, C.R.; Smirnova, T.G.; Olson, J.B.; James, E.P.; Dowell, D.C.; Grell, G.A.; et al. A North American hourly assimilation and model forecast cycle: The Rapid Refresh. Mon. Weather Rev. 2016, 144, 1669–1694. [Google Scholar] [CrossRef]
- Skamarock, W.; Klemp, J.; Dudhia, J.; Gill, D.; Barker, D.; Wang, W.; Powers, J. A Description of the Advanced Research WRF Version 3; University Corporation for Atmospheric Research: Boulder, CO, USA, 2008; Volume 27, pp. 3–27. [Google Scholar]
- Quiring, S.M.; Zhu, L.; Guikema, S.D. Importance of soil and elevation characteristics for modeling hurricane-induced power outages. Nat. Hazards 2011, 58, 365–390. [Google Scholar] [CrossRef]
- Cole, T.A.; Wanik, D.W.; Molthan, A.L.; Román, M.O.; Griffin, R.E. Synergistic use of nighttime satellite data, electric utility infrastructure, and ambient population to improve power outage detections in urban areas. Remote. Sens. 2017, 9, 286. [Google Scholar] [CrossRef]
- Wanik, D.; Parent, J.; Anagnostou, E.; Hartman, B. Using vegetation management and LiDAR-derived tree height data to improve outage predictions for electric utilities. Electr. Power Syst. Res. 2017, 146, 236–245. [Google Scholar] [CrossRef]
- Guikema, S.D.; Nateghi, R.; Quiring, S.M.; Staid, A.; Reilly, A.C.; Gao, M. Predicting Hurricane Power Outages to Support Storm Response Planning. IEEE Access 2014, 2, 1364–1373. [Google Scholar] [CrossRef]
- Mensah, A.F.; Dueñas-Osorio, L. Outage predictions of electric power systems under Hurricane winds by Bayesian networks. In Proceedings of the 2014 International Conference on Probabilistic Methods Applied to Power Systems (PMAPS), Durham, UK, 7–10 July 2014; pp. 1–6. [Google Scholar]
- Li, G.; Zhang, P.; Luh, P.B.; Li, W.; Bie, Z.; Serna, C.; Zhao, Z. Risk analysis for distribution systems in the northeast US under wind storms. IEEE Trans. Power Syst. 2013, 29, 889–898. [Google Scholar] [CrossRef]
- Yao, R.; Sun, K. Towards Simulation and Risk Assessment of Weather-Related Outages. IEEE Trans. Smart Grid 2018, 10, 4391–4400. [Google Scholar] [CrossRef]
- Yang, M.; Wang, J.; Diao, H.; Qi, J.; Han, X. Interval estimation for conditional failure rates of transmission lines with limited samples. IEEE Trans. Smart Grid 2016, 9, 2752–2763. [Google Scholar] [CrossRef]
- Li, H.; Treinish, L.A.; Hosking, J.R. A statistical model for risk management of electric outage forecasts. IBM J. Res. Dev. 2010, 54, 8:1–8:11. [Google Scholar] [CrossRef]
- Liu, H.; Davidson, R.A.; Apanasovich, T.V. Statistical forecasting of electric power restoration times in hurricanes and ice storms. IEEE Trans. Power Syst. 2007, 22, 2270–2279. [Google Scholar] [CrossRef]
- Hochreiter, S.; Schmidhuber, J. LSTM can solve hard long time lag problems. In Advances in Neural Information Processing Systems; MIT Press: Cambridge, MA, USA, 1997; pp. 473–479. [Google Scholar]
- Zaytar, M.A.; El Amrani, C. Sequence to sequence weather forecasting with long short term memory recurrent neural networks. Int. J. Comput. Appl. 2016, 143, 7–11. [Google Scholar]
- Goodfellow, I.; Bengio, Y.; Courville, A.; Bengio, Y. Deep Learning; MIT Press: Cambridge, MA, USA, 2016; Volume 1. [Google Scholar]
- Chollet, F. Keras. 2015. Available online: https://keras.io (accessed on 21 May 2020).
- Pedregosa, F.; Varoquaux, G.; Gramfort, A.; Michel, V.; Thirion, B.; Grisel, O.; Blondel, M.; Prettenhofer, P.; Weiss, R.; Dubourg, V.; et al. Scikit-learn: Machine Learning in Python. J. Mach. Learn. Res. 2011, 12, 2825–2830. [Google Scholar]
- Horel, J.; Baylock, B. Archive of the High Resolution Rapid Refresh Model; University of Utah: Salt Lake City, UT, USA, 2015. [Google Scholar]
- Chipman, H.A.; George, E.I.; McCulloch, R.E. BART: Bayesian additive regression trees. Ann. Appl. Stat. 2010, 4, 266–298. [Google Scholar] [CrossRef]
- Kapelner, A.; Bleich, J. bartMachine: Machine learning with Bayesian additive regression trees. arXiv 2013, arXiv:1312.2171. [Google Scholar] [CrossRef]
- Nash, J.E.; Sutcliffe, J.V. River flow forecasting through conceptual models part I—A discussion of principles. J. Hydrol. 1970, 10, 282–290. [Google Scholar] [CrossRef]
- Yang, F.; Wanik, D.W.; Cerrai, D.; Bhuiyan, M.A.E.; Anagnostou, E.N. Quantifying Uncertainty in Machine Learning-Based Power Outage Prediction Model Training: A Tool for Sustainable Storm Restoration. Sustainability 2020, 12, 1525. [Google Scholar] [CrossRef]
© 2020 by the authors. Licensee MDPI, Basel, Switzerland. This article is an open access article distributed under the terms and conditions of the Creative Commons Attribution (CC BY) license (http://creativecommons.org/licenses/by/4.0/).