Revisiting the Dynamic Linkages of Treasury Bond Yields for the BRICS: A Forecasting Analysis
Abstract
1. Introduction
2. Literature Review
3. Methodology
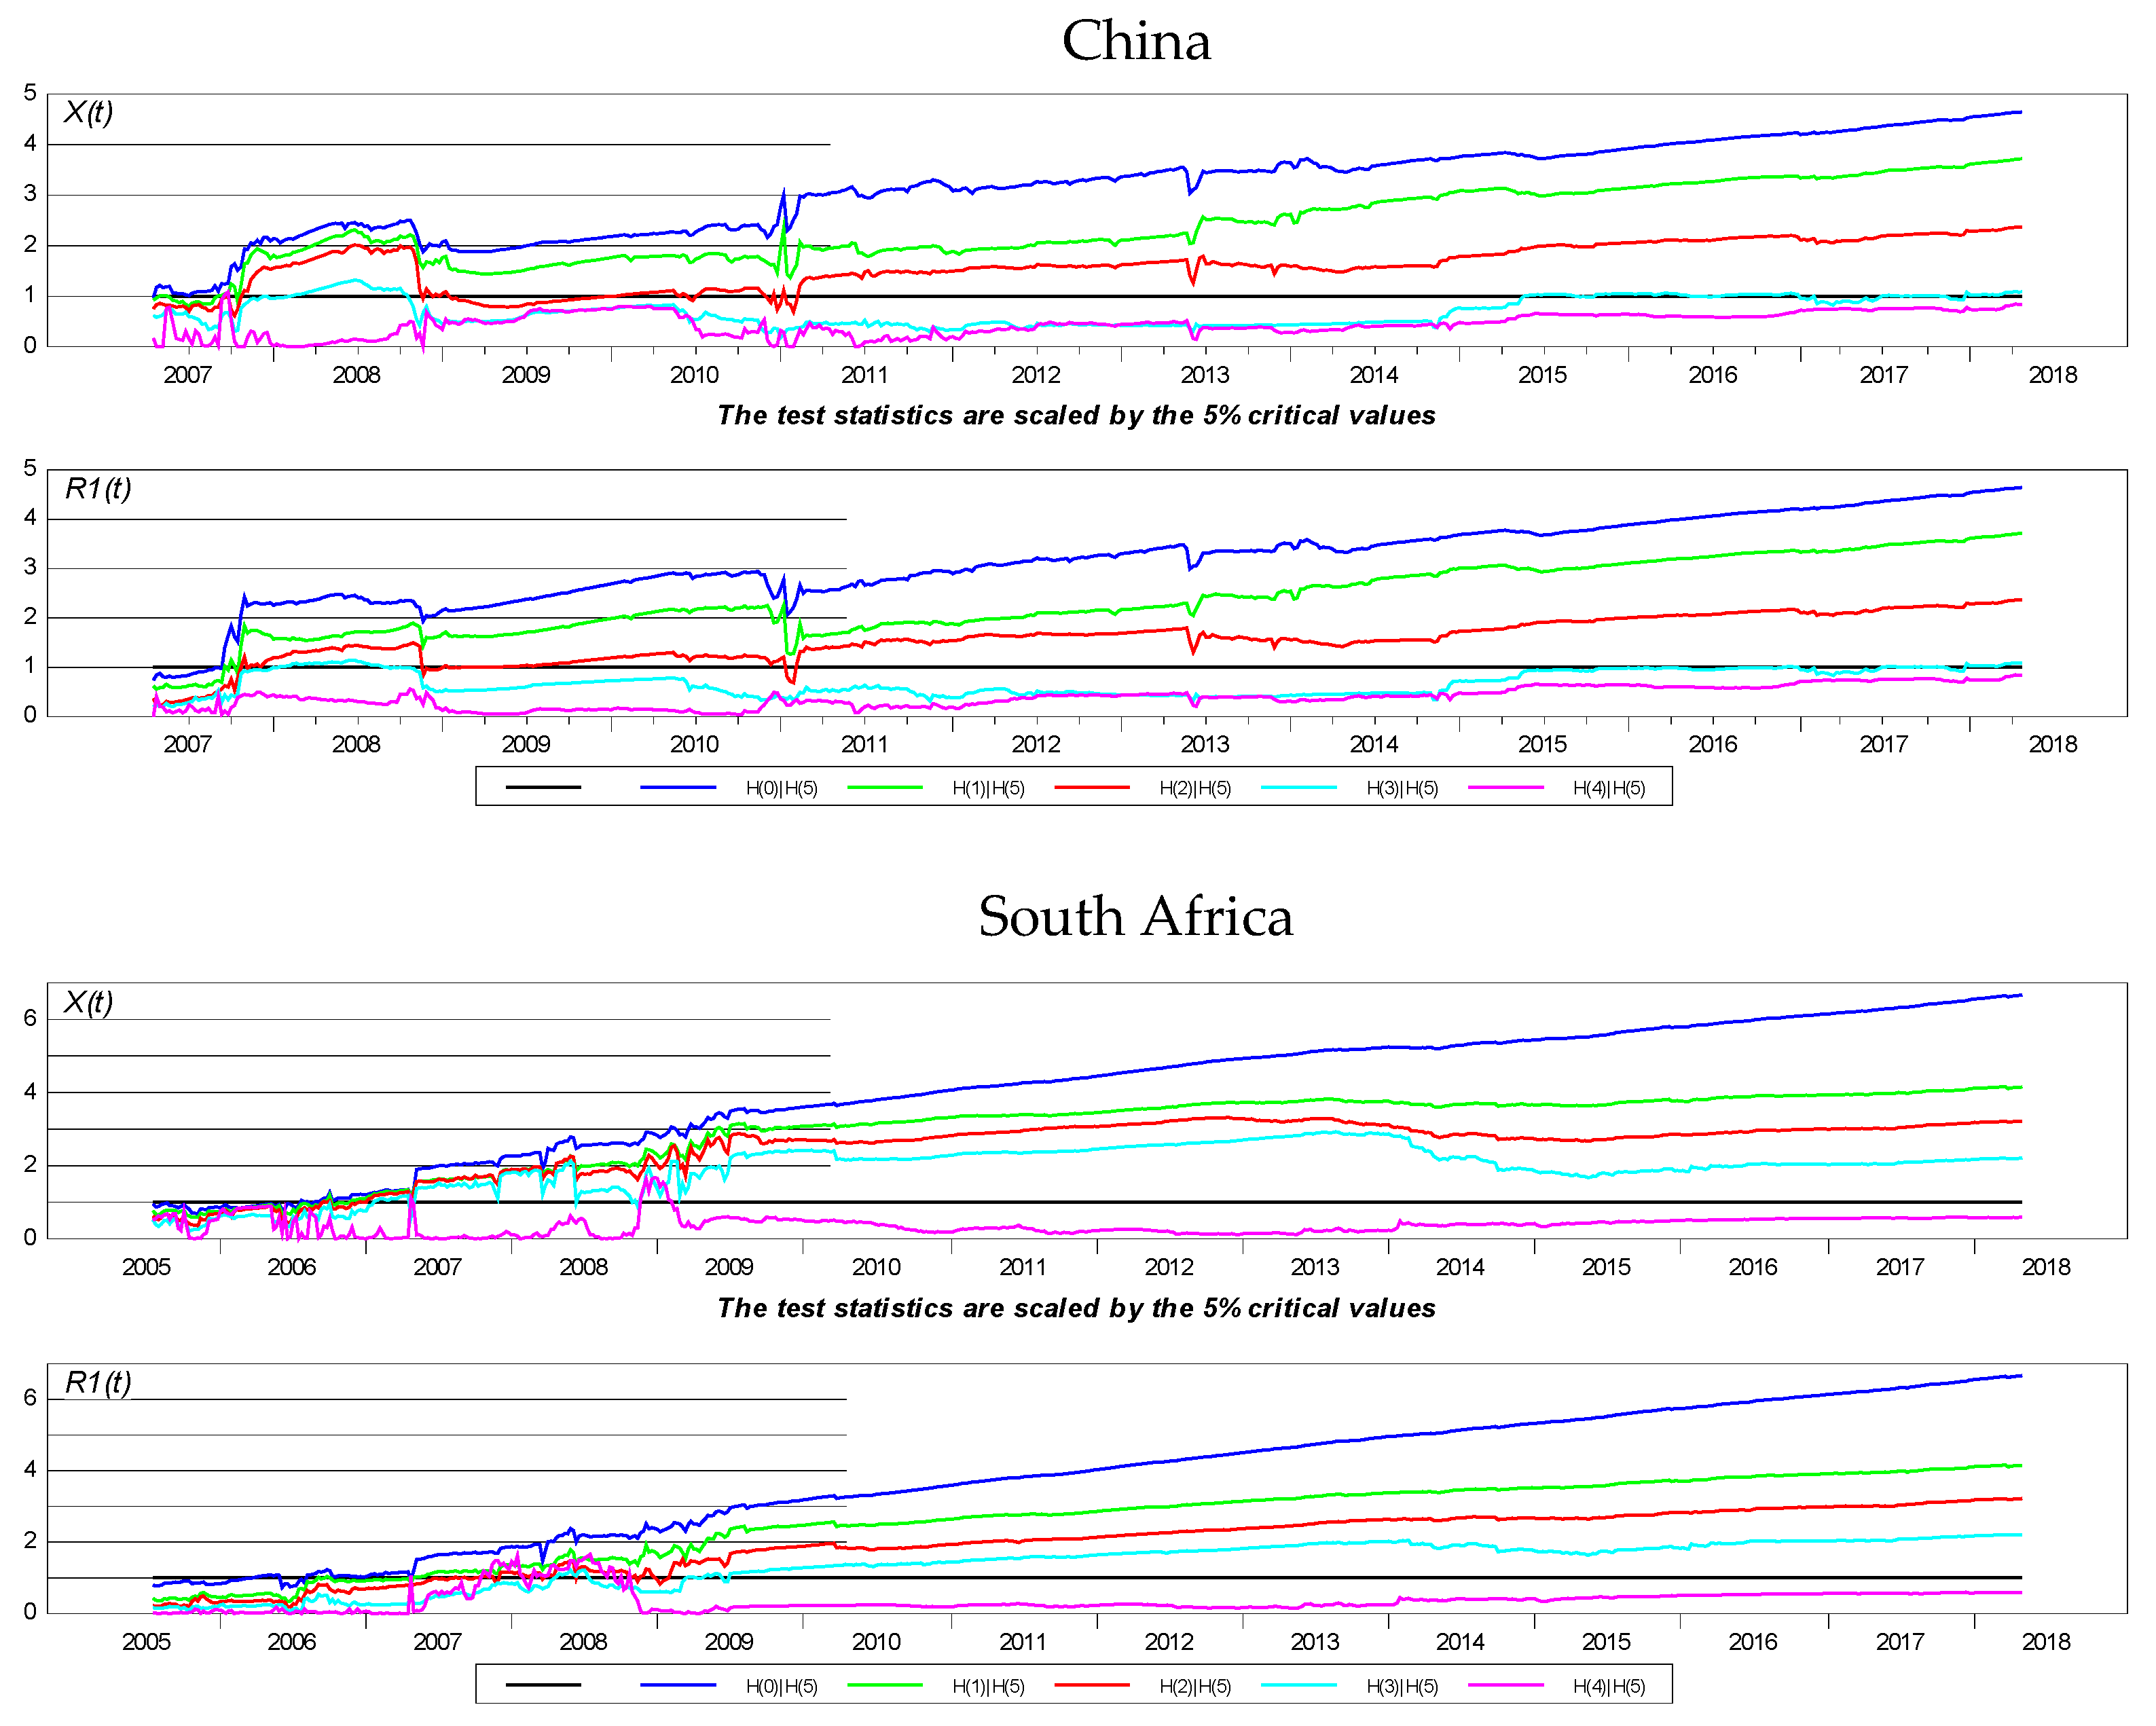
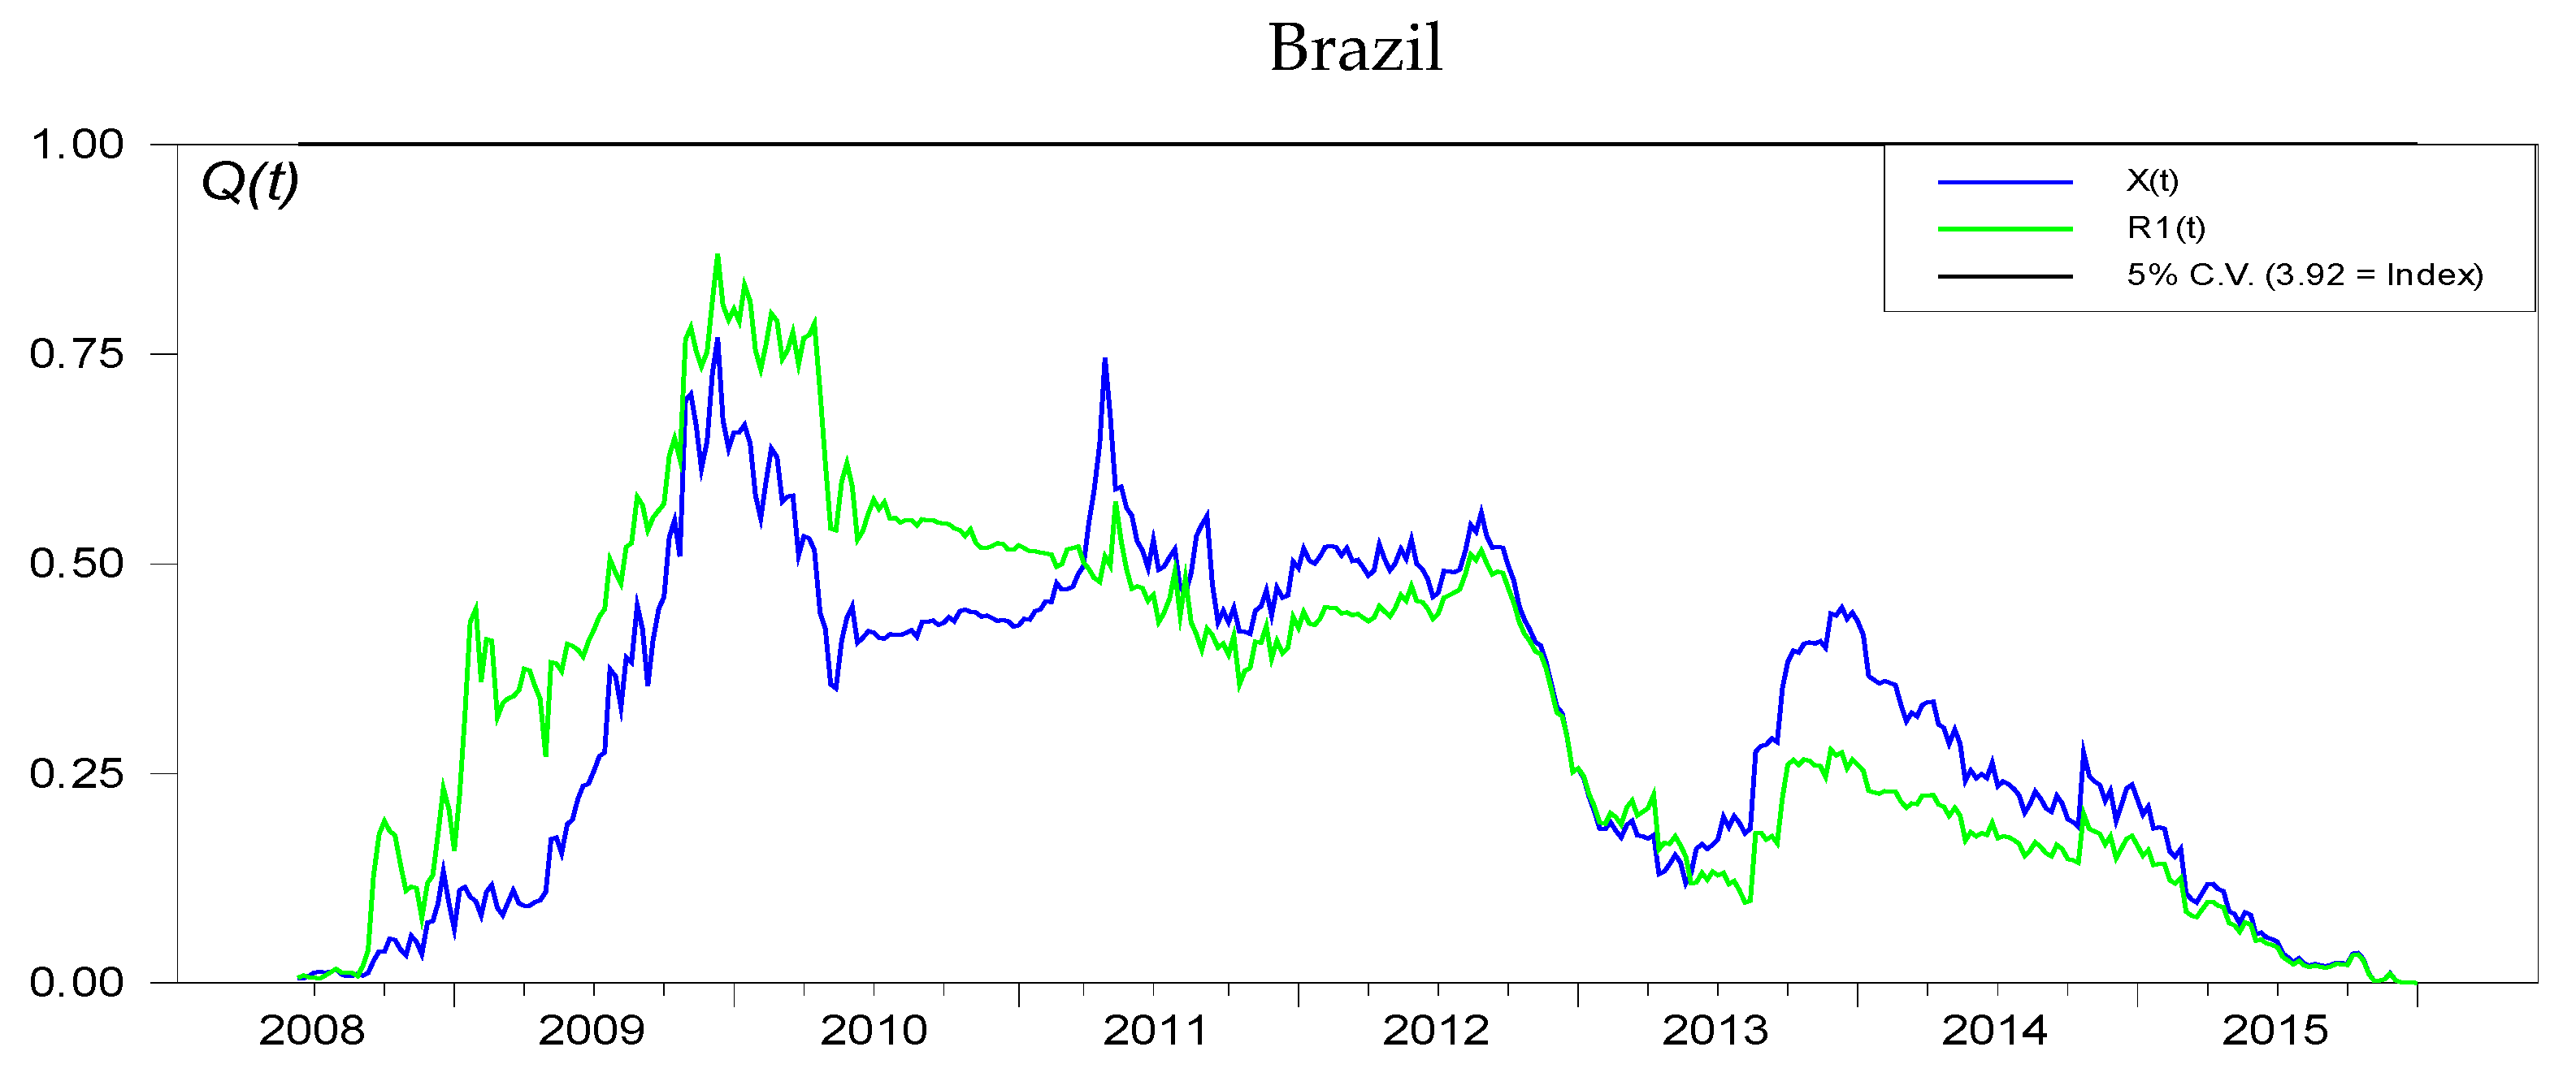
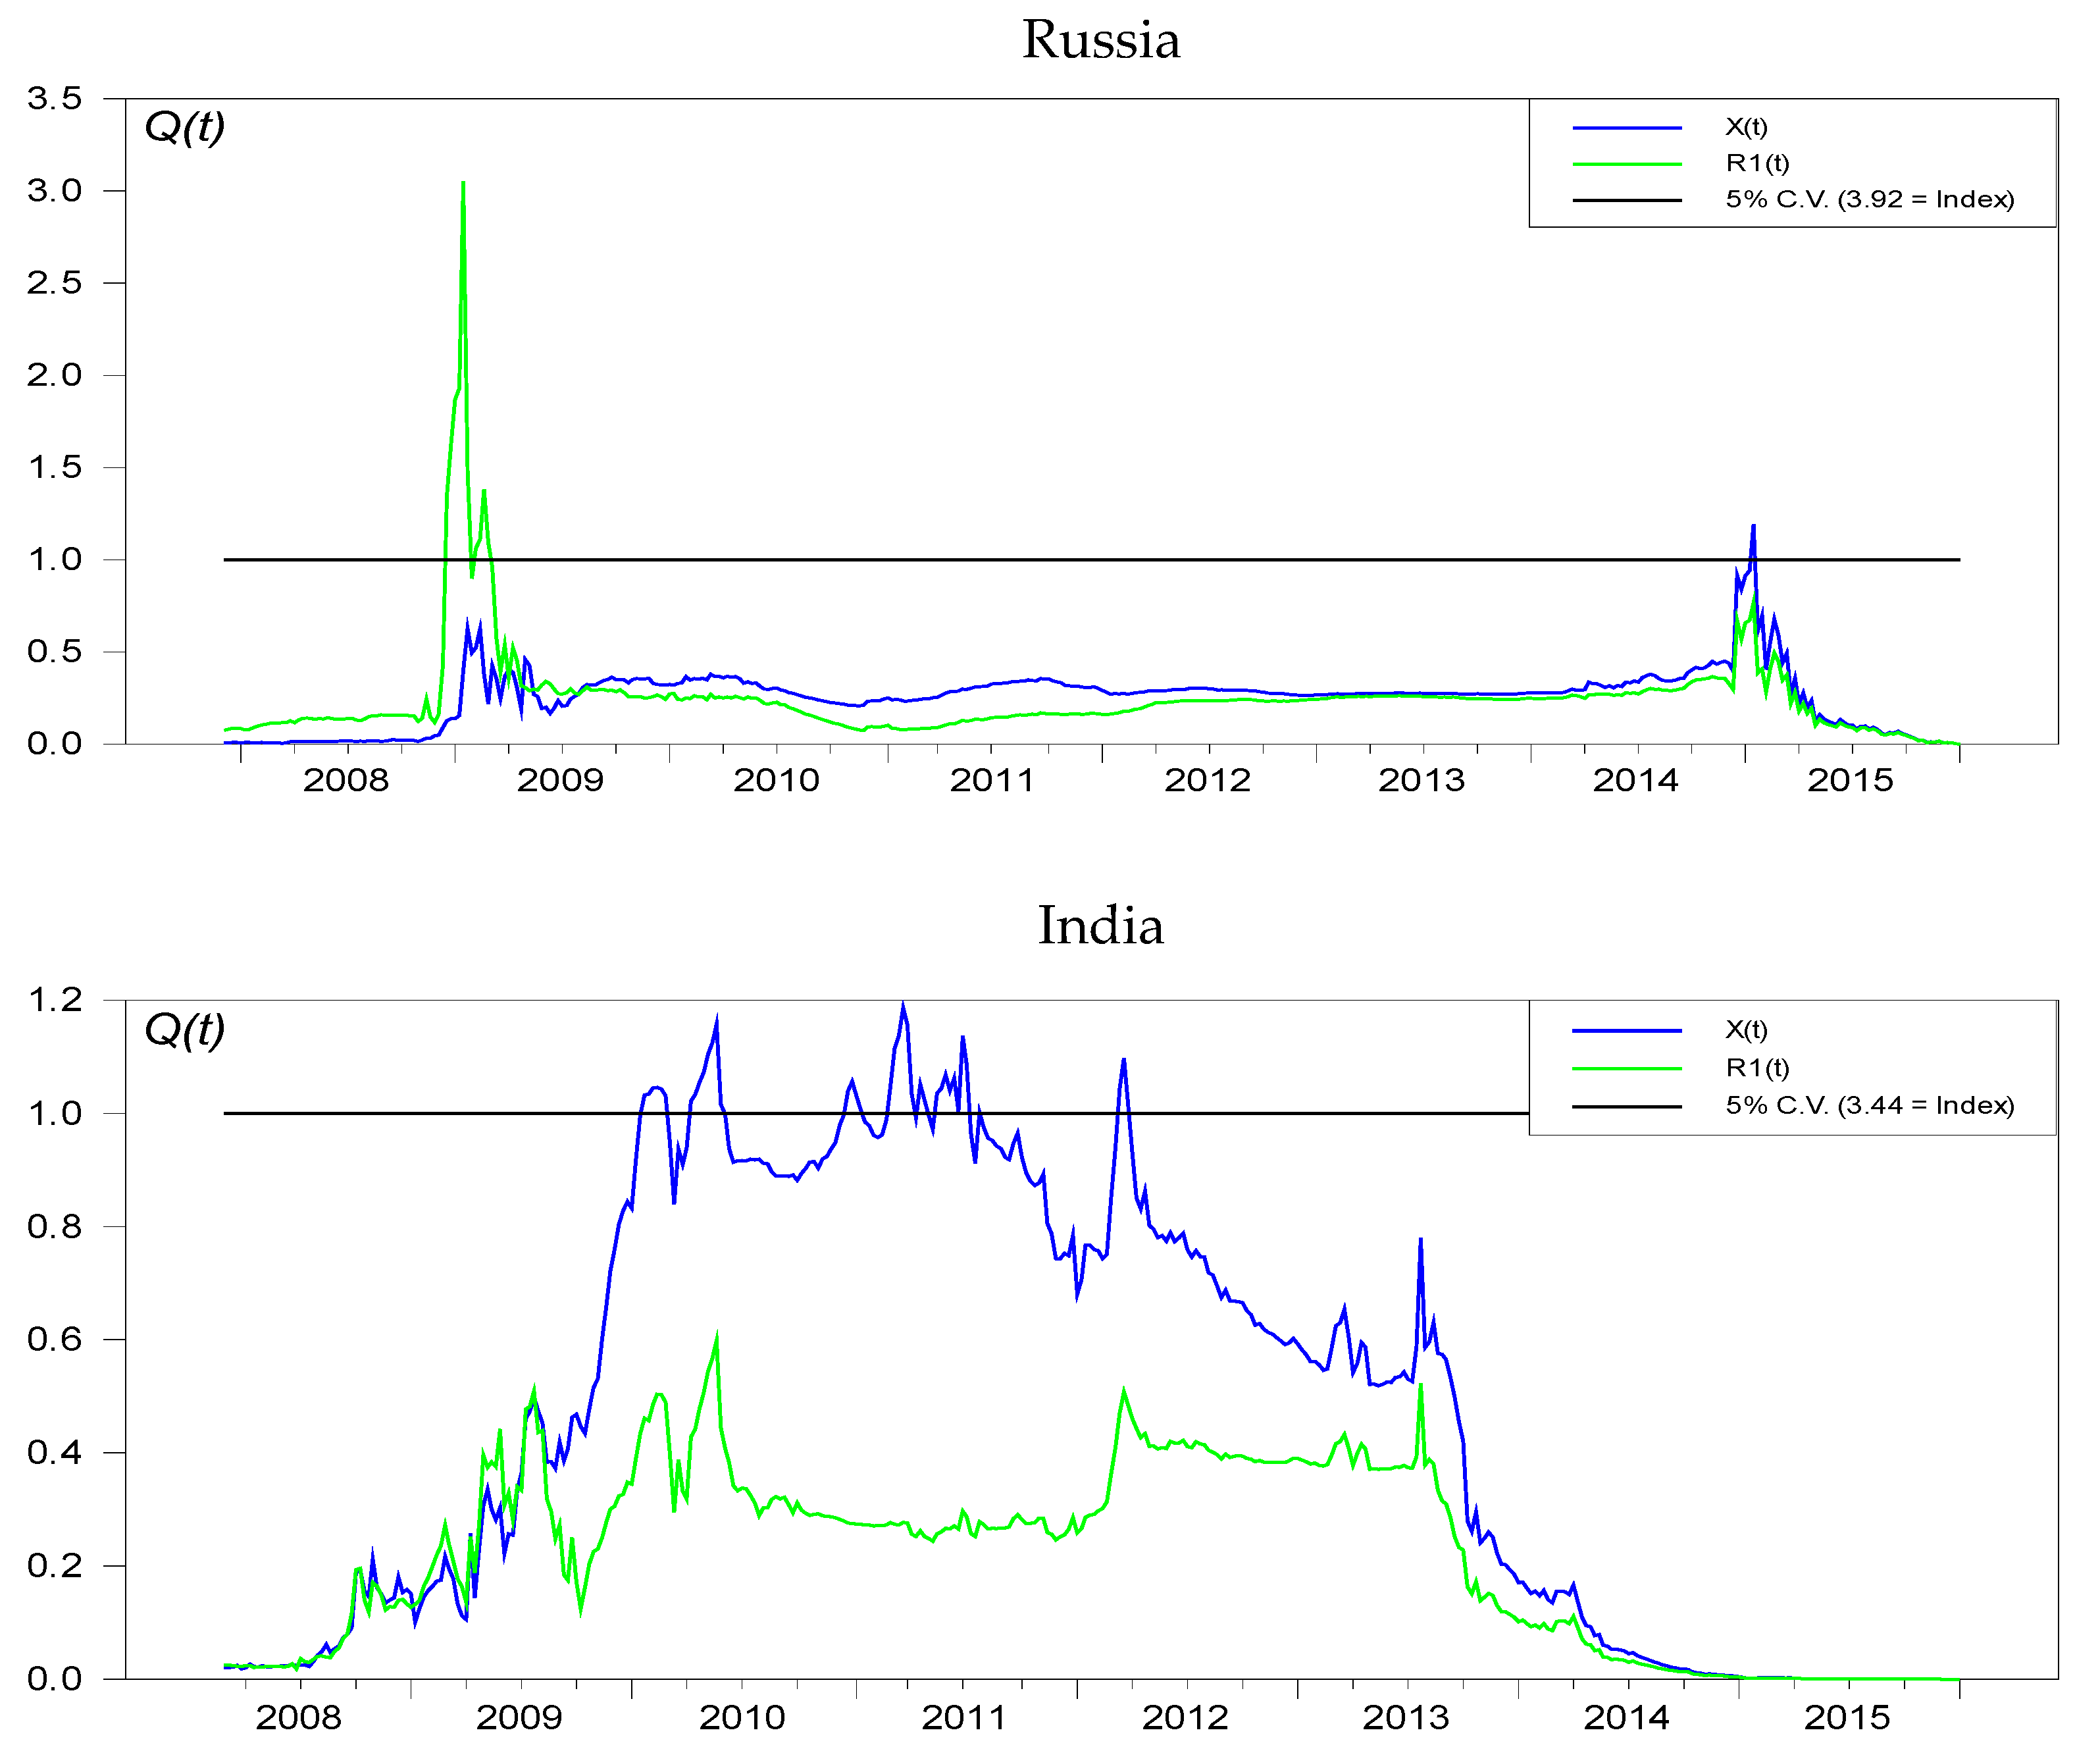
3.1. Cointegration Analysis
3.2. Asymmetric Markov Switching Equilibrium-Correction Modeling
3.3. Forecastability Testing
4. Data and Empirical Results
4.1. Data and Preliminary Analysis
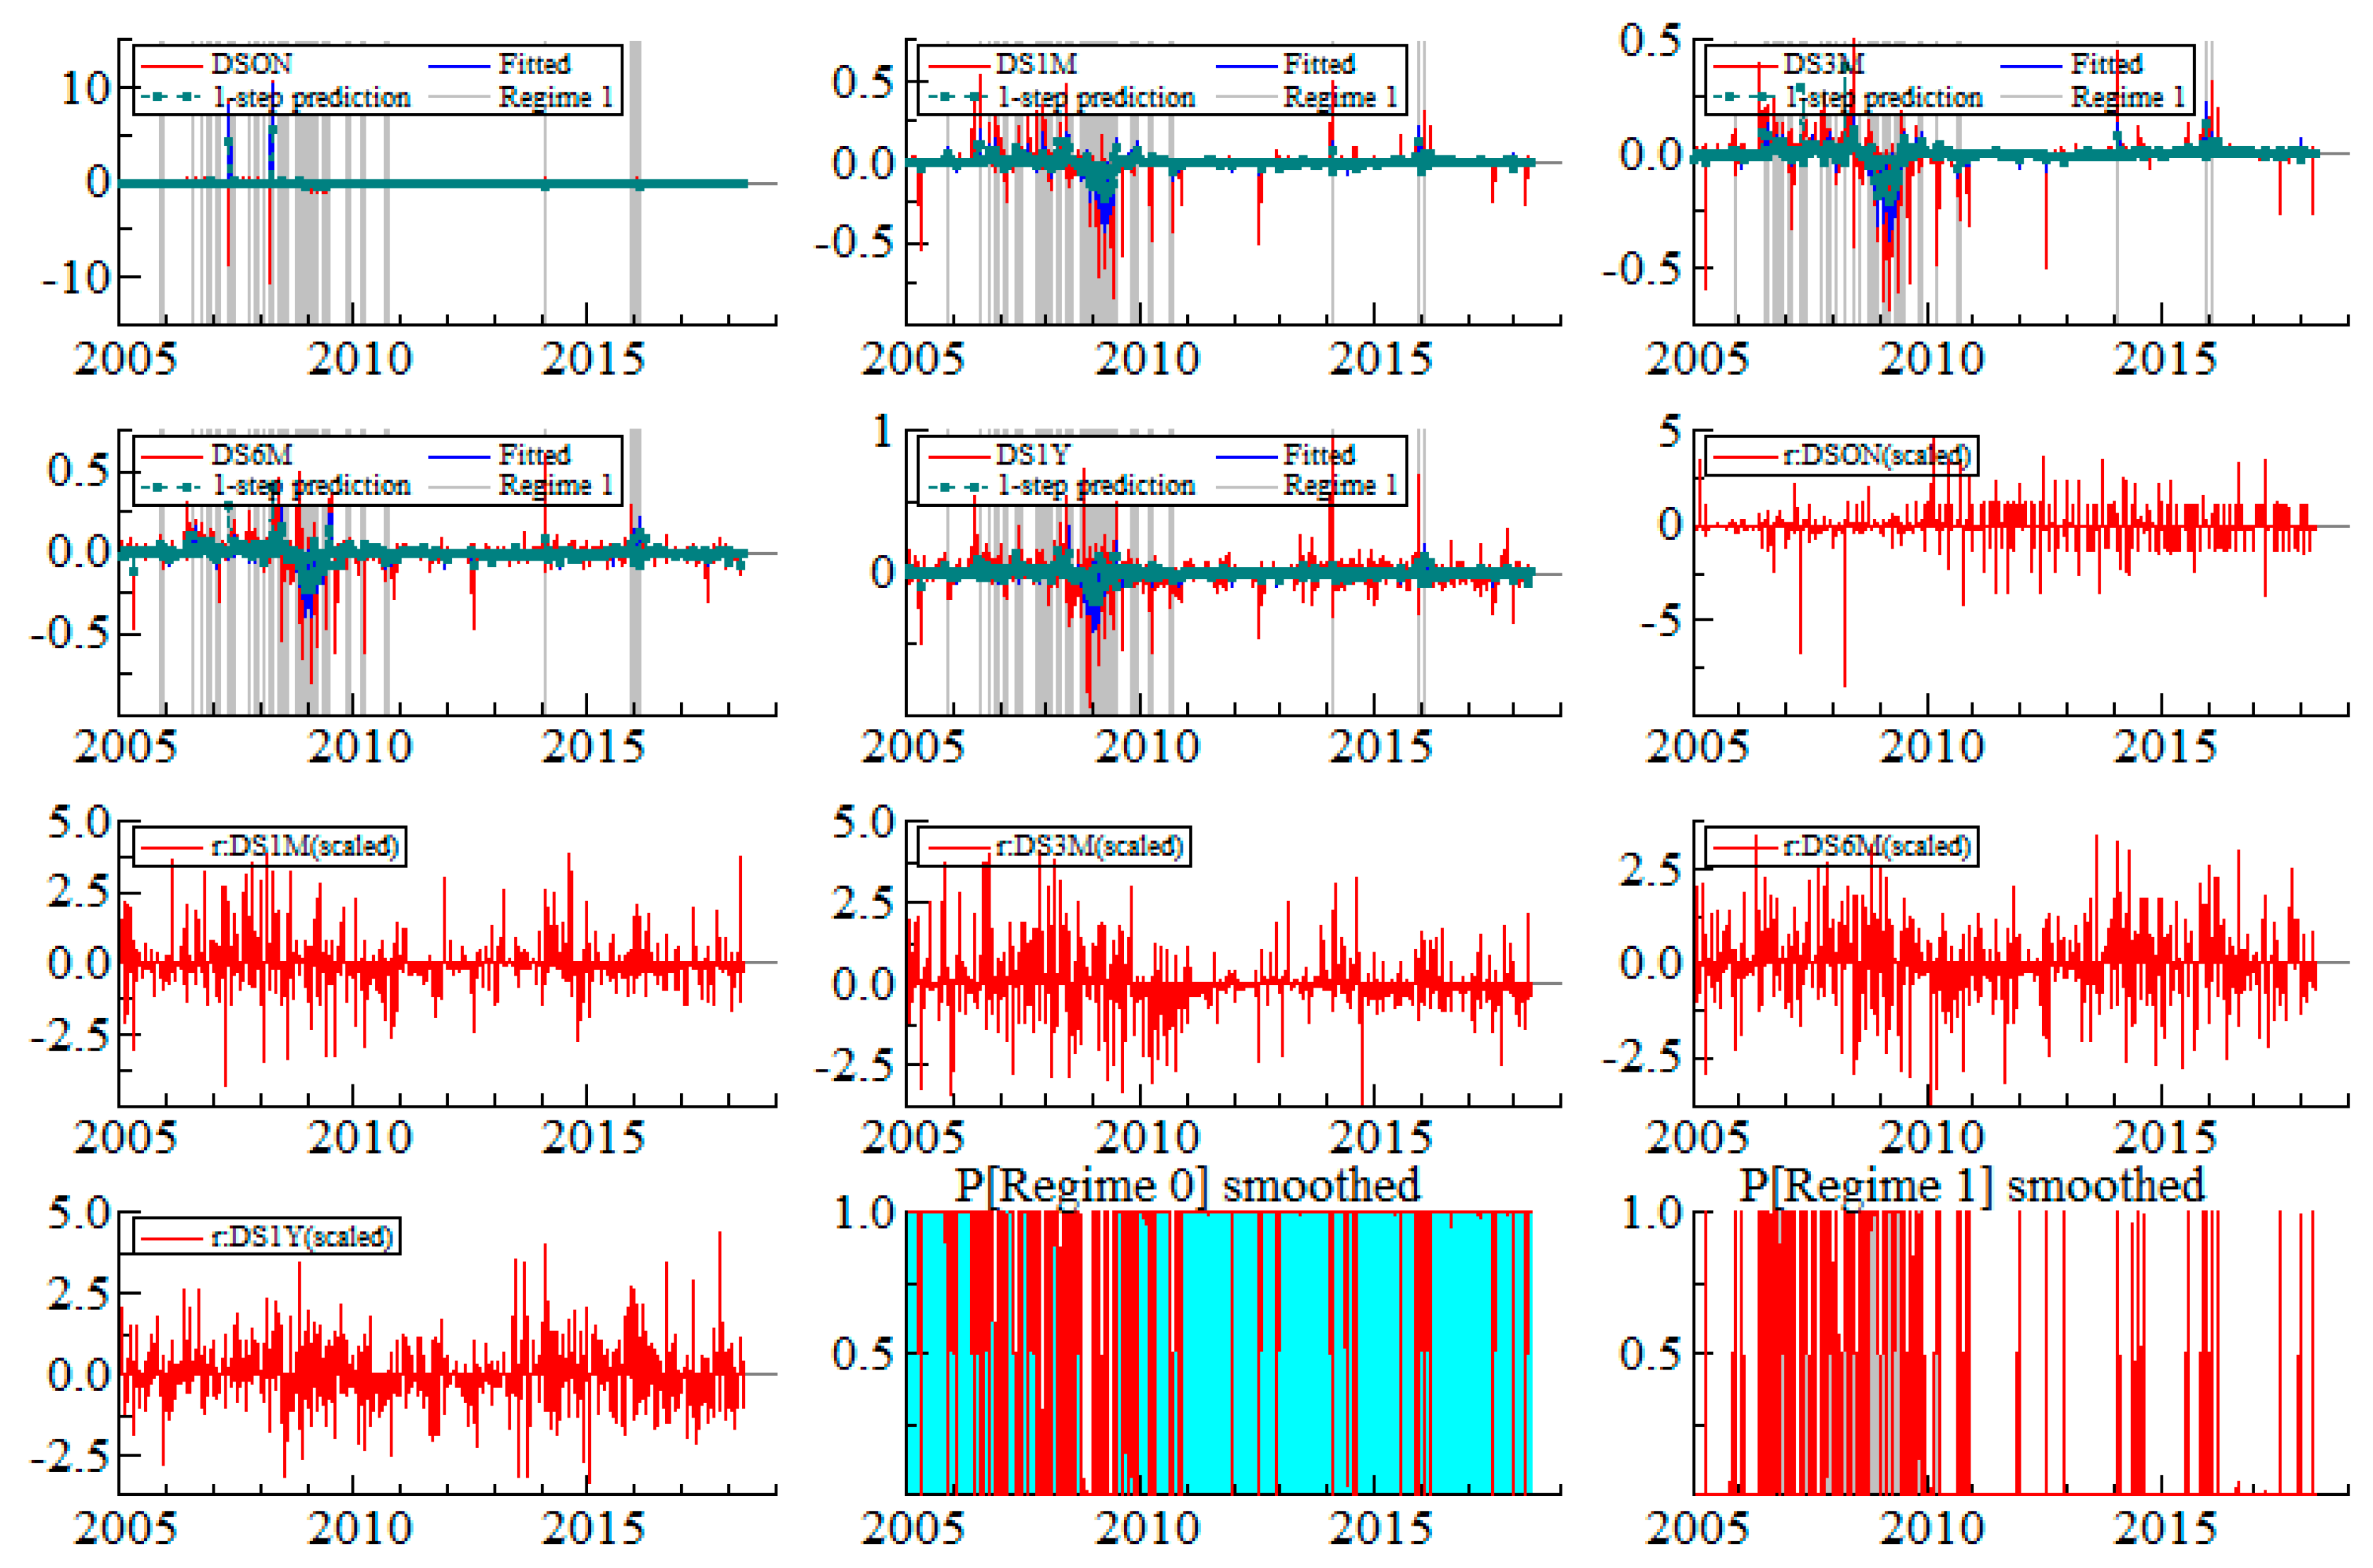
4.2. MSIAH-VECM Estimation Results
4.3. Forecasting the Term Structure of Interest Rates with the MSIAH-VECM
5. Discussion and Future Research Directions
6. Conclusions and Limitations
Author Contributions
Funding
Acknowledgments
Conflicts of Interest
Appendix A




Appendix B
| Brazil | Russia | India | China | South Africa | |||||||||||||||||||||
|---|---|---|---|---|---|---|---|---|---|---|---|---|---|---|---|---|---|---|---|---|---|---|---|---|---|
| Descriptive Stats | |||||||||||||||||||||||||
| Min | 6.400 | 2.538 | 3.055 | 3.519 | 3.930 | 1.450 | 2.730 | 3.730 | 0.000 | 4.350 | 0.25 | 3.550 | 3.100 | 0.01 | 3.500 | 0.800 | 1.013 | 1.204 | 1.465 | 1.850 | −0.001 | 4.930 | 5.063 | 5.213 | 5.350 |
| Max | 19.76 | 17.11 | 17.14 | 17.67 | 15.09 | 25.00 | 29.15 | 29.92 | 30.31 | 30.00 | 50.0 | 14.62 | 11.30 | 12.00 | 10.15 | 8.528 | 9.698 | 6.389 | 5.510 | 5.255 | 11.70 | 12.20 | 12.57 | 13.14 | 13.94 |
| Mean | 11.80 | 9.112 | 9.044 | 9.143 | 9.458 | 7.199 | 7.831 | 1.997 | 8.357 | 8.939 | 6.61 | 7.470 | 7.051 | 7.172 | 7.202 | 2.391 | 3.620 | 3.763 | 3.773 | 3.919 | 6.750 | 7.066 | 7.223 | 7.553 | 7.937 |
| Std. Dev. | 3.156 | 2.866 | 2.750 | 2.708 | 2.574 | 3.348 | 4.032 | 4.191 | 4.405 | 3.968 | 2.58 | 2.584 | 1.613 | 1.568 | 1.370 | 0.992 | 1.337 | 1.189 | 1.077 | 0.994 | 1.871 | 1.878 | 1.886 | 1.843 | 1.853 |
| Skewness | 0.647 | −0.229 | −0.16 | −0.18 | −0.34 | 1.002 | 1.680 | 1.888 | 1.732 | 2.601 | 0.54 | 0.006 | −0.122 | −0.091 | −0.06 | 1.961 | 0.546 | −0.32 | −0.51 | −0.52 | 0.106 | 0.107 | 0.152 | 0.163 | 0.162 |
| Kurtosis | 0.226 | −0.531 | −0.51 | −0.72 | −0.71 | 2.080 | 3.976 | 4.755 | 4.085 | 8.485 | −1.73 | −1.798 | −1.781 | −1.669 | −1.61 | 8.736 | 1.125 | −0.68 | −0.81 | −0.99 | −1.305 | −1.272 | −1.17 | −1.09 | −1.03 |
| D-W | 2.013 | 2.482 | 2.399 | 2.093 | 2.472 | 2.305 | 1.943 | 1.914 | 1.864 | 2.415 | 2.23 | 2.203 | 1.816 | 1.952 | 1.769 | 2.165 | 2.052 | 1.988 | 1.816 | 1.859 | 2.456 | 1.696 | 1.527 | 1.684 | 1.836 |
| Jarque-Bera | 50.06 | 11.36 | 8.607 | 15.06 | 21.49 | 199.8 | 769.3 | 1046.7 | 736.7 | 2873 | 26.2 | 25.98 | 27.98 | 24.43 | 22.62 | 2308 | 61.98 | 22.26 | 42.94 | 53.07 | 24.03 | 36.34 | 24.49 | 24.16 | 22.12 |
| N-Test | 93.75 | 172.7 | 93.36 | 93.18 | 79.38 | 84.99 | 110.3 | 50.93 | 43.27 | 38.80 | 64.6 | 104.5 | 136.4 | 130.9 | 65.68 | 94.57 | 182.6 | 98.37 | 93.29 | 79.45 | 85.28 | 110.3 | 51.00 | 42.84 | 39.21 |
| H-Test | 13.966 | 20.650 | 32.844 | 21.777 | 29.112 | 12.115 | 21.670 | 37.888 | 21.605 | 21.540 | 1.414 | 40.563 | 45.796 | 21.416 | 16.938 | 14.466 | 22.660 | 33.854 | 21.605 | 29.005 | 12.476 | 21.670 | 37.798 | 21.575 | 21.4 |
| ARCH Test | 4.111 | 13.111 | 12.201 | 11.001 | 7.233 | 3.998 | 13.271 | 12.381 | 10.503 | 7.121 | 9.785 | 6.313 | 4.190 | 4.962 | 3.472 | 4.134 | 13.271 | 12.381 | 10.503 | 7.121 | 4.445 | 12.998 | 12.477 | 9.990 | 8.967 |
| Maturity | Brazil | Russia | India | China | South Africa | ||||||||||
|---|---|---|---|---|---|---|---|---|---|---|---|---|---|---|---|
| Levels | |||||||||||||||
| ADF | PP | ERS | ADF | PP | ERS | ADF | PP | ERS | ADF | PP | ERS | ADF | PP | ERS | |
| −3.285 | −1.257 | −3.630 | −2.026 | −1.960 | −1.418 | −2.635 | −2.529 | −2.426 | −2.529 | −2.551 | −2.414 | −1.266 | −1.311 | −1.118 | |
| −1.393 | −4.334 | −1.733 | −2.716 | −2.655 | −1.453 | −2.624 | −1.967 | −2.555 | −2.502 | −2.563 | −2.488 | −1.749 | −1.389 | −1.651 | |
| −1.556 | −2.060 | −1.345 | −2.779 | −2.727 | −1.384 | −1.798 | −1.912 | −1.797 | −2.369 | −2.187 | −2.352 | −1.754 | −1.310 | −1.612 | |
| −1.411 | −2.272 | −1.583 | −2.754 | −2.638 | −1.387 | −1.991 | −1.987 | −1.996 | −2.533 | −1.929 | −2.522 | −1.917 | −1.298 | −1.772 | |
| −1.200 | −1.454 | −1.432 | −2.645 | −2.640 | −1.354 | −2.060 | −1.924 | −2.064 | −2.462 | −1.862 | −2.451 | −1.835 | −1.410 | −1.698 | |
| 1st Differences | |||||||||||||||
| −3.098 | −27.810 | −3.120 | −7.727 | −6.006 | −3.178 | −11.10 | −11.10 | −10.99 | −9.870 | −41.896 | −9.190 | −6.54 | −6.110 | −3.007 | |
| −9.611 | −45.255 | −5.494 | −6.136 | −6.112 | −3.136 | −7.492 | −7.492 | −7.486 | −8.756 | −31.082 | −8.757 | −6.12 | −6.003 | −3.212 | |
| −8.705 | −33.799 | −6.231 | −6.036 | −6.038 | −3.129 | −7.233 | −7.233 | −7.164 | −5.790 | −14.044 | −5.797 | −6.14 | −5.998 | −3.066 | |
| −6.959 | −46.783 | −5.747 | −5.728 | −5.732 | −3.008 | −7.720 | −7.720 | −7.274 | −4.921 | −13.985 | −4.922 | −5.25 | −5.811 | −2.993 | |
| −7.078 | −32.248 | −4.826 | −6.425 | −6.399 | −3.027 | −6.203 | −6.203 | −6.030 | −4.859 | −14.652 | −4.857 | −6.38 | −6.276 | −3.001 | |
| p-r | r | Eigenvalue | Trace | Trace* | Frac95 | p-Value | p-Value* |
|---|---|---|---|---|---|---|---|
| Brazil | |||||||
| p-r | r | Eigenvalue | Trace | Trace* | Frac95 | p-value | p-value* |
| 5 | 0 | 0.266 | 272.75 | 267.499 | 69.611 | 0 | 0 |
| 4 | 1 | 0.184 | 140.926 | 138.661 | 47.707 | 0 | 0 |
| 3 | 2 | 0.092 | 54.361 | 53.463 | 29.804 | 0 | 0 |
| 2 | 3 | 0.028 | 13.104 | 12.507 | 15.408 | 0.111 | 0.135 |
| 1 | 4 | 0.003 | 1.199 | 1.078 | 3.841 | 0.273 | 0.299 |
| Russia | |||||||
| p-r | r | Eigenvalue | Trace | Trace* | Frac95 | p-value | p-value* |
| 5 | 0 | 0.254 | 221.657 | 221.657 | 69.611 | 0 | 0 |
| 4 | 1 | 0.088 | 86.058 | 86.058 | 47.707 | 0 | 0 |
| 3 | 2 | 0.062 | 43.344 | 43.344 | 29.804 | 0.001 | 0.001 |
| 2 | 3 | 0.021 | 13.537 | 13.537 | 15.408 | 0.096 | 0.096 |
| 1 | 4 | 0.008 | 3.684 | 3.684 | 3.841 | 0.055 | 0.055 |
| India | |||||||
| p-r | r | Eigenvalue | Trace | Trace* | Frac95 | p-value | p-value* |
| 5 | 0 | 0.198 | 210.137 | 210.137 | 69.611 | 0 | 0 |
| 4 | 1 | 0.119 | 110.528 | 110.528 | 47.707 | 0 | 0 |
| 3 | 2 | 0.068 | 53.356 | 53.356 | 29.804 | 0 | 0 |
| 2 | 3 | 0.039 | 21.395 | 21.395 | 15.408 | 0.005 | 0.005 |
| 1 | 4 | 0.007 | 3.236 | 3.236 | 3.841 | 0.072 | 0.072 |
| China | |||||||
| p-r | r | Eigenvalue | Trace | Trace* | Frac95 | p-value | p-value* |
| 5 | 0 | 0.108 | 130.117 | 130.117 | 69.611 | 0 | 0 |
| 4 | 1 | 0.083 | 75.803 | 75.803 | 47.707 | 0 | 0 |
| 3 | 2 | 0.042 | 34.389 | 34.389 | 29.804 | 0.013 | 0.013 |
| 2 | 3 | 0.02 | 14.123 | 14.123 | 15.408 | 0.079 | 0.079 |
| 1 | 4 | 0.009 | 4.538 | 4.538 | 3.841 | 0.09 | 0.09 |
| South Africa | |||||||
| p-r | r | Eigenvalue | Trace | Trace* | Frac95 | p-value | p-value* |
| 5 | 0 | 0.485 | 711.716 | 709.264 | 69.61 | 0 | 0 |
| 4 | 1 | 0.199 | 250.462 | 249.79 | 47.707 | 0 | 0 |
| 3 | 2 | 0.081 | 96.568 | 96.382 | 29.804 | 0 | 0 |
| 2 | 3 | 0.05 | 37.733 | 37.689 | 15.408 | 0 | 0 |
| 1 | 4 | 0.003 | 2.291 | 2.29 | 3.841 | 0.13 | 0.13 |
References
- Beechey, M.; Hjalmarsson, E.; Österholm, P. Testing the expectations hypothesis when interest rates are near integrated. Ssrn Electron. J. 2008, 33, 934–943. [Google Scholar]
- Shanming, Q. Financial Integration within the BRICS. CRI English. Available online: http://english.cri.cn/7146/2013/04/10/3381s758725.htm (accessed on 2 July 2015).
- Juselius, K. The Cointegrated VAR Approach: Methodology and Applications. In Textbook on the Econometrics of the Cointegrated Vector Autoregression Model; Economics Institute, University of Copenhagen: Copenhagen, Denmark, 2004. [Google Scholar]
- Clarida, R.; Sarno, L.; Taylor, M.P.; Valente, G. The Role of Asymmetries and Regime Shifts in the Term Structure of Interest Rates. J. Bus. 2006, 79, 1193–1224. [Google Scholar] [CrossRef]
- Bekiros, S.; Avdoulas, C.; Hassapis, C. Nonlinear Equilibrium Adjustment Dynamics and Predictability of the Term Structure of Interest Rates. Int. Rev. Financ. Anal. 2018, 55, 140–155. [Google Scholar] [CrossRef]
- Hansen, H.; Johansen, S. Recursive Estimation in Cointegrated VAR-Models; Institute of Mathematical Statistics Working Paper 1; University of Copenhagen: Copenhagen, Denmark, 1993. [Google Scholar]
- Hansen, H.; Johansen, S. Some tests for parameter constancy in co-integrated VAR models. Econom. J. 1999, 2, 306–333. [Google Scholar] [CrossRef]
- Krolzig, H.M. Markov Switching Vector Autoregressions. Modelling Statistical Inference and Application to Business Cycle Analysis; Springer: Berlin/Heidelberg, Germany, 1997. [Google Scholar]
- Fisher, I. Appreciation and Interests. Publ. Am. Econ. Assoc. 1896, 11, 21–29. [Google Scholar]
- Fama, E.F.; Bliss, R.R. The Information in Long-Maturity Forward Rates. Am. Econ. Rev. 1987, 77, 680–692. [Google Scholar]
- Campbell, J.; Shiller, R. Yield Spreads and Interest Rate Movements: A Bird’s Eye View. Rev. Econ. Stud. 1991, 58, 495–514. [Google Scholar] [CrossRef]
- Shiller, R.J. Alternative tests of rational expectations models: The case of the term structure. J. Econom. 1981, 16, 71–87. [Google Scholar] [CrossRef]
- Campbell, J.Y.; Clarida, R.H. The term structure of euromarket interest rates: An empirical investigation. J. Monet. Econ. 1986, 19, 25–44. [Google Scholar] [CrossRef][Green Version]
- Campbell, J.Y.; Shiller, R.J. Cointegration and tests of present value models. J. Political Econ. 1987, 95, 1062–1088. [Google Scholar] [CrossRef]
- Hall, A.D.; Anderson, H.M.; Granger, C.W.J. A cointegration analysis of Treasury bill yields. Rev. Econ. Stat. 1992, 74, 116–126. [Google Scholar] [CrossRef]
- Johansen, S.; Juselius, K. Testing Structural Hypotheses in a Multivariate Cointegration Analysis of the PPP and UIP for U.K. J. Econom. 1992, 53, 211–244. [Google Scholar] [CrossRef]
- Johansen, S. Likelihood-Based Inference in Cointegrated Vector Auto-Regressive Models; Oxford University Press: Oxford, UK, 1996. [Google Scholar]
- Juselius, K.; MacDonald, R. International Parity Relationships between Germany and the United States: A Joint Modelling Approach; University of Copenhagen, Institute of Economics: Copenhagen, Denmark, 2000. [Google Scholar]
- Hamilton, J.D. A new approach to the economic analysis of nonstationary time series and the business cycle. Econometrica 1989, 57, 357–384. [Google Scholar] [CrossRef]
- Shelile, T. The Term Structure of Interest Rates and Economic Activity in South Africa. MCom Thesis, Rhodes University, Grahamstown, South Africa, 2006. [Google Scholar]
- Shivam, M.; Jayadev, M. The Interest Rate Term Structure in the Indian Money Market. In Proceedings of the VIth Annual Conference on Money and Finance, Mumbai, Indian, 25–27 March 2004. [Google Scholar]
- Shareef, H.; Shijin, S. Expectations Hypothesis and Term Structure of Interest Rates: An Evidence from Emerging Market. Asia-Pac. Financ. Mark. 2016, 23, 137–152. [Google Scholar] [CrossRef]
- Hendry, D.F.; Juselius, K. Explaining cointegration analysis: Part, I. Energy J. 2000, 21, 1–42. [Google Scholar] [CrossRef]
- Hendry, D.F.; Juselius, K. Explaining cointegration analysis: Part II. Energy J. 2001, 22, 75–120. [Google Scholar] [CrossRef]
- Krolzig, H. Regime-Switching Models; Department of Economics and Nuffield College, University of Oxford: Oxford, UK, 2002. [Google Scholar]
- Sarno, L.; Valente, G. Modeling and Forecasting Stock Returns: Exploiting the Futures Market, Regime Shifts and International Spillovers. J. Appl. Econom. 2005, 20, 345–376. [Google Scholar] [CrossRef]
- Sarno, L.; Valente, G. Deviations from purchasing power parity under different exchange rate regimes: Do they revert and, if so, how? J. Bank. Financ. 2006, 30, 3147–3169. [Google Scholar] [CrossRef]
- Johansen, S. Estimation and Hypothesis Testing of Cointegration Vectors in Gaussian Vector Autoregressive Models. Econometrica 1991, 59, 1551–1580. [Google Scholar] [CrossRef]
- Diebold, F.X.; Mariano, R.S. Comparing predictive accuracy. J. Bus. Econ. Stat. 1995, 13, 253–265. [Google Scholar]
- Bai, J.; Perron, P. Computation and Analysis of Multiple Structural Change Models. J. Appl. Econom. 2003, 18, 1–22. [Google Scholar] [CrossRef]
- Dickey, D.; Fuller, W. Likelihood Ratio Statistics for Autoregressive Time Series with a Unit Root. Econometrica 1981, 49, 1057–1072. [Google Scholar] [CrossRef]
- MacKinnon, J.G. Critical Values for Cointegration Tests. In Long-Run Economic Relationships: Readings in Cointegration; Engle, R.F., Granger, C.W.J., Eds.; Oxford University Press: Oxford, UK, 1991. [Google Scholar]
- Said, S.E.; Dickey, D.A. Testing for unit roots in autoregressive moving average models of unknown order. Biometrika 1984, 71, 599–607. [Google Scholar] [CrossRef]
- Phillips, P.C.B.; Perron, P. Testing for a Unit Root in Time Series Regression. Biometrika 1988, 75, 335–346. [Google Scholar] [CrossRef]
- Elliot, B.E.; Rothenberg, T.J.; Stock, J.H. Efficient Tests of the Unit Root Hypothesis. Econometrica 1996, 64, 813–836. [Google Scholar] [CrossRef]
- Ljung, G.M.; Box, G.E.P. On a Measure of a Lack of Fit in Time Series Models. Biometrika 1978, 65, 297–303. [Google Scholar] [CrossRef]
- Johansen, S.; Juselius, K. Maximum Likelihood and Inferences on Cointegration: With Applications to the Demand for Money. Oxf. Bull. Econ. Stat. 1990, 52, 169–210. [Google Scholar] [CrossRef]
- Johansen, S. A Barlett correction factor for tests on the cointegration relations. Econom. Theory 2000, 16, 740–778. [Google Scholar] [CrossRef]
- Johansen, S. A small sample correction of the test for cointegration rank in the vector of autoregressive model. Econometrica 2002, 70, 1929–1961. [Google Scholar] [CrossRef]
- Avdoulas, C.; Bekiros, S.; Boubaker, S. Evolutionary-based return forecasting with nonlinear STAR models: Evidence from the Eurozone peripheral stock markets. Ann. Oper. Res. 2018, 262, 307–333. [Google Scholar] [CrossRef]
- Cieslak, A. Short-Rate Expectations and Unexpected Returns in Treasury Bonds. Rev. Financ. Stud. 2018, 31, 3265–3306. [Google Scholar] [CrossRef]
| r | DGF | 5% C.V. | |||||
|---|---|---|---|---|---|---|---|
| Brazil | |||||||
| r | DGF | 5% C.V. | |||||
| 3 | 3 | 7.815 | 4.827 [0.005] | 102.055 [0.000] | 113.737 [0.000] | 66.856 [0.000] | 40.459 [0.000] |
| Russia | |||||||
| r | DGF | 5% C.V. | |||||
| 3 | 3 | 7.815 | 61.223 [0.000] | 32.425 [0.000] | 41.400 [0.000] | 50.983 [0.000] | 90.654 [0.000] |
| India | |||||||
| r | DGF | 5% C.V. | |||||
| 4 | 4 | 9.488 | 59.244 [0.000] | 36.306 [0.000] | 70.259 [0.000] | 91.937 [0.025] | 57.097 [0.044] |
| China | |||||||
| r | DGF | 5% C.V. | |||||
| 3 | 3 | 7.815 | 35.110 [0.000] | 31.790 [0.002] | 17.331 [0.001] | 7.192 [0.036] | 3.202 [0.002] |
| South Africa | |||||||
| r | DGF | 5% C.V. | |||||
| 4 | 4 | 9.488 | 457.514 [0.000] | 93.462 [0.000] | 81.136 [0.000] | 65.032 [0.000] | 79.297 [0.000] |
| r | DGF | 5% C.V. | |||||
|---|---|---|---|---|---|---|---|
| Brazil | |||||||
| r | DGF | 5% C.V. | |||||
| 3 | 3 | 7.815 | 17.069 [0.001] | 49.069 [0.000] | 48.079 [0.000] | 17.883 [0.000] | 7.307 [0.000] |
| Russia | |||||||
| r | DGF | 5% C.V. | |||||
| 3 | 3 | 7.815 | 14.690 [0.000] | 5.719 [0.006] | 7.399 [0.040] | 6.610 [0.085] | 46.299 [0.085] |
| India | |||||||
| r | DGF | 5% C.V. | |||||
| 4 | 4 | 9.488 | 39.865 [0.000] | 25.515 [0.000] | 16.506 [0.002] | 90.039 [0.000] | 11.469 [0.022] |
| China | |||||||
| r | DGF | 5% C.V. | |||||
| 3 | 3 | 7.815 | 40.839 [0.000] | 19.305 [0.002] | 6.484 [0.003] | 8.240 [0.061] | 4.553 [0.208] |
| South Africa | |||||||
| r | DGF | 5% C.V. | |||||
| 4 | 4 | 9.488 | 458.202 [0.000] | 124.129 [0.000] | 117.759 [0.000] | 90.208 [0.000] | 27.627 [0.000] |
| Vector | Brazil | Russia | India |
| Vector 1 | 3M T-bill–1M T-bill | 1 Year T-bill–1M T-bill | 1M T-bill–Overnight T-bill |
| Vector 2 | 6M T-bill–1M T-bill | 1 Year T-bill–3M T-bill | 3M T-bill–Overnight T-bill |
| Vector 3 | 1 Year T-bill–1M T-bill | 1 Year T-bill–6M T-bill | 6M T-bill–Overnight T-bill |
| Vector 4 | 1 Year T-bill–Overnight T-bill | ||
| Bartletts Correction Test | CHISQR(6) = 1.560 [0.955] | CHISQR(6) 8.941 [0.177] | CHISQR(4) 2.833 [0.586] |
| China | South Africa | ||
| Vector 1 | 1M T-bill–Overnight T-bill | 1M T-bill–Overnight T-bill | |
| Vector 2 | 3M T-bill–Overnight T-bill | 3M T-bill–Overnight T-bill | |
| Vector 3 | 6M T-bill–Overnight T-bill | 6M T-bill–Overnight T-bill | |
| Vector 4 | 1 Year T-bill–Overnight T-bill | ||
| Bartletts Correction Test | CHISQR(6) = 3.051 [0.802] | CHISQR(4) = 6.695 [0.153] |
| Countries | LR | p-Value |
|---|---|---|
| Brazil | 7222.0 | <0.01 |
| Russia | 6077.5 | <0.01 |
| India | 9914.1 | <0.01 |
| China | 16,099.0 | <0.01 |
| South Africa | 16,594.0 | <0.01 |
| Restricted Model | Unrestricted Model | LRs |
|---|---|---|
| Brazil | ||
| 648.983 | 740.566 | 1.339 * |
| 740.566 | 973.677 | 1.509 * |
| 973.677 | 1344.121 | 2.093 * |
| Russia | ||
| 546.908 | 780.733 | 1.784 * |
| 780.733 | 937.404 | 1.900 * |
| 937.404 | 1067.357 | 2.037 * |
| India | ||
| 786.245 | 984.914 | 1.786 * |
| 984.914 | 1136.978 | 1.948 * |
| 1136.978 | 1432.405 | 2.065 * |
| China | ||
| 2836.182 | 4222.057 | 1.240 * |
| 4222.057 | 4365.062 | 1.767 * |
| 4365.062 | 4892.870 | 1.985 * |
| South Africa | ||
| 2988.157 | 3800.397 | 1.585 * |
| 3800.397 | 7260.960 | 1.732 * |
| 7260.960 | 7278.7834 | 1.916 * |
| Transition Probabilities | Regime 1 | Regime 2 | Duration | Regime 1 | Regime 2 |
|---|---|---|---|---|---|
| Brazil MSIAH(2)-VECM(2) | |||||
| Regime 1 | 0.957 | 0.599 | Duration | 23.25 | 1.66 |
| Regime 2 | 0.042 | 0.400 | |||
| Russia MSIAH(2)-VECM(1) | |||||
| Regime 1 | 0.935 | 0.202 | Duration | 15.38 | 4.95 |
| Regime 2 | 0.064 | 0.797 | |||
| India MSIAH(2)-VECM(1) | |||||
| Regime 1 | 0.905 | 0.329 | Duration | 10.52 | 3.039 |
| Regime 2 | 0.094 | 0.700 | |||
| China MSIAH(2)-VECM(1) | |||||
| Regime 1 | 0.851 | 0.299 | Duration | 6.711 | 3.344 |
| Regime 2 | 0.148 | 0.949 | |||
| South Africa We define MSIAH(2)-VECM(1) | |||||
| Regime 1 | 0.976 | 0.942 | Duration | 41.66 | 1.061 |
| Regime 2 | 0.023 | 0.057 | |||
| Hours | VECMs MSIAH(2)-VECMs | Country | ||||
|---|---|---|---|---|---|---|
| h | Brazil | |||||
| 6 | VECM(6) | 0.002 | 0.001 | 0.001 | 0.302 | 0.435 |
| MSIAH(2)-VECM(2) | 0.998 | 0.999 | 0.999 | 0.798 | 0.565 | |
| 12 | VECM(6) | 0.045 | 0.099 | 0.036 | 0.399 | 0.306 |
| MSIAH(2)-VECM(2) | 0.955 | 0.901 | 0.974 | 0.701 | 0.693 | |
| Russia | ||||||
| 6 | VECM(7) | 0.002 | 0.002 | 0.010 | 0.120 | 0.366 |
| MSIAH(2)-VECM(1) | 0.998 | 0.998 | 0.990 | 0.880 | 0.634 | |
| 12 | VECM(7) | 0.069 | 0.110 | 0.211 | 0.412 | 0.485 |
| MSIAH(2)-VECM(1) | 0.931 | 0.890 | 0.789 | 0.598 | 0.515 | |
| India | ||||||
| 6 | VECM(6) | 0.002 | 0.120 | 0.170 | 0.112 | 0.019 |
| MSIAH(2)-VECM(1) | 0.998 | 0.880 | 0.830 | 0.887 | 0.981 | |
| 12 | VECM(6) | 0.095 | 0.110 | 0.190 | 0.340 | 0.078 |
| MSIAH(2)-VECM(1) | 0.905 | 0.790 | 0.710 | 0.660 | 0.922 | |
| China | ||||||
| 6 | VECM(6) | 0.056 | 0.455 | 0.030 | 0.337 | 0.445 |
| MSIAH(2)-VECM(1) | 0.944 | 0.545 | 0.970 | 0.663 | 0.555 | |
| 12 | VECM(6) | 0.090 | 0.499 | 0.111 | 0.401 | 0.501 |
| MSIAH(2)-VECM(1) | 0.910 | 0.501 | 0.889 | 0.599 | 0.499 | |
| South Africa | ||||||
| 6 | VECM(1) | 0.010 | 0.011 | 0.101 | 0.289 | 0.089 |
| MSIAH(2)-VECM(1) | 0.990 | 0.989 | 0.899 | 0.711 | 0.901 | |
| 12 | VECM(1) | 0.049 | 0.070 | 0.211 | 0.301 | 0.112 |
| MSIAH(2)-VECM(1) | 0.951 | 0.930 | 0.789 | 0.699 | 0.888 | |
© 2020 by the authors. Licensee MDPI, Basel, Switzerland. This article is an open access article distributed under the terms and conditions of the Creative Commons Attribution (CC BY) license (http://creativecommons.org/licenses/by/4.0/).
Share and Cite
Bekiros, S.; Avdoulas, C. Revisiting the Dynamic Linkages of Treasury Bond Yields for the BRICS: A Forecasting Analysis. Forecasting 2020, 2, 102-129. https://doi.org/10.3390/forecast2020006
Bekiros S, Avdoulas C. Revisiting the Dynamic Linkages of Treasury Bond Yields for the BRICS: A Forecasting Analysis. Forecasting. 2020; 2(2):102-129. https://doi.org/10.3390/forecast2020006
Chicago/Turabian StyleBekiros, Stelios, and Christos Avdoulas. 2020. "Revisiting the Dynamic Linkages of Treasury Bond Yields for the BRICS: A Forecasting Analysis" Forecasting 2, no. 2: 102-129. https://doi.org/10.3390/forecast2020006
APA StyleBekiros, S., & Avdoulas, C. (2020). Revisiting the Dynamic Linkages of Treasury Bond Yields for the BRICS: A Forecasting Analysis. Forecasting, 2(2), 102-129. https://doi.org/10.3390/forecast2020006


