Communication

Analyzing Complex Non-Linear Fascia-Muscle Interactions Using Cross-Recurrence Quantification Analysis


1
Conservative and Rehabilitative Orthopedics, TUM School of Medicine and Health, Technical University of Munich, 80333 Munich, Germany
2
Department for Medical Professions, Diploma Hochschule, 37242 Bad Sooden-Allendorf, Germany
3
Institute for Physical Education and Sport, Karlsruhe University of Education, 76133 Karlsruhe, Germany
*
Author to whom correspondence should be addressed.
Stats 2026, 9(2), 35; https://doi.org/10.3390/stats9020035
Submission received: 27 February 2026 / Revised: 22 March 2026 / Accepted: 24 March 2026 / Published: 25 March 2026

Abstract

Biophysical, neurophysiological, psychological and social processes along with their interactions are complex, often non-linear and inherently time-dependent. However, time series analysis of such measurements usually requires extensive data processing and is therefore potentially associated with structural biases. This exploratory secondary analysis introduces cross-recurrence quantification analysis (CRQA), which is explicitly suited to time series with complicated non-stationary properties. We illustrate and validate CRQA using a previous study that investigated the dynamic relationship between thoracolumbar fascia deformation and back extensor muscle activity in patients with low back pain. CRQA revealed significant differences in the relationships between fascia and muscles in low back pain patients compared to healthy individuals. The analysis revealed more specific aspects of fascia-muscle coupling than traditional analytical approaches, suggesting that CRQA is a useful additional tool for investigating time-dependent interactions with dynamic complex nonlinear patterns.

1. Introduction

A key difficulty in measuring the similarity or dependence between two time series or sequences is that processes over time often differ in terms of their autocorrelations, stationarity, and trends [1]. This issue is particularly evident in empirical data, including time series from psychology [2], neuroscience, and cognitive science [3], as well as physiological signals such as stress- and immune-related biomarkers [4], heartbeat-to-heartbeat (RR) interval, or tissue displacement patterns [5]. Meaningful correlation of such series usually requires coordinated, temporally aligned observations. Conventional solutions attempt to enforce this coordination through methods such as truncation, whitening, or autoregressive integrated moving average (ARIMA) based modeling of the original data [4,5]. However, these approaches are based on the assumption that the underlying modeling framework accurately captures the actual temporal or sequential dynamics of the process. In practice, this means that extensive prior knowledge of the structure of the data is required—knowledge that is often incomplete or unavailable. If the actual temporal structure violates these assumptions, preprocessing can distort the data, create artificial correlations, or obscure real ones, making similar sequences appear dissimilar or vice versa [6]. For nominal sequences, where resampling or interpolation is not applicable, the difficulties are even greater. Accordingly, there is a need for a robust approach to comparing time series with different characteristics that is largely independent of the data type, including nominal data.
Nonspecific low back pain (LBP) is among the leading reasons for consultations with orthopedists and manual therapists [7]. Moreover, LBP is associated with substantial disability, loss of work productivity, and early retirement, making it a major driver of healthcare costs and resource utilization [8]. Among others, several potential biomechanical causes are mentioned in the literature. Some authors suspect micro-injuries to the paraspinal connective tissue and the thoracolumbar fascia (TLF) as a possible cause of LBP [9,10]. In particular, adhesions between layers of the TLF and adjacent tissues—such as the epimysium of the erector spinae and multifidus muscles or the deep subcutaneous adipose tissue—are thought to contribute to the development of LBP [9,11,12]. Patients with LBP demonstrate marked alterations in muscle activation patterns [13,14], as well as impaired proprioception, especially within the overlying connective tissues [15]. Electromyographic (EMG) studies have further shown significantly different spatial distributions of erector spinae muscle activity in individuals with LBP compared with healthy controls [13,16]. Based on the proposed reciprocal relationship between fascia and muscle, several authors have investigated direct associations between ultrasound and EMG measurements [17,18,19]. Recognizing that interactions between physiological variables may involve temporal delays, these studies employed cross-correlation analyses of simultaneous time series rather than analyses of single time-point variables [5,20].
This study explores neuromotor alterations associated with low back pain (LBP) by examining characteristic recurrence structures in lumbar EMG signals and their relationship with ultrasound-based measurements of thoracolumbar fascia deformation (TLFD). To this end, we conducted a secondary analysis of data obtained from a previously published case–control study [19]. In this exploratory secondary analysis, we demonstrate how CRQA can be applied to compute similarity measures between TLFD and EMG time series. To this end, we reanalyze data from a previous study and investigate whether CRQA demonstrates concurrent validity compared to conventional time-series analysis methods.
In its assumptions and the types of structures it identifies, CRQA differs from classical time-series approaches such as cross-correlation and Granger causality, which we used in our previous study [1,21]. While cross-correlation and Granger causality are based on linear relationships and often require stationarity, CRQA is a nonlinear method for dynamic systems that examines how the states of two systems repeat over time in a shared phase space, making it likely better suited for complex data. Unlike cross-correlation, which summarizes similarities across different lags, or Granger causality, which focuses on predictive influence under a specific model [22], CRQA captures detailed temporal patterns such as synchronization, intermittency, and coupling stability [22]. As a result, CRQA could reveal more subtle dynamics that might be overlooked by classical techniques.
We hypothesize that CRQA measurements of TLFD and muscular EMG activation will show different patterns in individuals with LBP and in healthy individuals (Hypothesis 1). We assume further that CRQA is superior to standard approaches in its ability to reveal more differentiated patterns (Hypothesis 2).

2. Materials and Methods

The data set originates from an earlier case–control study in which the neuromotor patterns of 10 patients with acute LBP and 10 matched healthy individuals were compared [19]. In brief, the participants were analyzed during trunk extension. Muscle activation as % of maximum voluntary contraction (%MVC) was recorded using surface EMG at four different sites of the erector spinae and the multifidus muscle in the lumbar region (L1 and L5; on the left and right sides, respectively). TLFD was recorded sonographically using the method described by Brandl et al. [11,23]. Both recordings were synchronized at the beginning of the trunk extension by an external direct current signal (Figure 1). A detailed description of all procedures and data acquisition can be found in Brandl et al. [19]. In contrast to the previous data collection approach, we used the unprocessed TLFD data and the unfiltered quadratic mean value of the EMG data.

2.1. Cross-Recurrence Quantification Analysis

To address methodological challenges inherent in comparing heterogeneous time series, we apply and validate Cross-Recurrence Quantification Analysis (CRQA), a technique specifically suited to capturing complex temporal relationships between signals [24].
CRQA is a nonlinear, bivariate analytical approach designed to identify coupling and interdependence between two time series through the quantification of shared recurrence structures [25]. Rather than relying on pointwise correlations, CRQA evaluates similarity based on the repetition of dynamic patterns across signals. At its core, CRQA employs cross-recurrence plots (CRP), which provide a visual representation of how temporal patterns observed in one time series reappear in another. A lack of such recurrences indicates minimal or no association between the signals, whereas isolated recurrence points reflect shared individual states. More extended and organized recurrence structures, however, reveal similarities across entire subsequences, suggesting stronger dynamic coupling.
Wallot and Leonardi [24] illustrated the principles of CRP using a straightforward example that maps shared states between two nominal time series. In their demonstration, the sequences “ABCDDABCDD” and “DDEFGABCDD” were compared to assess both their similarity and the temporal ordering of recurring patterns. In the resulting CRP, cross-recurring states are represented by dark cells, whereas white areas indicate the absence of shared values. A commonly used global index of similarity derived from a CRP is the cross-recurrence rate (%REC), also referred to as total recurrence. This measure is calculated as the proportion of recurrence points relative to the total number of points in the plot. More detailed recurrence metrics are based on the analysis of diagonal line structures within the CRP. These diagonals reflect shared trajectories, indicating that sequences of states recur in both time series in the same order. Among the most frequently reported measures is percent determinism (%DET), defined as the proportion of recurrence points that form diagonal lines of at least two adjacent points relative to the total number of recurrence points. Another widely used metric is entropy (ENTR), which quantifies the Shannon entropy of the diagonal line length distribution and captures the complexity of the recurrent dynamics. In addition, the average length of the line structures (LEN) was determined [24].
In the context of neuromotor alterations associated with LBP, a high proportion of recurring diagonal line structures suggests that the EMG time series and TLFD exhibit similar temporal dynamics. Additionally, vertical and horizontal line structures can be quantified. These patterns indicate that one of the time series remains in a particular state (e.g., a specific neuromotor stage) for a relatively longer duration than the other.

2.2. Data Analysis Approach

CRQA patterns between TLFD and EMG were computed using the algorithm described by Wallot and Leonardi [24]. The EMG and TLFD data were processed using the R package “crqa” (version 2.0.7) [24] and the statistical software R (version 4.5.3) [26].
We therefore adopted a minimal embedding approach (embedding dimension = 1, delay = 1), which has been recommended in cases where the focus lies on preserving the original temporal structure of the signals and avoiding additional assumptions introduced by phase-space reconstruction, particularly for relatively short and noisy physiological time series [25,27]. In line with this, several applied CRQA studies in behavioral and physiological domains have successfully used low-dimensional embeddings when the emphasis is on inter-signal coordination rather than attractor reconstruction [28,29]. For the recurrence threshold, we selected a small radius to ensure that only close recurrences (i.e., highly similar states) were identified. This conservative choice reduces the likelihood of spurious recurrences and is consistent with recommendations to maintain relatively low recurrence rates (e.g., 1–5%) to enhance the interpretability of CRQA measures [21,25]. Importantly, all parameters were held constant across groups and conditions. Thus, although absolute CRQA values may vary with parameter selection, the relative differences observed between low back pain patients and healthy controls remain meaningful and interpretable within this consistent analytical framework [21].
CRQA was performed for all four EMG recording sites (L1 right, L1 left, L5 right, and L5 left). From these analyses, the standard CRQA metrics were extracted, including total recurrence, determinism, maximum diagonal line length, mean diagonal line length, and entropy.

2.3. Statistical Analysis

Principal component analysis (PCA) of all recurrence parameters of the similarity examination for TLFD and EMG recording at four sites was used to reduce the complexity of recurrence patterns. Subsequent component rotation using VARIMAX yielded orthogonal components with maximal separation.
Although the total sample size was small (n = 20), PCA is suitable under several documented conditions. First, in our exploratory analysis, PCA can be viewed as a rather descriptive technique and used to examine a correlation structure without a large sample size [30]. Simulation studies have shown that strong communalities, high loadings, and simple component structures allow PCA solutions to be stable even when n < 30 [31,32]. In this dataset, the suitability of PCA was further confirmed by a Kaiser-Meyer-Olkin (KMO) measure of >0.6 and a significant Bartlett’s sphericity test (p < 0.001).
Subsequently, a Paired Sample T-test with Cohen’s d effect size was performed to compare the resulting components between LBP patients and statistical matched healthy individuals (Hypothesis 1).
To examine possible similarities between the different analytical approaches, the components were then examined in terms of their Pearson product-moment correlation with the traditional time series approach from the previous study (Granger causality results of preprocessed time series) [19]. According to Cohen, the resulting values were interpreted as “low” (0.1 to 0.3), ‘medium’ (0.3 to 0.5), or “high” (0.5 to 1.0) correlations [33].
All outcomes met the assumptions for parametric testing. Analyses were performed using the Jamovi 2.3 (The jamovi project, https://www.jamovi.org, accessed on 15 December 2024).

3. Results

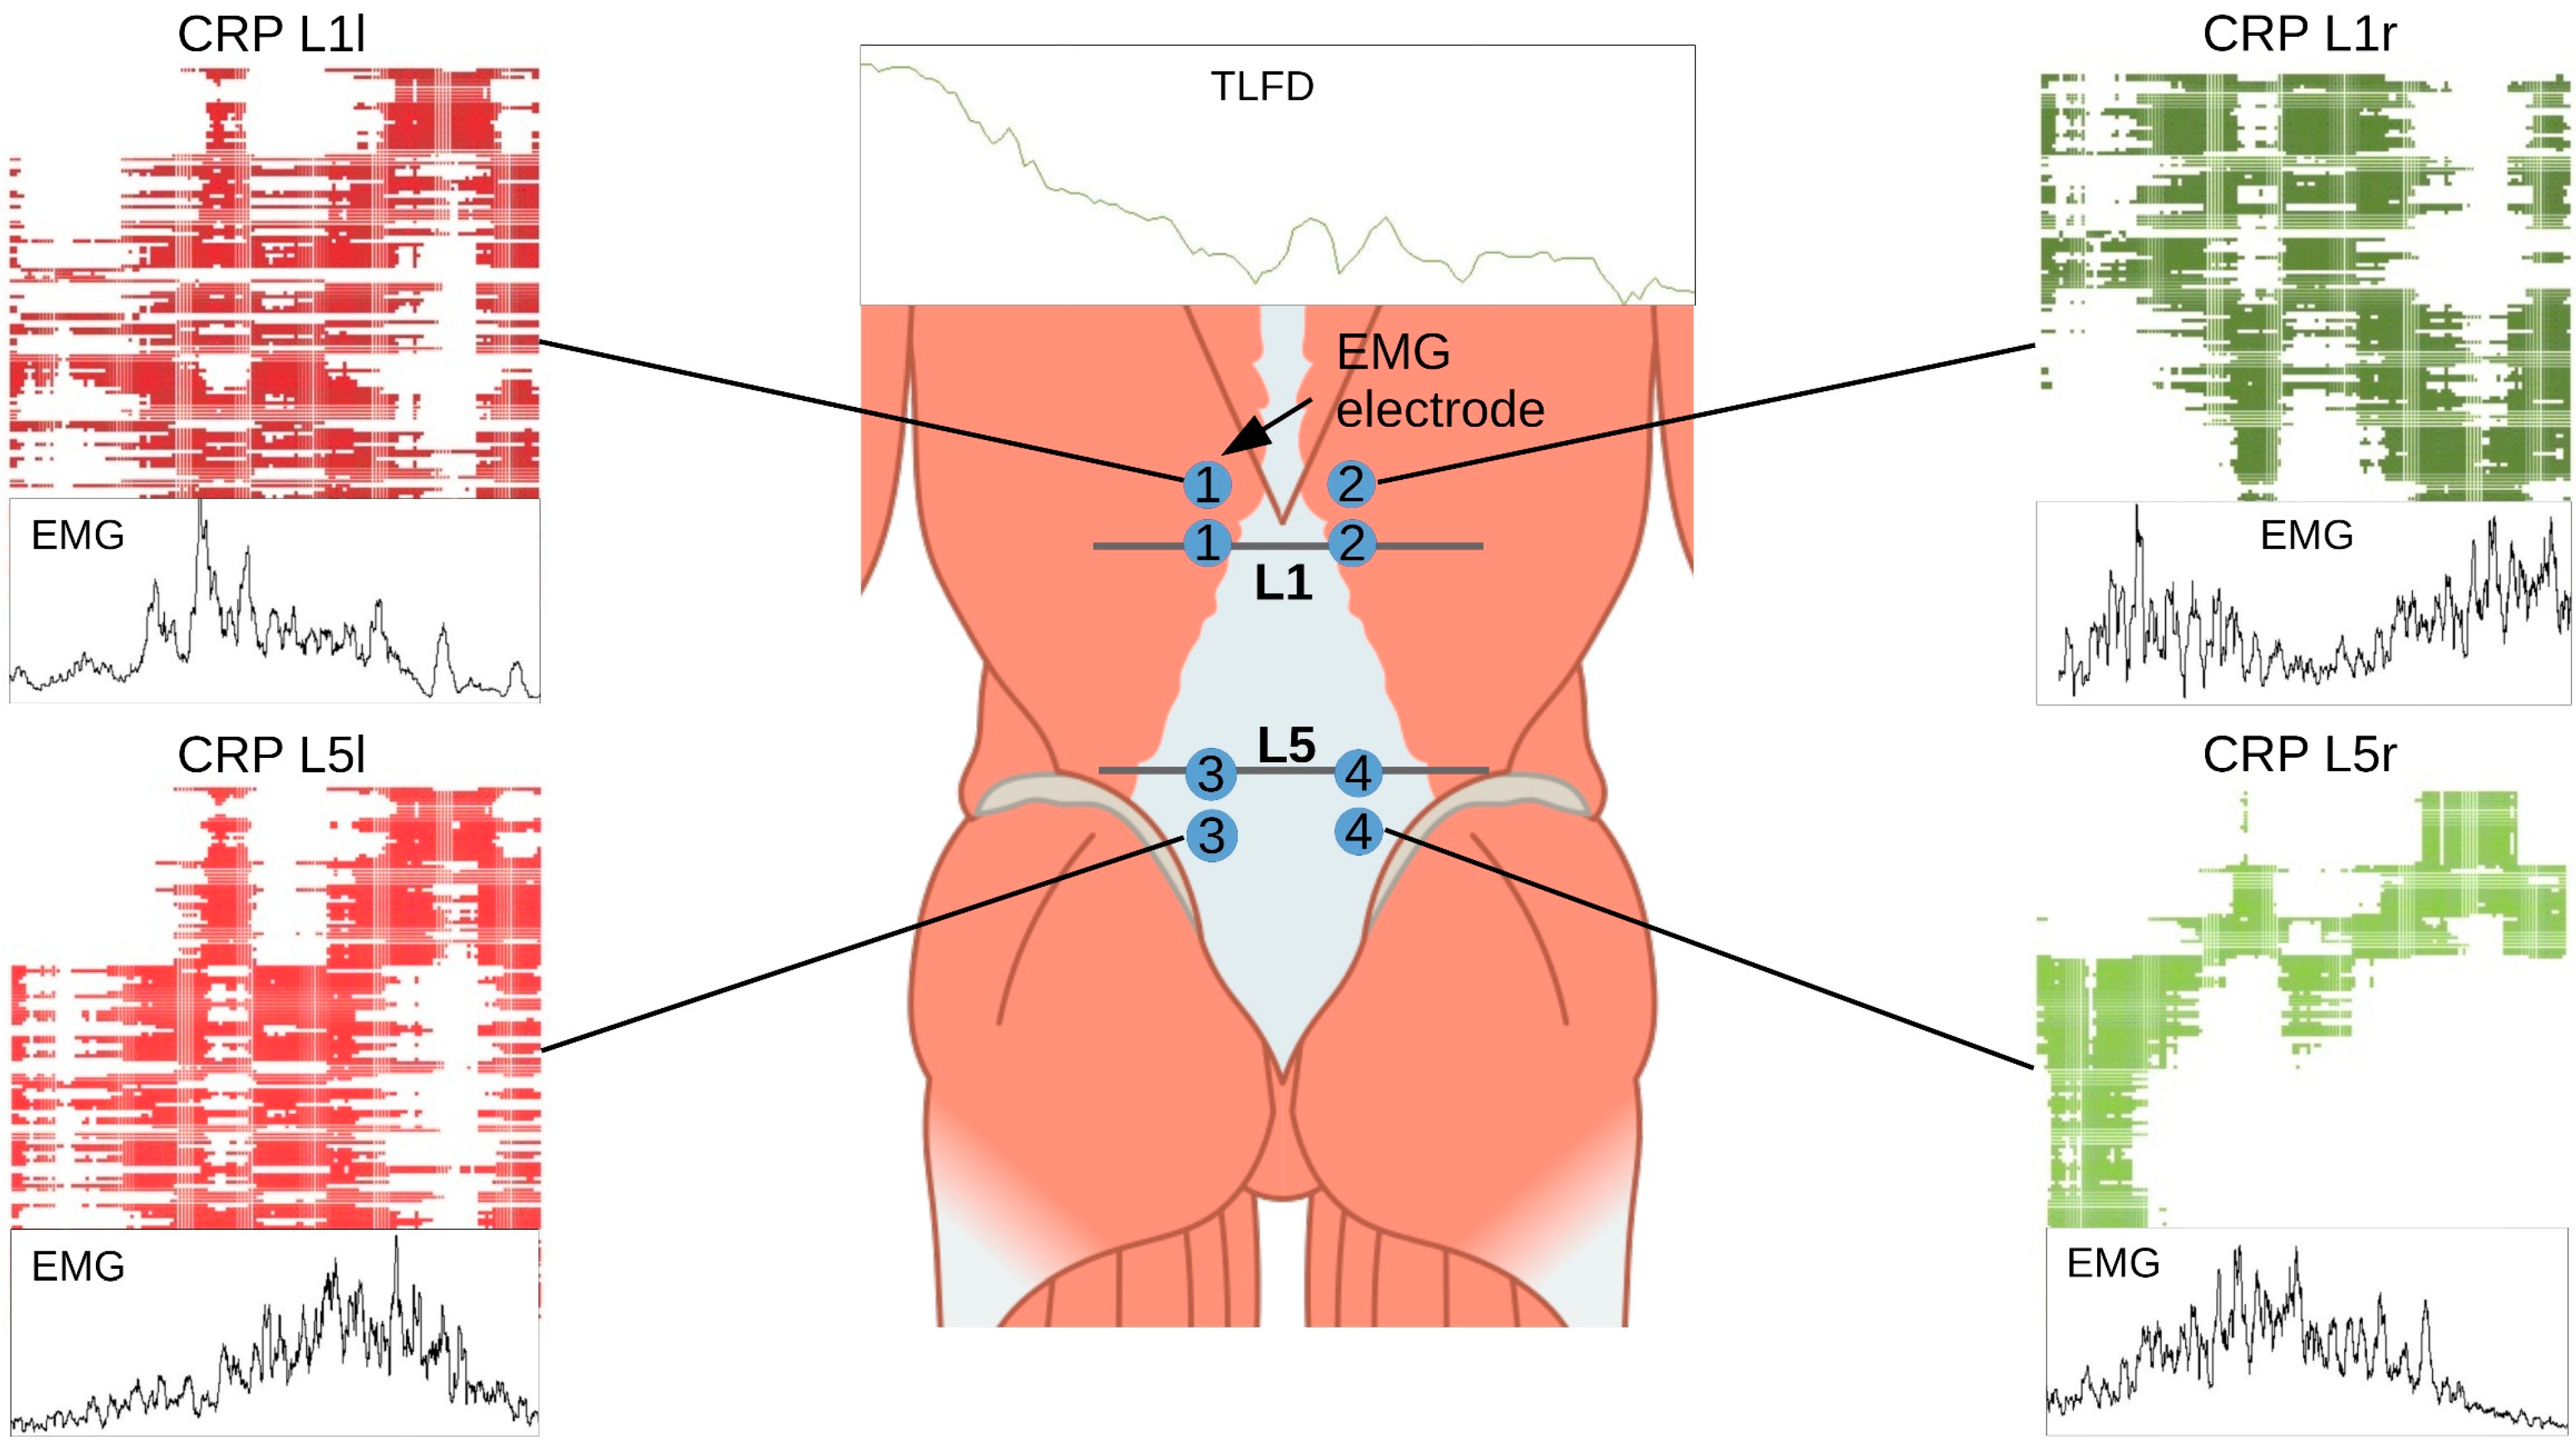
Time series of TLFD and %MVC from 10 LBP patients, who were matched with 10 healthy individuals in terms of age (43.6 ± 15.9 years), gender (8 men, 12 women), and BMI (25.6 ± 4.5 kg/m2), were analyzed secondarily. The measurements are from an earlier study by Brandl et al. [19], which investigated whether the activation of the left and right erector spinae and multifidus muscles (%MVC) during trunk extension was caused by TLFD. In this study, the original, unprocessed data were examined using four CRQAs (TLFD and %MVC L1 left; TLFD and %MVC L1 right; TLFD and %MVC L5 left; TLFD and %MVC L5 right; Figure 2).

3.1. Principal Component Analysis of Recurrence Parameters

The CRQA resulting recurrence parameters were reduced by PCA, and component separation was maximized by VARIMAX rotation, yielding two orthogonal recurrence components that explained 80.1% of the variance, namely, “lumbar muscle recurrence” (right lumbar muscles and left erector spinae muscle loaded on that component; CLR) and “left multifidus muscle recurrence” (CMLR; Table 1).

3.2. Differences Between LBP Patients and Healthy Persons of Recurrence Patterns (Hypothesis 1)

The Paired Sample T-test showed significant differences between LBP patients and healthy individuals for CLR, t(9) = −2.847, p = 0.019, Cohen’s d = −0.9. Healthy individuals showed less recurrence patterns compared to LBP patients (Table 2).
The Paired Sample T-test showed no significant differences between LBP patients and healthy individuals for CMLR, t(9) = 0.95, p = 0.367, Cohen’s d = 0.3. The descriptive statistics, including the individual values, are presented in Table 2.

3.3. Cross-Recurrence Versus Granger Causality (Hypothesis 2)

The previous study examined the time series using ARIMA preprocessing and Granger causality tests for the four measurement points. It was found that the Granger causalities of LBP patients were significantly increased at all lumbar vertebral levels, in contrast to healthy individuals.
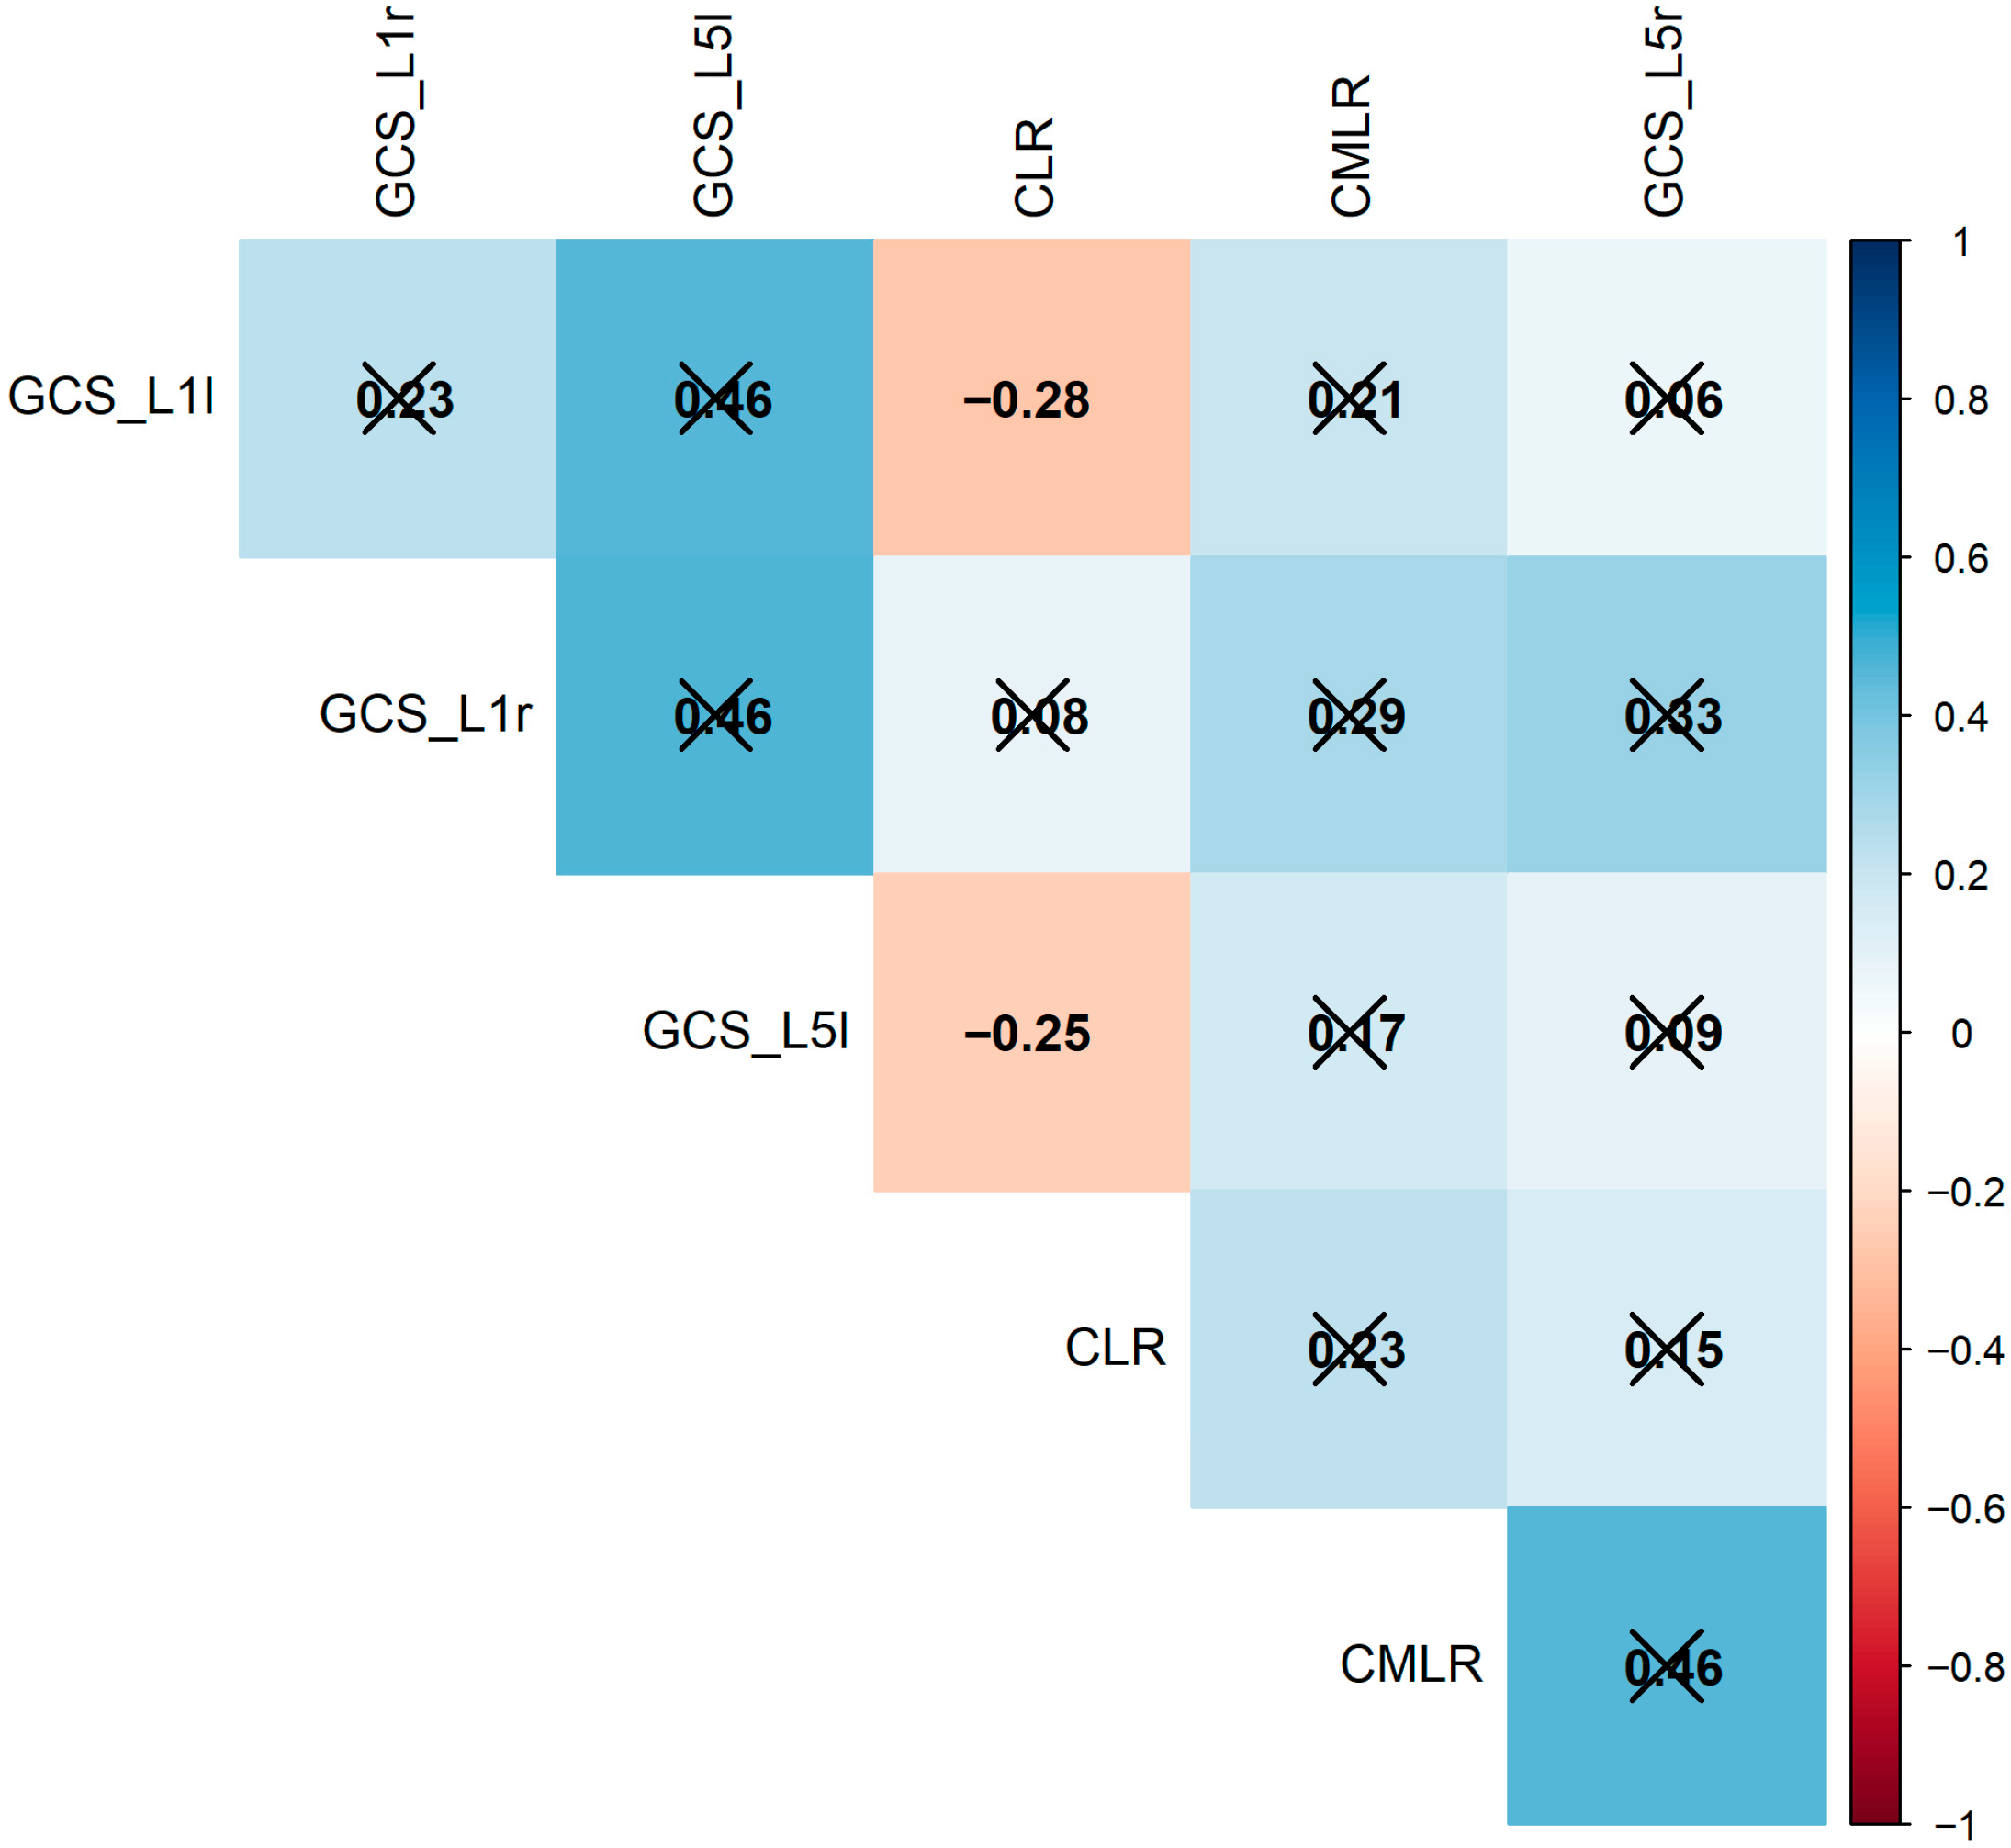
In contrast, CRQA using unmodified original data showed a more specific recurrence pattern with significantly increased lumbar muscle cross-recurrence (CLR) in LBP patients. However, in a specific region, LBP patients did not differ from healthy control subjects, as reflected in CMLR, the measurement at the left multifidus muscle. Pearson’s product-moment analysis showed only a significant correlation with CLR for the Granger causality of the left multifidus muscle (p = 0.044), demonstrating that the CRQA parameter components reflect different aspects of TLFD/EMG activity coupling (Figure 3).

4. Discussion

In this exploratory secondary analysis, we applied CRQA to examine the coupling between lumbar EMG activity and ultrasound-based measurements of TLFD in individuals with nonspecific LBP and healthy individuals. We addressed a central methodological and clinical challenge: how to meaningfully quantify similarity and dependence between physiological time series that differ in their statistical properties, while simultaneously advancing the understanding of neuromotor alterations in LBP. Processes unfolding over time frequently vary in their autocorrelation structure, stationarity, and trends [3,4]. This variability complicates conventional correlation-based approaches, particularly in empirical domains such as psychology, neuroscience, and physiology, where signals are noisy, nonstationary, and often characterized by temporal delays. The problem is further amplified when signals stem from distinct measurement modalities, such as EMG and ultrasound, that capture related but not identical aspects of an underlying biomechanical system [6].
Our first hypothesis was that the CRQA-derived measurements of EMG-TLFD coupling would differ between LBP patients and healthy individuals. The results support this assumption and are consistent with previous findings based on traditional approaches to time series processing [19]. However, the CRQA recurrence-based measurements showed altered dynamic coordination patterns in patients with LBP, reflected in an increase in lumbar muscle recurrence components (CLR). These findings suggest that neuromotor control in LBP is characterized not only by differences in activation amplitude or timing, but also by altered temporal organization and structure of fascia-muscle interactions. Nevertheless, the fascia-muscle interaction of the left multifidus muscle did not differ significantly between groups. It is known that in LBP, muscle activation of the lumbar muscles shifts cranially, which is likely a less efficient recruitment strategy and contributes to the maintenance of LBP [16,34]. CRQA could reflect this phenomenon, demonstrating its potential suitability for the type of data presented here.
The second hypothesis was that CRQA would perform better than conventional time series analyses in detecting differentiated interaction patterns. In line with this expectation, Granger causality tests revealed group differences, but CRQA was also able to identify structured repetition patterns that were robust to assumptions such as non-stationarity or autocorrelations. Since CRQA operates in a reconstructed phase space and does not rely on point-to-point correspondences, it captures common dynamic structures even when interactions involve nonlinear dependencies or temporal delays [4,5]. This feature is particularly relevant for fascial-muscle systems, in which mechanical and neuromotor processes are likely to unfold over multiple timescales [16]. The fact that CRQA measurements provide more comprehensive results and are not necessarily comparable with conventional approaches was also reflected in the Pearson product-moment analysis, which showed only a marginally significant correlation with CLR for the Granger causality of the left multifidus muscle. However, this does not demonstrate the general superiority of CRQA; rather, it highlights its ability to provide additional information about the complex coupling between EMG and TLFD.
Methodologically, our findings demonstrate that CRQA provides a flexible and largely data-type-independent framework for comparing physiological time series with different characteristics. Unlike interpolation-based approaches, CRQA does not require any complex preprocessing and can accommodate both continuous and discretized signals. This is especially advantageous in multimodal biomedical research, where signals differ in sampling rate, noise characteristics, and measurement scale [24]. These properties prove particularly advantageous in the analysis of dynamic tissue properties, such as TLFD in the context of muscle activity, where interactions are inherently nonlinear and nonstationary and are influenced by complex biomechanical and neuromuscular processes [16]. CRQA can detect subtle changes in coordination between tissue properties (e.g., stiffness or elasticity) and EMG signals, even when these relationships vary over time or occur at different temporal scales. Moreover, its robustness to noise and ability to handle short and heterogeneous time series make it well-suited for in vivo measurements, where experimental constraints often limit data quality and length [21]. As a result, CRQA could provide a more sensitive and physiologically meaningful characterization of tissue–muscle interactions compared to classical time series techniques.
Some limitations should be acknowledged. As a secondary analysis of a case–control dataset, causal inferences cannot be drawn. Moreover, CRQA parameter selection (e.g., embedding dimension, delay, recurrence threshold) influences the resulting metrics and requires careful optimization. Future studies should therefore include systematic parameter optimization (e.g., using methods such as “False Nearest Neighbors” or “Mutual Information”) and sensitivity analyses to further validate and extend the present findings. In addition, they should investigate longitudinal changes in recurrence structure following therapeutic interventions and examine whether CRQA-derived features improve predictive modeling of clinical outcomes. The small sample size (n = 20) is a key limitation of this study and restricts the generalizability of the findings. The study should therefore be regarded as an explanatory secondary analysis that, on the one hand, confirms previous findings but, on the other hand, requires further research to validate the specific CRQA results.

Author Contributions

Conceptualization, A.B.; methodology, A.B.; formal analysis, A.B.; investigation, A.B. and R.S.; writing—original draft preparation, A.B.; writing—review and editing, A.B., M.M. and R.S.; visualization, A.B.; supervision, R.S. All authors have read and agreed to the published version of the manuscript.

Funding

This research received no external funding.

Institutional Review Board Statement

The study was conducted in accordance with the Declaration of Helsinki, and approved by the Ethics Committee of the DIPLOMA Hochschule, Germany (No. 1014/2021).

Informed Consent Statement

Informed consent was obtained from all subjects involved in the study.

Data Availability Statement

Data can be made available by the author upon request.

Conflicts of Interest

The authors declare no conflicts of interest.

Abbreviations

The following abbreviations are used in this manuscript:
%DETPercent determinism
%MVC% of maximum voluntary contraction
%RECCross-recurrence rate
ARIMAAutoregressive integrated moving average
CLRComponents of lumbar muscle recurrence
CMLRComponents of left multifidus muscle recurrence
CRPCross-recurrence plot
CRQACross-Recurrence Quantification Analysis
EMGElectromyography
ENTRShannon entropy
LBPLow back pain
LENLength of line structures
PCAPrincipal component analysis

References

  1. Box, G.; Jenkins, G. Time-Series Analysis: Forecasting and Control; Holden-Day: San Francisco, CA, USA, 1976. [Google Scholar]
  2. Fusaroli, R.; Tylén, K. Investigating Conversational Dynamics: Interactive Alignment, Interpersonal Synergy, and Collective Task Performance. Cogn. Sci. 2016, 40, 145–171. [Google Scholar] [CrossRef] [Scilit]
  3. von der Malsburg, T.; Kliegl, R.; Vasishth, S. Determinants of Scanpath Regularity in Reading. Cogn. Sci. 2015, 39, 1675–1703. [Google Scholar] [CrossRef] [Scilit]
  4. Schubert, C. The Integrative Single-Case Design as a Biosemiotic-Systemic Research Tool in Psychoneuroimmunology. In Psychoneuroimmunology: Methods and Protocols; Yan, Q., Ed.; Springer: New York, NY, USA, 2024; ISBN 978-1-4939-7827-4. [Google Scholar]
  5. Brandl, A.; Engel, R.; Egner, C.; Schleip, R.; Schubert, C. Relations between Daily Stressful Events, Exertion, Heart Rate Variability, and Thoracolumbar Fascia Deformability: A Case Report. J. Med. Case Rep. 2024, 18, 589. [Google Scholar] [CrossRef] [Scilit]
  6. Wallot, S.; Fusaroli, R.; Tylen, K.; Jegindø, E.-M. Using Complexity Metrics with R-R Intervals and BPM Heart Rate Measures. Front. Physiol. 2013, 4, 211. [Google Scholar] [CrossRef] [Scilit] [PubMed]
  7. Ferreira, M.L.; de Luca, K.; Haile, L.M.; Steinmetz, J.D.; Culbreth, G.T.; Cross, M.; Kopec, J.A.; Ferreira, P.H.; Blyth, F.M.; Buchbinder, R.; et al. Global, Regional, and National Burden of Low Back Pain, 1990–2020, Its Attributable Risk Factors, and Projections to 2050: A Systematic Analysis of the Global Burden of Disease Study 2021. Lancet Rheumatol. 2023, 5, e316–e329. [Google Scholar] [CrossRef] [Scilit] [PubMed]
  8. van Tulder, M.; Becker, A.; Bekkering, T.; Breen, A.; Gil del Real, M.T.; Hutchinson, A.; Koes, B.; Laerum, E.; Malmivaara, A. European Guidelines for the Management of Acute Nonspecific Low Back Pain in Primary Care. Eur. Spine J. 2006, 15, s169–s191. [Google Scholar] [CrossRef] [Scilit]
  9. Langevin, H.M.; Fox, J.R.; Koptiuch, C.; Badger, G.J.; Greenan-Naumann, A.C.; Bouffard, N.A.; Konofagou, E.E.; Lee, W.-N.; Triano, J.J.; Henry, S.M. Reduced Thoracolumbar Fascia Shear Strain in Human Chronic Low Back Pain. BMC Musculoskelet. Disord. 2011, 12, 203. [Google Scholar] [CrossRef] [Scilit]
  10. Wilke, J.; Schleip, R.; Klingler, W.; Stecco, C. The Lumbodorsal Fascia as a Potential Source of Low Back Pain: A Narrative Review. BioMed Res. Int. 2017, 2017, 5349620. [Google Scholar] [CrossRef] [Scilit]
  11. Brandl, A.; Schleip, R. The In Vitro and Vivo Validation of a New Ultrasound Method to Quantify Thoracolumbar Fascia Deformation. J. Clin. Med. 2025, 14, 1736. [Google Scholar] [CrossRef] [Scilit] [PubMed]
  12. Tomita, N.; Roy-Cardinal, M.-H.; Chayer, B.; Daher, S.; Attiya, A.; Boulanger, A.; Gaudreault, N.; Cloutier, G.; Bureau, N.J. Thoracolumbar Fascia Ultrasound Shear Strain Differs between Low Back Pain and Asymptomatic Individuals: Expanding the Evidence. Insights Imaging 2025, 16, 18. [Google Scholar] [CrossRef] [Scilit]
  13. Hao, Z.; Xie, L.; Wang, J.; Hou, Z. Spatial Distribution and Asymmetry of Surface Electromyography on Lumbar Muscles of Soldiers with Chronic Low Back Pain. Pain Res. Manag. 2020, 2020, 6946294. [Google Scholar] [CrossRef] [Scilit]
  14. Koppenhaver, S.; Gaffney, E.; Oates, A.; Eberle, L.; Young, B.; Hebert, J.; Proulx, L.; Shinohara, M. Lumbar Muscle Stiffness Is Different in Individuals with Low Back Pain than Asymptomatic Controls and Is Associated with Pain and Disability, but Not Common Physical Examination Findings. Musculoskelet. Sci. Pract. 2020, 45, 102078. [Google Scholar] [CrossRef] [Scilit]
  15. Tong, M.H.; Mousavi, S.J.; Kiers, H.; Ferreira, P.; Refshauge, K.; van Dieën, J. Is There a Relationship between Lumbar Proprioception and Low Back Pain? A Systematic Review with Meta-Analysis. Arch. Phys. Med. Rehabil. 2017, 98, 120–136. [Google Scholar] [CrossRef] [Scilit]
  16. Arvanitidis, M.; Bikinis, N.; Petrakis, S.; Gkioka, A.; Tsimpolis, D.; Falla, D.; Martinez-Valdes, E. Spatial Distribution of Lumbar Erector Spinae Muscle Activity in Individuals with and without Chronic Low Back Pain during a Dynamic Isokinetic Fatiguing Task. Clin. Biomech. 2021, 81, 105214. [Google Scholar] [CrossRef] [Scilit]
  17. Hodges, P.W.; Pengel, L.H.M.; Herbert, R.D.; Gandevia, S.C. Measurement of Muscle Contraction with Ultrasound Imaging. Muscle Nerve 2003, 27, 682–692. [Google Scholar] [CrossRef] [Scilit] [PubMed]
  18. Nakai, Y.; Kawada, M.; Miyazaki, T.; Kiyama, R. Trunk Muscle Activity during Trunk Stabilizing Exercise with Isometric Hip Rotation Using Electromyography and Ultrasound. J. Electromyogr. Kinesiol. 2019, 49, 102357. [Google Scholar] [CrossRef] [Scilit] [PubMed]
  19. Brandl, A.; Egner, C.; Reer, R.; Schmidt, T.; Schleip, R. Associations between Deformation of the Thoracolumbar Fascia and Activation of the Erector Spinae and Multifidus Muscle in Patients with Acute Low Back Pain and Healthy Controls: A Matched Pair Case-Control Study. Life 2022, 12, 1735. [Google Scholar] [CrossRef] [Scilit]
  20. Seizer, L.; Gostner, J.M.; Garbers, C.; Licht, M.; Sager, S.; Brandl, A.; Schubert, C. Endocrine, Immune and Disease Dynamics in a Patient with Rheumatoid Arthritis during Flare and Medication Change. Front. Immunol. 2025, 16, 1491475. [Google Scholar] [CrossRef] [Scilit]
  21. Marwan, N.; Carmen Romano, M.; Thiel, M.; Kurths, J. Recurrence Plots for the Analysis of Complex Systems. Phys. Rep. 2007, 438, 237–329. [Google Scholar] [CrossRef] [Scilit]
  22. Dean, R.T.; Dunsmuir, W.T.M. Dangers and Uses of Cross-Correlation in Analyzing Time Series in Perception, Performance, Movement, and Neuroscience: The Importance of Constructing Transfer Function Autoregressive Models. Behav. Res. 2016, 48, 783–802. [Google Scholar] [CrossRef] [Scilit]
  23. Brandl, A.; Wilke, J.; Horstmann, T.; Reer, R.; Egner, C.; Schmidt, T.; Schleip, R. Quantifying Thoracolumbar Fascia Deformation to Discriminate Acute Low Back Pain Patients and Healthy Individuals Using Ultrasound. Sci. Rep. 2024, 14, 20044. [Google Scholar] [CrossRef] [Scilit] [PubMed]
  24. Wallot, S.; Leonardi, G. Analyzing Multivariate Dynamics Using Cross-Recurrence Quantification Analysis (CRQA), Diagonal-Cross-Recurrence Profiles (DCRP), and Multidimensional Recurrence Quantification Analysis (MdRQA)—A Tutorial in R. Front. Psychol. 2018, 9, 2232. [Google Scholar] [CrossRef] [Scilit]
  25. Coco, M.I.; Dale, R. Cross-Recurrence Quantification Analysis of Categorical and Continuous Time Series: An R Package. Front. Psychol. 2014, 5, 510. [Google Scholar] [CrossRef] [Scilit]
  26. R Core Team. R: A Language and Environment for Statistical Computing; R Foundation for Statistical Computing: Vienna, Austria, 2022. [Google Scholar]
  27. Webber, C.; Zbilut, J. Recurrence Quantification Analysis of Nonlinear Dynamical Systems. In Tutorials in Contemporary Nonlinear Methods for the Behavioral Sciences; U.S. National Science Foundation: Alexandria, VA, USA, 2005. [Google Scholar]
  28. Timothy, L.T.; Krishna, B.M.; Nair, U. Classification of Mild Cognitive Impairment EEG Using Combined Recurrence and Cross Recurrence Quantification Analysis. Int. J. Psychophysiol. 2017, 120, 86–95. [Google Scholar] [CrossRef] [Scilit]
  29. Drews, H.J.; Felletti, F.; Kallestad, H.; Drews, A.; Scott, J.; Sand, T.; Engstrøm, M.; Heglum, H.S.A.; Vethe, D.; Salvesen, Ø.; et al. Using Cross-Recurrence Quantification Analysis to Compute Similarity Measures for Time Series of Unequal Length with Applications to Sleep Stage Analysis. Sci. Rep. 2024, 14, 23142. [Google Scholar] [CrossRef] [Scilit]
  30. Jolliffe, I. Principal Component Analysis. In International Encyclopedia of Statistical Science; Lovric, M., Ed.; Springer: Berlin/Heidelberg, Germany, 2025; pp. 1945–1948. ISBN 978-3-662-69358-2. [Google Scholar]
  31. Gorsuch, R.L. Exploratory Factor Analysis: Its Role in Item Analysis. J. Personal. Assess. 1997, 68, 532–560. [Google Scholar] [CrossRef] [Scilit]
  32. MacCallum, R.C.; Widaman, K.F.; Zhang, S.; Hong, S. Sample Size in Factor Analysis. Psychol. Methods 1999, 4, 84–99. [Google Scholar] [CrossRef]
  33. Cohen, J. Statistical Power Analysis for the Behavioral Sciences; Revised Edition; Academic Press: New York, NY, USA, 1988; ISBN 978-0-12-179060-8. [Google Scholar]
  34. Zhang, T.; Firouzabadi, A.; Becker, L.; Schönnagel, L.; Yang, D.; Liu, S.; Arampatzis, A.; Reitmaier, S.; Schmidt, H. Association between Lumbar Paraspinal Muscle Activities and Quality in Chronic Low Back Pain: A Cross-Sectional Analysis. Eur. Spine J. 2025, 34, 1348–1358. [Google Scholar] [CrossRef] [Scilit] [PubMed]
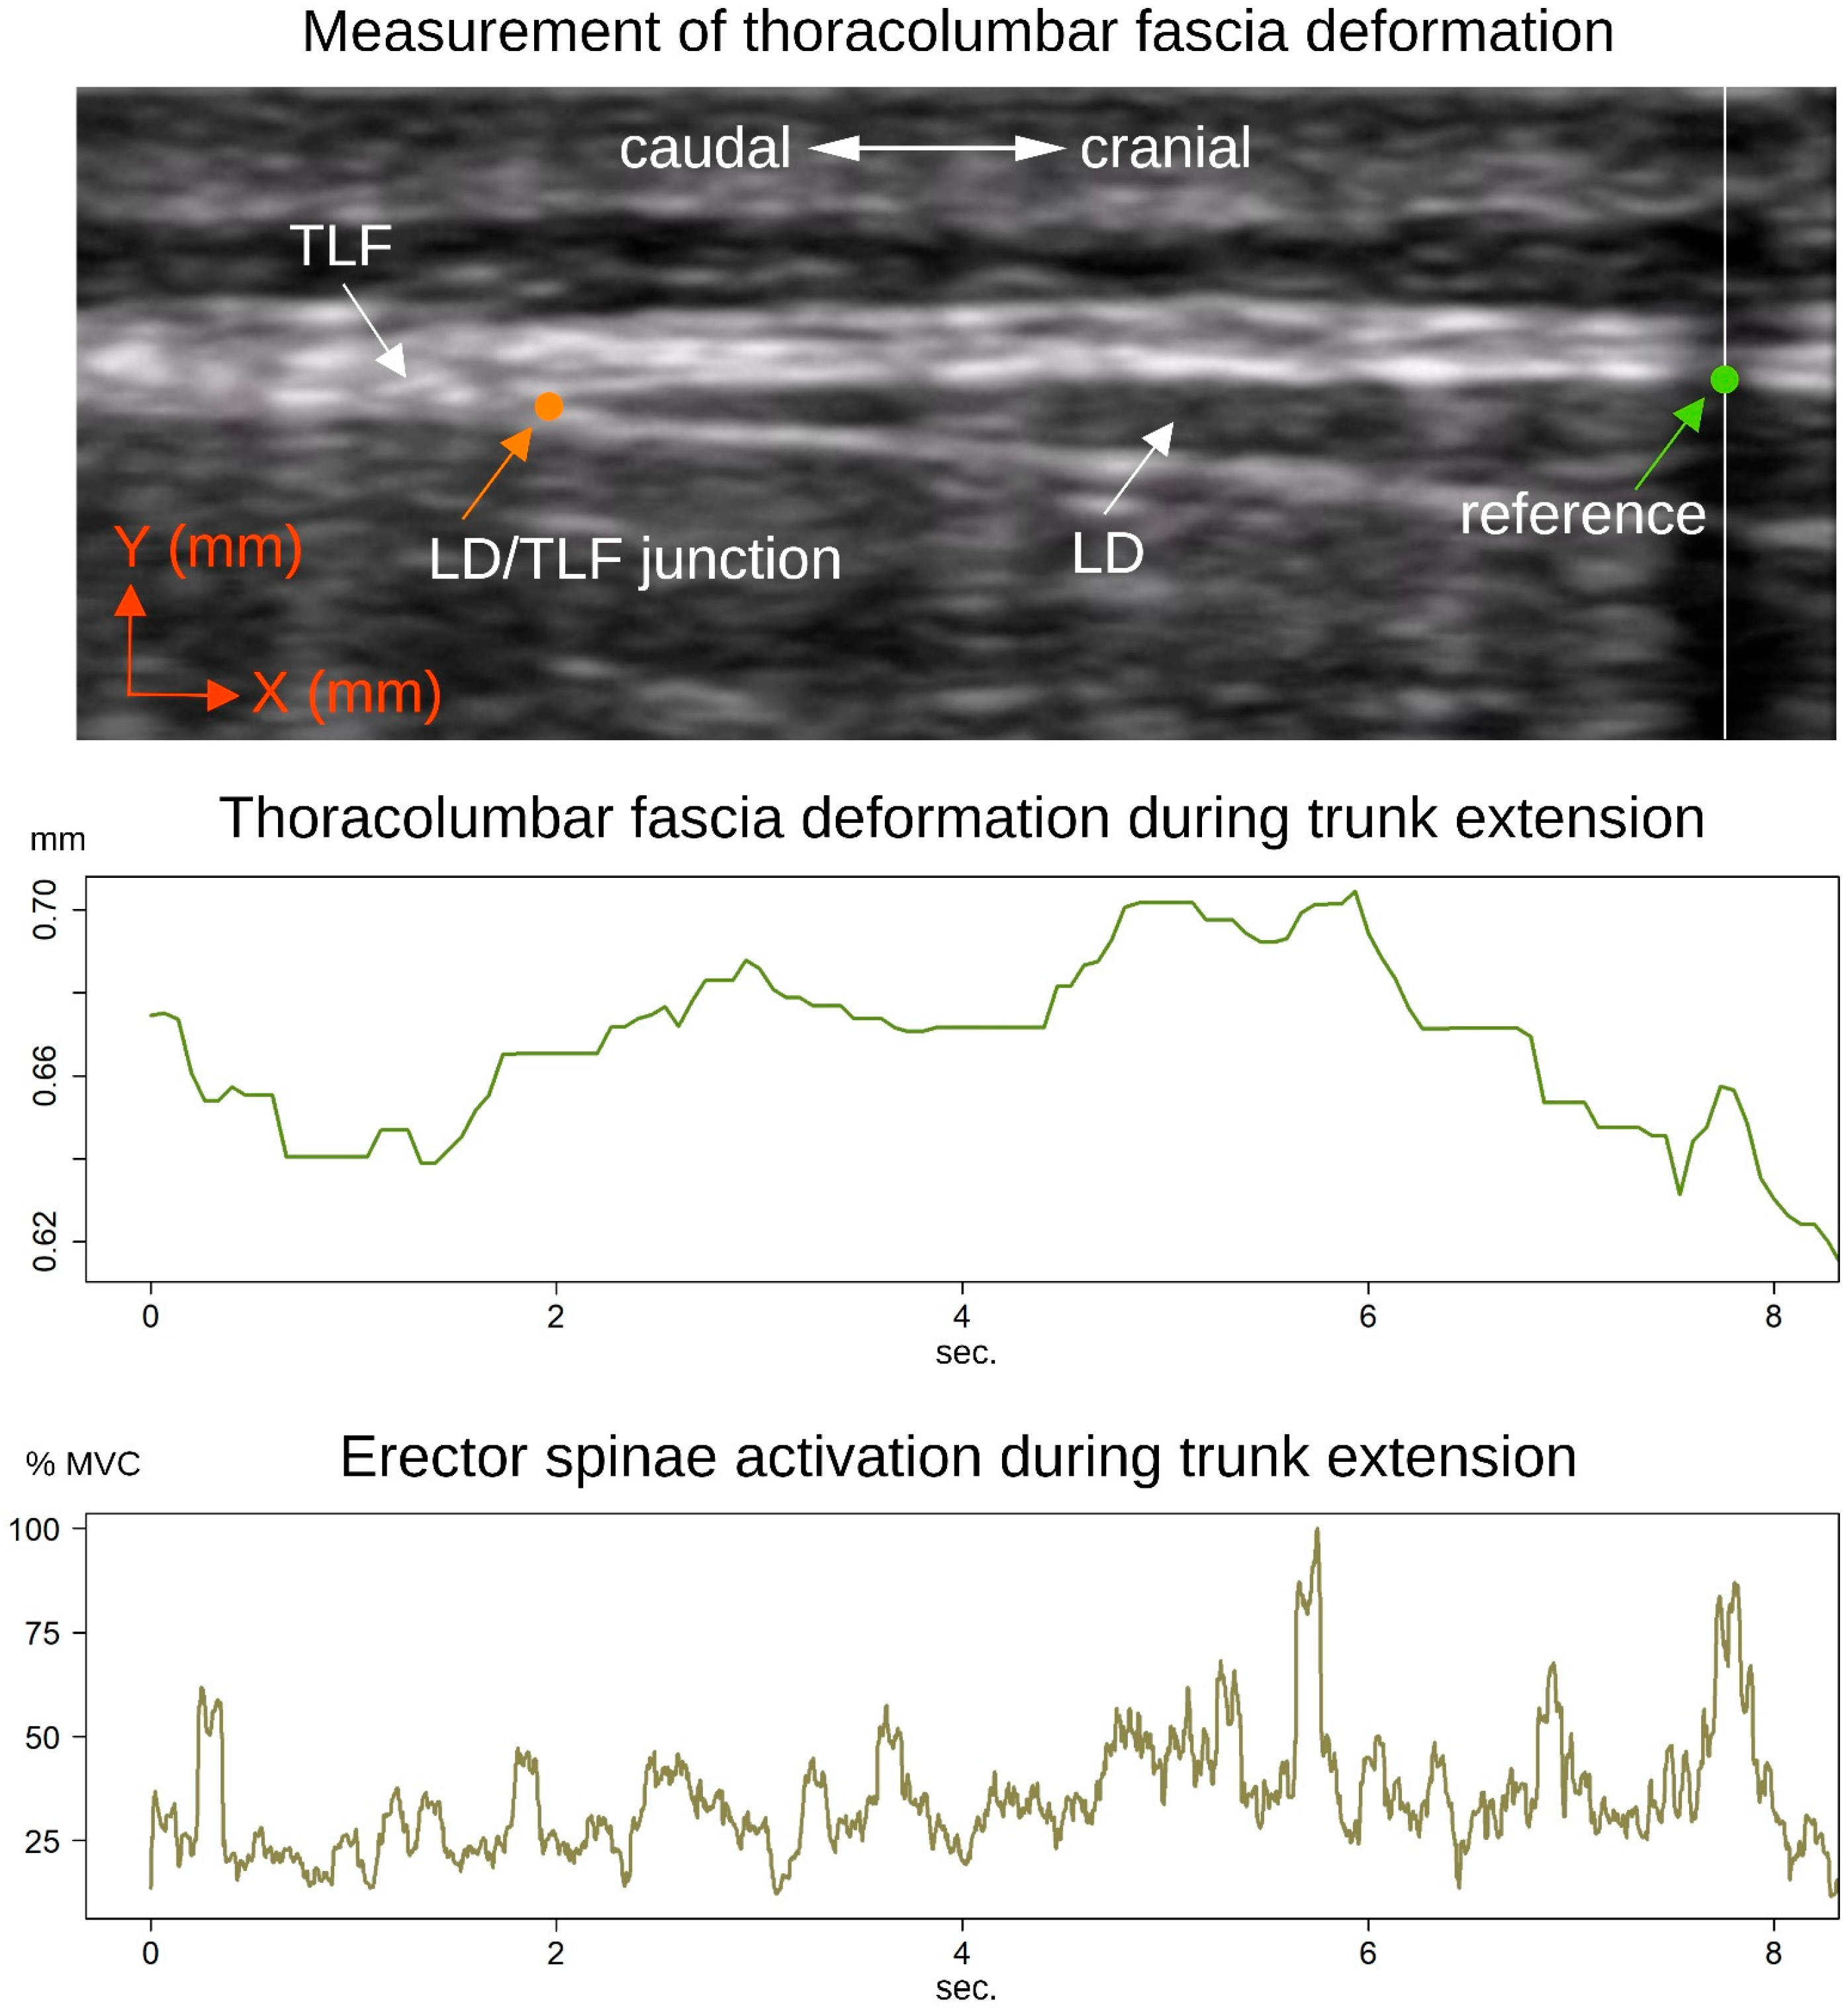
Figure 1. Raw signal recording of lumbar myofascial parameters. The ultrasound image shows the measurement method described by Brandl et al. [11,23], in which the deformation of the thoracolumbar fascia (TLFD) is measured based on the junction of the latissimus muscle and the thoracolumbar fascia (LD/TLF) and an artificial reference provided by a reflective tape on the skin. Two time series for trunk extension were derived using the TLFD and the corresponding electromyographic activation potential of the erector spinae (and multifidus) muscle.
Stats 09 00035 g001
Figure 2. EMG electrode placement and data acquisition. TLFD, raw time series of thoracolumbar fascia deformation during trunk extension; EMG, raw time series of surface electromyographically measured % maximum voluntary contraction; CRP, cross-recurrence plot of TLFD and respective EMG; L1l, measurement point on left erector spinae muscle; L1r, measurement point on right erector spinae muscle; L5l, measurement point on left multifidus muscle; L5r, measurement point on right multifidus muscle.
Stats 09 00035 g002
Figure 3. Correlation matrix of cross-recurrence components vs. Granger causality. The color and size of the squares indicate the correlation strength, with blue shading indicating positive correlations and red shading indicating negative correlations. The numbers in the squares represent the Pearson product-moment correlation coefficient. Crossed-out squares indicate non-significant correlations (p ≥ 0.05). CLR, components of lumbar muscle recurrence; CMLR, components of left multifidus muscle recurrence; GCS, Granger causality; L1l, measurement point on left erector spinae muscle; L1r, measurement point on right erector spinae muscle; L5l, measurement point on left multifidus muscle; L5r, measurement point on right multifidus muscle.
Stats 09 00035 g003
Table 1. Component loadings after VARIMAX rotation.
Component
CLRCMLRUniquenessEigenvalue% of Variance
%REC_L5l 0.6830.5313.1 × 10−177.3 × 10⁻¹⁷
%DET_L5l 0.8080.3321.1 × 10−171.8 × 10⁻¹⁶
ENTR_L5l 0.7730.3920.100.6
LEN_L5l 0.6410.5221.15.1 × 10−16
%REC_L5r 0.8910.2041.05.6 × 10−16
%DET_L5r0.950 0.0988.2151.3
LEN_L5r0.939 0.1090.392.4
ENTR_L5r0.934 0.0581.07.8 × 10−16
%REC_L1l 0.8910.2042.2 × 10−177.0 × 10⁻¹⁷
%DET_L1l0.950 0.0984.6128.8
LEN_L1l0.939 0.1090.191.2
ENTR_L1l0.934 0.0580.030.2
%REC_L1r 0.8910.2041.7 × 10−171.8 × 10⁻¹⁶
%DET_L1r0.950 0.0981.6010.1
LEN_L1r0.939 0.1090.885.5
ENTR_L1r0.934 0.0584.9 × 10−173.1 × 10⁻¹⁶
CLR, components of lumbar muscle recurrence; CMLR, components of left multifidus muscle recurrence; %REC, recurrence rate; %DET, percent determinism; LEN, average length of line structures; L5l, left multifidus muscle EMG measurement point; L5r, right multifidus muscle EMG measurement point; L1l, left EMG erector spinae muscle EMG measurement point; L1r, right EMG erector spinae muscle EMG measurement point.
Table 2. Descriptive statistics of Components.
95% Confidence Interval
GroupMeanLowerUpperSD
CLRLBP−2.963−6.920.9905.53
H2.963−3.769.6899.40
CMLRLBP0.975−1.763.7073.82
H−0.975−5.023.0685.65
CLR, components of lumbar muscle recurrence; CMLR, components of left multifidus muscle recurrence; LBP, low back pain patients; H, healthy persons; SD, standard deviation.
Disclaimer/Publisher’s Note: The statements, opinions and data contained in all publications are solely those of the individual author(s) and contributor(s) and not of MDPI and/or the editor(s). MDPI and/or the editor(s) disclaim responsibility for any injury to people or property resulting from any ideas, methods, instructions or products referred to in the content.