Article

A County-Level Analysis of the Economic Performance in Romania and Bulgaria Using Hierarchical Algorithms

by
Alexandra-Nicoleta Ciucu (Durnoi)
1,2,
Camelia Delcea
2,* and
Kosyo Stoychev
3
1
Institute for Economic Forecasting, Romanian Academy, 050711 Bucharest, Romania
2
Department of Economic Informatics and Cybernetics, Bucharest University of Economic Studies, 010552 Bucharest, Romania
3
Department of Regional and Political Geography, Sofia University “St. Kliment Ohridski”, 1164 Sofia, Bulgaria
*
Author to whom correspondence should be addressed.
Stats 2024, 7(4), 1099-1127; https://doi.org/10.3390/stats7040065
Submission received: 3 September 2024 / Revised: 9 October 2024 / Accepted: 10 October 2024 / Published: 11 October 2024

Abstract

:
The EU Regional Competitiveness Index 2.0 measures a region’s ability to provide an attractive environment for businesses and residents to work and live. According to this indicator, countries in the southern and eastern regions of the European Union are reported to have the lowest values. As it measures the performance of NUTS-2 regions, it was desired to study the problem in more detail, reaching the NUTS-3 level. Thus, within the current research, Romania and Bulgaria are studied by means of a county-level analysis of the economies of the two states established through the prism of the labor market, the field of health, transport, enterprises, tourism, education, and research. Through eight indicators, a series of maps designed to present the situation of the two states was illustrated, and the investigation continued with a cluster analysis carried out by the implementation of hierarchical algorithms. During the course of the current study, a classification and a ranking of the counties of the two countries were performed to determine the areas with the best or, in contrast, the poorest performance.

1. Introduction

The Regional Competitiveness Index, which appeared in 2010, addresses the ability of NUTS-2 regions to provide a sustainable and attractive environment for enterprises and inhabitants. According to the creators of this index, it represents the first composite indicator designed to present a synthesized situation of the competitiveness of the regions of which the EU member states are a part. This indicator is made up of 11 pillars grouped into three categories: basic, efficiency, and innovation. The basic group is made up of institutions, infrastructure, macroeconomic stability, health, and primary and secondary education, while efficiency is made up of higher education, labor market efficiency, market size, and training and lifelong learning. Innovation is defined based on technological readiness, innovation, and business sophistication indicators. According to the researchers who created this index, since then the regions in the south and east of Europe have tended to have lower scores compared to those in the northwest [1]. In the current edition of the Regional Competitiveness Index 2.0 there are 68 indicators, 60 of which are used in various previous versions, and 8 are newly integrated in the 2022 version. Among the results provided, it is noted that all the regions in the east, except for most of the regions containing the capitals, obtained values below the EU average, with Bulgaria and Romania at the bottom of the ranking. According to this indicator, excluding two regions from Greece, the last ten positions are occupied by regions from Romania and Bulgaria, two regions from Bulgaria (Yugoiztochen and Severozapaden), and six from Romania (northwest, center, south Muntenia, southwest Oltenia, northeast, and southeast) [2]. Thus, the current research aims to study the two countries because there are similarities between them compared to the other EU states, but the differences between them should not be neglected either [3].
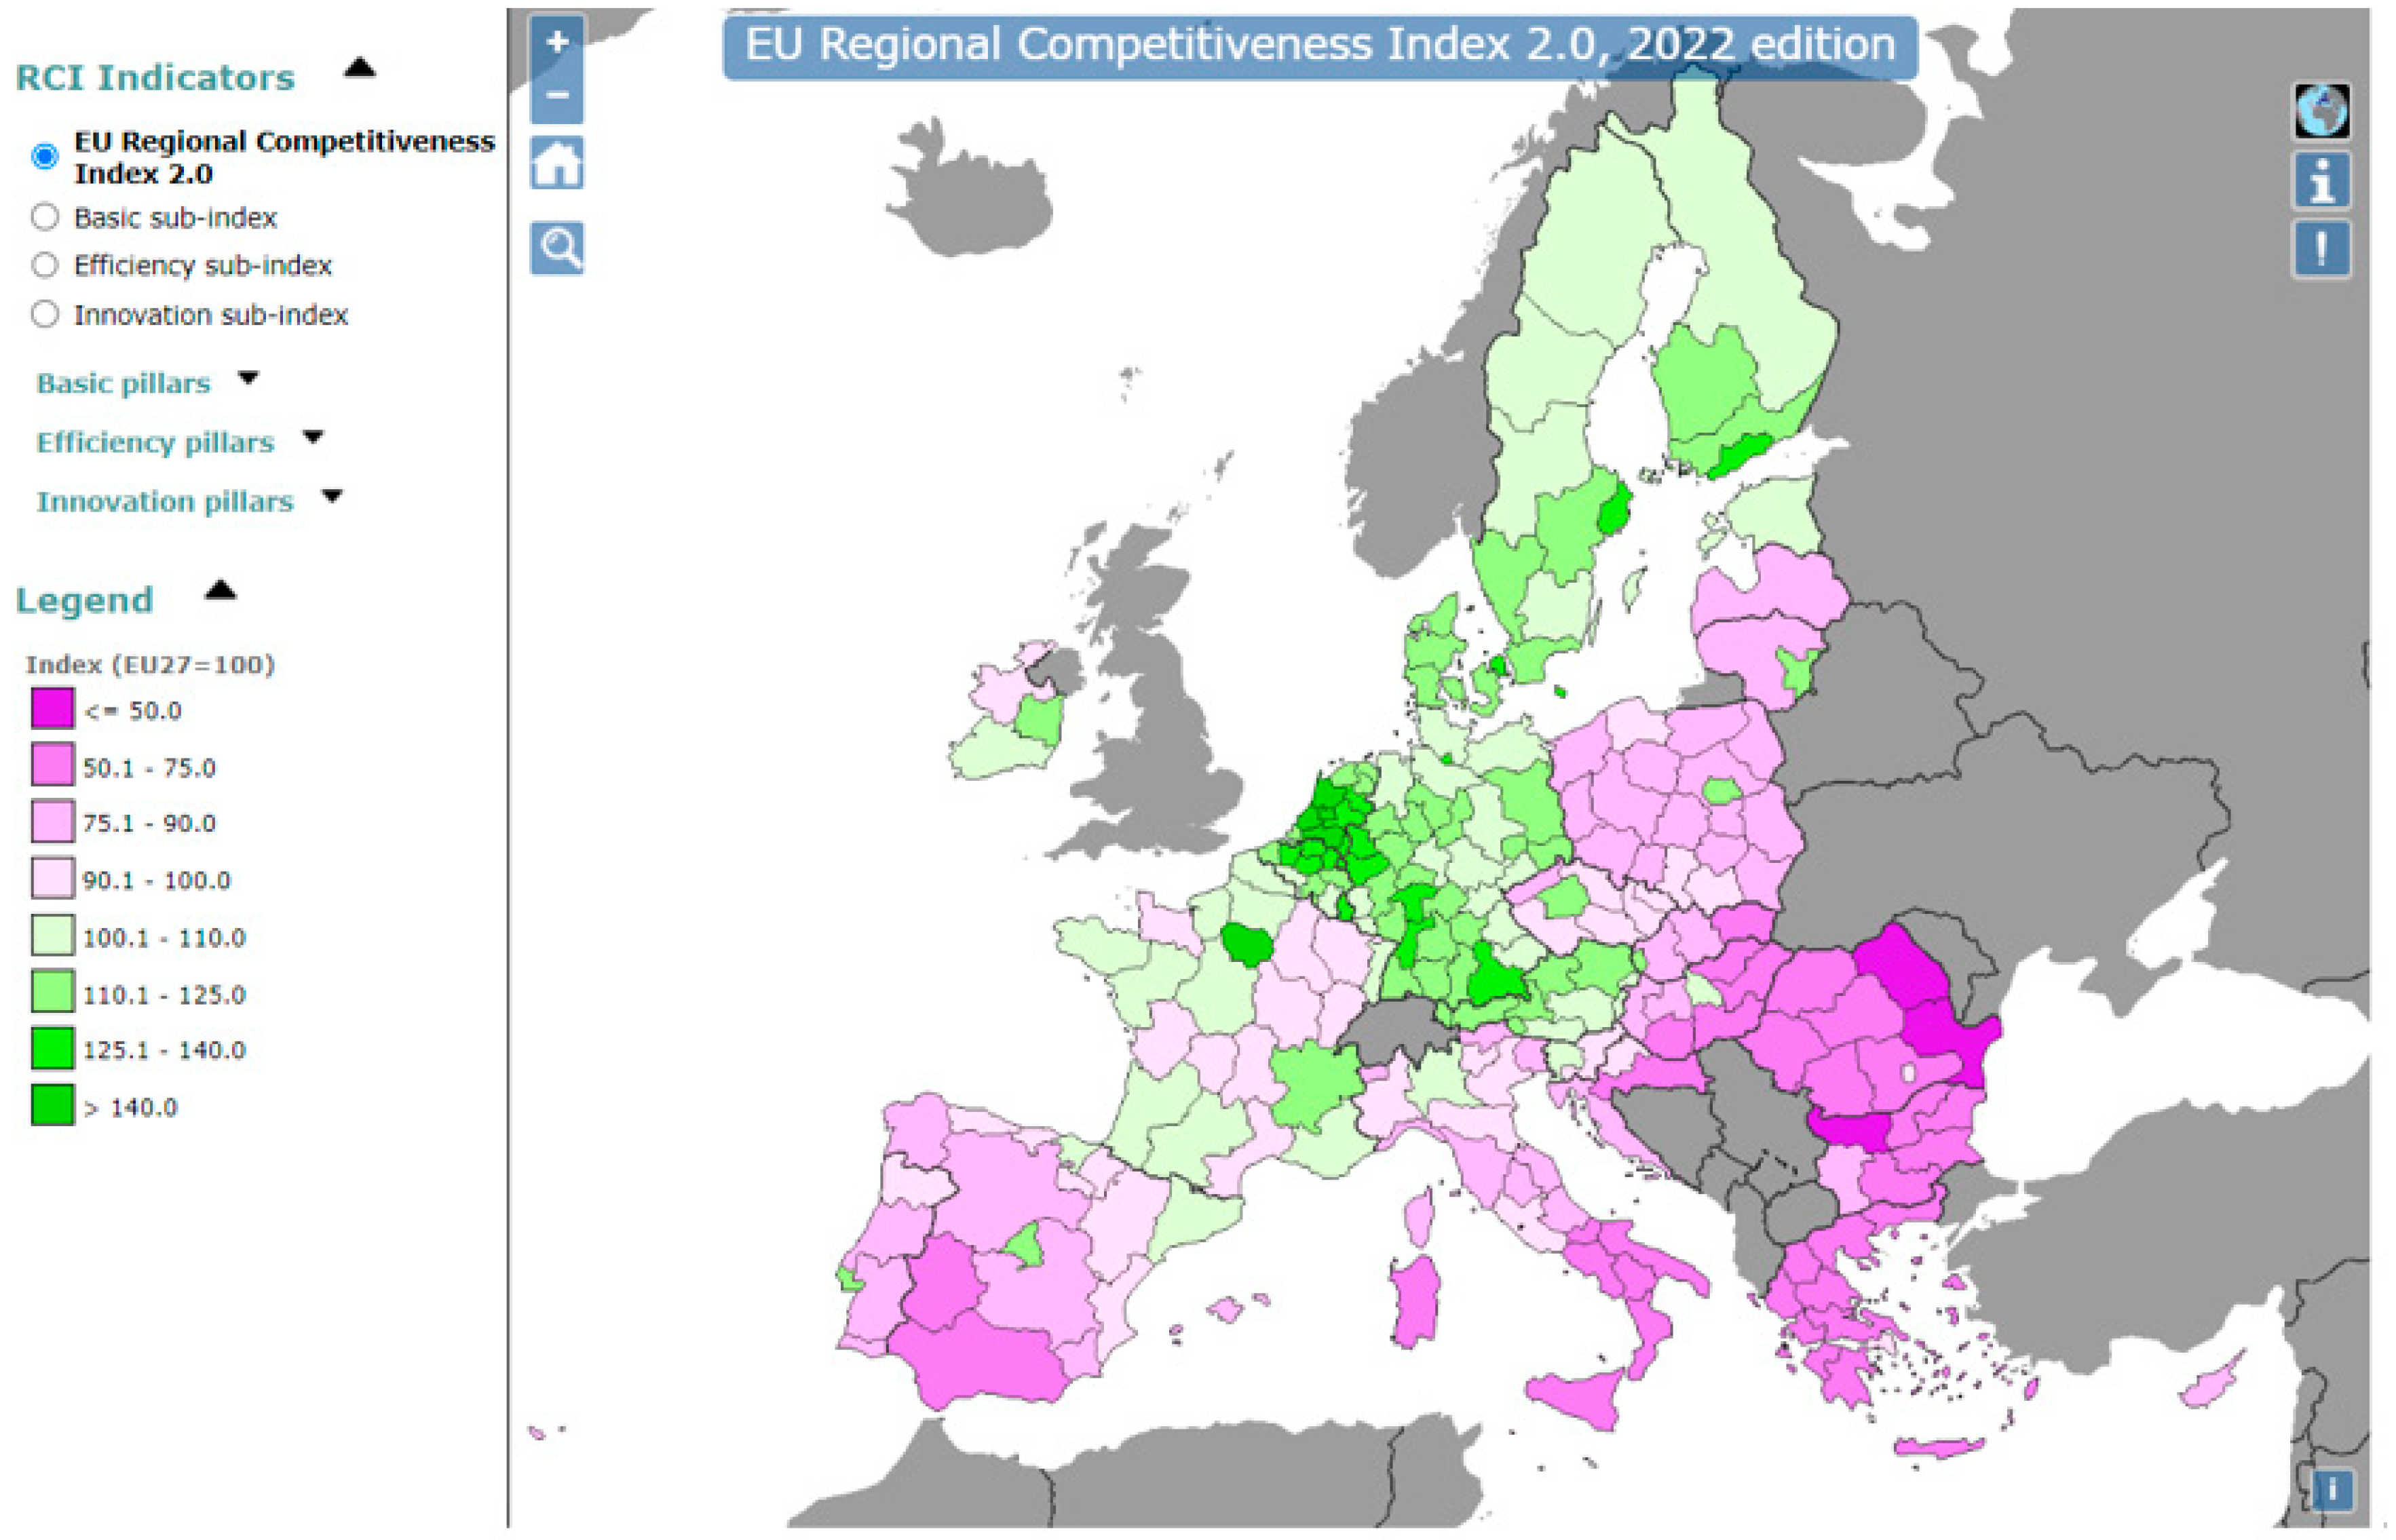
According to the EU Regional Competitiveness Index 2.0—2022, among the two countries analyzed, the region with the best score is Bucharest-Ilfov, followed by the region containing the capital of Bulgaria. Furthermore, the worst results were identified for regions such as northwestern Bulgaria and the northeast and southeast of Romania. It can also be noted, through Figure 1, that these countries seem to have the worst performance in the EU, which is why a thorough study was desired at the NUTS-3 level.
In the content of the research methodology, information on clustering is discussed, the technique of hierarchical algorithms is detailed, and the best-known agglomerative clustering methods are presented, together with the algorithm by which clusters are created using hierarchical algorithms. In addition, in this section, the eight indicators selected to be examined are presented, specifying the areas of the economy to which they belong.
The section dedicated to the results begins with the presentation of some descriptive statistics designed to present general information about the data sets analyzed. In their continuation, maps were illustrated to show the results obtained by the 70 regions for each indicator separately, the next step consisting of the application of hierarchical algorithms using both the complete linkage method and Ward’s method, helping to observe the common characteristics within the formed classes.
The first indicator considered refers to the ability of regions to attract tourists. In a study on tourism in the area of the Carpathian Mountains, researchers state that there are studies that attest to the fact that low interest in sustainable development brings with it less competitiveness, as well as low comfort in accommodation units [4]. The same can be said in the case of smart tourism, noting that the increase in the number of arrivals of tourists progressively influences the smart development of destinations in Romania, and this development leads to an increase in the number of overnight stays in accommodation units [5]. Sustainable tourism involves, among other things, the protection of cultural and natural assets. In the case of Romania, the performances in sustainable tourism are recorded for the Black Sea area, the Carpathian Mountains area, the Danube Delta, and in big cities [6]. According to another study on the sustainable nature of tourism in the Black Sea area, in which Romania, Bulgaria, and Turkey were evaluated, it was observed that international tourism expenditures and numbers of international tourism arrivals are sustainable in the case of Bulgaria, international tourism receipts for Romania, and international tourism receipts for travel items for Turkey. In the case of Bulgaria and Turkey, there is an increase in greenhouse gas emissions, but Romania still manages to apply certain effective measures to reduce them [7].
One of the indicators by which the efficiency of the labor market is tested is the unemployment rate. An analysis of territorial competitiveness and territorial cohesion shows that the areas in the center and west of the country are characterized by mature industries and better developed services, while the regions in the south and east have a predominantly rural character, with intraregional disparities, social depravity, and industrial decline [8]. Regarding the evolution of the labor market in Bulgaria, the period before COVID-19 was characterized by low unemployment rates and an increase in the employment rate, but after the pandemic many of the activity sectors were severely negatively affected [9]. Indicators such as high unemployment, non-participation of full labor potential, low labor quality, and low minimum and average wages lead to the destabilization of the economic security of the state, so it is the role of the state to identify and eliminate these threats through macroeconomic mechanisms [10].
In terms of health, the two countries are also at the bottom of the ranking in terms of life expectancy. Therefore, from the point of view of infant mortality, Romania and Bulgaria are the countries with the highest rates, while for the rate of mortality caused by chronic diseases, the two countries are in third and fourth place [11]. However, it should be remembered that in both countries the budgets granted for health are among the lowest in Europe, so the results obtained by the two EU member states should not be surprising [12,13]. Also, Romania has some of the lowest numbers of physicians in the EU, and the same can be said for Bulgaria, but in the case of nurses and midwives. The migration of doctors is one of the reasons why the two countries are facing small numbers, with one of the countries that attracts doctors being Germany [14].
In the current research, education is analyzed through the lens of the percentage of children who are enrolled in kindergarten. According to a study on quality early childhood education and care (ECEC), which is tracked through four indicators—integrated governance under one leading authority, coherent educational guidelines throughout the entire ECEC phase, staff holding a bachelor’s degree in education in all groups of children, and entitlement to a place from an early age for every child—it was observed that in Romania, a place was not guaranteed for all children, while in Bulgaria, there was no educational guide to work with the little ones, but a place was guaranteed for the last years of ECEC [15].
For the innovation component of RCI 2.0, the number of employees in the field of research and development was analyzed. Regarding the situation of the two countries in the context of the EU regarding R&D and innovation systems, it is noted that in the period of 2006–2013, the innovative performances of the two countries were well below the EU average. For the year 2013, Bulgaria had the lowest score according to European Innovation Scoreboards, and Romania the fourth lowest score, both countries entering the “modest innovators” category. In addition, R&D expenditures as a percentage of GDP were much lower compared to the EU average for the period of 2004–2013 [16]. According to another study on the link between R&D expenditure and economic growth, it is noted that R&D expenditure in the higher education sector and R&D expenditure in the government sector influence GDP in the short run, while R&D expenditure in the business enterprise sector has a higher impact on economic growth in the long run [17]. In the period of 2010–2013, it is observed in the case of Bulgaria that at least half of the gross domestic expenditure on R&D comes from the business enterprise sector, followed by the government sector, higher education, and a very small percentage from the private non-profit sector. Also, during the mentioned period, half of the funding sources come from abroad [18].
Economic growth is ensured, among others, by transport infrastructure because through transport networks, the efficiency of the distribution of resources is ensured, as well as the mobility of people [19]. Regarding the length of motorways in the EU, it is noted that most member states have the majority of motorway kilometers built after 1990, and Bulgaria is among the countries where all motorways were built after 1990. In 2020, Bulgaria had a greater length of highways compared to Romania, the two countries being in seventh and eighth place in the top states with the fewest kilometers of highway built [20]. Among the results provided by our research, it will be possible to see if Bulgaria still has a greater length of constructed highway or if the balance is tipping in Romania’s favor. According to another study on regional development in Romania in the period of 2000–2016, a direct link is observed between economic growth and the number of companies in NUTS-2 regions, noting that the Bucharest-Ilfov region has by far the largest number of companies, as well as the most significant economic growth [21].
Although there are a multitude of studies that have investigated regional disparities—not only at the EU level, but also in more local settings—as can be noted, according to the previously cited studies, research on counties is more limited due to the lack of data. One of the most complex indicators studying the regional disparities of the EU is RCI 2.0, which is also mentioned in this section, but it is limited to NUTS-2 regions. The novelty of the current research lies in the detailed study of this issue, in an even more advanced framework, and the differences between NUTS-3 regions.
This research aims to provide a clearer picture of the problems identified in these regions, with certain recommendations for reducing these identified irregularities also being offered in the Discussion. The purpose of the cluster analysis is to group those counties with common characteristics to be able to offer specific solutions to them. There are also regions where not so many problems are identified compared to others and which can serve as an example for others. Cluster analysis has also been used in other studies to determine the highlighted differences between regions, both at the EU [21] and NUTS-2 region [22] level, but studies on NUTS-3 regions are more limited. The novelty of this study lies precisely in its deepening of the problem at the county level. The lack of data at the county level has led to the identification of a limited number of indicators to describe the economic context of the two countries, but the identified variables can be integrated as components of RCI 2.0, which is presented in further detail in section two.

2. Materials and Methods

Clustering is a method of recognizing patterns in data and creating classes of similar objects, the goal being to have the most common characteristics within the cluster, which are different from those found in other clusters. In the case of this research, clustering is used to group counties with similar characteristics into classes to be able to analyze the similarities between the counties of a class, as well as the differences recorded by NUTS-3 regions from different clusters. As with the K-means algorithm, hierarchical clustering is a powerful unsupervised machine learning algorithm that uses a distance-based algorithm to determine the distance between classes [22]. Unsupervised methods are used when the number of classes is not known a priori. There are two ways to implement hierarchical algorithms. The first option can be agglomerative, in which case each object initially represents a cluster, joining iteratively, while the second option is divisive, so that at the beginning there is only one cluster that is later divided [23]. The final product of this algorithm is a dendrogram that represents the links between the clusters and the distances at which they were joined. This method is used when the number of classes is not known, but also when the data are complex, so proper data visualization guidance is required [24].
The most important agglomerative clustering methods are the complete/single/average link and Ward’s method, by which the degrees of similarity are presented based on the least/most/average similar objects, indicating the largest/smallest/average distance between them [25]. Ward’s linkage method combines those objects by which the overall variability within the cluster increases to the smallest possible degree. This method is used especially when a relatively equal number of objects in the classes is expected and if there are no outliers [26]. Although there are studies that support the elimination of outliers before implementing the cluster analysis because it leads to better quality [27], it must be taken into account that they also represent information that can help to understand data behavior [28]. In some situations, such as the analysis of the counties presented in the current study, they cannot be eliminated because it is necessary to understand the results of the countries as a whole, not the detachment of some regions as if they would not help to understand the economic processes in the respective countries.
For the current research, the agglomerative approach will be used, by which in the initial step the Euclidean distances between points are calculated, each point representing a class. The two closest clusters are selected by recalculating the new distances at each step, a step that will be repeated until there is only one cluster [29].
Figure 2 shows the main steps for carrying out the current research, starting from the choice of indicators for NUTS-3 regions, identified by querying the databases made available by the National Statistics Institutes of the two states. An attempt was made to cover as many sectors of interest as possible for the economies of the two countries, such as education, health, transport, etc. The next step consisted of the general presentation of the data discovered through the descriptive statistics initially carried out for all the analyzed regions and later for each individual state. In order to deepen the analysis of the regional indicators, maps were created to illustrate the situation in which each region was found for the year 2022 (this being the last year for which data on the indicators were made available). Since there were different units of measure and orders of magnitude of the indicators, before proceeding to the next step shown in Figure 2, it was necessary to standardize the data. In order to help identify some similarities between regions, a cluster analysis was carried out based on the agglomerative method of hierarchical algorithms, which starts by calculating the Euclidean distances, and in this step each region constitutes a cluster. The algorithm continues with the merging of the two closest clusters (depending on the chosen linkage method, in the present case using complete and Ward), the distances being recalculated after each union, and these steps being carried out until a single class is formed.
The indicators with which these analyses were carried out are illustrated in Table 1, showing the activity sectors to which they belong, the name, and the unit of measurement. Although some of the variables chosen in the analysis are not among the indicators that make up RCI 2.0, it should be noted that they can be classified into the three groups that make up this index. Thus, for the basic group, indicators such as the length of motorways, nights spent—total, infant mortality rate, physicians in health establishments, and group net enrollment rate of children in kindergartens can be included. For innovation, the indicator staff engaged in research and development appeared, and for efficiency, the unemployment rate and relative share of enterprises with more than 250 employees in the total number of enterprises in the district stand out.
Before describing the indicators, it should be stated that they were chosen so that they can be found in the databases of both countries. The first indicator is from the tourism sphere and refers to the number of nights spent in accommodation establishments (V1). For the labor market, the unemployment rate (V2) was chosen, expressed as a percentage, while for the health sector, the number of physicians in health establishments (V3) was used, compared to 10,000 people. For demographic statistics, the infant mortality rate indicator (V4) was selected, which is reported per 1000 live births, while for education, the group net enrollment rate of the children in kindergartens (V5) was chosen, representing the ratio between the number of enrolled children and the total number of children in the same age category. The definition of the field of research and development was carried out by identifying the personnel working in this area (V6) compared to 1000 employees, and the transport performance was cataloged based on kilometers of highway (V7) per 100 square kilometers of the surface of the region. The last indicator, relative share of enterprises with more than 250 employees in the total number of enterprises in the district (V8), was chosen for the non-financial enterprises field.
The data description begins by presenting some statistical elements applied to the entire data set obtained, and the results provided by the two analyzed countries will be presented distinctively.
Table 2 presents the situation for each indicator within the 70 regions analyzed. Thus, there is a coefficient of variation that far exceeds the 100% threshold, approximately 185% for V1, expressing excessive heterogeneity in the data, a fact also shown by the maximum and minimum values, with the maximum reached in 2022 being 890 times greater than the minimum. Also, the positive skewness coefficient announces the preponderance of small values in this series, while the kurtosis coefficient shows a leptokurtic distribution. In the case of the unemployment rate, an average of 4.55% is observed, with half of the regions presenting a rate lower than 3.75%, while the most common value is 3.20%. The values vary, on average, by 3% from the previously specified mean, with a kurtosis close to 0, indicating a close to normal distribution. In the case of the asymmetry coefficient, the positive value denotes the greater presence of small values. However, there are significant differences between the minimum and maximum values, with a coefficient of variation exceeding 65%, indicating a heterogeneous data series. Regarding the number of physicians in health establishments, an average of 32.81 doctors per 10,000 people is noticed, and in half of the regions the value does not exceed 30.20 doctors. The most common value is 34.90, with values varying, on average, by 17.74 physicians from the mean. The coefficient of variation of 54% indicates that the regions are widely scattered around the mean, assuming a significant variance between them. The infant mortality rate is 5.71 per 1000 live births for the average of both countries, with half of the regions having values exceeding 5.80, the most common value being 7.50‰, while the rates vary from the mean, on average, by 2.18‰.
For the degree of enrollment in kindergartens, an average of 73.22% is noted, and in half of the regions the values exceed 69.83%. A negative kurtosis shows a platykurtic data series, while a value of 0.01, very close to 0, of skewness indicates a symmetrical series. The coefficient of variation of 17.73% shows a homogeneous series, in which the data are not very scattered relative to the mean. However, the minimum percentage is almost twice lower than the maximum, a sign that there are regions where, for various reasons, children were not enrolled in kindergarten in a large number. The next indicator refers to the number of research and development workers per 1000 employees. In this case, it is found that only 5.79‰ of the total number of employed people are active in this field, in half of the regions the value is lower than 3.66‰, while the value encountered with the highest frequency was 2.70‰. The data series is highly heterogeneous, the coefficient of variation exceeding the 100% threshold, with regions where there are no employees in this field at all (the minimum value is 0). Positive values of skewness and kurtosis denote a series in which small values predominate, with a leptokurtic distribution. Regarding the length of the highways, an average of 0.65 km of motorway per 100 square km is observed, while the median and the mode are equal to 0, a sign that half of the regions do not have any km of highway, this being the most common value. From the point of view of the coefficient of variation, this series is the most heterogeneous of the ones analyzed, its value exceeding 200%. The last indicator analyzed refers to the percentage of enterprises with more than 250 employees in the total number of enterprises, and an average of 0.18% is observed at the level of the two countries, with the median having the same value, a sign that half of the regions presented percentages lower than this. The most common value is 0.10%, the values varying from 0.08% to 0.45%, with a coefficient of variation of 41.91% indicating a heterogeneous series.
Table 3 presents the descriptive statistics for the Romanian regions, noting the differences between the results obtained after the analysis of all the regions. For the 42 regions of Romania, it is found that the minimum number of stays in accommodation establishments is 470 times lower than the maximum, significantly lower compared to the previous case; however, although the value of the coefficient of variation also decreases, it does not drop below the 100% threshold, also indicating a very strongly heterogeneous series. Romania’s average for the unemployment rate is lower than in the case of the analysis of the two states, as is the median, a sign that half of the regions have lower values, i.e., 3.40%. Also, the rates vary, on average, from 3.69% to 1.92%. The coefficient of variation is also smaller, but not small enough to consider the data series homogeneous. For the health indicator, physicians in health establishments per 10,000 inhabitants, their average number is lower in Romania’s regions; in 50% of the regions there are less than 21.13 doctors per 10,000 inhabitants. In this case, the data are much more widely scattered around the mean. The average infant mortality rate is higher in the case of Romania, the data series being a homogeneous one. In the series, low values predominate, and between the maximum and minimum value there is a difference of 7.50.
The enrollment rate of children in kindergarten is 63.84%, and half of the regions present values lower than 63.33%. The negative value of skewness illustrates a series in which large values are predominant, but as both coefficients of asymmetry and vaulting are close to 0, it can be stated that the series is symmetrical and with a normal distribution, a fact also supported by the coefficient of variation, which presents a homogeneous series. For R&D employees, the average of the two countries is higher than the average of Romania, the series being strongly heterogeneous, in which low values are predominant, with the values of this series varying between 0 and 16.33‰. Regarding highways, Romania’s average is higher compared to the average of the two countries, although the difference is very small, and in this case, half of the regions do not have any highway km. The coefficient of variation is close to 250%, an enormous value, presenting a heterogeneous series, in which small values are predominant (skewness = 4.70), and the kurtosis value indicates a leptokurtic distribution. The percentage of companies with more than 250 employees in Romania is 0.20%, 50% of which have a value greater than 0.19%, while the most frequently occurring value is 0.18%. The variation coefficient of 38.53% denotes a slightly heterogeneous series, for which small values are predominant (positive skewness).
Table 4 presents information on the situation of Bulgaria’s regions for the year 2022. The average number of nights spent in accommodation establishments in the 28 regions of Bulgaria is approximately 853,118, noting that in half of the regions, the number of nights is at least 4.7 times lower compared to the average (180,840). The coefficient of variation that exceeds 200% shows a highly homogeneous series, while the positive coefficient of variation denotes the greater presence of small values in the series. The average unemployment rate is over 2% higher than in the case of Romania; in half of Bulgaria’s regions, the values exceed 5.30%, the most frequently encountered value being 0.90%. The values present in the regions vary, on average, from 5.85% to 3.80%, with the negative vaulting coefficient indicating a platykurtic series, while the close to 0 and positive value of the asymmetry coefficient presents an approximately symmetrical series, but one with slightly more small values. The average number of physicians in health establishments is 38.22 per 10,000 inhabitants, higher by 9 compared to Romania. The median and mode have the same value of 34.90, denoting that this is the most common value and that half of the regions have values greater than or equal to this. Also, the coefficient of variation of 26.94% indicates the presence of a homogeneous series, while the positive value of the coefficient of asymmetry illustrates the preponderance of small values of the series. The infant mortality rate per 1000 live births is 5.41, slightly lower than in the case of Romania, although the median has the same value, a sign that half of the regions have values greater than 5.80‰. The values recorded by the regions deviate, on average, from the value of 5.41‰ by 2.97‰. The skewness coefficient close to 0 indicates an approximately symmetric series, while the kurtosis coefficient indicates a platykurtic distribution, and the coefficient of variation of 54.85% shows a heterogeneous series.
The percentage of children enrolled in kindergarten is 87.28%, the values deviating, on average, by 4% from this value, while in half of the counties the values exceed 87.25%. The coefficient of variation shows a homogeneous series, while the negative value of the coefficient of asymmetry illustrates the need of parents to send their children to kindergarten. Regarding the proportion of employees in research and development, an average value of 9.19‰ is observed, the lowest value being 0.5‰, while the maximum threshold reaches 26.90‰. The coefficient of variation of 72.08% shows a heterogeneous series, where the data appear to be quite scattered relative to the mean. However, the kurtosis coefficient close to 0 indicates an approximately normal distribution, while the positive skewness coefficient denotes the preponderance of small values. The average length of motorways is slightly lower than in the case of Romania, with half of the regions not exceeding 0.32 km of motorway per 100 square km. The most common value is 0, with rates varying, on average, by 0.71 km from the value of 0.63. The coefficient of variation above 100% shows an extremely heterogeneous series, while the coefficients of asymmetry and vaulting show a platykurtic distribution in which small values are predominant. For the last indicator analyzed, the relative share of enterprises with more than 250 employees in the total number of enterprises in the district, a lower average value is presented than in the case of Romania, 0.15%, with a median and mode of 0.10%, showing that half of the regions have values less than or equal to the most common value of the series. The minimum value is 0.10%, while the maximum reaches 0.30%, with the coefficient of variation being 42.55%, indicating the presence of heterogeneity in the data.

3. Results

The research results are presented starting with the detailing of the results of each region through maps, the last step consisting of the identification of similarities and differences that can be identified through a cluster analysis.

3.1. Maps Representation

In what follows, a more detailed situation of the values recorded by the regions for the analyzed indicators will be presented. Visual representation of the maps was made through the QGIS software (3.38.0 Grenoble), which helped to geographically identify the regional performances for the investigated year.
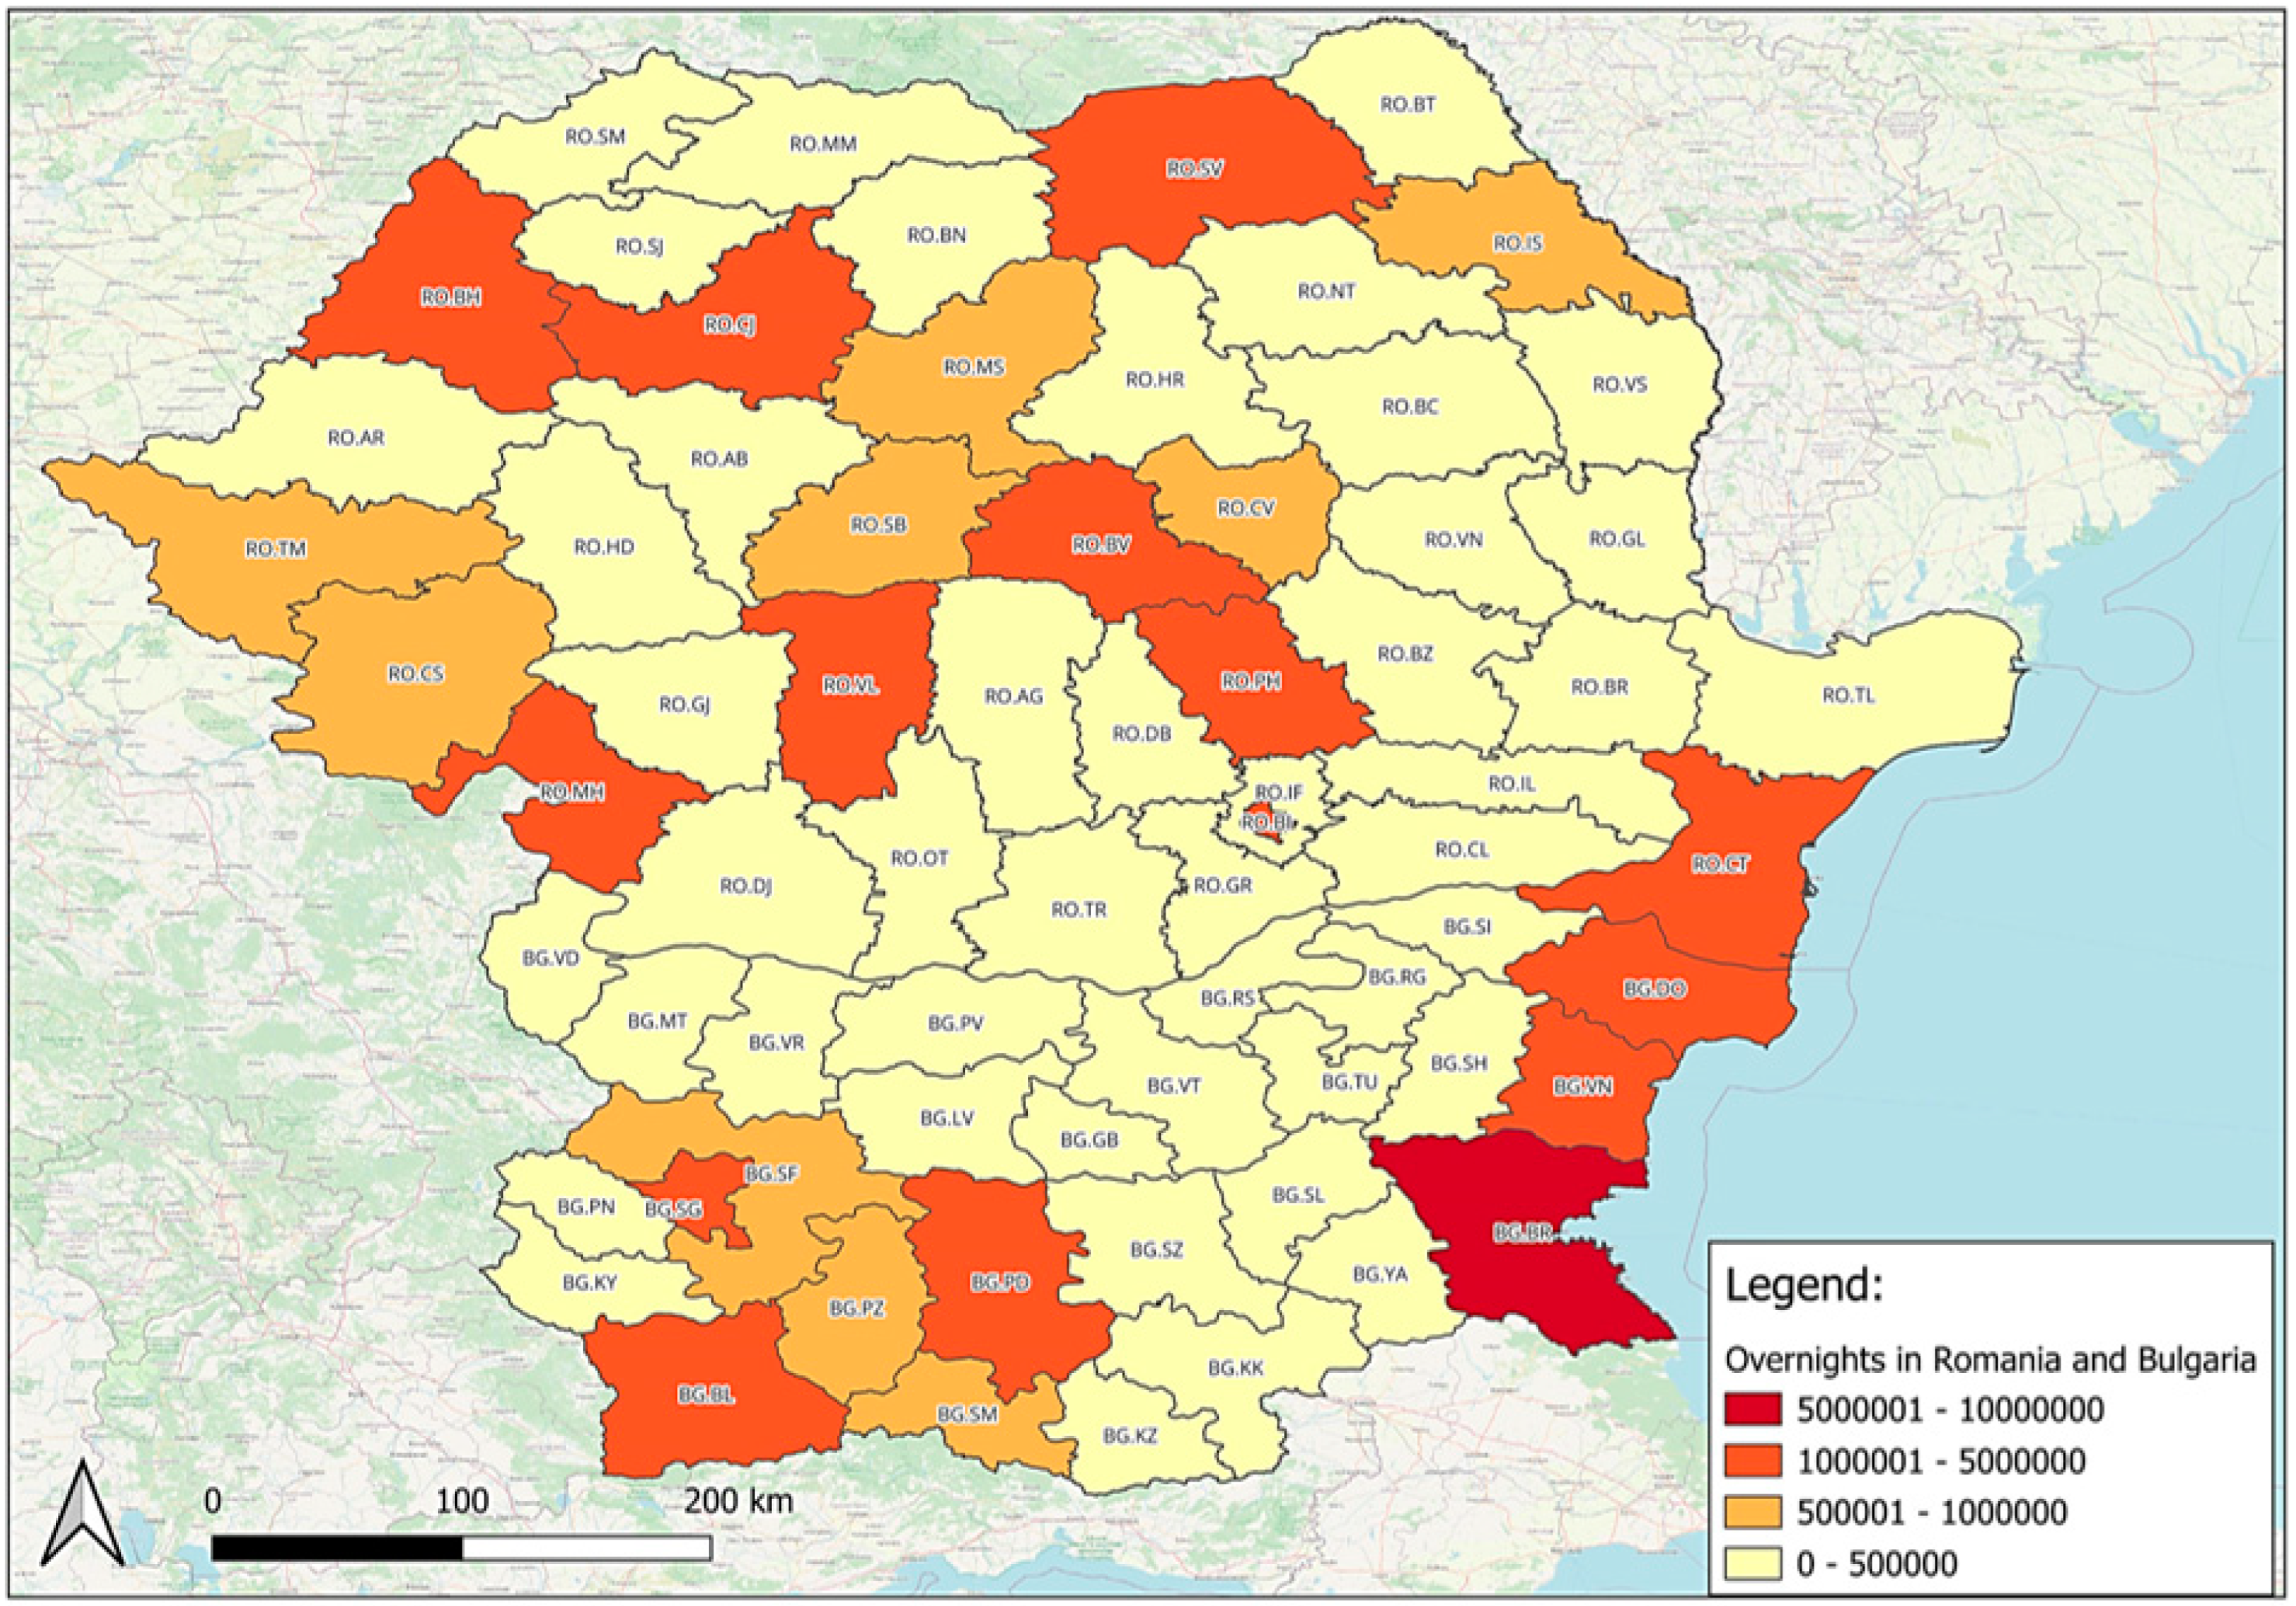
According to the map in Figure 3, the regions in Romania where the most accommodation nights were spent are Constanța and Bucharest, followed by Brașov, Vâlcea, Bihor, Cluj, Prahova, and Suceava (see Appendix A Table A1). This fact is to be expected considering that these regions are known to attract the most tourists because Constanța is located near the Black Sea, while Brașov and Prahova are known for their mountain resorts. In the case of Bulgaria, the most overnights spent in accommodation establishments were registered in Burgas, leading the ranking of the regions in both countries. Other regions with significant values are Varna, Plovdiv, Blagoevgrad, the capital, and Dobrich, and in this case, the values can be explained by the tourists’ interest in the seaside resorts, or visiting the capital. Also, Plovdiv is among the most developed cities, except Sofia.
For the unemployment rate, the lowest values were found in the regions of Bucharest and Ilfov, followed by regions in the west of the country and Constanța, while increased values were observed in Vaslui, Teleorman, and Dolj. Low values were found in the most developed cities, as well as in those with significant tourist potential. While the regions of Bulgaria, Varna, Stara Zagora, Hskovo, Kardzhali, and Sofia register the lowest rates, at the opposite pole are Shumen, Pernik, and Silistra (Figure 4).
The highest numbers of physicians per 10,000 inhabitants were awarded to Bucharest and Timiș, followed by Iași and Cluj (Figure 5). It can be noticed that in many Romanian regions, there were very low values for this indicator, the acute lack of doctors [30], especially those in rural areas, being best observed in this context. As for Bulgaria, the maximum value reached only 72.40 physicians in health establishments per 10,000 inhabitants in Pleven, followed by Plovdiv, Varna, and the capital. Although even in this case the recorded values are small, the region with the lowest value exceeds more than half of Romania’s regions.
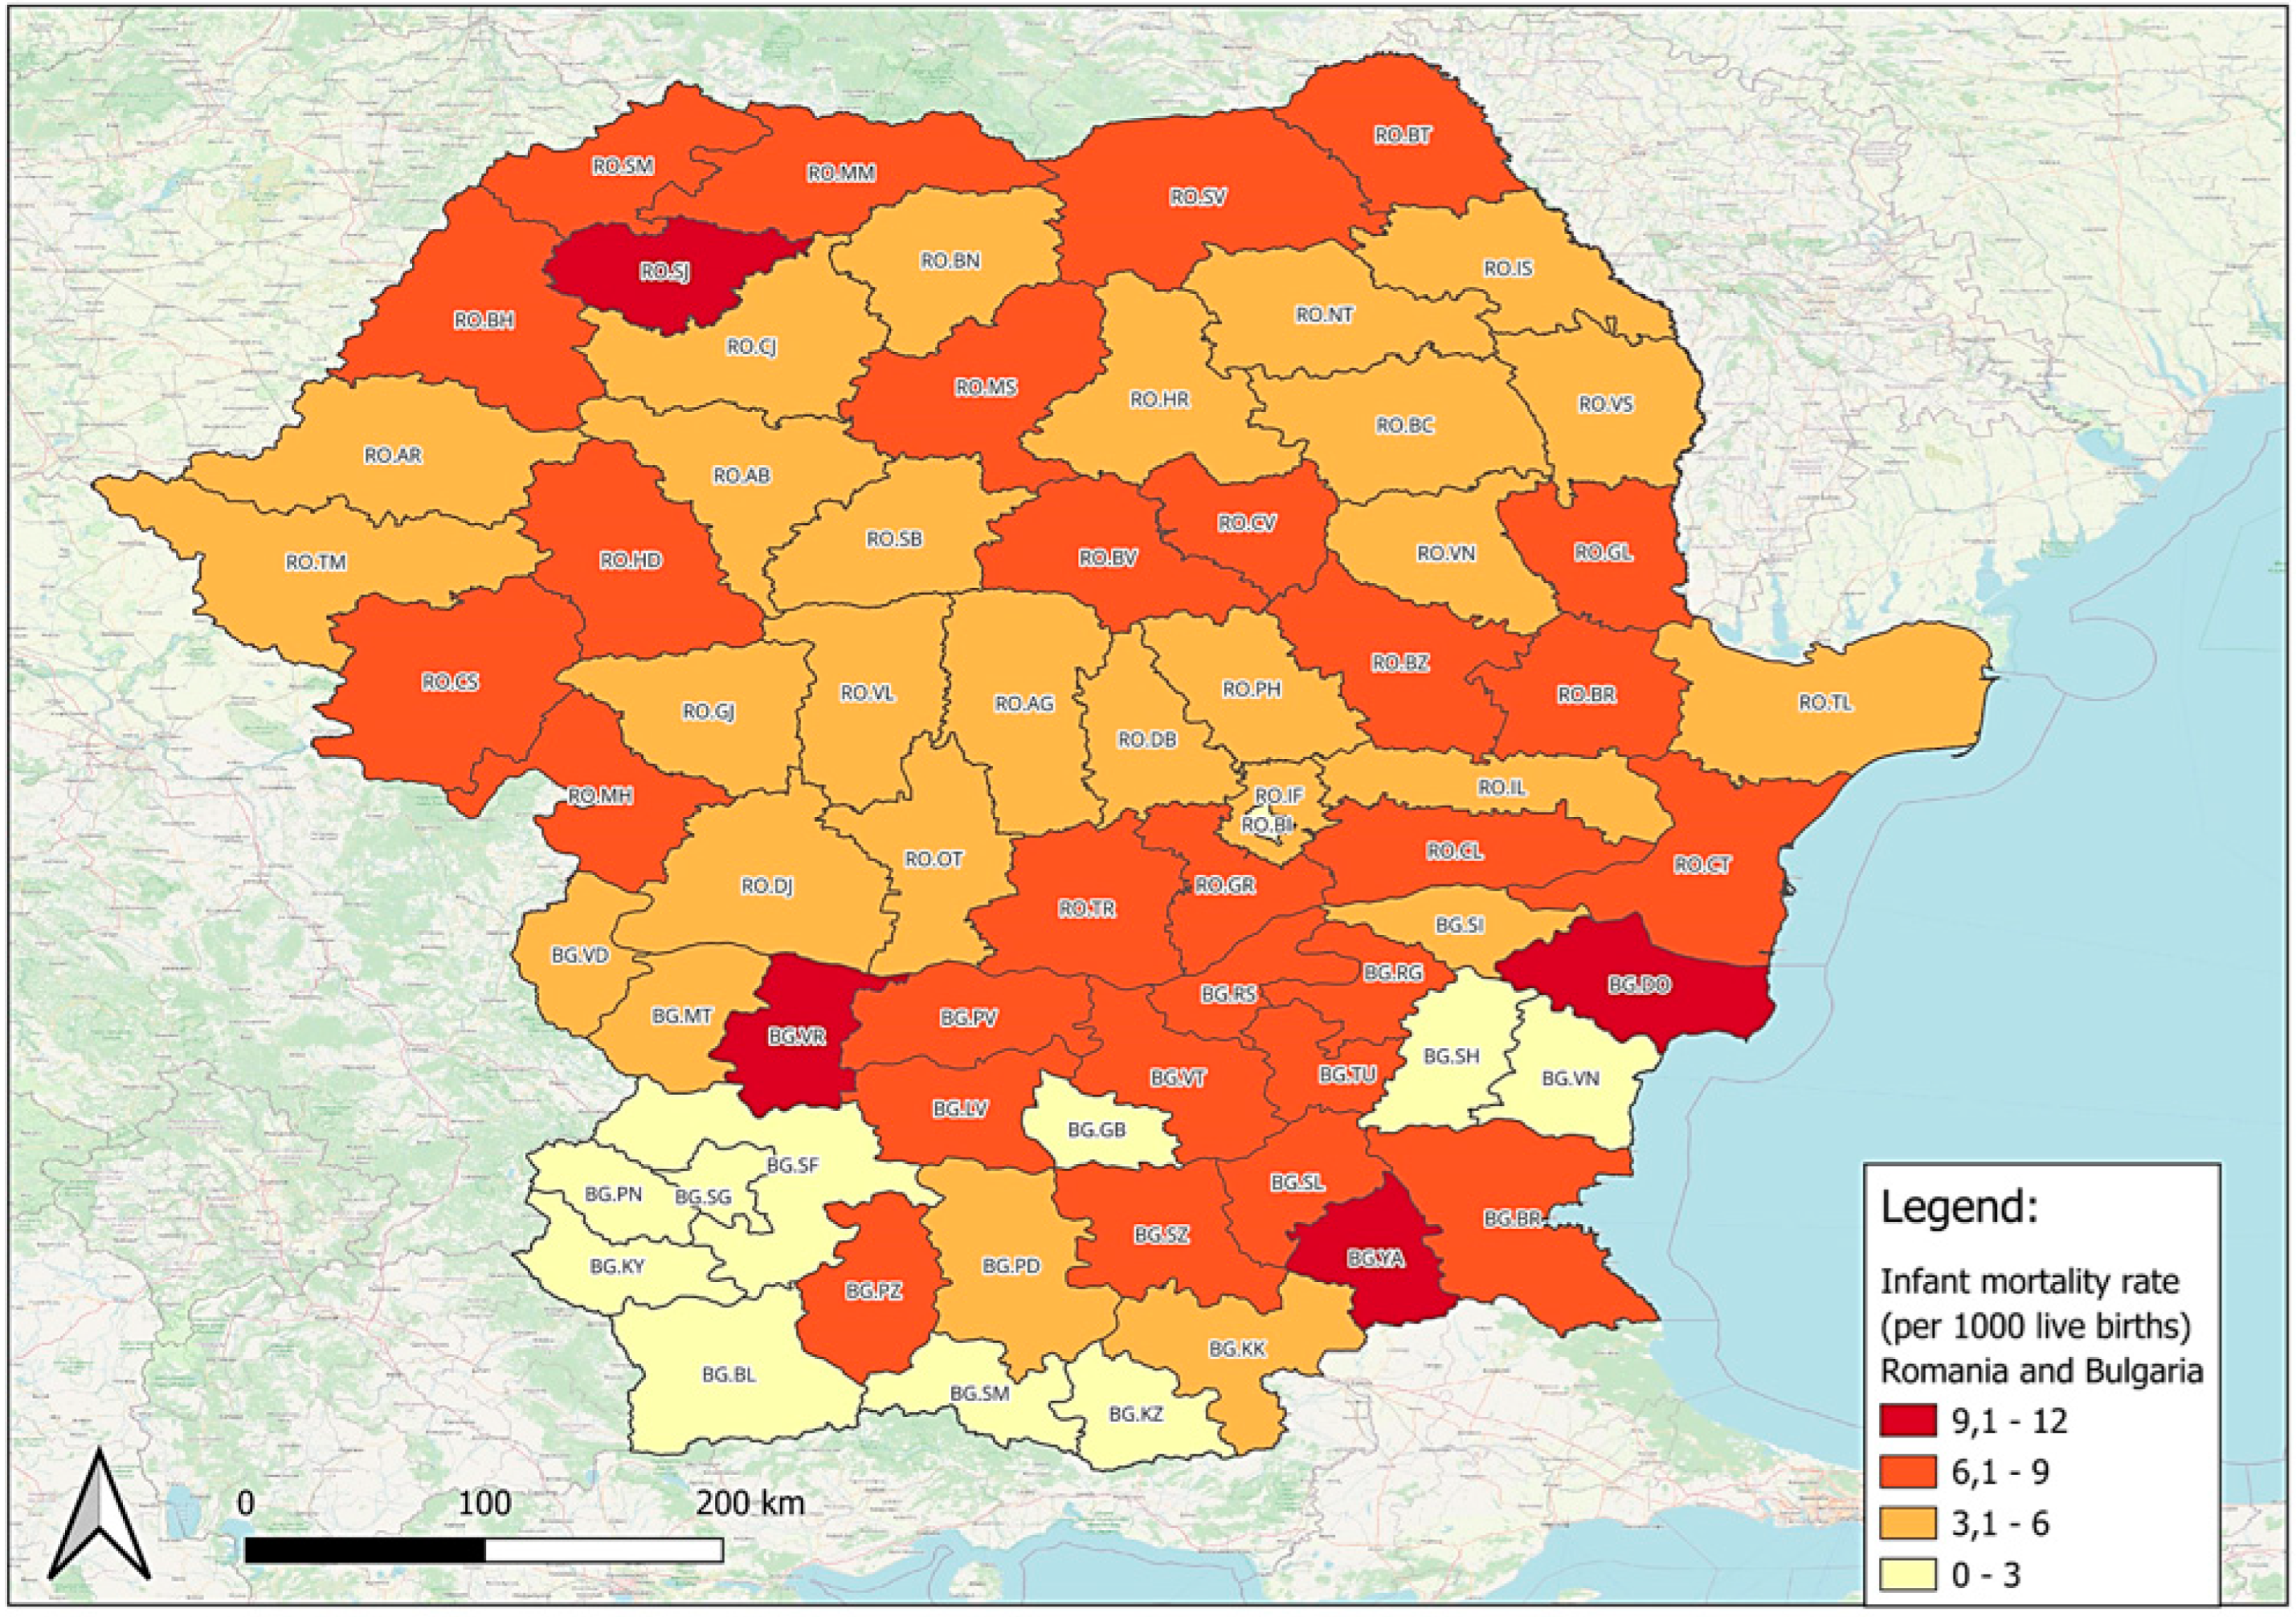
In the case of the indicator illustrated in Figure 6, it was found that the recorded values were relatively low for most regions, with the exception of Sălaj, Dobrich, Vratsa, and Yambol. Although one could blame the small number of doctors in these regions, compared to Figure 4, it can be seen that there are regions where their number was much lower, but this rate was not higher. An explanation could be attributed to outdated equipment and the lack of gynecology and neonatology departments in certain regions of the country [30].
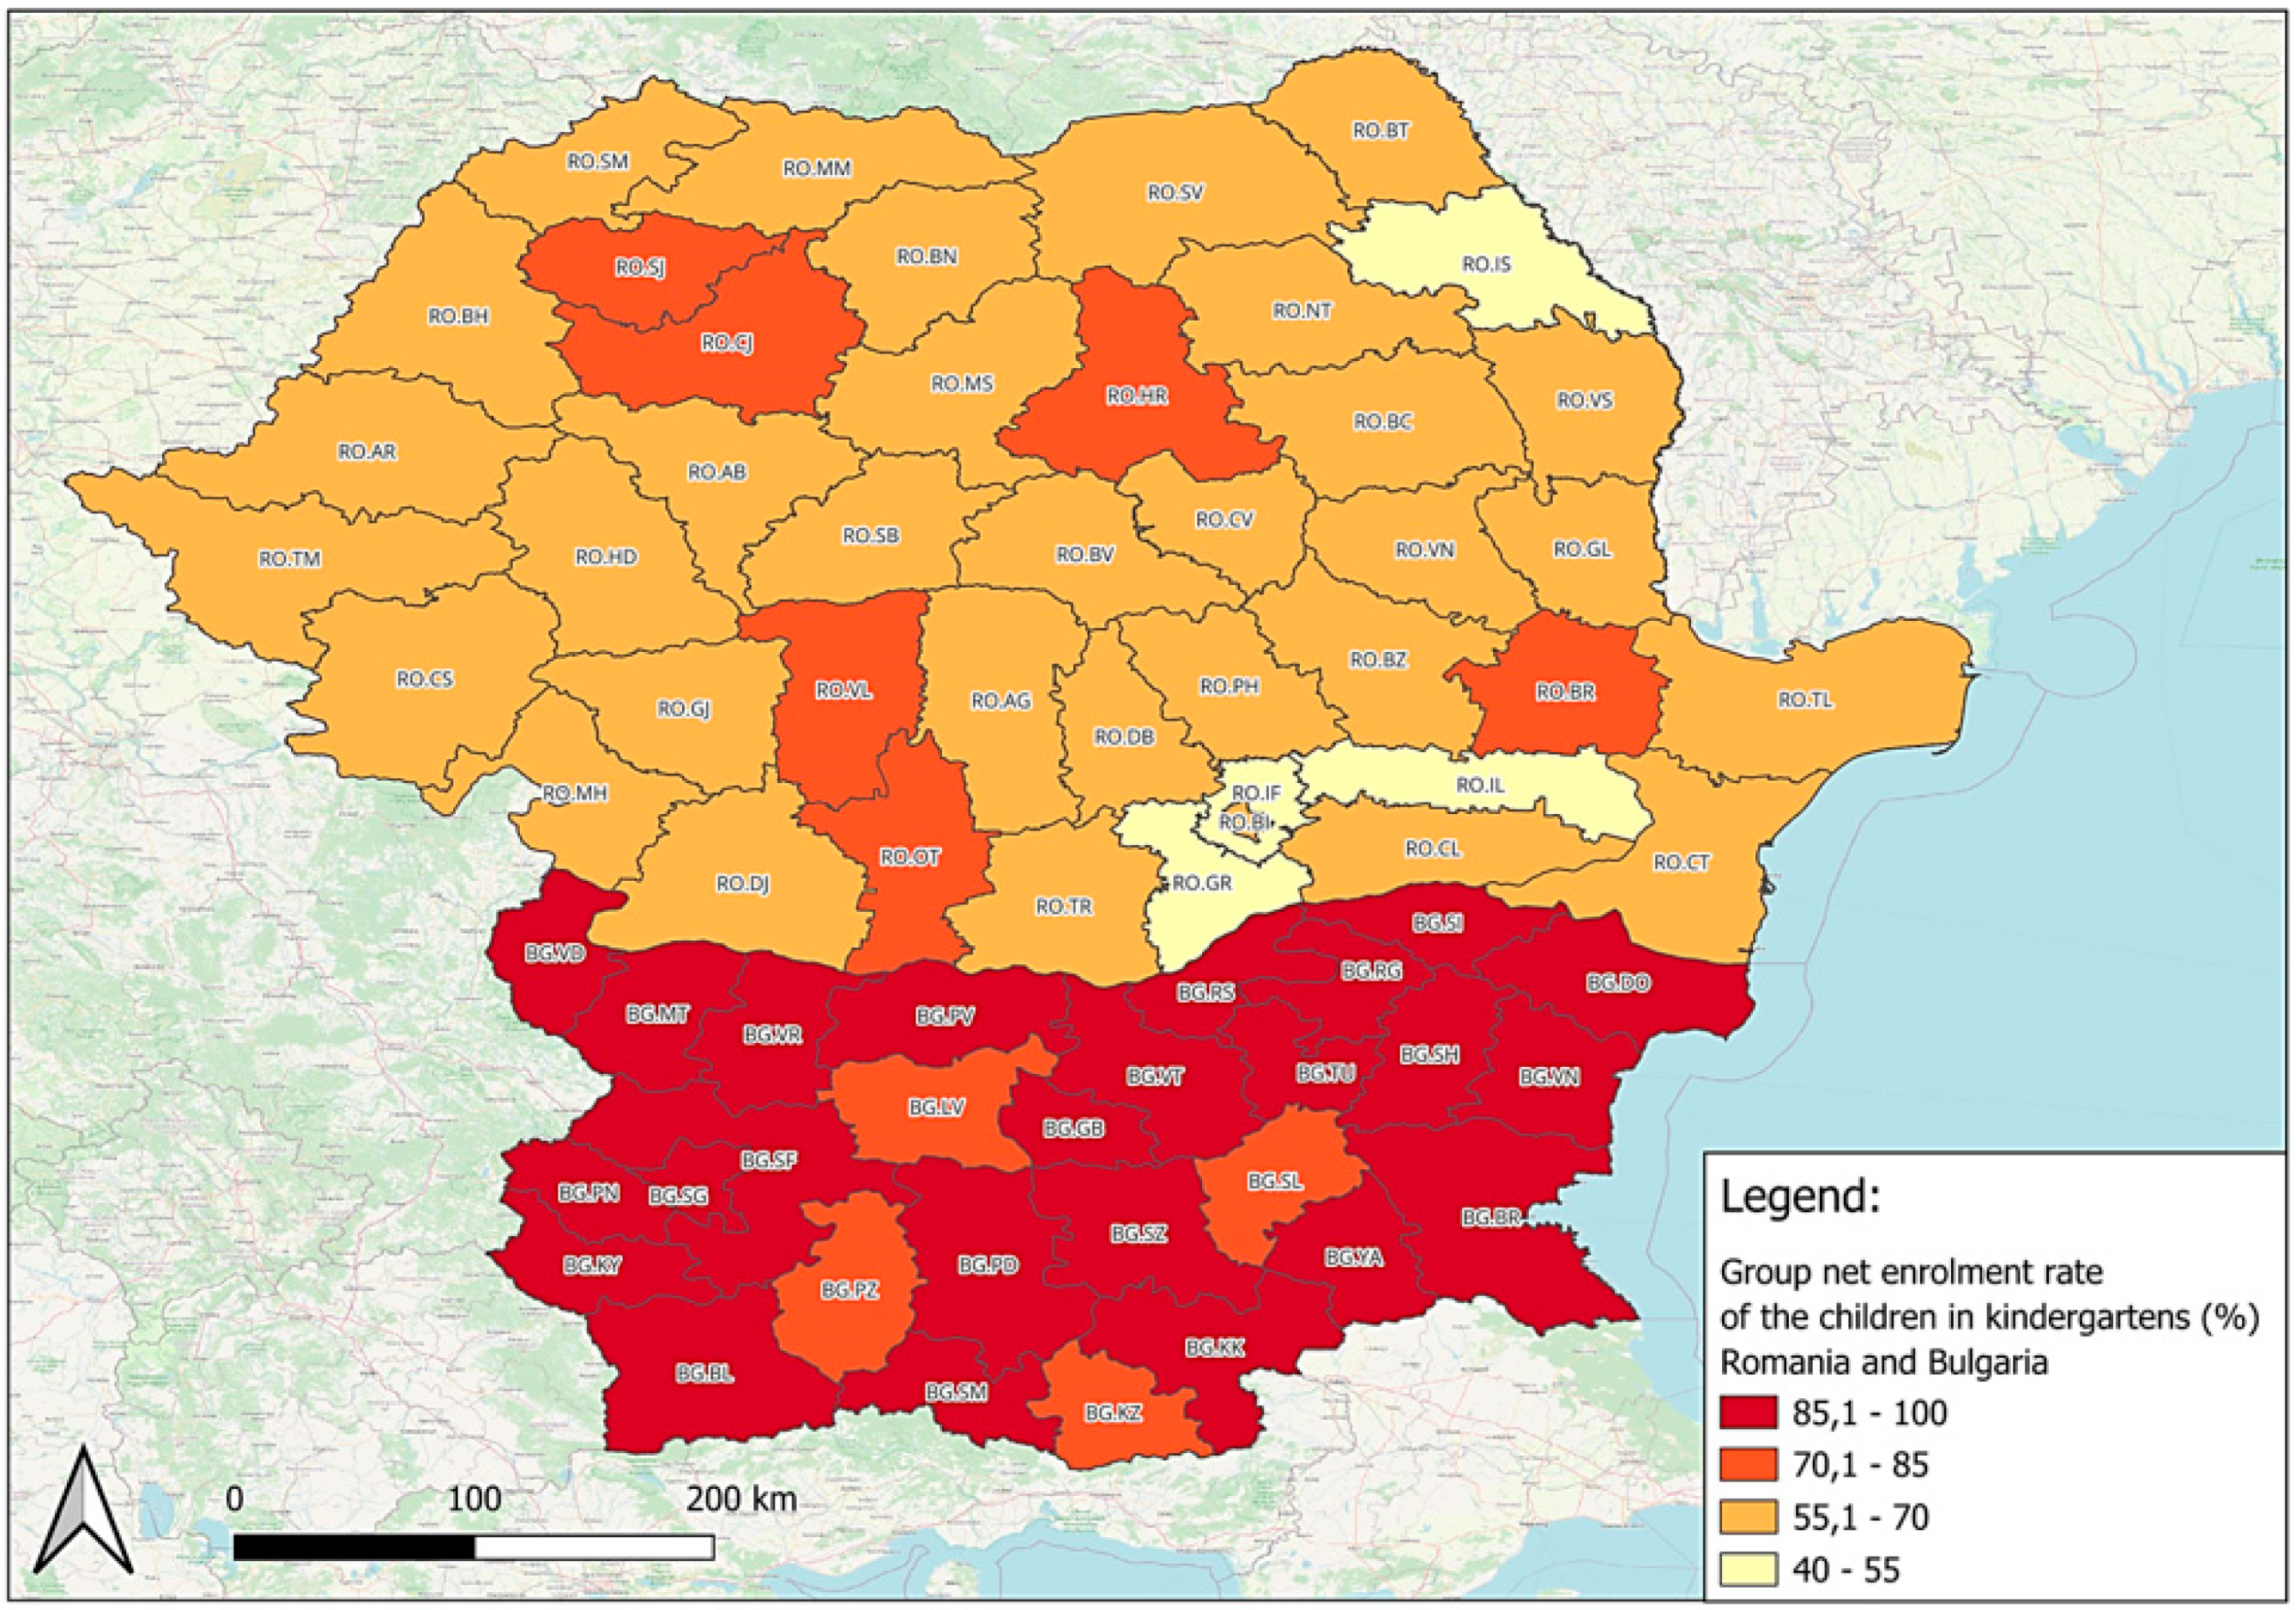
Figure 7 shows the situation of the kindergarten enrollment rate, noting the much higher percentages of the regions in Bulgaria compared to those in Romania; this can be explained by the Bulgarian policy to cover the costs of nurseries and kindergartens, without the burden falling any further on the parents [31].
Regarding the personnel employed in the field of research and development, according to Figure 8, it can be seen that the highest percentages were found in regions in the territory of Bulgaria, while most regions in Romania had low values.
For the number of km related to the surface of the regions, it can be distinguished from Figure 9 that Bucharest has the highest value. In the case of Romania, there is a route from the east of the country (Constanța) to the west (Timiș). The regions with the highest values, with the exception of Bucharest-Ilfov, are found in the west of the country, connecting with western countries. Moreover, Călărași has a significant number of kilometers, being the county that connects with the access to Constanța (so to the Black Sea). Regarding Bulgaria, it can be observed that the regions in the north have fewer km of highway compared to those in the south.
The regions with the highest percentages of large companies were Bucharest, Prahova, Sibiu, Alba, Arad, and Timiș, while values did not appear in Caraș-Severin, Giurgiu, or Bistrița-Năsăud. These low values can be explained by the presence of counties in the vicinity of regions with high values. In the case of Bulgaria, the regions with the highest percentage of enterprises with more than 250 employees were Gabrovo and Shumen, noting that the Bulgarian counties had lower percentages compared to Romania (Figure 10).

3.2. Cluster Analysis

Cluster analysis starts with the standardization of the data because they are represented in various units of measure as well as orders of magnitude. In this regard, Table 5 shows the format in which the data appear after standardization.
The next step is to calculate the Euclidean distances, followed by grouping the objects into classes according to the chosen method.
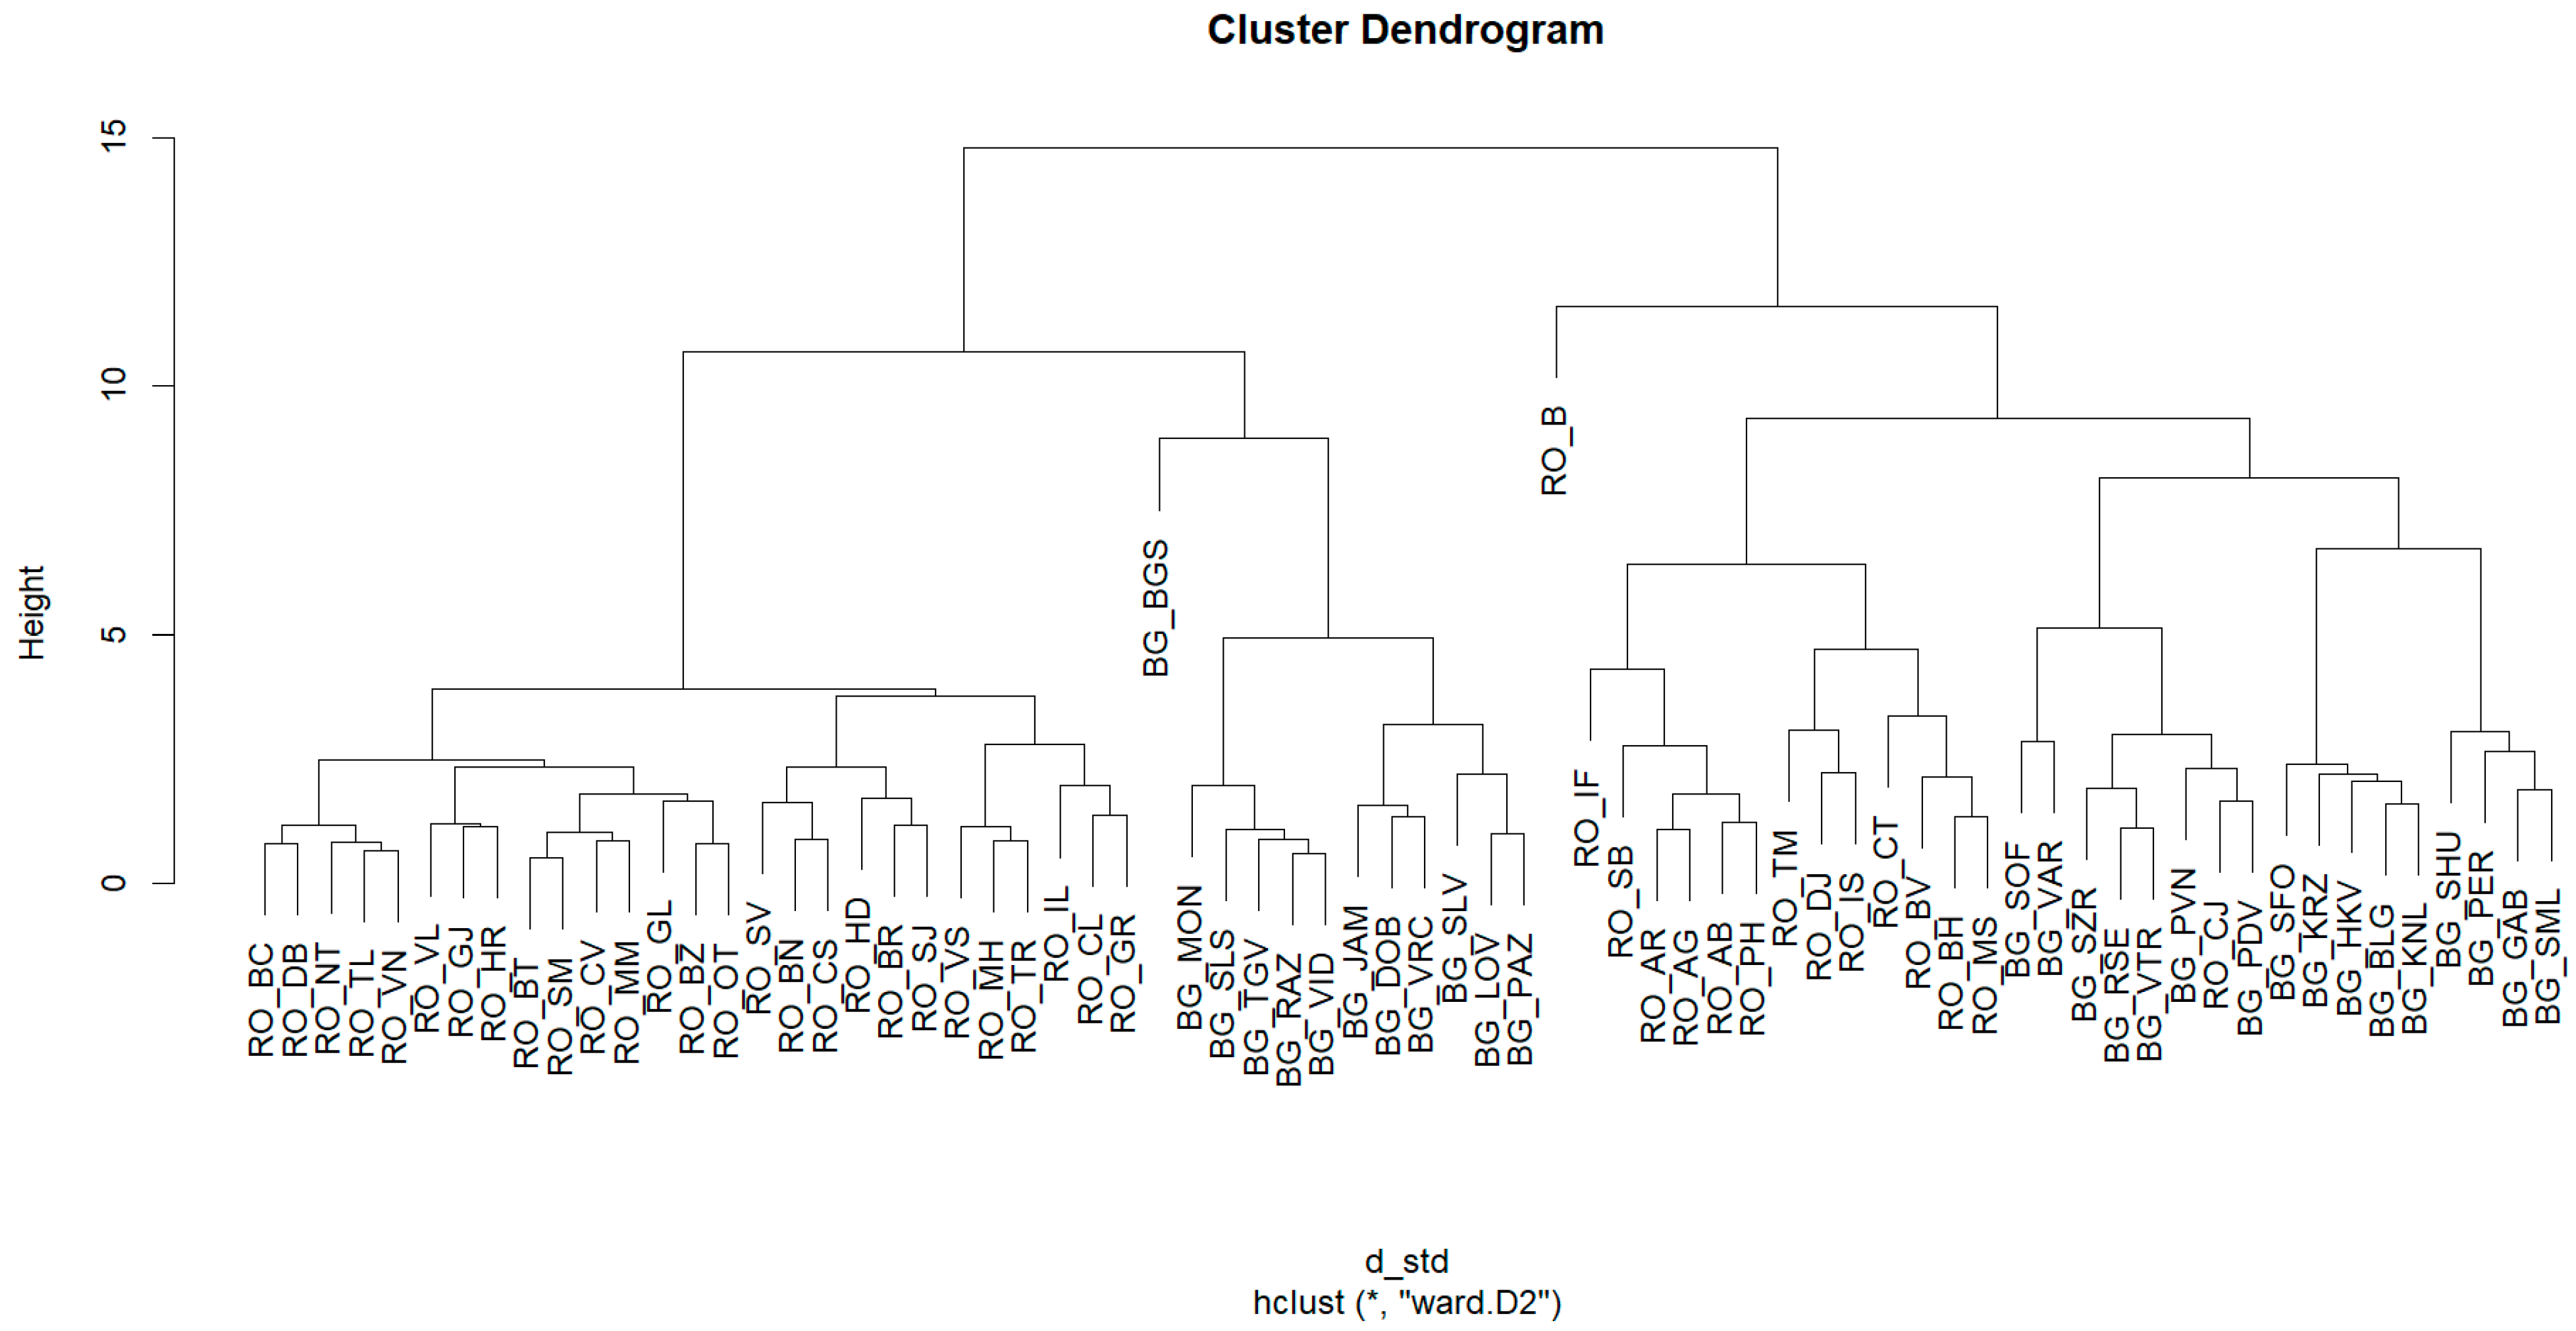
Figure 11 shows the dendrogram related to the classification of regions using Ward’s linkage method. After the Euclidean distances between the objects were calculated, based on the standardized data of the indicators presented in Table 5, the counties were joined so that the variability within the classes was minimal. Thus, it can be noted that the two large classes that can be visualized have joined at a height value of approximately 15. To determine the optimal number of classes, the NbClust package [32] was used, which contains a set of 30 indices, each index indicating a number of groups; at the end, a number of classes is recommended according to the maximum number of indices that indicated a certain number of clusters.
Figure 12 displays the numbers of indices that chose between two and five classes (these numbers appear because the researchers set a limitation of a minimum number of two classes and a maximum number of five classes). According to the results obtained, most indicators chose four clusters.
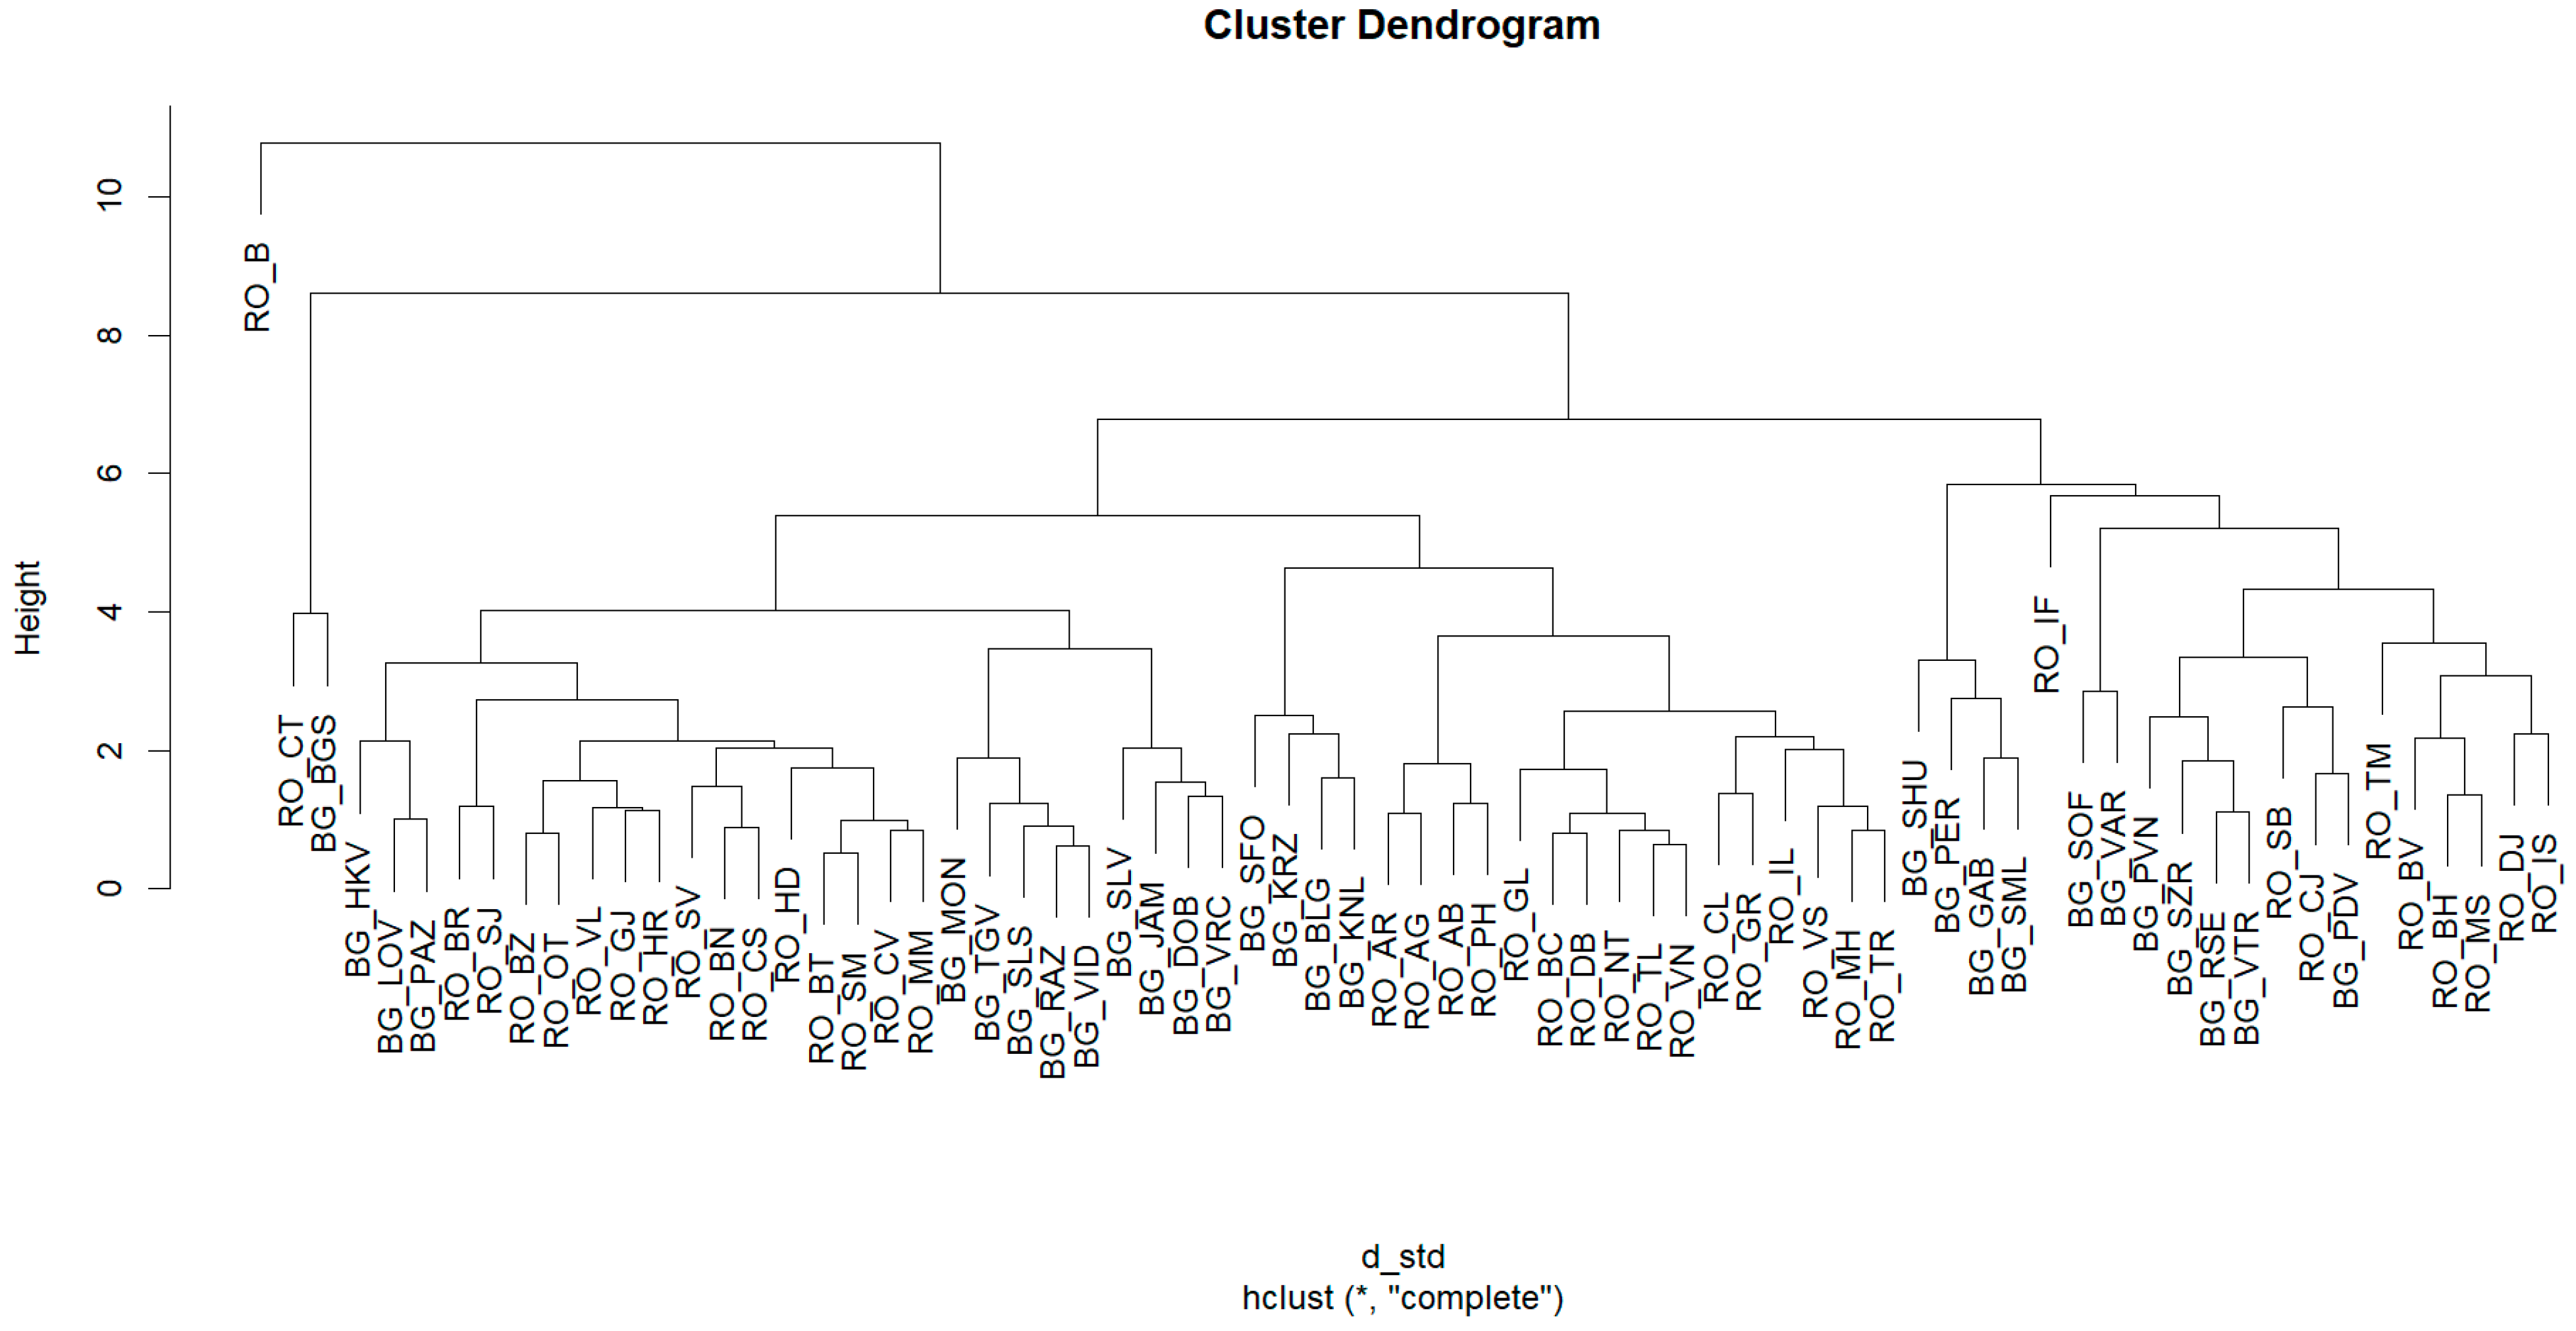
Figure 13 shows the dendrogram related to the clustering using the complete linkage method. Through this method, the difference between Bucharest and all other counties can be clearly noted, with it joining the other classes at a height of 10.78.
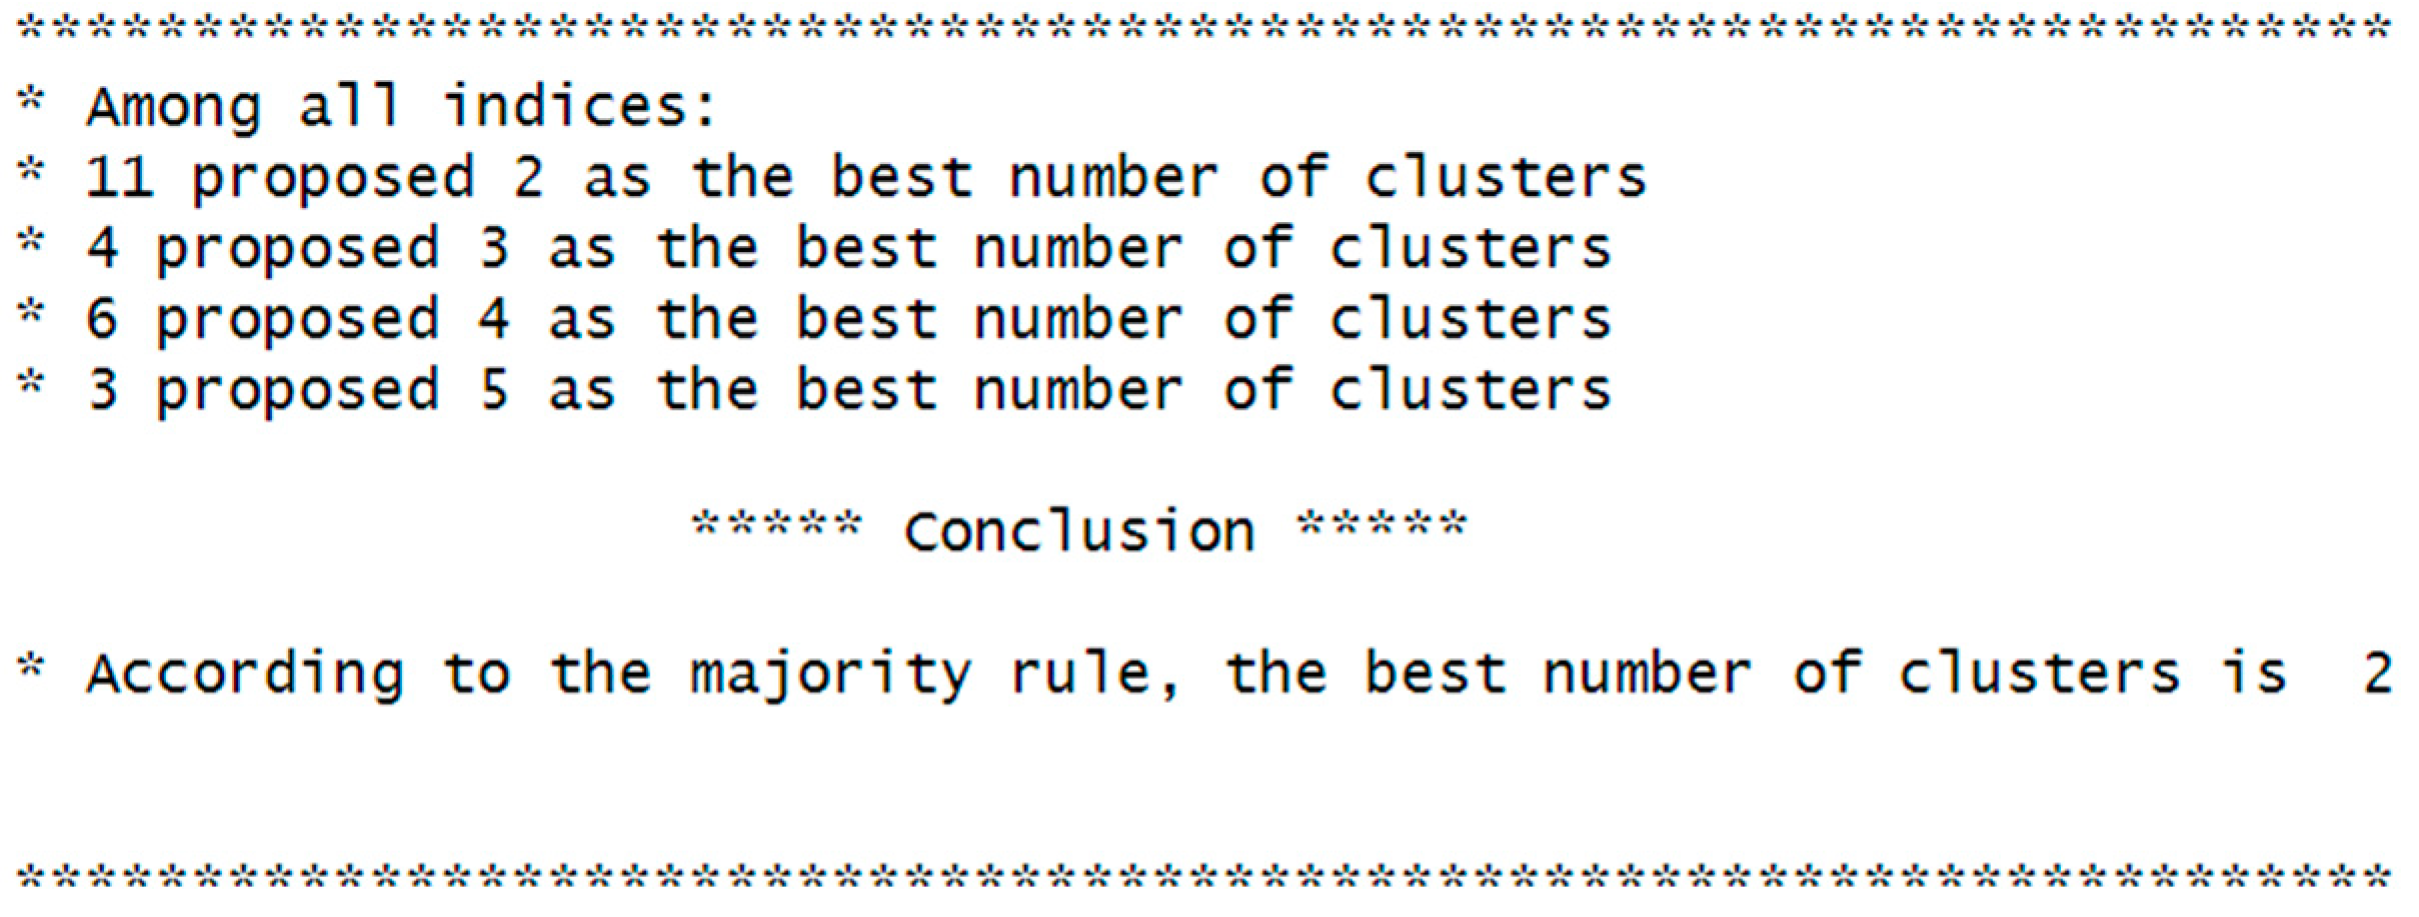
By applying the NbClust package, the optimal number of classes chosen by the largest number of indicators is two, and the next chosen grouping of six indicators is four classes (Figure 14).
On the basis of the results provided by applying both methods, it can be stated that the optimal number of classes is four.
The division by classes, identified through various colors, made by the Ward method (Figure 15) indicates that Bucharest represents a cluster by itself, a fact that can be understood because it is the region with the best performance regarding RCI 2.0 in the two countries. However, in the case of this method, the Bucharest region appears to have characteristics similar to the red-colored regions, compared to the other two classes, a sign that the regions illustrated in red can have similar results to those of Bucharest, indicating that from the perspective of the analyzed indoctrinators, their performances can be considered better compared to the other regions belonging to the other two clusters.
Figure 16 can help to geographically visualize the presentation of classes using Ward’s linkage method. In this case, Bucharest is illustrated in orange, having the highest values for the number of km of highway and the percentage of companies with over 250 employees. It also ranked among the lowest unemployment rates and infant mortality rates, among the most nights of accommodation, and a significant number of researchers and developers. Furthermore, it obtained the best value for physicians in health establishments per 10,000 inhabitants and an average value for the percentage of children enrolled in kindergarten. The class illustrated in yellow recorded low performances for the percentage of companies with over 250 employees and km of highway, for the second variable, the exception being Ialomita and Călărași. Moreover, these counties obtained low values for research and development staff and physicians in health establishments, as well as for the number of nights spent in accommodation units (except Suceava and Vâlcea). Additionally, average values for the unemployment rate and infant mortality rate and low to medium values for the group net enrollment rate of children in kindergartens were identified, for which there are high values for Harghita and Sălaj. The light orange grouping is characterized by low values for the number of km of highway, as well as for the relative share of enterprises with more than 250 employees in the total number of enterprises in the district, but also the tourism indicator. Medium to high values were identified for the unemployment rate, high percentages for children enrolled in kindergarten (except Sliven), as well as medium to high rates of infant mortality (less in Burgas, Pazardzhik, and Lovech). For the number of physicians in health establishments per 10,000 inhabitants and staff engaged in research and development, the recorded values ranged from low to medium. The class that included regions from both counties (red) presented a small to average number of highway kilometers, except Ilfov, which had the highest values. High percentages of enterprises with more than 250 employees were also observed. For the infant mortality rate and the number of nights of accommodation, the values were low to medium, with the exception of Brașov, Varna, Constanța, and Grad Sofiya, where the values recorded for the tourism indicator were among the highest. The number of physicians varied from medium to high values, the same being highlighted for the percentage of children enrolled in kindergarten (for this indicator, low values were observed for Constanța, Iasi, Sălaj, Timișoara, and Brașov).
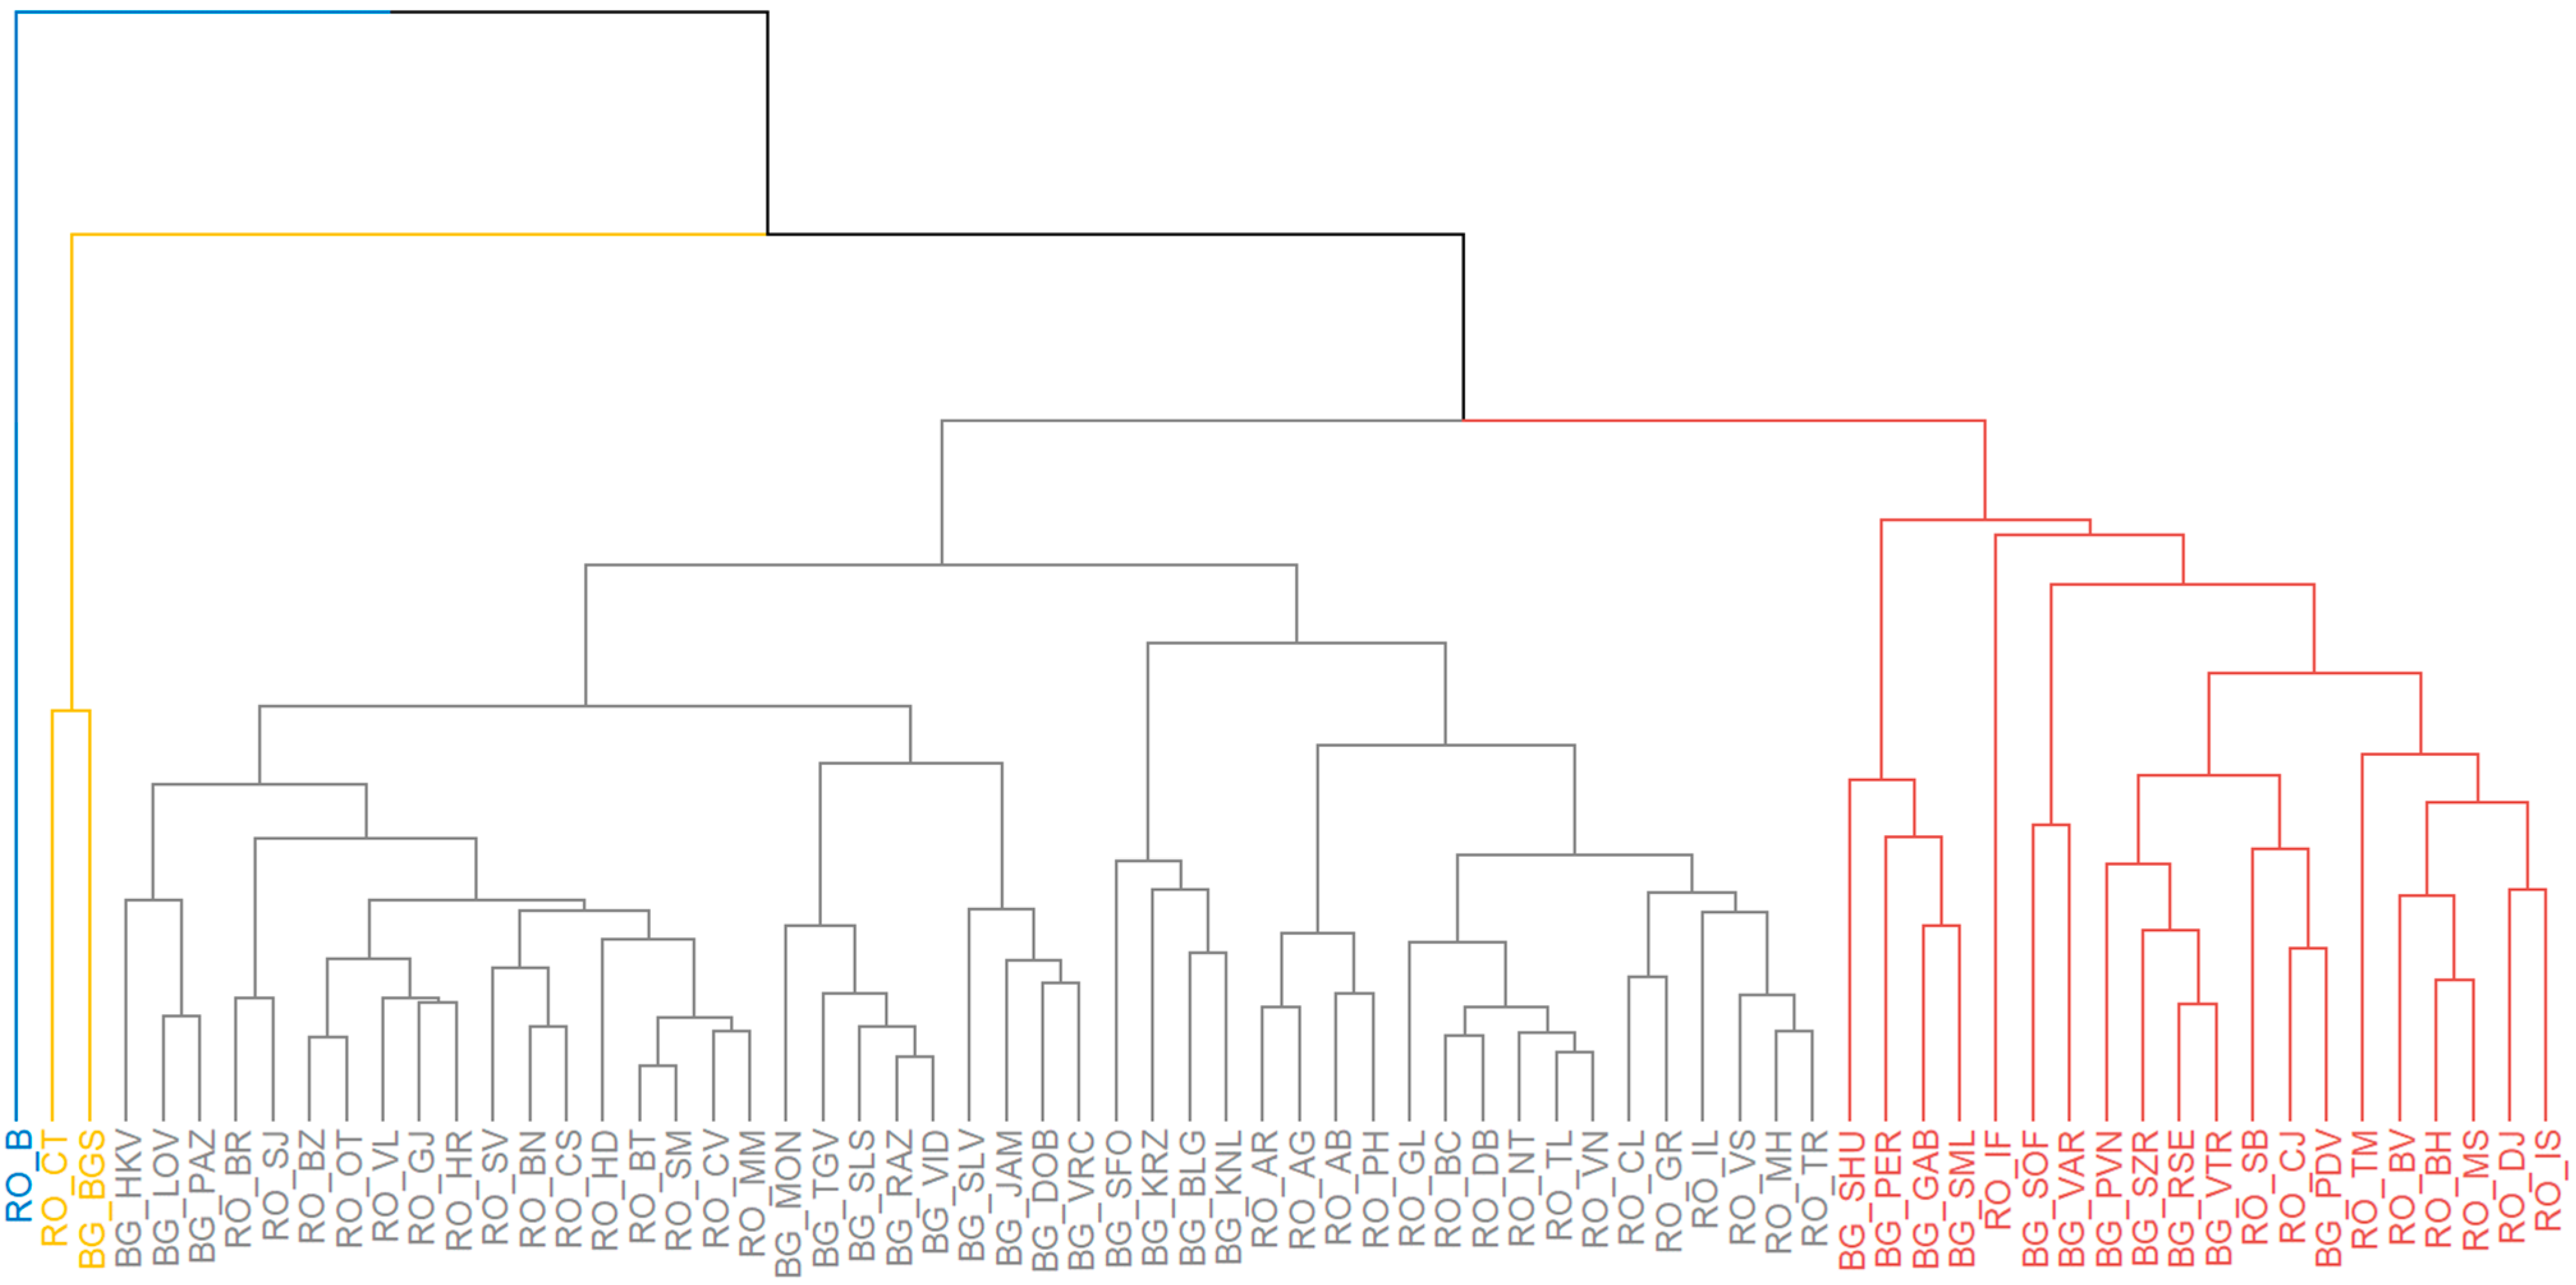
According to the two-class grouping, by applying the complete linkage method, it is found that Bucharest would form a class by itself, with all the other regions belonging to a distinct class, highlighting once again the performances of Bucharest as a whole, significantly different from those of the regions that make up both countries.
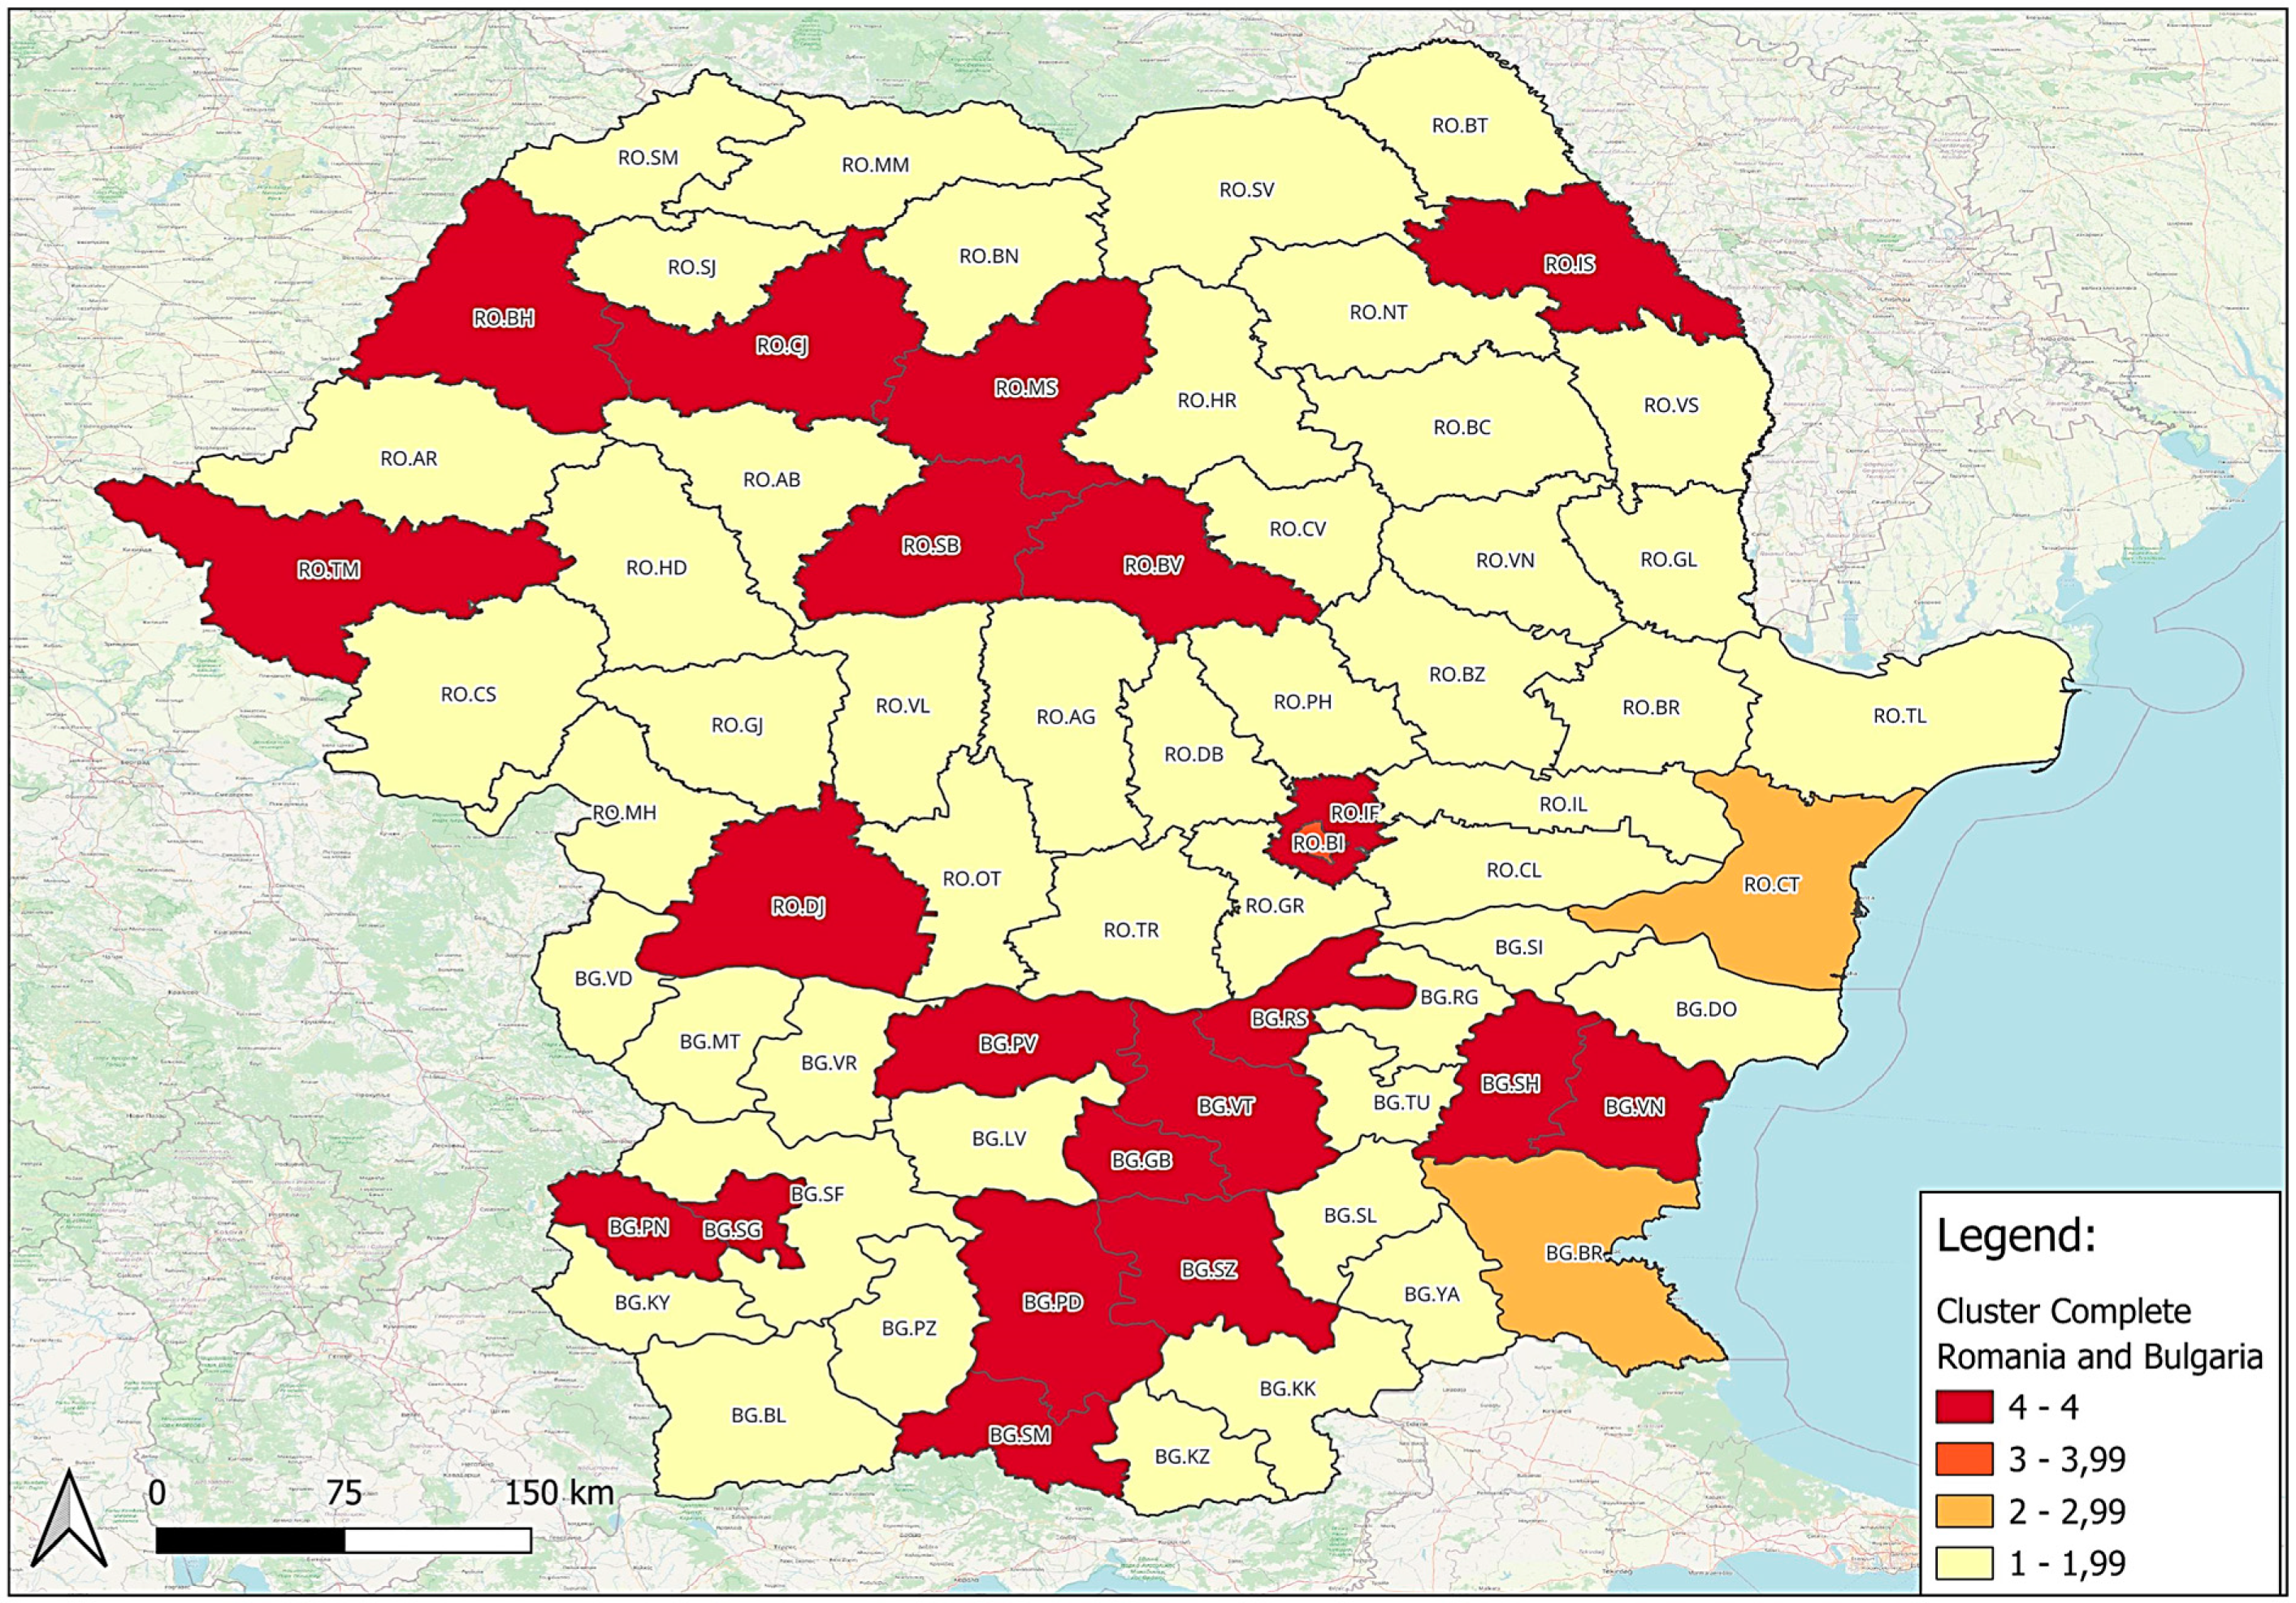
In the case of Figure 17, four classes are discussed, with Bucharest still being a unitary cluster, and Constanța and Burgas being grouped in a distinct cluster. Another class is made up of the regions of Bihor, Brasov, Cluj, Dolj, Iasi, Ilfov, Mures, Sibiu, and Timis, belonging to Romania, and Gabrovo, Pernik, Pleven, Plovdiv, Ruse, Smolyan, Grad Sofiya, Stara Zagora, Varna, Veliko Tarnovo, and Shumen, belonging to Bulgaria. All other regions not listed constituted another class.
Through the grouping made by the complete linkage method (Figure 18), it is noted that there is no longer any geographic delimitation, just as could be highlighted in the previous case. For this situation, Constanța and Burgas form a class characterized by low to medium rates for unemployment, physicians in health establishments and staff engaged in research and development, as well as for highway kilometers. Infant mortality rates were also observed to show medium to high values for the year analyzed, as well as a small number of companies with over 250 employees, but those counties had the highest values for overnight stays. Regarding the percentage of children enrolled in kindergarten, Burgas was observed to have a high value, specific to Bulgarian enrollment values, while the rate in Constanța was lower. The red class shows average rates of infant mortality, with average to high values of physicians in health establishments, the exception for this indicator being Smolyan, Pernik, Ilfov, Shumen, and Veliko Tarnavo. In the case of the unemployment rate, with the exception of Smolyan, Gabrovo, Pernik, Shumen, and Dolj, where the rates were high, the other counties that make up the class show low to medium values. Also, the number of kilometers of highways is high in Ilfov, but the other regions record low to medium values. For the nights spent in accommodation units, except the capital of Bulgaria, Brașov and Varna, the recorded values were low to medium, while in most regions medium to high values were observed for the percentage of enterprises with over 250 employees. For the counties that make up the yellow class, small to medium values are distinguished for physicians in health establishments per 10,000 inhabitants, as well as for staff engaged in research and development per 1000 employees. In the case of accommodation nights and highway kilometers, the recorded values were low to medium, except for Prahova for the second variable.
Depending on the clustering algorithms applied, but also on the methods of linking the objects, it is normal for the results to differ, this fact being also noted in other studies [28,33]. Although two different methods of linking NUTS-3 regions in clusters were used, it can be noted, according to Table 6, that most regions were placed in the same class, regardless of the chosen method. Thus, 49 regions out of the 70 analyzed keep their classes, both when applying the complete method and Ward’s method, a sign that whichever method is chosen the results are not much different.
In order to deepen the issue of the differences between the results of the county linking methods, the averages and standard deviations of the classes for the two methods were calculated, as can be seen in Table 7 and Table 8.
In the case of Ward’s linking method, it is noted, according to Table 7, that, following this grouping of counties, cluster 3 has the highest average of nights spent in accommodation units, followed by clusters 2 and 4, the counties that make up the cluster 1 having the average values more than 10 times lower compared to Bucharest (cluster 3), this being expected because cluster 1 does not have regions near the sea or mountains, or highly visited cities of Romania. Also, Bucharest has the lowest unemployment rate, the highest average unemployment rate being recorded by the counties that form cluster 2. Additionally, from the point of view of the number of doctors, Bucharest seems to have, by far, the best performances, which have more than 5 times more doctors per 10,000 inhabitants compared to the counties that compose cluster 1. Clusters 2 and 4 present the highest values of the percentages of children going to kindergarten, a predictable situation given the fact that these two classes are formed from the counties of Bulgaria. Also, cluster 2, which has the highest mean value, also presents the lowest standard deviation, the percentages of these counties varying, on average, by 4.75% from the group mean of 85.74%.Regarding the length of highways, it is worth noting that Bucharest has, by far, the largest number of km built, compared to the surface of the city, followed by cluster 4, which is made up of counties located mostly in the southern part of Bulgaria, in this situation the data varying, on average by 0.87 km/100 km2 from the average of 0.85 km/100 km2.
In the case of the complete method, according to Table 8, the hierarchy of the groups changes for accommodation nights, because Burgas and Constanța form cluster 2, having an average of more than 2 times higher compared to Bucharest. The values also vary, on average, from the group average of 2,994,583.08 overnight stays. As in the case of the situation presented previously, Bucharest continues to have the lowest unemployment rate compared to the averages of the other classes, as well as the highest number of doctors.
As for class 2, consisting of Constanța and Burgas, the small number of objects in the cluster makes its standard deviation, for most of the analyzed indicators, the smallest compared to the other clusters. For example, in the case of Infant mortality rate, both counties recorded the same value, of 7.5‰, so the standard deviation is 0. The exception being observed in the number of children enrolled in kindergarten, where the cluster has the highest standard deviation, of 19.08%, but it can be explained by the fact that the counties are part of different countries, with different policies regarding the participation of preschool children in education. The same explanation can be given for the other values of the standard deviations of the clusters for this indicator, because, in the case of Ward’s method, where the clusters were formed from the counties of the same country, the standard deviations are much lower.
As has already been pointed out in this paper, different clustering methods yield different results, this fact being highlighted in Table 6, Table 7 and Table 8; however, the observed discrepancies are not so significant, that is why it was wanted to present two different methods of linking counties in classes. Although there are methods to determine the accuracy of both methods, such as calculating silhouette coefficients, their values were so close for the two linkage approaches that it was considered necessary to present the two results.

4. Discussion

In the case of both classification methods, the differentiation of Bucharest from all other regions was noted, a fact also confirmed by another cluster analysis on the regions of central and eastern Europe, in which it was found that the capitals have a competitive advantage compared to the rest of the country. In the same study, Romanian and Bulgarian regions, except those containing capitals, also had the lowest values for the European Social Progress Index [34].
The research results showed a significantly higher number of tourists in the big cities, the Black Sea area, and the Carpathian Mountains area, in the case of Romania. Therefore, urban tourism appears to be gaining ground, helping to grow and develop these areas [35]. However, the impact of real estate development on these areas should be taken into account, as green spaces are considerably reduced by the creation of new residential areas that create additional pollution [36]. Not only does urban tourism bring a large number of tourists, in the case of Bulgaria, more than half of the number of tourists stay in the months of July and August, a sign that the sea and the sun have a huge potential for tourism [37]. Ways of promoting cities are achieved through culture; in the last five years, Plovdiv [38] and Timișoara [39] have been declared European cultural cities, attracting a significant number of tourists. Bucharest includes 5% of the total museums in the whole country, an increase in visits is highlighted in the last 10 years. Other cities with rich culture are Sibiu, this being the European capital of culture in 2017, Timișoara, Iași, and Cluj-Napoca [40]. Also, another way to increase the number of tourists is by promoting national brands, such as Dracula, or locations where famous films or series were made [41].
From the point of view of the unemployment rate, Bucharest had among the lowest recorded values. There is a study on the unemployment rate according to gender and the regions of Romania, according to which Bucharest forms a single class, being the most developed region [42]. These results are supported by current research. For the year 2021, the cities with the highest numbers of employees were Bucharest, Timiș, Cluj, Constanța, Prahova, and Brașov [43], the current study identifying the fact that these counties recorded low unemployment rates for the year 2022 as well. The sustainable economic growth obtained through the introduction of new technologies requires the intensification of the actions carried out by state institutions in order to increase the employment rate at the local level, because in the case of Bulgaria, long-term unemployment is a problem, and training and education programs are necessary to stimulate the development of the market work [44]. Also, according to a study on the rural areas of the new EU member states, Bulgaria had the most agricultural regions with low income and a high unemployment rate [45].
Regarding health, according to a cluster analysis carried out in European countries, Romania and Bulgaria are grouped together with 12 other countries in a cluster characterized by a small number of doctors and nurses, a smaller number of years in terms of life expectancy at birth, a high maternal mortality rate, as well as low values of public health expenditure per capita [46]. According to a study conducted on the regional disparities in the medical system in Romania, it can be seen that the west and southwest Oltenia regions had the lowest numbers of medical personnel [47], while in the current study, the number of doctors per 10,000 inhabitants seemed to be quite high in these regions compared to the eastern regions. Considering that the study performed in 2019 did not take into account the number of inhabitants and that the entire medical staff includes nurses, no comparisons can be made between the two studies. The results obtained illustrated very low values of the number of doctors; in more than half of Romania’s regions, the values were lower compared to the lowest value obtained by Bulgaria’s regions. This small number of doctors in Romania is explained by their migratory effect, noting that the most chosen destinations are Great Britain, Germany, France, and Italy [48]. This exodus of doctors has increased in intensity since 2007, when physician diplomas began to be recognized in the European space [49]. Romania and Bulgaria also have the highest infant mortality rates of all EU member states [50]. The most common causes of infant mortality are perinatal conditions and congenital malformations. In the case of Romania, a common cause, compared to the EU, is represented by diseases of the respiratory system [51]. In 2017, the highest infant mortality rates were observed in regions such as Călărași, Mehedinți, and Tulcea, while the lowest were found in Ilfov, Bucharest, Cluj, Prahova, and Timiș. In the present case, the values were lower compared to those of 2017. Now, Sălaju occupies a leading position, and Tulcea is no longer among the regions with the highest values.
Concerning the education results, it was noted that the percentage of children enrolled in kindergarten is higher in Bulgaria compared to Romania. This aspect can be explained by the fact that the costs related to parents for the units in Bulgaria have been eliminated [52]. Furthermore, kindergarten is not mandatory in Romania—only since 2023 has it become mandatory for those over 4 years of age—while in the case of Bulgaria, the last two years of kindergarten have been mandatory since 2010 [53]. Also, in the case of R&D, there is a higher percentage of employees in this field in Bulgarian regions compared to those of Romania. According to a European Commission report, in the period of 2011–2015, gross domestic expenditure on R&D was higher in Bulgaria compared to Romania, with the same being observed in the case of business expenditure on R&D. According to the same report, the innovation and sophistication factors indicator of the Global Competitiveness Report of 2016–2017 placed Bulgaria in 71st place, and Romania in 100th place [54].
Another indicator investigated in this study was the percentage of companies with over 250 employees from the total of companies in the region. An average of 0.20% was observed in the case of Romania and 0.18% for the Bulgarian regions. According to a European Commission report on the Small Business Act, estimates for 2018 showed that 0.20% of companies had more than 250 employees, with 24.3% of all employees employed [55].
A problem that both countries face is related to the kilometers of highway; there are many regions where their number is equal to 0. In the year 2021, Bulgaria had 806 km of highway, while Romania recorded 931 km, these being in the bottom 10 EU member states in terms of this indicator. It should be noted that from 1991 until 2020, the trend regarding the number of public roads was upward, even if during the period of 2016–2018 the trend of investments in this infrastructure was downward. Regarding NUTS-2 regions, by far the most public roads are found in the Bucharest-Ilfov region, followed by the northeast region, with the center and southeast regions at the opposite pole. In addition, the growth rate of highway lengths for 2020 was 2.03% in Bulgaria and 6.24% in Romania, respectively, 0% in 2021 in Bulgaria, and 1.20% in Romania. Also, of Romania’s 931 km of highway, not even one has been built in the southwest Oltenia region and only 20 km in the entire northeast region. The most km of highway built can be found in the west and south Muntenia regions with 253 km and 258 km, respectively [56]. In the case of Bulgaria, the roads are better developed from east to west than from north to south. Also, the density of roads is lower in the southeast and southwest regions, but they have a better developed high-class road network, while the north central region has an increased road density, but no complete highways. Moreover, Blagoevgrad, Montana, Burgas, Sliven, and Pazardzhik have the lowest density of road networks [57].
Presenting the issue of regional competitiveness from the introduction, it was desirable to make a comparison of the studies presented in that section with those provided by this research. Therefore, as presented in the introduction, according to RCI 2.0 the worst performing regions were northwest, southeast, and Severozapaden. The current research show that for some of the indicators, the majority of the counties that make up these regions are in situations similar to NUTS-2 regions [2]. Also, in terms of tourism, the most competitive regions are those around the sea, in mountainous areas and the largest cities, this fact being consistent with the results of other studies [6]. Additionally, another study previously presented highlighted the fact that the regions in the center and west of Romania are the best performing in terms of industry [8]. The current research notes seminal results because the counties in the center and west have a lower unemployment rate, as well as more large companies. Moreover, at the time studied, Romania had a greater number of km built compared to Bulgaria, the situation being the opposite in the year 2020 [20]. As for Bulgaria, the introduction also stated the fact that this state ensures a safe place for children in kindergarten in the last years of study [15], with the current research observing the fact that the number of children enrolled in the counties of this country are higher compared to Romania.
Summarizing the discussion section, starting from the obtained results, certain recommendations will be made. First of all, the much higher percentages of children attending kindergarten in Bulgaria’s regions should set an example for Romania’s counties, the latter being able to try to adopt new policies from Bulgaria regarding early child education. It is also suggested to improve the infrastructure, especially in rural areas. This fact also helps to encourage the return of young people to those regions because both countries face an excessive degree of aging in these areas, with the active population migrating to other regions or other countries to find jobs. Moreover, the development of transport networks will help to strengthen the industries and increase the links between the two countries, as well as the links with the EU.

5. Conclusions

The purpose of the current study was to identify the performances recorded at the level of NUTS-3 regions for Bulgaria and Romania, countries for which they were identified among the lowest values for the EU Regional Competitiveness Index 2.0—2022. The actual research began by exposing the indicators selected in the analysis, it being desirable to cover as wide a range of fields as possible that make up the economy of these states. Thus, indicators aimed at presenting information on tourism, the labor market, fields such as health, education, as well as research and development were displayed; to these adding transport, demographic statistics, and non-financial enterprises. By presenting the total and individual descriptive statistics (for the two countries) from the beginning of the section dedicated to the results, an attempt was made to present some general perspectives, noting the presence of the majority of heterogeneous data series, a sign that the data were very scattered in relation to the average, indicating a significant variance between the investigated regions.
The limitations of this research focus on the difficulty in finding a larger number of indicators to describe, perhaps in more detail, the economies of the two countries. However, it must be stated that, although there would have been several indicators describing NUTS-3 regions in both countries, it was still necessary to find a correspondence between the indicators published by the National Institutes of Statistics in the two countries. Therefore, this number of eight indicators was chosen to describe as many areas as possible related to the regional economies of these two EU member states. Moreover, it should be stated that also from the point of view of the clustering methods, there can be different results, as observed in the case of the complete and Ward’s linkage methods. Even if hierarchical algorithms were used in the present case, other unsupervised grouping methods could have been chosen, but it must be stated that this method is also very well-known and simple to apply.
To the best of our knowledge, we have not identified similar studies that evaluate the performance of NUTS-3 regions for the two analyzed countries through the lens of the analyzed indicators. Although there are papers that discuss the indicators separately, but for other periods of time, or in other contexts than those described in the current research, those that we found have been detailed both in the introduction and in the discussions. The application of this methodology for the counties in Greece could generate comparable results because they have similar characteristics to those studied in the current research, this fact being also highlighted by RCI 2.0. For the other territories of the European countries, separate studies are needed to be able to see their results.
Regarding possible future studies, other methods of grouping and comparison of accuracy could be applied to what was applied in the current research. Also, if more NUTS-3 regions data were made available, one could even try to create a composite index starting from the structure of the EU Regional Competitiveness Index 2.0.
Author Contributions

Conceptualization, A.-N.C., C.D. and K.S.; data curation, A.-N.C., C.D. and K.S.; formal analysis, A.-N.C. and K.S.; investigation, A.-N.C. and K.S.; methodology, A.-N.C. and K.S.; resources, A.-N.C. and K.S.; software, A.-N.C. and K.S.; supervision, C.D. and K.S.; validation, A.-N.C., C.D. and K.S.; visualization, A.-N.C., C.D. and K.S.; writing—original draft, A.-N.C.; writing—review and editing, C.D. and K.S. All authors have read and agreed to the published version of the manuscript.

Funding

This work was funded by the EU’s NextGenerationEU instrument through the National Recovery and Resilience Plan of Romania—Pillar III-C9-I8, managed by the Ministry of Research, Innovation and Digitization, within the project entitled “Place-based Economic Policy in EU’s Periphery—fundamental research in collaborative development and local resilience. Projections for Romania and Moldova (PEPER)”, contract no. 760045/23.05.2023, code CF 275/30.11.2022.

Institutional Review Board Statement

Not applicable.

Informed Consent Statement

Not applicable.

Data Availability Statement

Data is contained within the paper.

Conflicts of Interest

The authors declare no conflicts of interest.

Appendix A

Table A1. Region labels.
CountryRegionLabel
BulgariaBlagoevgradBG_BLGRomaniaBuzauRO_BZ
BulgariaDobrichBG_DOBRomaniaCalarasiRO_CL
BulgariaHaskovoBG_HKVRomaniaCaras-SeverinRO_CS
BulgariaKardzhaliBG_KRZRomaniaCovasnaRO_CV
BulgariaKyustendilBG_KNLRomaniaDambovitaRO_DB
BulgariaLovechBG_LOVRomaniaGalatiRO_GL
BulgariaMontanaBG_MONRomaniaGiurgiuRO_GR
BulgariaPazardzhikBG_PAZRomaniaGorjRO_GJ
BulgariaRazgradBG_RAZRomaniaHarghitaRO_HR
BulgariaSilistraBG_SLSRomaniaHunedoaraRO_HD
BulgariaSlivenBG_SLVRomaniaIalomitaRO_IL
BulgariaSofiaBG_SFORomaniaMaramuresRO_MM
BulgariaTargovishteBG_TGVRomaniaMehedintiRO_MH
BulgariaVidinBG_VIDRomaniaNeamtRO_NT
BulgariaVratsaBG_VRCRomaniaOltRO_OT
BulgariaYambolBG_JAMRomaniaPrahovaRO_PH
BulgariaBurgasBG_BGSRomaniaSalajRO_SJ
BulgariaGabrovoBG_GABRomaniaSatu MareRO_SM
BulgariaGrad SofiyaBG_SOFRomaniaSuceavaRO_SV
BulgariaPernikBG_PERRomaniaTeleormanRO_TR
BulgariaPlevenBG_PVNRomaniaTulceaRO_TL
BulgariaPlovdivBG_PDVRomaniaValceaRO_VL
BulgariaRuseBG_RSERomaniaVasluiRO_VS
BulgariaShumenBG_SHURomaniaVranceaRO_VN
BulgariaSmolyanBG_SMLRomaniaConstantaRO_CT
BulgariaStara ZagoraBG_SZRRomaniaBucurestiRO_B
BulgariaVarnaBG_VARRomaniaBihorRO_BH
BulgariaVeliko TarnovoBG_VTRRomaniaBrasovRO_BV
RomaniaAlbaRO_ABRomaniaClujRO_CJ
RomaniaAradRO_ARRomaniaDoljRO_DJ
RomaniaArgesRO_AGRomaniaIasiRO_IS
RomaniaBacauRO_BCRomaniaIlfovRO_IF
RomaniaBistrita-NasaudRO_BNRomaniaMuresRO_MS
RomaniaBotosaniRO_BTRomaniaSibiuRO_SB
RomaniaBrailaRO_BRRomaniaTimisRO_TM

References

  1. Kozovska, K.; Annoni, P.; Dijkstra, L. A New Regional Competitiveness Index: Theory, Methods and Findings; European Union Regional Policy Working Paper; 2011. Available online: https://ec.europa.eu/regional_policy/information-sources/publications/working-papers/2011/a-new-regional-competitiveness-index-theory-methods-and-findings_en (accessed on 7 June 2024).
  2. Dijkstra, L.; Papadimitriou, E.; Martinez, B.C.; De Dominicis, L.; Kovačić, M. EU Regional Competitiveness Index 2.0: 2022 Edition, Revised May 2023; Publications Office of the European Union: Luxembourg, 2023; ISBN 978-92-68-04007-2.
  3. Landesmann, M.; Székely, I.P. (Eds.) Does EU Membership Facilitate Convergence? The Experience of the EU’s Eastern Enlargement—Volume I: Overall Trends and Country Experiences;Studies in Economic Transition; Springer International Publishing: Cham, Switzerland, 2021; ISBN 978-3-030-57685-1. [Google Scholar]
  4. Brătucu, G.; Băltescu, C.; Neacșu, N.; Boșcor, D.; Țierean, O.; Madar, A. Approaching the Sustainable Development Practices in Mountain Tourism in the Romanian Carpathians. Sustainability 2017, 9, 2051. [Google Scholar] [CrossRef]
  5. Coroș, M.M.; Popescu, D.; Pop, I.; Gheorghe, G. Smart City, Smart Tourism. In Remodelling Businesses for Sustainable Development; Negrușa, A.L., Coroş, M.M., Eds.; Springer Proceedings in Business and Economics; Springer International Publishing: Cham, Switzerland, 2023; pp. 167–188. ISBN 978-3-031-19655-3. [Google Scholar]
  6. Mitrică, B.; Şerban, P.-R.; Mocanu, I.; Damian, N.; Grigorescu, I.; Dumitraşcu, M.; Dumitrică, C. Developing an Indicator-Based Framework to Measure Sustainable Tourism in Romania. A Territorial Approach. Sustainability 2021, 13, 2649. [Google Scholar] [CrossRef]
  7. Haller, A.-P.; Tacu Hârșan, G.-D. Longitudinal Analysis of Sustainable Tourism Potential of the Black Sea Riparian States Bulgaria, Romania and Turkey. Int. J. Environ. Res. Public Health 2023, 20, 2971. [Google Scholar] [CrossRef]
  8. Mitrică, B.; Grigorescu, I.; Săgeată, R.; Mocanu, I.; Dumitraşcu, M. Territorial Development in Romania. In Dilemmas of Regional and Local Development; Routledge Explorations in Development Studies; Routledge: Abingdon, UK; New York, NY, USA, 2020; ISBN 978-0-429-43386-3. [Google Scholar]
  9. OECD. Reaching Out and Activating Inactive and Unemployed Persons in Bulgaria; Connecting People with Jobs; OECD: Paris, France, 2022; ISBN 978-92-64-43180-5. [Google Scholar]
  10. Petrova, E.; Filipov, S. Employment and Unemployment as Predictors of Economic Security on the Example of the Republic of Bulgaria. Int. Conf. Knowl.-Based Organ. 2018, 24, 70–75. [Google Scholar] [CrossRef]
  11. Zaman, G.; Hrehorciuc Caragea, N. Health Inequality—An Overview on the Health Disparities between Romania and European Union State Members. In Economics of Sustainable Development Economic Forecast: The Return of Growth; MPRA Paper; University Library of Munich: Munich, Germany, 2012; p. 48779. [Google Scholar]
  12. OECD. State of Health in the EU Romania Contry Health Profile 2023; OECD: Paris, France, 2023; pp. 1–24. [Google Scholar]
  13. International Trade Administration Bulgaria—Country Commercial Guide—Healthcare and Life Sciences. 2024. Available online: https://www.trade.gov/country-commercial-guides/bulgaria-healthcare-and-life-sciences (accessed on 6 May 2024).
  14. Mara, I. Health Professionals Wanted: The Case of Health Professionals from Western Balkan Countries to Europe. CEEMR 2023, 12, 33–52. [Google Scholar] [CrossRef]
  15. Akvile Motiejunaite Access to and Quality of Early Childhood Education and Care Policies in Europe: Can We Look at Both? IUL Res. 2021, 2, 64–80. [CrossRef]
  16. Sandu, S.; Goschin, Z.; Anghel, I.; Goschin, G. The R&D and Innovation Systems in Romania and Bulgaria in the EU Context. Procedia Econ. Financ. 2015, 32, 1804–1826. [Google Scholar] [CrossRef]
  17. Sehleanu, M.; Simuț, R.; Simuț, C. Economic Growth and R&D Expenditure in Romania. An Empirical Research; Faculty of Management, Academy of Economic Studies: Bucharest, Romania, 2022. [Google Scholar]
  18. European Commission; Directorate General for Research and Innovation; Ministry of Science and Higher Education, Poland; Ministry of Economy and Competitiveness, Spain; Foundation for Science and Technology, Portugal; Federal Ministry of Science, Research and Economy, Austria; Ministry of Education, Science and Sport, Slovenia; Maastricht University, the Netherlands. Peer Review of the Bulgarian Research and Innovation System: Horizon 2020 Policy Support Facility; Publications Office of the European Union: Luxembourg, 2015.
  19. Cigu, E.; Agheorghiesei, D.T.; Gavriluță (Vatamanu), A.F.; Toader, E. Transport Infrastructure Development, Public Performance and Long-Run Economic Growth: A Case Study for the Eu-28 Countries. Sustainability 2018, 11, 67. [Google Scholar] [CrossRef]
  20. Ignatov, A. European Highway Networks, Transportation Costs, and Regional Income. Reg. Sci. Urban Econ. 2024, 104, 103969. [Google Scholar] [CrossRef]
  21. Cristina, I.O.M.; Nicoleta, C.; Cătălin, D.R.; Margareta, F. Regional Development in Romania: Empirical Evidence Regarding the Factors for Measuring a Prosperous and Sustainable Economy. Sustainability 2021, 13, 3942. [Google Scholar] [CrossRef]
  22. Belyadi, H.; Haghighat, A. Unsupervised Machine Learning: Clustering Algorithms. In Machine Learning Guide for Oil and Gas Using Python; Elsevier: Amsterdam, The Netherlands, 2021; pp. 125–168. ISBN 978-0-12-821929-4. [Google Scholar]
  23. Lane, M.; Maiocco, A.; Bhatia, S.K.; Climer, S. Eyeing the Patterns: Data Visualization Using Doubly-Seriated Color Heatmaps. In Advances in Computers; Elsevier: Amsterdam, The Netherlands, 2020; Volume 119, pp. 121–156. ISBN 978-0-12-820325-5. [Google Scholar]
  24. Vaish, R.; Dwivedi, U.D.; Tewari, S.; Tripathi, S.M. Machine Learning Applications in Power System Fault Diagnosis: Research Advancements and Perspectives. Eng. Appl. Artif. Intell. 2021, 106, 104504. [Google Scholar] [CrossRef]
  25. Mirzaei, G.; Adeli, H. Machine Learning Techniques for Diagnosis of Alzheimer Disease, Mild Cognitive Disorder, and Other Types of Dementia. Biomed. Signal Process. Control 2022, 72, 103293. [Google Scholar] [CrossRef]
  26. Mooi, E.; Sarstedt, M. Cluster Analysis. In A Concise Guide to Market Research; Springer: Berlin/Heidelberg, Germany, 2010; pp. 237–284. ISBN 978-3-642-12540-9. [Google Scholar]
  27. Nowak-Brzezińska, A.; Gaibei, I. How the Outliers Influence the Quality of Clustering? Entropy 2022, 24, 917. [Google Scholar] [CrossRef] [PubMed]
  28. Lopes, H.E.G.; Gosling, M.D.S. Cluster Analysis in Practice: Dealing with Outliers in Managerial Research. Rev. Adm. Contemp. 2021, 25, e200081. [Google Scholar] [CrossRef]
  29. Hexmoor, H. Diffusion and Contagion. In Computational Network Science; Elsevier: Amsterdam, The Netherlands, 2015; pp. 45–64. ISBN 978-0-12-800891-1. [Google Scholar]
  30. Petre, I.; Barna, F.; Gurgus, D.; Tomescu, L.C.; Apostol, A.; Petre, I.; Furau, C.; Năchescu, M.L.; Bordianu, A. Analysis of the Healthcare System in Romania: A Brief Review. Healthcare 2023, 11, 2069. [Google Scholar] [CrossRef]
  31. Volen, E. Now That Kindergarten Is Free of Charge: Laying the Foundations for Future Pre-School Policy Change in Bulgaria. Front. Educ. 2023, 8, 1191355. [Google Scholar] [CrossRef]
  32. Charrad, M.; Ghazzali, N.; Boiteau, V.; Niknafs, A. NbClust: An R Package for Determining the Relevant Number of Clusters in a Data Set. J. Stat. Soft. 2014, 61, 1–36. [Google Scholar] [CrossRef]
  33. Rodriguez, M.Z.; Comin, C.H.; Casanova, D.; Bruno, O.M.; Amancio, D.R.; Costa, L.D.F.; Rodrigues, F.A. Clustering Algorithms: A Comparative Approach. PLoS ONE 2019, 14, e0210236. [Google Scholar] [CrossRef] [PubMed]
  34. Chrobocińska, K. Competitiveness of Regions in Selected Countries of Central and Eastern Europe. Cent. Eur. Econ. J. 2023, 10, 391–402. [Google Scholar] [CrossRef]
  35. Popescu, R.I.; Corboș, R.-A. The Role of Urban Tourism in the Strategical Development of Brasov Area. Theor. Empir. Res. Urban Manag. 2010, 7, 69–85. [Google Scholar]
  36. Rusu, R.; Bodocan, V.; Man, T. Urban Sprawl and Its Impact on Urban Tourism in Romania. J. Balk. Near East. Stud. 2020, 22, 521–533. [Google Scholar] [CrossRef]
  37. Ivanov, S. Mass Tourism in Bulgaria: The Force Awakens. In Mass Tourism in a Small World; Harrison, D., Sharpley, R., Eds.; CABI: Wallingford, UK, 2017; pp. 168–180. ISBN 978-1-78064-854-5. [Google Scholar]
  38. Lulcheva, I. Scientific Papers Series Management, Economic Engineering in Agriculture and Rural Development. Sci. Pap. Ser. Manag. Econ. Eng. Agric. Rural. Dev. 2019, 19, 369–378. [Google Scholar]
  39. Boutier, F. Timisoara Is the European Capital of Culture in 2023. 2023. Available online: https://romania.representation.ec.europa.eu/news/timisoara-este-capitala-europeana-culturii-2023-2023-01-06_ro (accessed on 4 May 2024).
  40. Merciu, F.-C.; Merciu, G.-L.; Cercleux, A.-L. The Role of Museums in the Development of Cultural Tourism. Case Study: Bucharest Municipality. In Innovative Business Development—A Global Perspective; Orăștean, R., Ogrean, C., Mărginean, S.C., Eds.; Springer Proceedings in Business and Economics; Springer International Publishing: Cham, Switzerland, 2018; pp. 173–186. ISBN 978-3-030-01877-1. [Google Scholar]
  41. Stoleriu, O.M.; Ibănescu, B.-C.; Stoleriu, C.C.; Lupu, C. Strengthening Dracula Tourism Brand through Cartographic Approaches. J. Maps 2022, 18, 61–69. [Google Scholar] [CrossRef]
  42. Grecu, M. Regional Unemployment Disparities in Romania; Ovidius University Annals: Economic Sciences Series 17; Ovidius University of Constantza, Faculty of Economic Sciences: Constanța, Romania, 2017; pp. 203–207. [Google Scholar]
  43. PwC. Labour Market Analysis in Romania. 2023, pp. 1–36. Available online: https://www.amcham.ro/download?file=mediaPool/uW9pTxc.pdf (accessed on 5 May 2024).
  44. Metodi, I. Problems in the Labor Market in Bulgaria; Бургаски Свoбoден Университет: Burgas, Bulgaria, 2019; pp. 283–287. [Google Scholar]
  45. Baum, S.; Trapp, C.; Weingarten, P. Typology of Rural Areas in the Central and Eastern European EU New Member States; IAMO Discussion Papers 72; Leibniz Institute of Agricultural Development in Transition Economies (IAMO): Halle (Saale), Germany, 2004. [Google Scholar] [CrossRef]
  46. Yalçin Balçik, P.; Demirci, Ş.; Konca, M. Comparison of European Countries’ Health Indicators and Health Expenditures by Clustering Analysis. Ömer Halisdemir Üniversitesi İktisadi ve İdari Bilimler Fakültesi Dergisi 2021, 14, 365–377. [Google Scholar] [CrossRef]
  47. Cristache, S.-E.; Marin, E.; Șerban, D. Regional Disparities in the Public Health Care System: Evidence from Romania. Proc. Int. Conf. Appl. Stat. 2019, 1, 203–215. [Google Scholar] [CrossRef]
  48. Boboc, C.; Ghiță, S.I.; Vasile, V. Migration of Health Workers: Key Findings from Romania. Manag. Mark. 2024, 19, 1–14. [Google Scholar] [CrossRef]
  49. Rohova, M. Health Professionals Migration—The Case of Romania. J. Health Econ. Manag. 2011, 2, 3–21. [Google Scholar]
  50. Onambele, L.; San-Martin-Rodríguez, L.; Niu, H.; Alvarez-Alvarez, I.; Arnedo-Pena, A.; Guillen-Grima, F.; Aguinaga-Ontoso, I. Infant Mortality in the European Union: A Time Trend Analysis of the 1994–2015 Period. An. Pediatría (Engl. Ed.) 2019, 91, 219–227. [Google Scholar] [CrossRef]
  51. Pop, T.L. Overview of the Pediatric Healthcare System in Romania. Turk. Pediatri Ars. 2020, 55 (Suppl. S1), 69. [Google Scholar] [CrossRef]
  52. Volen, E.; De Laat, J. Building Evidence for Pre-School Policy Change in Bulgaria. Front. Public Health 2021, 9, 594029. [Google Scholar] [CrossRef]
  53. Georgieva, G. Organisation of Early Childhood Education and Care in Romania, Greece and Bulgaria. Sci. Bus. Soc. 2022, 7, 62–64. [Google Scholar]
  54. European Commission; Directorate General for Research and Innovation; Technopolis Group. Specific Support to Bulgaria: Horizon 2020 Policy Support Facility: Background Report; Publications Office of the European Union: Luxembourg, 2017. [Google Scholar]
  55. European Commission 2019 SBA Fact Sheet—Bulgaria. 2019. Available online: https://www.google.com/url?sa=t&source=web&rct=j&opi=89978449&url=https://ec.europa.eu/docsroom/documents/38662/attachments/4/translations/en/renditions/native&ved=2ahUKEwjf5r_B14WJAxWthP0HHQgyIUYQFnoECBoQAQ&usg=AOvVaw3b0cW9zKo_cWKRWVkLF1FI (accessed on 5 May 2024).
  56. Șteliac, N. An Overview of the Situation of Highways in Romania; Annals of the “Constantin Brâncuşi” University of Târgu Jiu, Economy Series; 2023; Available online: https://www.google.com/url?sa=t&source=web&rct=j&opi=89978449&url=https://www.utgjiu.ro/revista/ec/pdf/2023-02/03_Steliac.pdf&ved=2ahUKEwjf56bX14WJAxWFgf0HHUzSKTMQFnoECBsQAQ&usg=AOvVaw1ZXITj7Yohgdcm4Uj5wJ8V (accessed on 5 May 2024).
  57. Simeonova, D.; Simeonov, D. Contemporary State of the Transport System in Bulgaria. IJSMR 2022, 5, 214–224. [Google Scholar] [CrossRef]
Figure 1. EU Regional Competitiveness Index 2.0—2022. Source: https://ec.europa.eu/regional_policy/information-sources/maps/regional-competitiveness_en (accessed on 10 June 2024).
Stats 07 00065 g001
Figure 2. Research methodology.
Stats 07 00065 g002
Figure 3. Overnights spent in accommodation establishments.
Stats 07 00065 g003
Figure 4. Unemployment rate.
Stats 07 00065 g004
Figure 5. Physicians in health establishments per 10,000 inhabitants.
Stats 07 00065 g005
Figure 6. Infant mortality rate (per 1000 live births).
Stats 07 00065 g006
Figure 7. Group net enrolment rate of children in kindergartens (%).
Stats 07 00065 g007
Figure 8. Staff engaged in research and development (per 1000 employees).
Stats 07 00065 g008
Figure 9. Length of motorways (km/100 km2).
Stats 07 00065 g009
Figure 10. Relative share of enterprises with more than 250 employees in total number of enterprises in the district.
Stats 07 00065 g010
Figure 11. Dendrogram (Ward).
Stats 07 00065 g011
Figure 12. Index clustering proposal (Ward).
Stats 07 00065 g012
Figure 13. Dendrogram (complete).
Stats 07 00065 g013
Figure 14. Index clustering proposal (complete).
Stats 07 00065 g014
Figure 15. Cluster composition (Ward).
Stats 07 00065 g015
Figure 16. Cluster map (Ward).
Stats 07 00065 g016
Figure 17. Clusters composition (complete).
Stats 07 00065 g017
Figure 18. Cluster map (complete).
Stats 07 00065 g018
Table 1. Indicators.
IndicatorDomainNameUnit
V1TourismNights spent—totalnumber
V2Labor marketUnemployment rate%
V3Health servicesPhysicians in health establishments 10,000 inhabitantsnumber
V4Demographic statisticsInfant mortality rate (per 1000 live births)
V5EducationGroup net enrolment rate of the children in kindergarten%
V6R&D 1Staff engaged in research and development (per 1000 employees)
V7TransportLength of motorways km/100 km2
V8Non-financial
enterprises
Relative share of enterprises with more than 250 employees in total number of enterprises in the district%
1 Research and development.
Table 2. Descriptive statistics (for both countries).
TotalV1V2V3V4V5V6V7V8
Mean727,595.194.5532.815.7173.225.790.650.18
Median236,544.503.7530.205.8069.833.660.000.18
Mode#N/A 13.2034.907.5086.902.700.000.10
Standard Deviation1,345,910.843.0017.742.1812.986.181.310.07
Kurtosis21.490.263.040.26−1.370.8132.510.73
Skewness4.190.941.58−0.080.011.195.040.90
Range8,980,046.0012.6087.2910.7046.3626.909.650.35
Minimum10,101.000.4012.030.9048.640.000.000.08
Maximum8,990,147.0013.0099.3211.6095.0026.909.650.43
Coefficient of Variation184.9865.8554.0738.2017.73106.57202.5641.91
Count70.0070.0070.0070.0070.0070.0070.0070.00
1 There are no repeating values in the series.
Table 3. Descriptive statistics Romania.
RomaniaV1V2V3V4V5V6V7V8
Mean643,913.623.6929.205.9263.843.530.660.20
Median295,028.003.4021.135.8063.331.280.000.19
Mode#N/A 13.2019.076.30#N/A 10.310.000.18
Standard Deviation927,421.981.9220.651.466.924.711.600.08
Kurtosis10.070.303.580.82−0.101.6025.210.87
Skewness2.990.641.990.22−0.111.624.700.89
Range47,450,66.008.0087.297.5031.7616.339.650.35
Minimum10,101.000.4012.032.6048.640.000.000.08
Maximum4,755,167.008.4099.3210.1080.4016.339.650.43
Coefficient of Variation144.0352.0070.7224.5910.84133.39243.1838.53
Count42.0042.0042.0042.0042.0042.0042.0042.00
1 There are no repeating values in the series.
Table 4. Descriptive statistics Bulgaria.
BulgariaV1V2V3V4V5V6V7V8
Mean853,117.545.8538.225.4187.289.190.630.15
Median180,840.505.3034.905.8087.257.700.320.10
Mode#N/A 10.9034.902.5086.9016.900.000.10
Standard Deviation1,815,488.893.8010.302.974.006.620.710.06
Kurtosis15.80−1.233.53−0.887.430.14−1.05−0.09
Skewness3.780.261.790.13−1.800.790.610.92
Range8,959,044.0012.1046.2010.7023.0026.402.180.20
Minimum31,103.000.9026.200.9072.000.500.000.10
Maximum8,990,147.0013.0072.4011.6095.0026.902.180.30
Coefficient of Variation212.8165.0026.9454.854.5972.08112.2442.55
Count28.0028.0028.0028.0028.0028.0028.0028.00
1 There are no repeating values in the series.
Table 5. Standardized data.
RegionV1V2V3V4V5V6V7V8
RO_AB−0.22−0.28−0.69−0.97−0.47−0.500.441.75
RO_AR−0.31−1.15−0.17−0.24−0.45−0.120.131.62
:
BG_BLG0.490.28−0.08−1.291.49−0.210.12−1.05
BG_BGS6.140.080.390.821.17−0.130.01−1.05
Table 6. NUTS-3 Regions cluster results.
ItemWardCompleteItemWardCompleteItemWardCompleteItemWardCompleteItemWardComplete
BG_BLG41BG_VRC21BG_SHU44RO_CJ44RO_B33
BG_DOB21BG_JAM21BG_SML44RO_CV11RO_MS44
BG_HKV41RO_AB41BG_SZR44RO_DB11RO_NT11
BG_KRZ41RO_AR41BG_VAR44RO_DJ44RO_OT11
BG_KNL41RO_AG41BG_VTR44RO_GL11RO_SJ11
BG_LOV21RO_CT42RO_BC11RO_GR11RO_SM11
BG_MON21RO_PH41RO_BH44RO_GJ11RO_SB44
BG_PAZ21BG_BGS22RO_BN11RO_HR11RO_SV11
BG_RAZ21BG_GAB44RO_BT11RO_HD11RO_TR11
BG_SLS21BG_SOF44RO_BR11RO_IL11RO_TM44
BG_SLV21BG_PER44RO_BV44RO_IS44RO_TL11
BG_SFO41BG_PVN44RO_BZ11RO_IF44RO_VL11
BG_TGV21BG_PDV44RO_CL11RO_MM11RO_VS11
BG_VID21BG_RSE44RO_CS11RO_MH11RO_VN11
Table 7. Cluster statistics Ward.
StatisticsClusterV1V2V3V4V5V6V7V8
Mean1298,194.224.4218.876.2763.541.120.210.16
21,005,586.428.1134.287.6285.745.730.390.11
33,238,369.001.0099.322.6065.0515.769.650.43
4919,167.103.3742.544.5577.199.700.850.22
Standard
deviation
1313,169.221.634.661.387.071.320.480.04
22,549,380.222.684.371.974.753.150.500.03
3#DIV/0! *#DIV/0!#DIV/0!#DIV/0!#DIV/0!#DIV/0!#DIV/0!#DIV/0!
41,139,244.033.0217.022.1513.306.770.870.07
* Cannot be calculated because there is only one county in that class.
Table 8. Cluster statistics complete.
StatisticsClusterV1V2V3V4V5V6V7V8
Mean1339,230.744.9624.156.0771.422.820.400.16
26,872,657.003.5539.787.5074.915.990.860.13
33,238,369.001.0099.322.6065.0515.769.650.43
4900,206.753.8849.134.8677.6812.260.750.23
Standard
deviation
1377,540.912.788.062.0912.092.990.600.06
22,994,583.081.770.030.0019.081.390.280.04
3#DIV/0! *#DIV/0!#DIV/0!#DIV/0!#DIV/0!#DIV/0!#DIV/0!#DIV/0!
41,024,830.983.4816.782.2014.366.750.980.06
* Cannot be calculated because there is only one county in that class.
Disclaimer/Publisher’s Note: The statements, opinions and data contained in all publications are solely those of the individual author(s) and contributor(s) and not of MDPI and/or the editor(s). MDPI and/or the editor(s) disclaim responsibility for any injury to people or property resulting from any ideas, methods, instructions or products referred to in the content.