1. Introduction
Stock market synchronization denotes the phenomenon where national stock markets exhibit substantial simultaneous movements. The level of correlation or co-movement between the returns of national stock markets remains crucial for diversifying international portfolios effectively. This correlation is subject to fluctuations over time due to increasing economic interdependence facilitated by international trade and financial markets [
1]. The liberalization of capital flows, the expansion of foreign direct investment, and the internationalization of equity (stock) markets all contributed to the growing interdependence of markets [
2,
3,
4,
5]. Comprehending the inter-market volatility within and between markets is crucial for financial policy and regulation formulation across financial markets, financial asset pricing and trading, and financial hedge construction, particularly across asset classes [
2].
The study of spillover volatility offers important insights into the information flow between markets for different asset classes, both within countries and between local markets. For instance, information can be transferred from the market for underlying assets to the market for derivatives created on those assets. Additionally, there may be spillovers from one trading time zone to another or from developed markets to emerging markets [
2]). The connection between developed and emerging markets, as well as the implications for financial liberalization and global integration, have drawn the attention of financial economists, e.g., Refs. [
6,
7,
8,
9]. Modeling and forecasting volatility and correlations have taken center stage in financial econometrics for derivative pricing, portfolio optimization, risk management, and hedging strategies because of their precise estimates [
7].
Numerous generalized autoregressive conditional heteroscedasticity (GARCH) [
10] models such as exponential GARCH [
11], threshold GARCH [
12], and nonsymmetric GARCH [
13], and multivariate GARCH models such as BEKK [
14], constant conditional correlation (CCC) [
15], dynamic conditional correlation (DCC) [
16], and their variants have been proposed to investigate volatility and correlation among stock markets. It has been demonstrated that these models are highly effective at simulating and predicting the volatility of financial return series. Additionally, there is a chance that financial assets will be correlated, and these correlations are significant when it comes to financial management tasks like portfolio construction [
17].
Numerous studies have employed Multivariate GARCH models to investigate the dynamic conditional variance and correlation among assets [
18,
19,
20]. Ref. [
21] utilized the dynamic conditional correlation (DCC) multivariate GARCH model to examine the transmission of financial shocks across financial firms in both Australia and the US, along with their sensitivity to local and foreign interest rates. The authors observed that the conditional correlation between US and Australian financial stock returns fluctuated over time. Additionally, they found an increase in cross-correlation between banks and financial stock returns during the global financial crisis, diminishing the benefits of diversified international portfolios and exacerbating financial instability. Furthermore, the authors reported that, during contractionary periods in the US business cycle, the conditional correlation between returns of Australian and US financial firms increased, whereas it decreased during expansionary phases. Similarly, Ref. [
22] investigated time-varying conditional correlations among weekly index returns of seven emerging stock markets in Central and Eastern Europe, as well as US and German stock returns, using Engle’s (2002) dynamic conditional correlation (DCC) multivariate GARCH model. Their findings revealed a statistically significant increase in conditional correlations between US and German stock returns and CEE stock returns, particularly during the 2007–2009 financial crises. This suggests that these emerging markets are susceptible to external shocks, with a notable regime shift in conditional correlation. Furthermore, Ref. [
22] highlighted the substantial impact of both domestic and foreign monetary variables, along with exchange rate movements, on conditional correlations. Additionally, they demonstrated that during the 2007–2009 financial crisis, macroeconomic fundamentals played a significant role in explaining these conditional connections. Majdoub (2014) investigated the conditional correlations among a sample of five emerging Islamic markets—Turkey, Indonesia, Pakistan, Qatar, and Malaysia—and the US market. Given the strict inclusion criteria of the MSCI (Morgan Stanley Capital International) Islamic equity index, it serves as the basis for the empirical design. Three multivariate models—BEKK, CCC, and DCC—were employed, and the results revealed a weak temporal correlation between the US and Islamic emerging equity markets. There is insufficient evidence to suggest that the US market influences emerging Islamic equities markets, as indicated by the results.
The studies mentioned above show the ability and efficiency of various multivariate GARCH models in investigating dynamic conditional volatility and correlation between stock markets. Therefore, the symmetric and asymmetric DCC-GARCH models with different multivariate distributions were used in this work to explore dynamic conditional volatility and co-movement between the JSE.JO stock market of South Africa and four of its partners as developed and emerging stock markets.
Although a body of literature has been written about the dynamic conditional correlation between stock markets, especially in the context of developed and developing economies, there is still a lack of knowledge regarding the particular dynamics between the South African Johannesburg Stock Exchange (JSE) market and its partner markets, which include the US, UK, India, and Malaysia. Previous research frequently ignores these markets’ distinct features and interactions, such as their varying degrees of economic development and currency influences. Thus, empirical studies that utilize sophisticated modeling methods, like DCC-GARCH models with different multivariate distributions, are required to fully examine the changing correlation patterns and account for the possible influence of exchange rate fluctuations. Closing this gap will help investors, policymakers, and financial practitioners by offering insightful information about the interdependence and mechanisms of risk transmission among these markets.
The following questions aim to address the aforementioned gap: Are there volatilities in the studied stock market returns? Does the correlation between the stock market returns change over time? Are correlations higher during periods of increased volatility, particularly during crises? To answer these questions, symmetric and asymmetric DCC-EGARCH models are employed with two different multivariate distributions.
Most studies in the literature have focused on Asian stock markets, particularly those in China [
23], India [
24], and Pakistan [
25,
26], as well as European markets like those in Central and Eastern Europe [
27], and American markets such as the S& P 500. These studies typically encompass both developed and emerging markets. The main contribution of this study is to provide valuable insights into the co-movement and significance of African stock markets, specifically the JSE.JO of South Africa, in relation to both developed and developing stock markets by using both symmetric and asymmetric DCC-EGARCH models. Additionally, it presents the effects of different leptokurtic multivariate distributions, such as the Student’s t and Laplace distributions, in analyzing dynamic volatility and correlation.
The remainder of this paper is formed as follows, in
Section 2, a literature view is presented, and the methodology used in this work is shown in
Section 3.
Section 4 consists of data and empirical results, while the discussion and conclusion of the study are presented in
Section 5 and
Section 6, respectively.
2. Literature Review
Since the autoregressive conditional heteroscedasticity (ARCH) model was first introduced in Engle’s seminal paper in 1982, there has been much interest in modeling volatility in financial time series. The ARCH model has since been the subject of several extensions and modifications [
28]. Univariate and multivariate models have been significantly extended and modified in the literature. Understanding the co-movements of financial returns is crucial from a practical standpoint, even though modeling the volatility of the returns has received the majority of attention [
28]. Therefore, many studies have been conducted to model time-varying volatility and correlation among stock market returns between stock market returns and commodities such as the international oil market and between sectors of stock markets as well. In the following, several studies that utilized univariate and multivariate models for investigating volatility and correlation between stock markets, between stock market sectors, and between stock markets and other markets are reported. In univariate modeling, Ref. [
29] used univariate and bivariate GARCH models to examine volatility among the Central and Eastern European (CEE) stock markets and their correlation with developed markets. According to the results of the univariate approach, the persistence of the GARCH effect exists. The results of the bivariate approach present that the CEE stock markets correlated with emerging markets rather than developed ones. The author stated that conditional correlation is considered, and constant conditional correlation is rejected. The author concluded that the conditional correlation among the CEE stock markets is time-varying and reaches its significantly high value during the crisis period. Symmetric and asymmetric univariate volatility models were employed by [
30] to explore volatility in the Indian stock market, specifically the S&P CNX Nifty Index. Based on the Akaike Information Criterion (AIC) and Schwarz Information Criterion (SIC), their findings indicate that the GARCH(1,1) model is the most suitable for capturing symmetric volatility in the data, while the TGARCH(1,1) model excels in handling asymmetry.
In multivariate modeling for investigating volatility and correlation between stock market returns, Ref. [
31] used the DCC-GARCH model as the best model among four models based on the residual error diagnostic test for modeling dynamic conditional correlations and volatility spillovers between Chinese and five Southeast Asian stock markets. The authors used the DCC-GARCH model in building hedge ratios and portfolio weights. The results revealed that the Asian financial crisis, the US subprime mortgage crisis, and the stock market crash in 2015 affected the conditional correlation between China and Southeast Asian stock markets. The conditional correlation reached its highest value during the crisis. The co-movement between China and Southeast Asian stock markets was noticed clearly after the CAFTA. Moreover, return and volatility spillovers among eagle stock markets have been examined for 2002–2017 sample period. The sample is split into three periods: pre-crisis, crisis, and post-crisis, and two models are used for evaluating volatility spillover, namely, DCC and BEKK-GARCH models. Besides volatility spillover among eagle stock markets, the effect of developed markets has also been investigated. Based on the results, Ref. [
27] reported a significant and positive spillover effect among the eagle stock markets in pre- and post-crisis periods. Also, the authors stated that the US stock market is the only developed market that has an effect on volatility transmission on most of the eagle stock markets.
Ref. [
32] employed the DCC-EGARCH model, as in [
33], to investigate the correlation between the return volatilities of cryptocurrencies and global stock market indices, focusing on the spillover effects of the COVID-19 pandemic, as well as value-at-risk measurements. The results from these studies show that the conditional volatilities of both asset portfolios increase significantly after positive news and respond well to previous shocks. Consequently, financial assets have low unconditional volatility and minimal risk when there are no external disruptions.
In addition, the Pakistan Stock Exchange (PSX) conditional co-movements and dynamic conditional correlation with other stock markets are examined and evaluated in this study using the DCC-GARCH model. According to [
25], the Pakistani Stock Exchange (PSX) is much more volatile than the two carefully chosen stock markets. The study’s information criteria led to the selection of the DCC-GARCH (1, 1) model for in-sample fitting. In contrast, the criteria such as MAPE and RMSFE used for out-of-sample forecast evaluation resulted in the selection of the DCC (2,1)-GARCH (1,1). And Ref. [
34] investigated the dynamic relationship between the Indian stock market and five emerging Asian stock markets, three developed Asian markets, and the US market. DCC and ADCC models have examined the conditional volatility and correlation between the Indian stock market and the considered markets. The DCC model was the most suitable fit model for the data based on the value of the BIC. The results showed different levels of conditional correlation between the Indian stock market and the selected markets. High diversification chances exist for Indian investors in Malaysian, Chinese, and Japanese stock markets, and fewer opportunities exist in other markets.
For modeling volatility and correlation between stock markets and commodities, three types of DCC-GARCH models are used to investigate the relationship and volatility between Brent crude oil returns and stock market returns in India at both aggregate (BSE-SENSEX) and sector levels (seven sectors) for the 2006 to 2015 sample period. Both the symmetric and asymmetric types of the DCC-GARCH model are considered to model the conditional correlation. Ref. [
35] reported that the volatility spillover from the international oil market to the Indian stock market (aggregate level) is insignificant. In comparison, it is significant at the sector level. The authors also stated that the volatility shocks persist among the studied sectors, and the time-varying correlation of BSE-SENSEX and different sectors with Brent crude oil fluctuates during the study period affected by GFC in 2008. Additionally, Ref. [
36] used VAR-GARCH, VAR-AGARCH, and DCC-GARCH models to investigate the volatility transmission between oil and stock market returns in Ghana and Nigeria. According to their findings, there is a greater indication of volatility transmission from oil to stocks in Ghana than from stocks to oil. They also determine the ideal weights and hedge ratios for the Ghanaian and Nigerian oil portfolios. According to their findings, hedging works better in Ghana. In examining volatility between stock market sectors, and between commodities, [
37] used symmetric-DCC and asymmetric-DCC multivariate GARCH models to explore the dynamics of returns co-movements between some economic sectors in South Africa, and he found that there are leverage effects in the dynamics of co-movements between the sector pairs. Katzke presented that the ability of investors to diversify across local sectors has declined due to the increased co-movements between the sectors, while [
38] examined the interconnections between agricultural commodity prices and energy prices in South Africa using the Bayesian DCC-MGARCH model with a Markov chain Monte Carlo (MCMC) algorithm for estimating parameters. The model allows for observing the evolution of conditional correlations between pairs of commodities over time. By utilizing the MCMC approach instead of ML, the study extends previous research that demonstrated similar co-movements between agricultural and energy prices. The findings indicated that the correlations between these markets are dynamic and time-varying.
In the above review, co-movement and integration between different types of markets—emerging and developed—and different sectors of a market are covered. Also, the effect of the international oil market on the stock markets is examined by various GARCH models. Therefore, the GARCH model and its extensions—univariate and multivariate—are useful and important in modeling conditional volatility and correlation among assets.
To the best of our knowledge, few studies in the literature have utilized both symmetric and asymmetric DCC models for modeling volatility among stock markets. Typically, the standard GARCH model is used as the univariate model for stock markets within the DCC framework. This study employs both symmetric and asymmetric DCC models with the EGARCH model as the univariate model for individual stock markets. Additionally, it considers two different multivariate distributions: multivariate Student’s t and multivariate Laplace. This approach distinguishes the study from existing research by providing a more comprehensive analysis of dynamic volatility and correlations. Furthermore, it incorporates an African stock market to investigate its co-movement with developed and developing stock markets, highlighting its significance in the international stock market and the potential for investors’ diversification.
4. Results
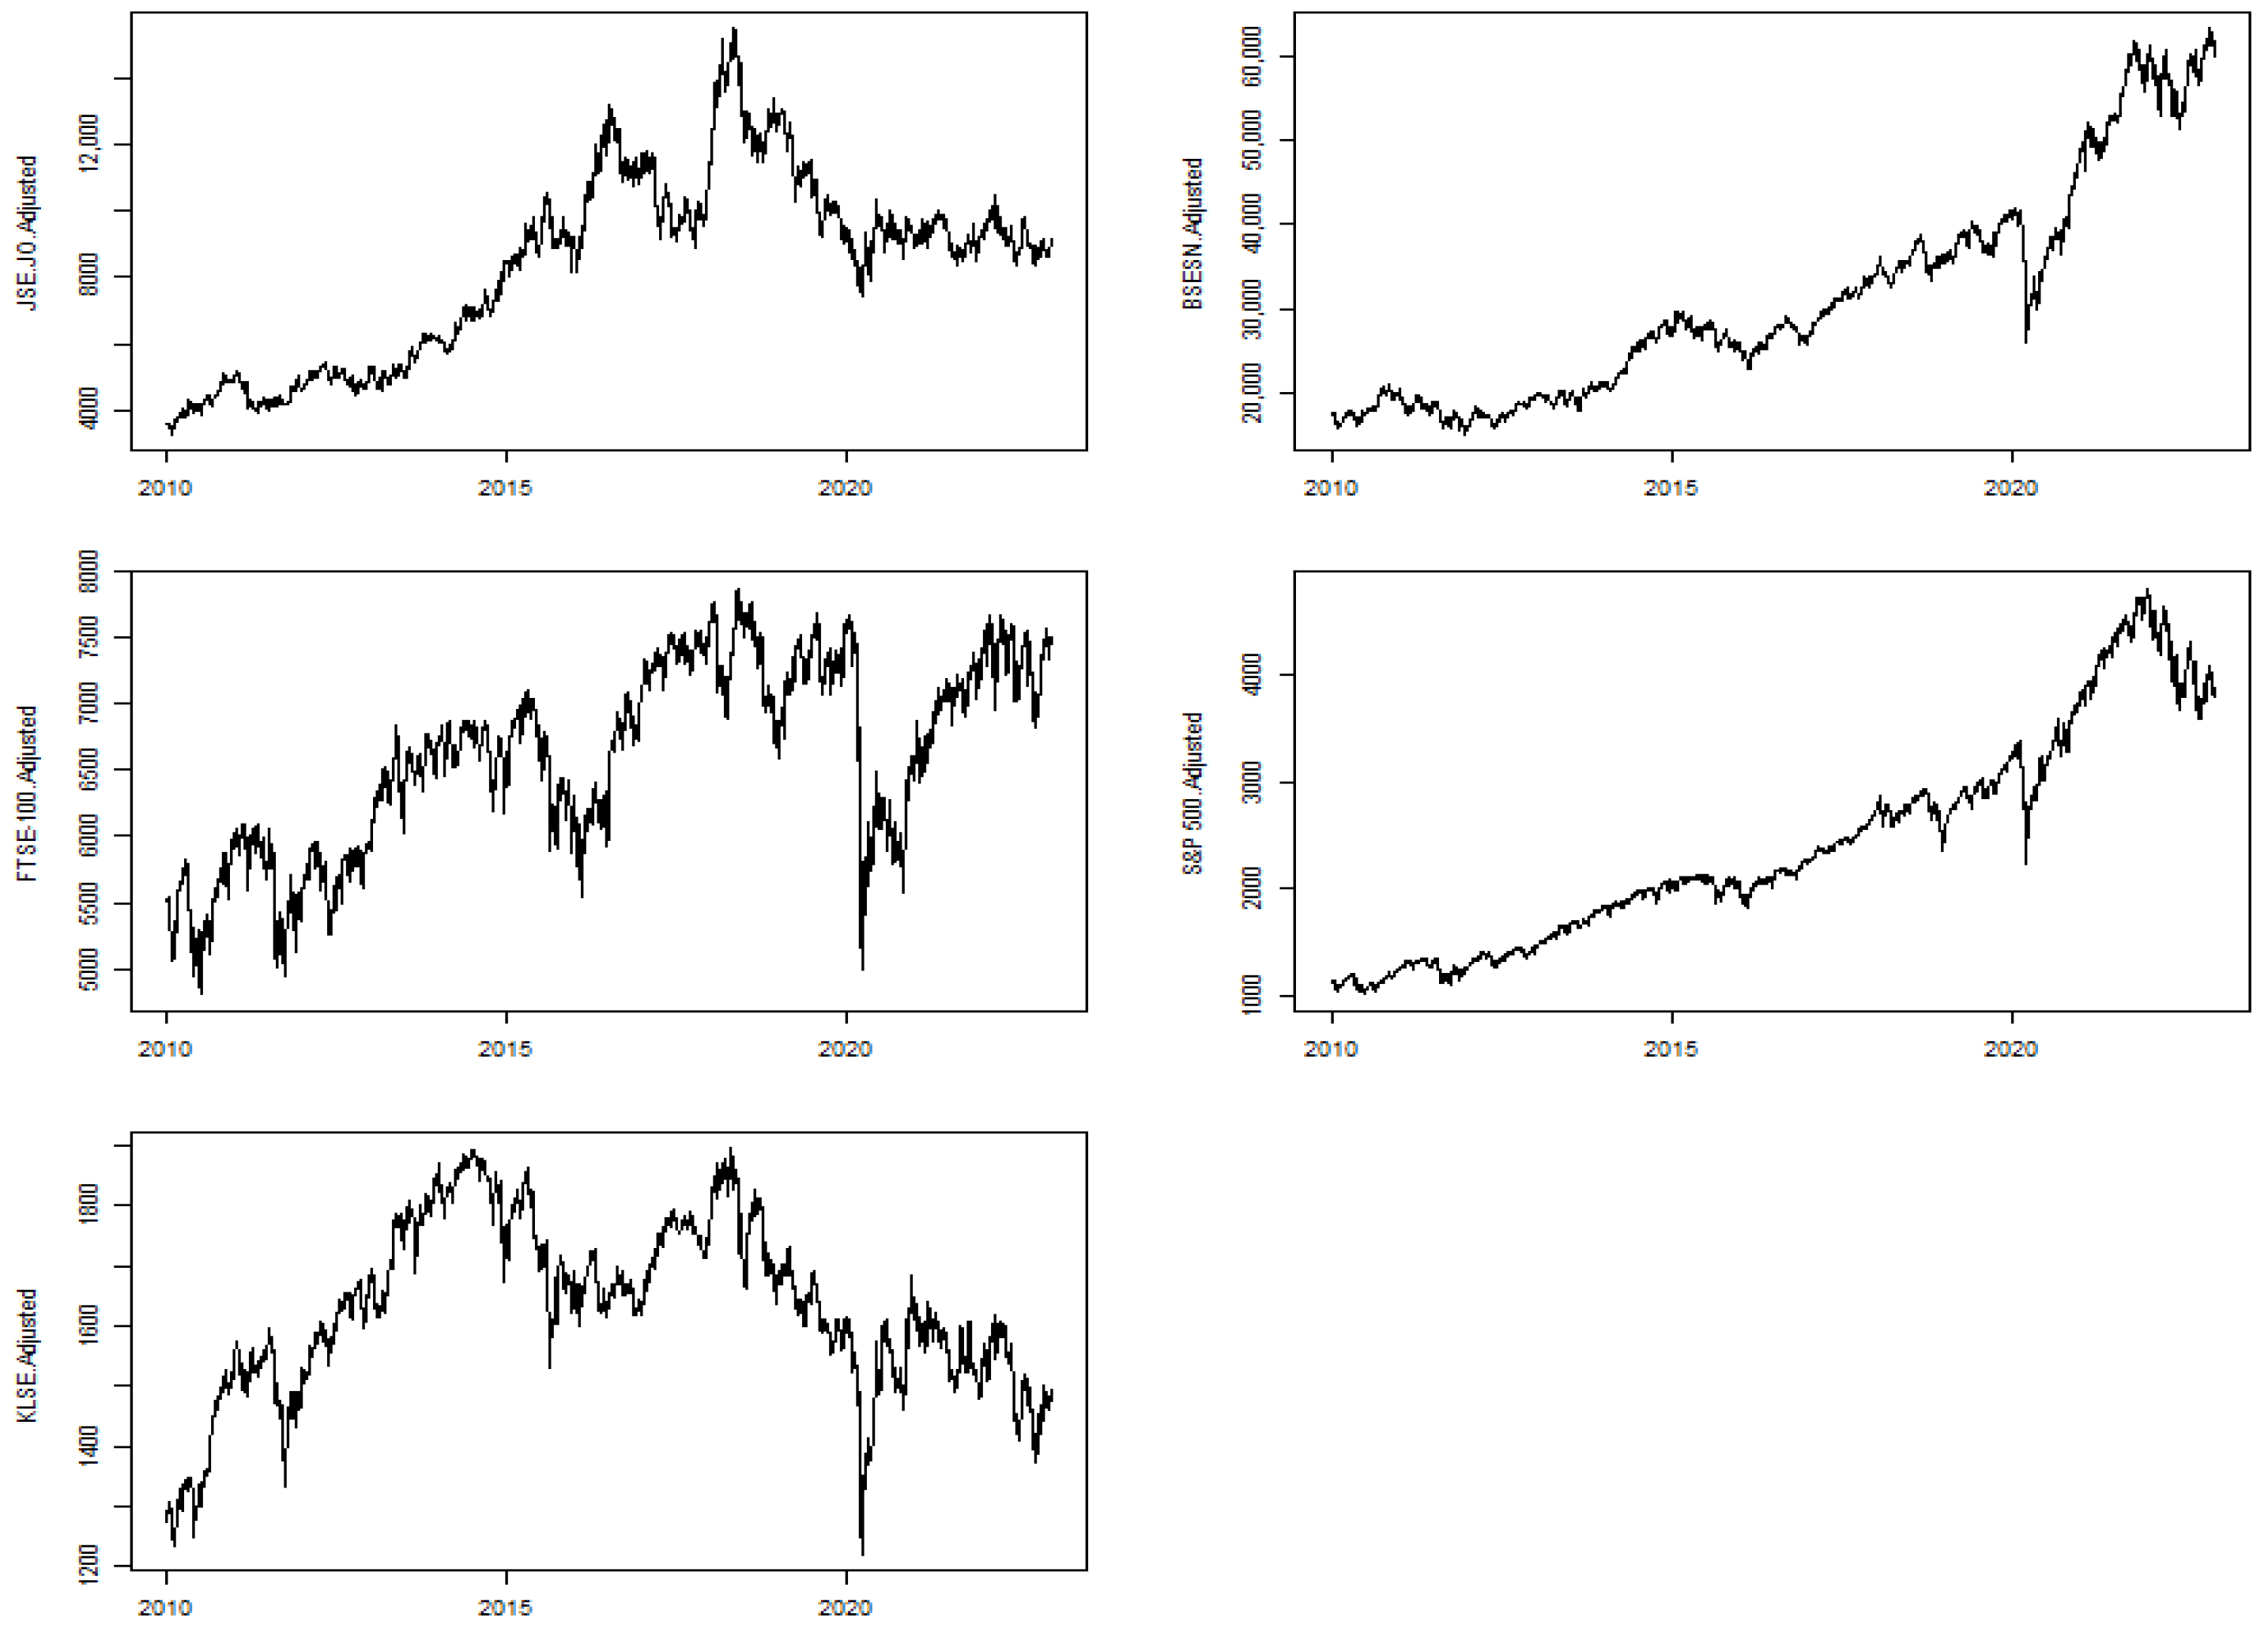
Figure 1 shows the time plot of the adjusted close price series. The trend and fluctuation are the obvious characteristics of these series. A simultaneous decline around 2020 can be noticed in all indexes as a response to the COVID-19 crisis. The stock markets series are not following the same trend because the BSESN (India) and S&P 500 (USA) trend is higher than the other series, indicating low correlation. It is noticeable that the JSE.JO stock market of South Africa descended twice before 2020 in 2017 and 2019, and that is because of the economic recession as
https://www.statssa.gov.za/ (accessed on 13 February 2024) reported.
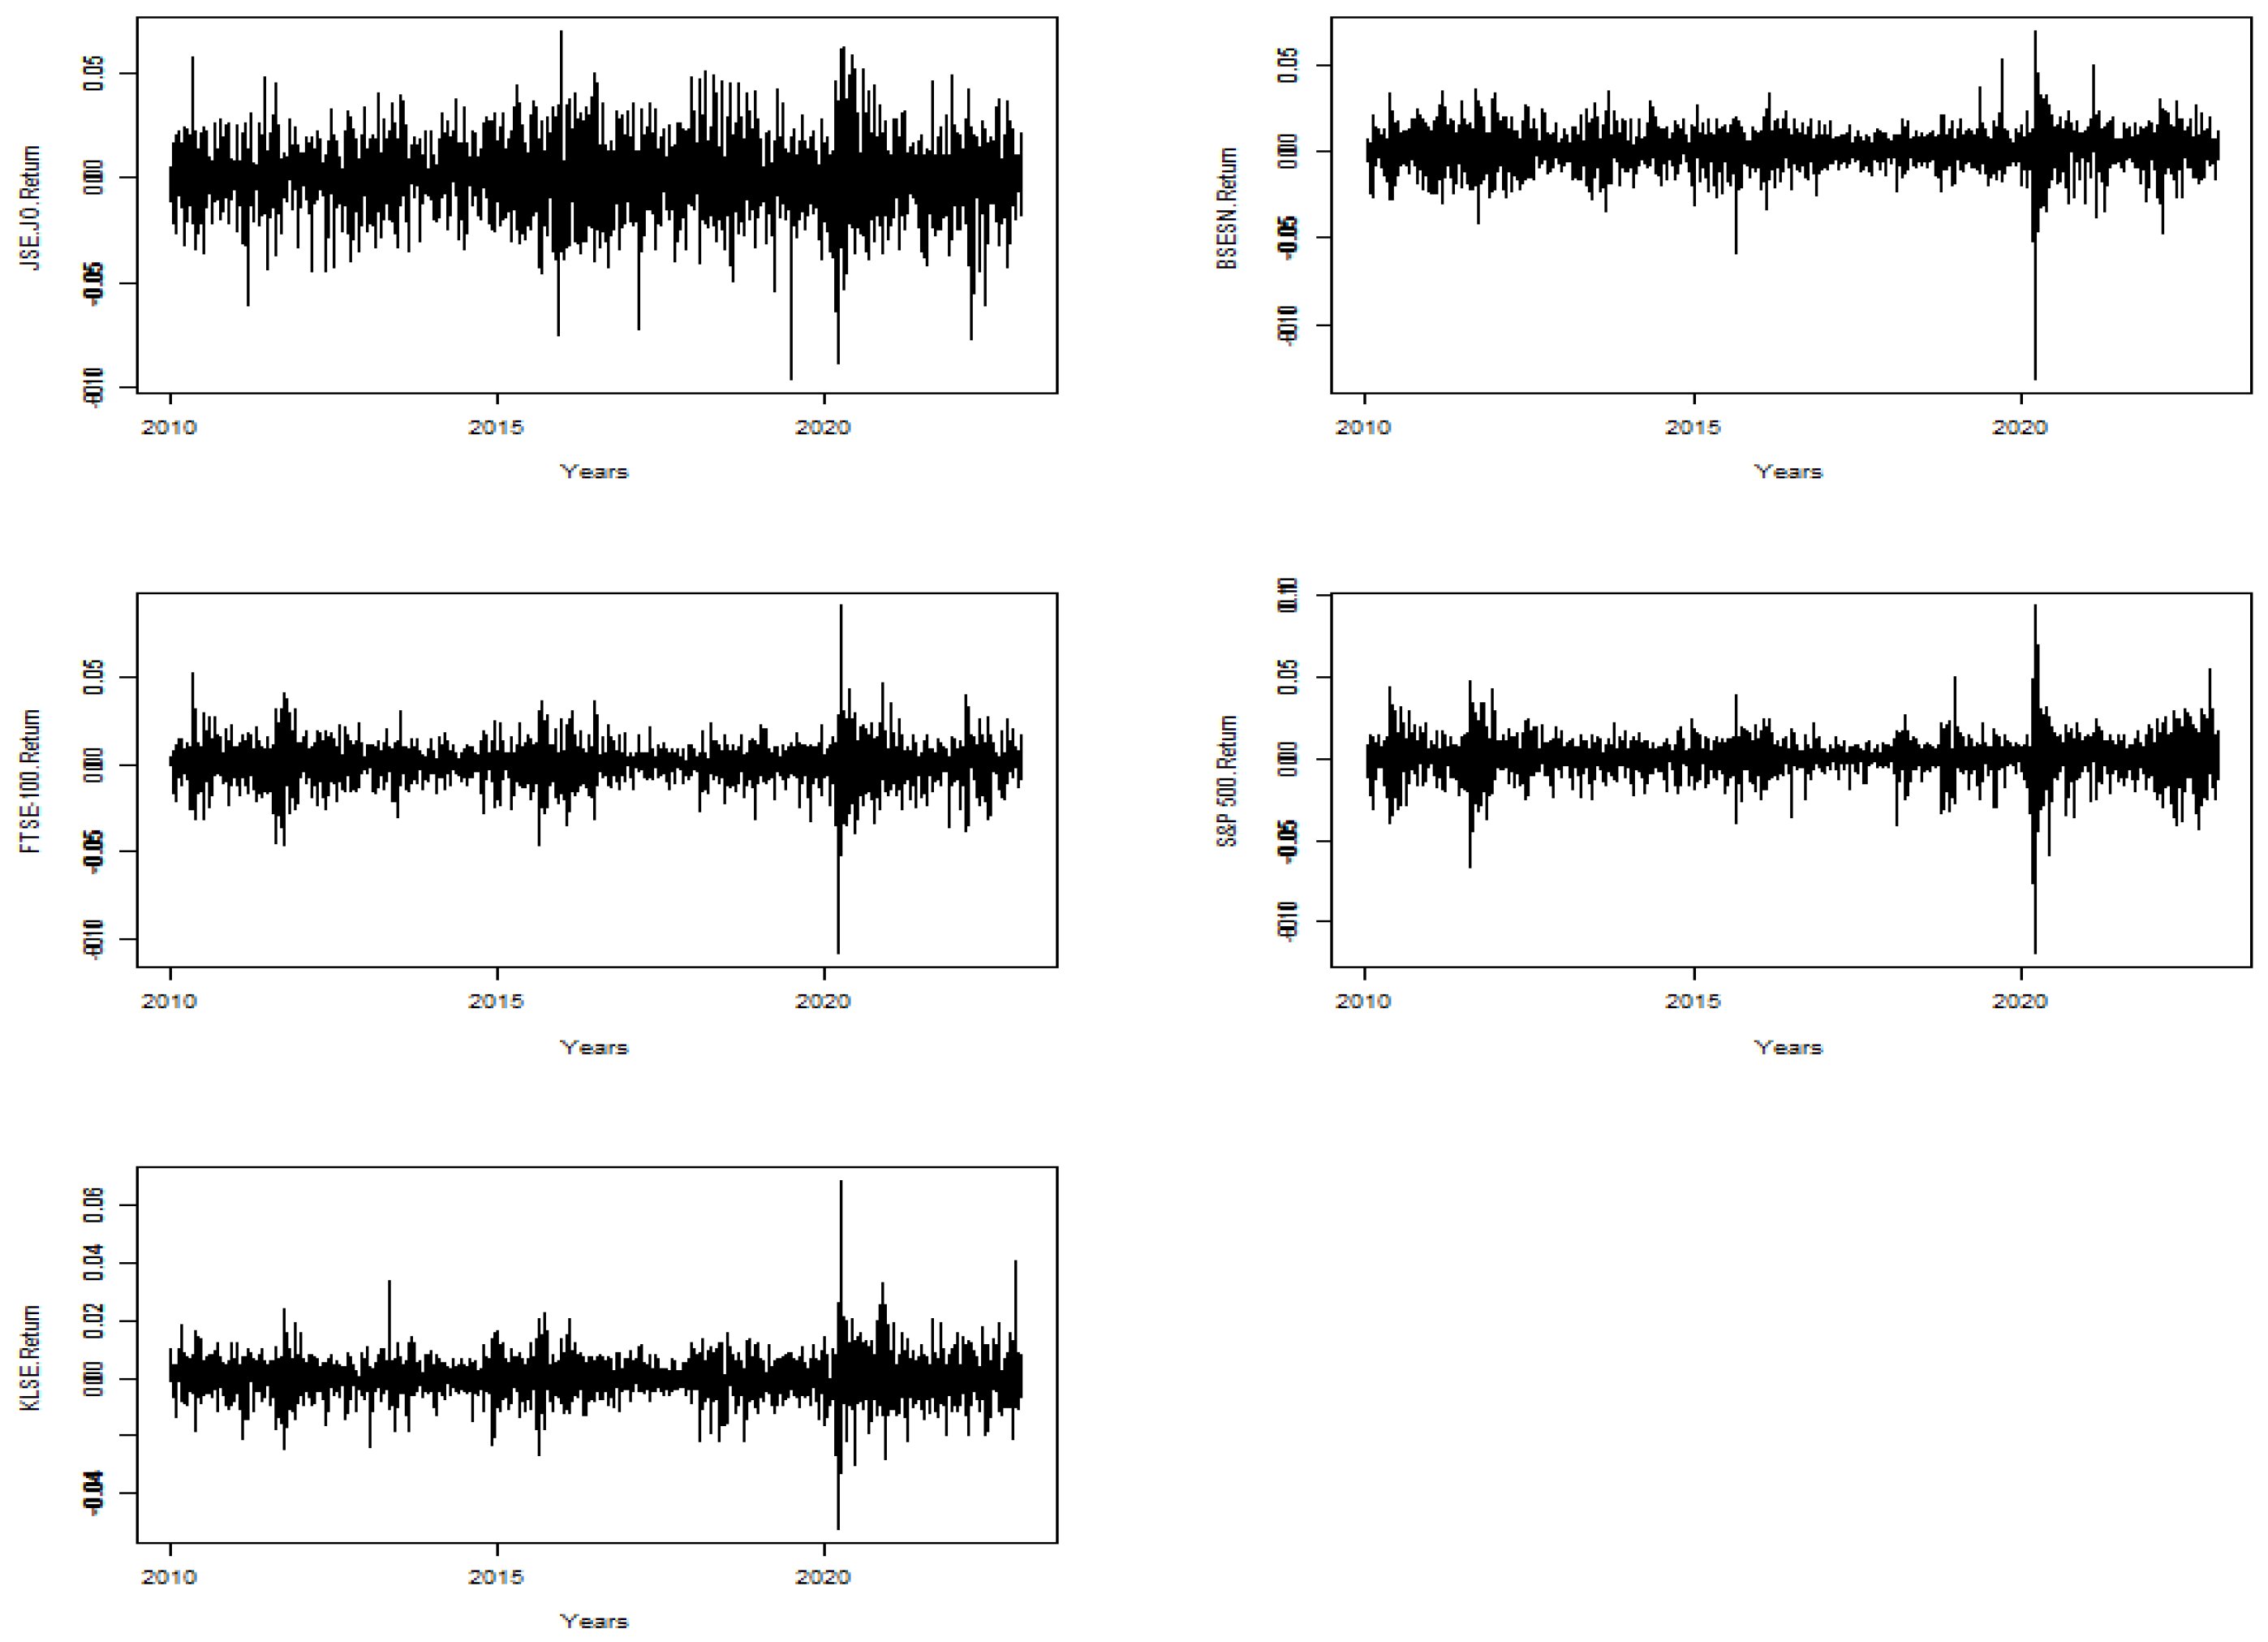
Figure 2 presents the time plot of the log return series. It is clear that the log return series has volatility clusters for some periods and varies within some fixed ranges, which statistically means it is stationary. The volatility clusters are remarkably high around 2020. Thus, the preliminary results indicate that the DCC-GRACH models would suit the series data.
Descriptive statistics and preliminary tests are reported in
Table 1 before diving into volatility analysis. The table shows that the variation between the stock markets is tiny, as does the standard deviation. The skewness values are all negative, and most significantly differ from zero. And that means the distributions of the stock markets are skewed to the left. It is noticeable that the kurtosis values—representing the fatness of the tail of the distribution—are greater than three, which means the stock markets are not normally distributed, and that has been confirmed by the statistic values of the Jarque–Bera test for normality and its
p-values, which are less than 0.05. Based on the summary of descriptive statistics and the normality test, it would be suitable to use a multivariate fat tail distribution for the stock markets in modeling their volatilities and dynamic correlations such as the multivariate Student’s t distribution or Laplace multivariate distribution.
Table 2 shows the correlations between the stock market series. All correlations are positive, which means the stock markets move in the same direction and range between 0.132 and 0.584. The lowest correlation is between the KLSE of Malaysia and S&P 500 of the USA, while the highest is between the FTSE-100 of the UK and S&P 500 of the USA. That means the correlation between developed countries is high, and the correlation between developed markets and emerging markets is low.
The existence of the ARCH effect should be checked before starting modeling. For this purpose, the Lagrange multiplier test, Ljung-Box (portmanteau) test, rank-based test, and robust version of the portmanteau test with 5% upper tail trimming were used. All tests reject the null hypothesis of no serial correlation in each series with
p-values less than 0.05 as the results show in
Table 3, so the ARCH effect exists, and the dynamic conditional correlation (DCC) model can be built to the data.
4.1. DCC-EGARCH Models
Based on the preliminary results, which indicate that the stock market series exhibit non-normal distributions, the Laplace and Student’s t distributions as potential candidates for constructing dynamic conditional correlation (DCC) models are explored. Four DCC-EGARCH models have been constructed: symmetric and asymmetric models using the multivariate Laplace distribution and two additional models using the multivariate Student’s t distribution.
Table 4 presents the number of parameters for each model along with their corresponding values of the AIC and BIC. From the AIC and BIC values, it is evident that the asymmetric DCC-EGARCH model with a multivariate Student’s t distribution possesses the lowest values for both the AIC and BIC while also having the fewest parameters. Furthermore, upon considering the significance of the
and
estimates, along with the log-likelihood values for each model in
Table 5, it is notable that nearly all estimates are statistically significant. Moreover, the asymmetric DCC-EGARCH (MVT) model demonstrates the highest log-likelihood value, which is deemed suitable for the data given the data’s distribution with high kurtosis (heavy-tailed) values.
The estimated coefficients of the asymmetric DCC-EGARCH model are significant, and the significance of the and implies the rejection of the null hypothesis that each parameter is zero. Additionally, the summation of and being less than one () confirms the validity of the DCC model. This suggests that the correlations between the index returns evolve over time, thereby rejecting the constancy of the conditional correlations.
4.2. Unconditional Volatilities and Correlations
The unconditional volatilities are the diagonal elements of the covariance matrix. The values of unconditional volatility for all considered markets are close to 1, which indicates high volatility in returns. These results are different from the findings of [
48] that investigated the correlations between the Turkish stock index returns and the returns of the stock indices of its major trading partners, specifically Egypt, Lebanon, and Oman. The findings have implications for potential diversification benefits for Turkish investors, particularly during periods of global financial crisis and regional political crises. This is line with the results of [
48,
49], which used the multivariate GARCH-DCC model to explore the time-varying linkages between selected conventional and Islamic Asian and international stock index returns with Malaysian stock index returns.
Table 6 reports the estimated values for unconditional volatility ranking, in which the US market shows the highest unconditional volatility. In contrast, the UK market shows the lowest unconditional volatility, which indicates stability in the UK stock market compared to the other stock markets. However, the results do not show any remarkable difference in volatilities between developed and emerging markets since the volatility values are not significantly different.
The unconditional correlations estimated by the t-DCC-EGARCH model are presented in
Table 7. The pairs of unconditional correlation describe the co-movement between the markets. Our focus is on the JSE.JO of South Africa’s correlation with the other markets. The correlation values of the markets are close, and the highest correlation is 0.1785 between the JSE.JO of South Africa and FTSE-100 of the UK, which indicates that changes in FTSE-100 will affect the JSE.JO more than any other market of the considered markets, while the lowest correlation is 0.1278 between the JSE.JO of South Africa and S&P 500 of the USA. The above-mentioned findings differ significantly from [
49], which reported ranges of unconditional correlation between 0.379 and 0.799 for the selected conventional indices and 0.376 to 0.770 for the Islamic indices. In general, the low level of correlation is a good indication for portfolio diversification.
4.3. Conditional Volatility and Correlation Plots
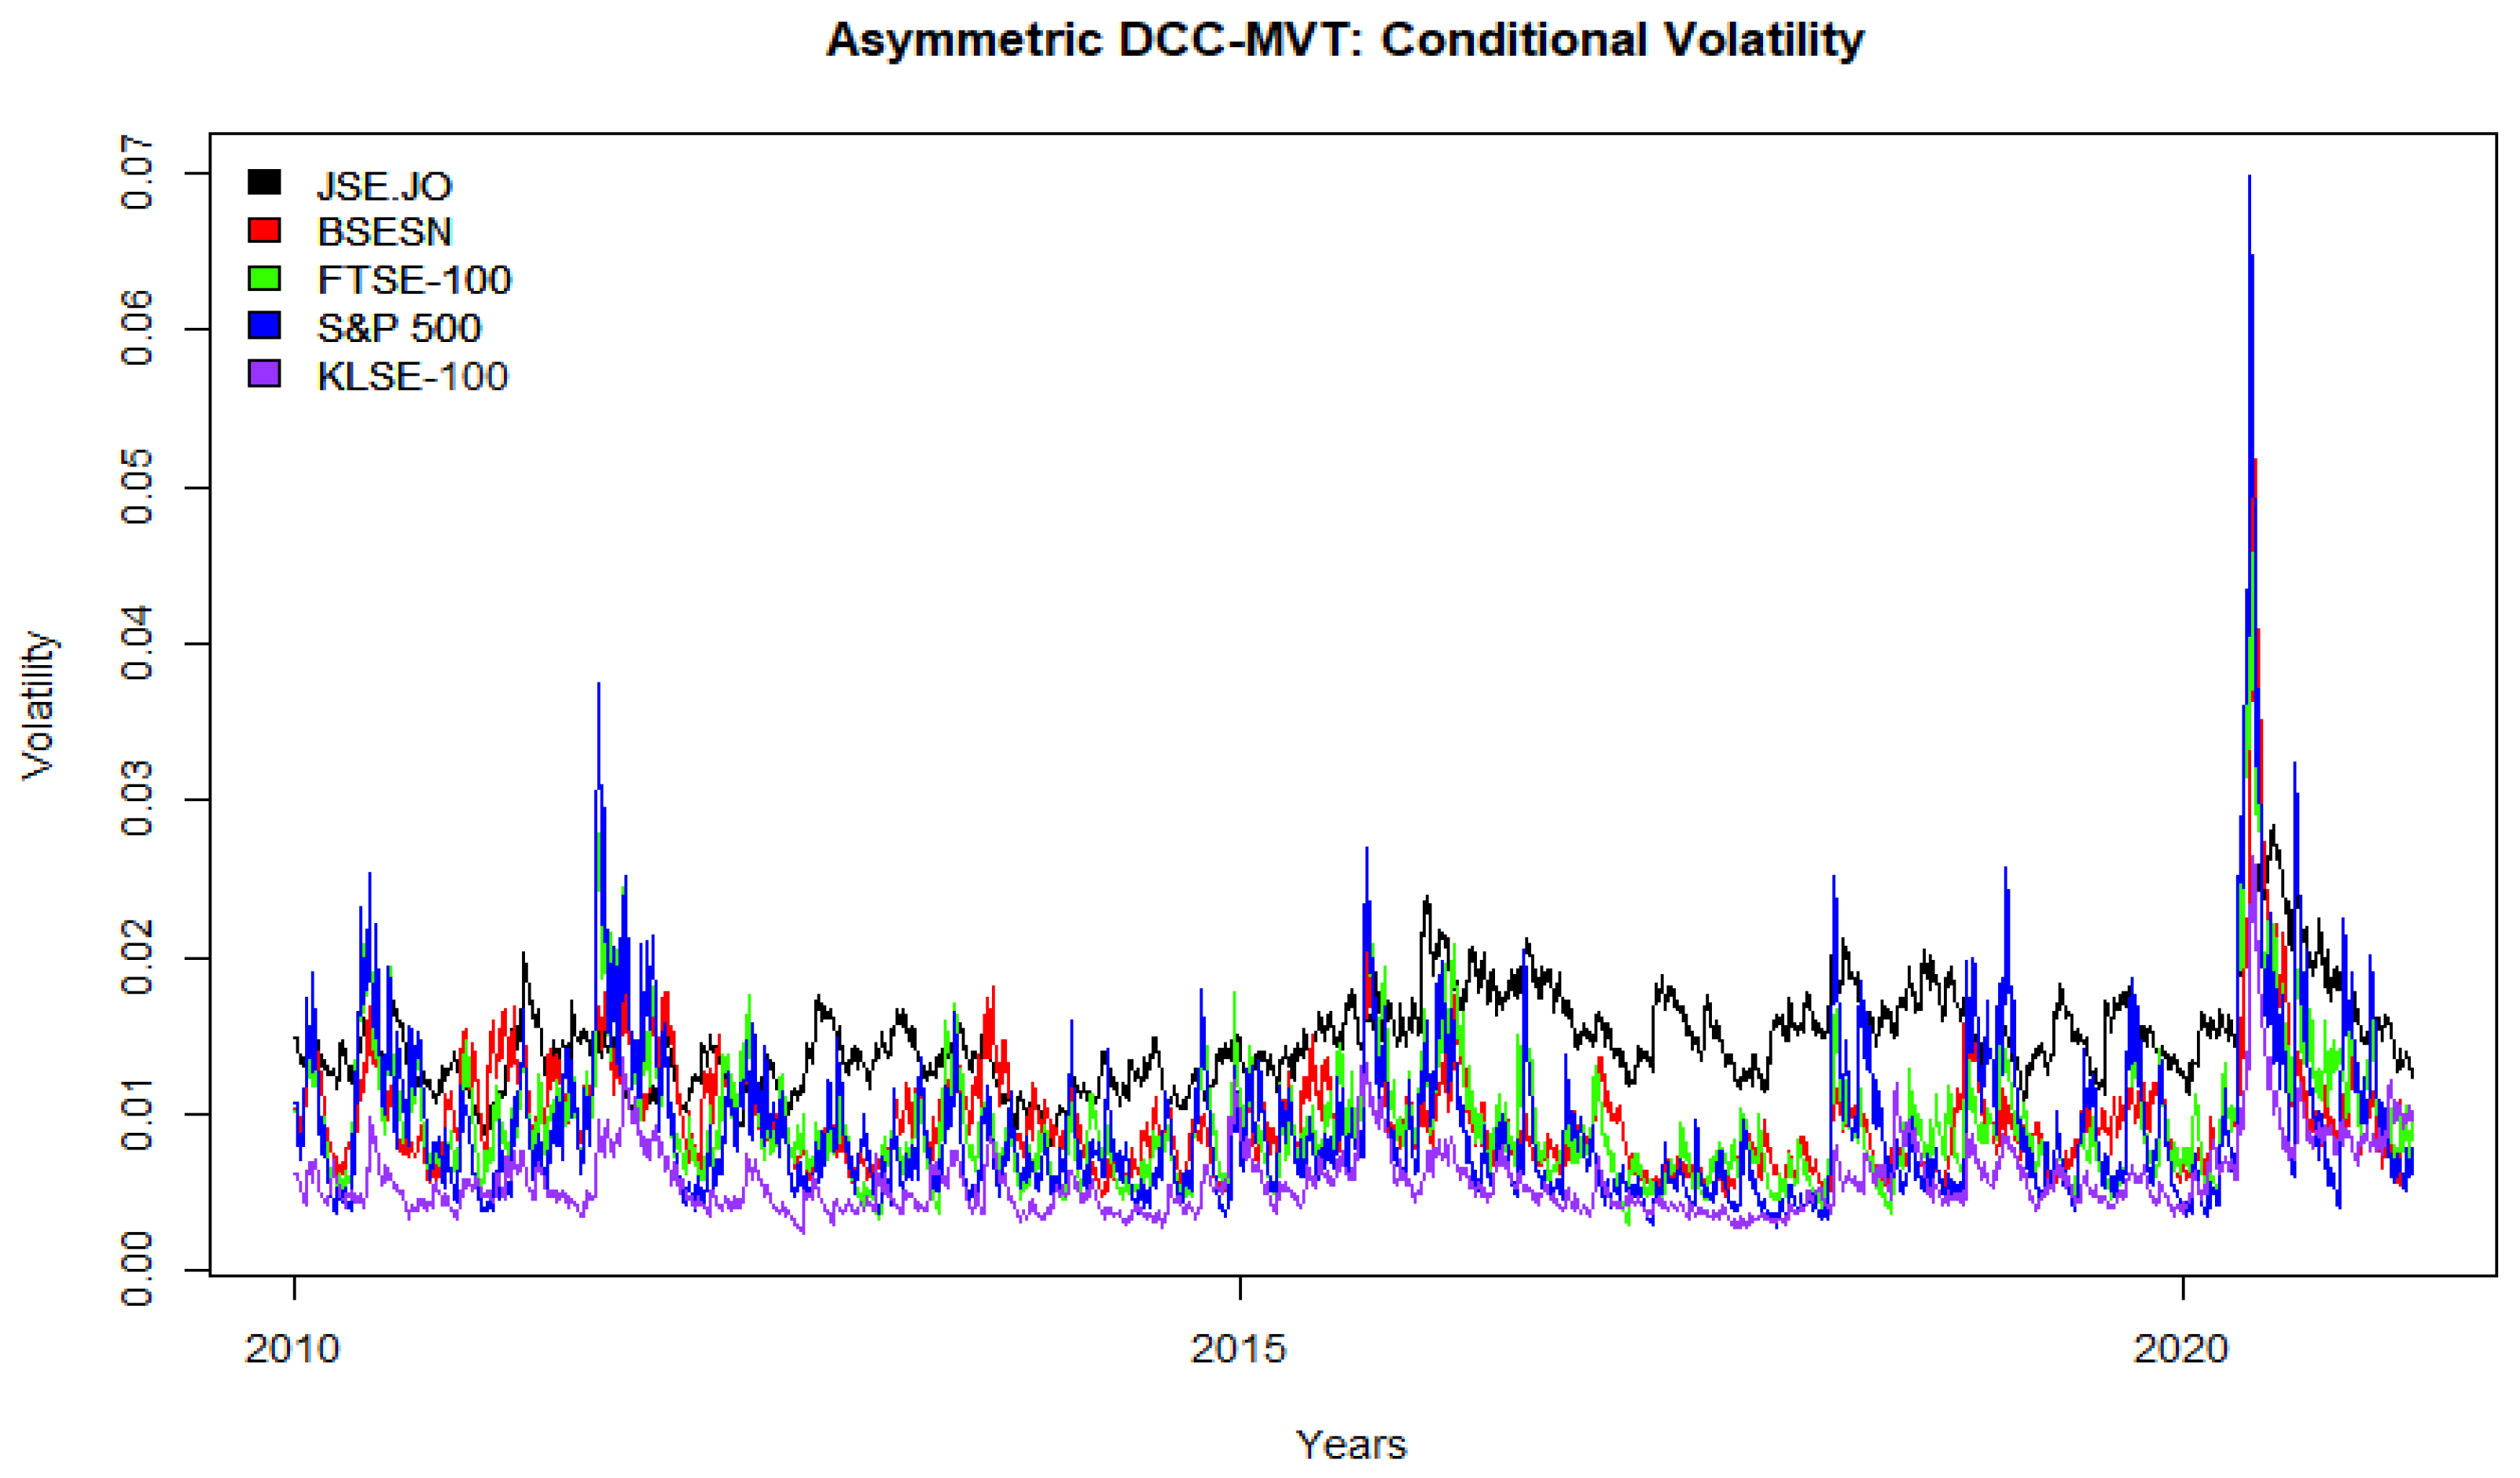
Figure 3 exhibits the volatility values for the JSE.JO and its partners. The plotted values show that volatility evolves with time, and all markets present close movement most of the time, except for the JSE.JO of South Africa, which behaves slightly differently from the other markets, especially after 2015. Thus, this behavior indicates a positive sign for investors to diversify between the JSE.JO stock market and its partners.
Consistent with [
32,
33,
44,
50], the volatility values reached their highest point in 2020 during COVID-19, which means that the crisis affected stock markets by making them move together more than in any other period. For more details about the COVID-19 effects on different financial aspects for individuals, firms, enterprises, countries, and financial markets, the reader is recommended to review [
32,
50,
51] and the references therein. This result agrees with the findings of many studies [
21,
22,
29,
31,
52,
53,
54] and confirms the assertion that stock markets tend to close during downturn periods (crises) rather than during stable periods. The markets are more integrated and move closely together in 2020, reducing the benefits of diversification. The risk of investing increased due to the closest movement of the markets.
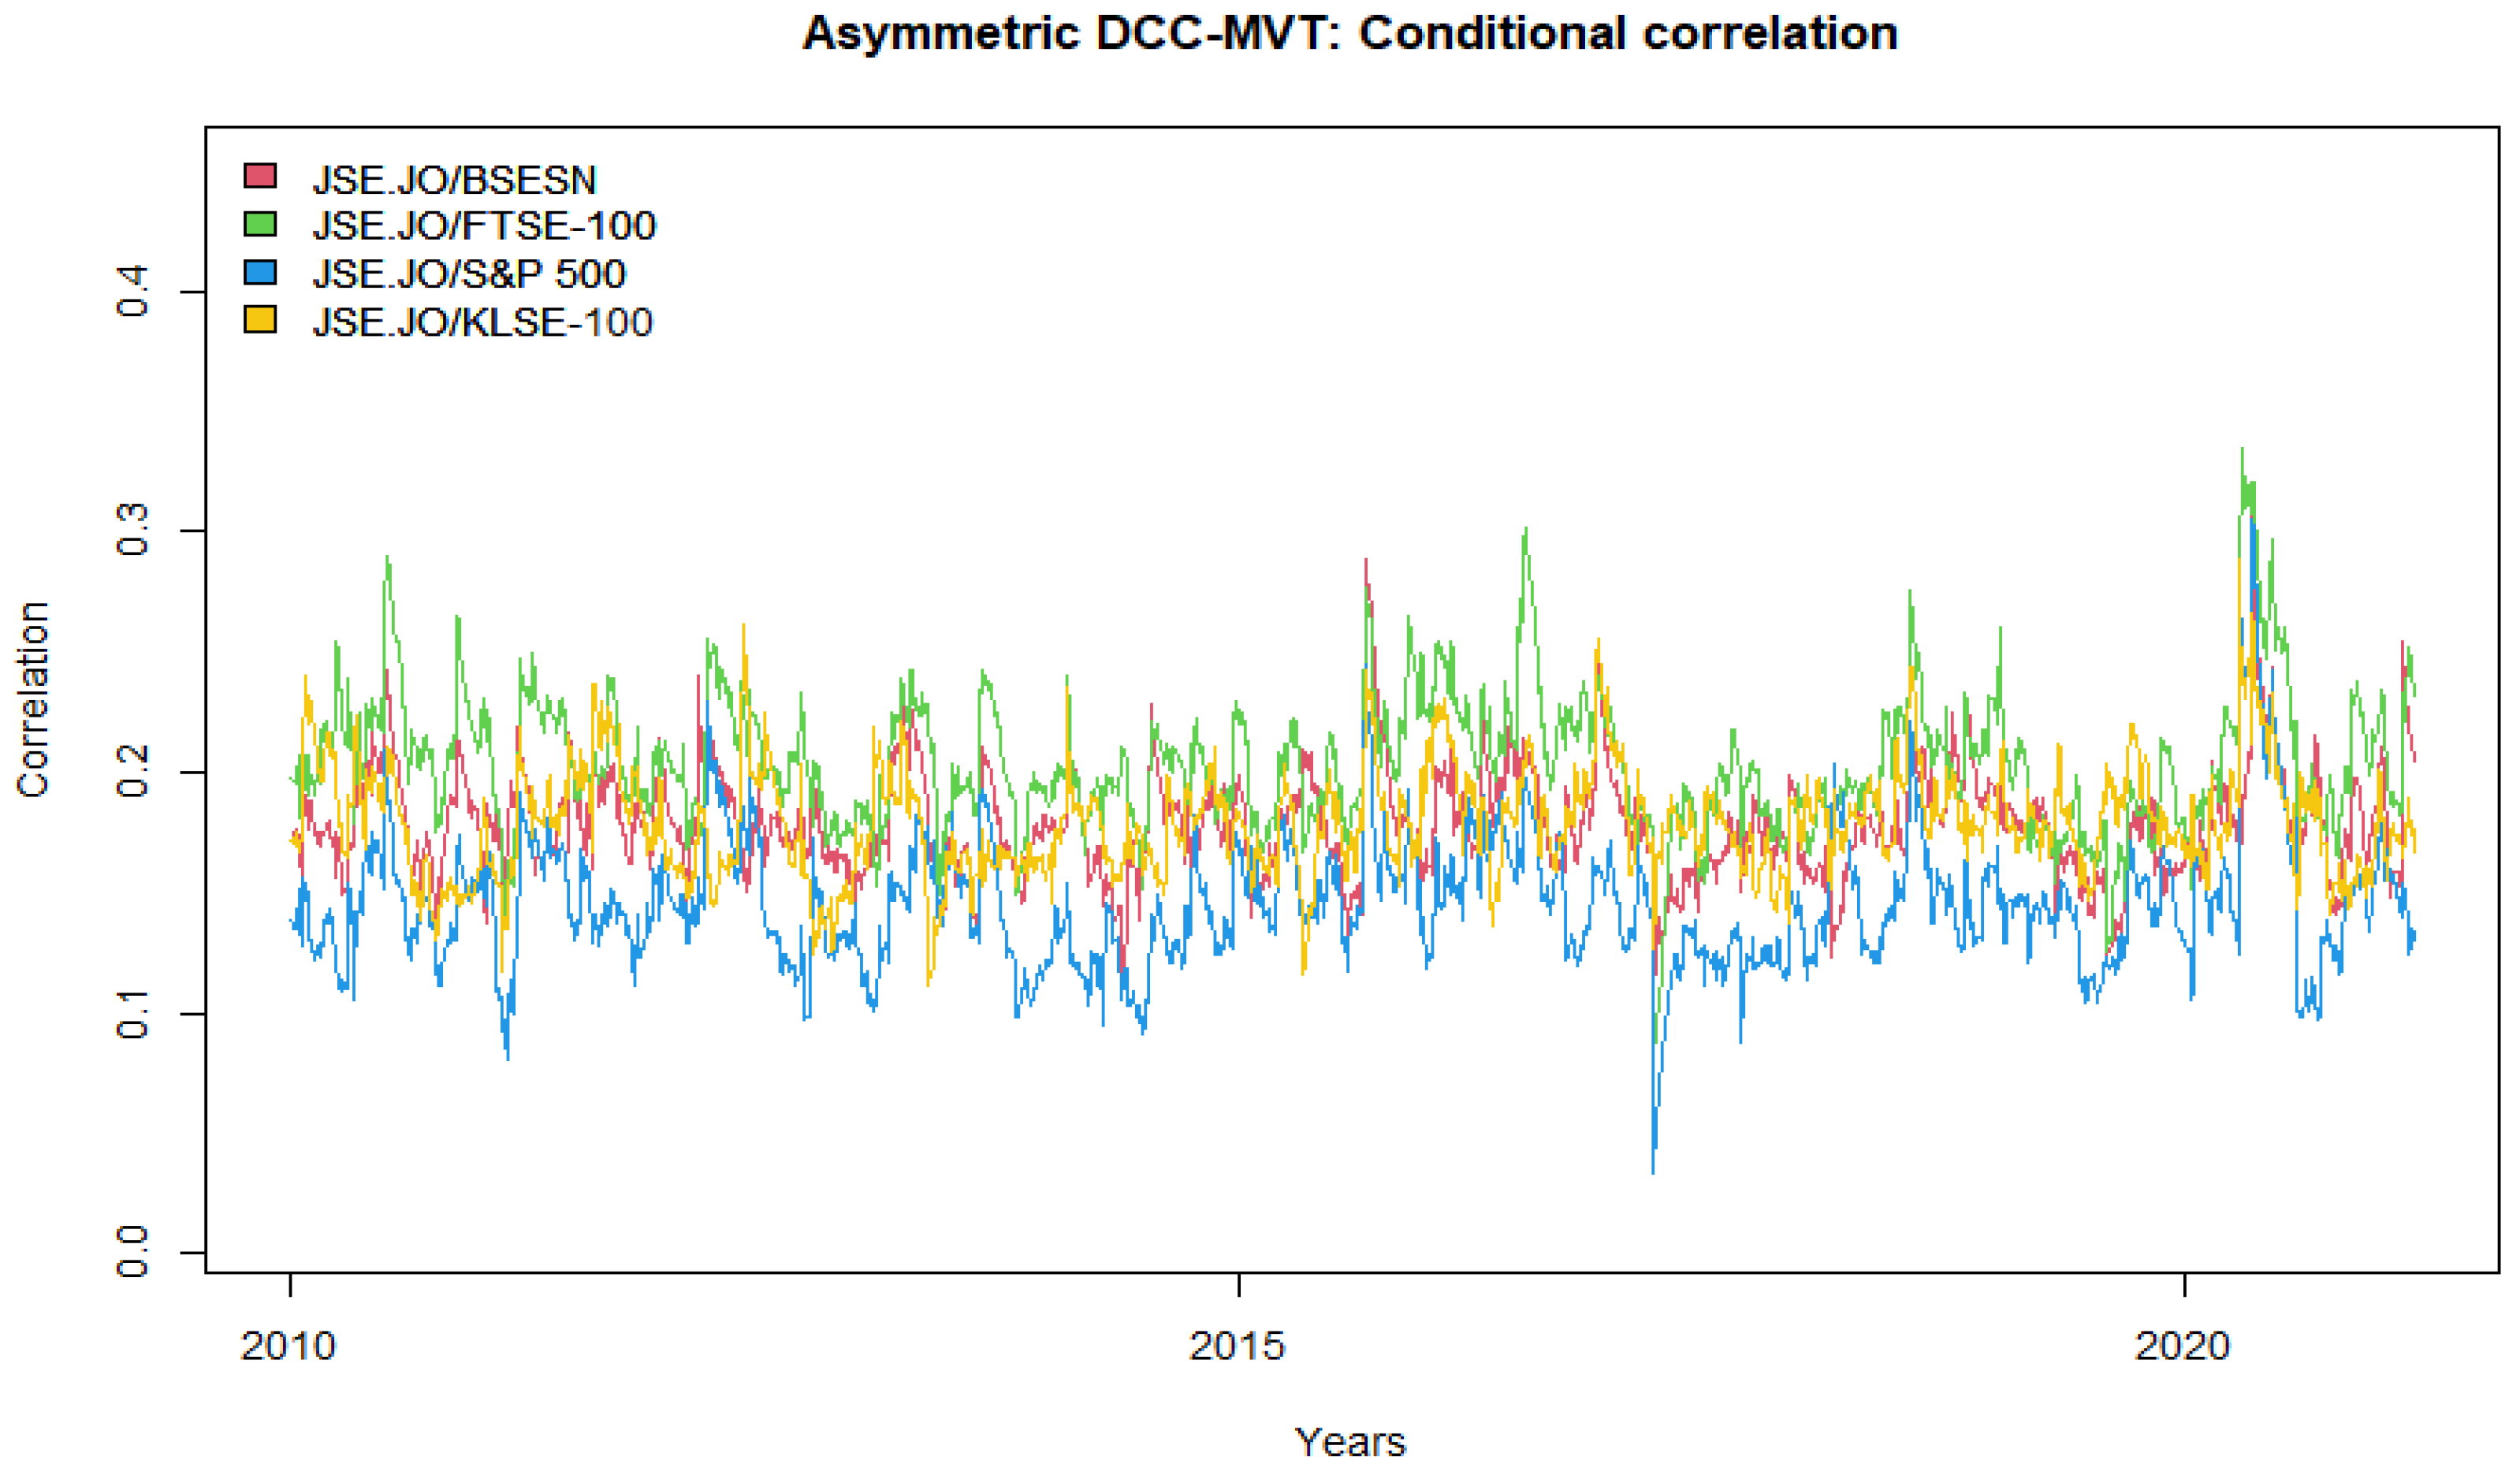
The conditional correlations between the JSE.JO of South Africa and its considered stock market partners are presented in
Figure 4, and their values are positive, similar to the unconditional correlation values. Moreover, the correlations indicate the co-movement of the stock markets. The highest conditional correlation values are between the JSE.JO of South Africa and FTSE-100 of the UK, showing higher co-movement and fewer opportunities for diversification. On the other hand, the lowest conditional correlation values are between the JSE.JO and S&P 500 of the US, and this result is inconsistent with [
33] in terms of high correlation between US stock markets and emerging markets, indicating low co-movement and high opportunities for diversification between developed stock markets and emerging markets as the findings of [
24] reported.
4.4. Asymmetric DCC-EGARCH (MVT) Forecasts
The asymmetric DCC-EGARCH model was employed for forecasting 509 days.
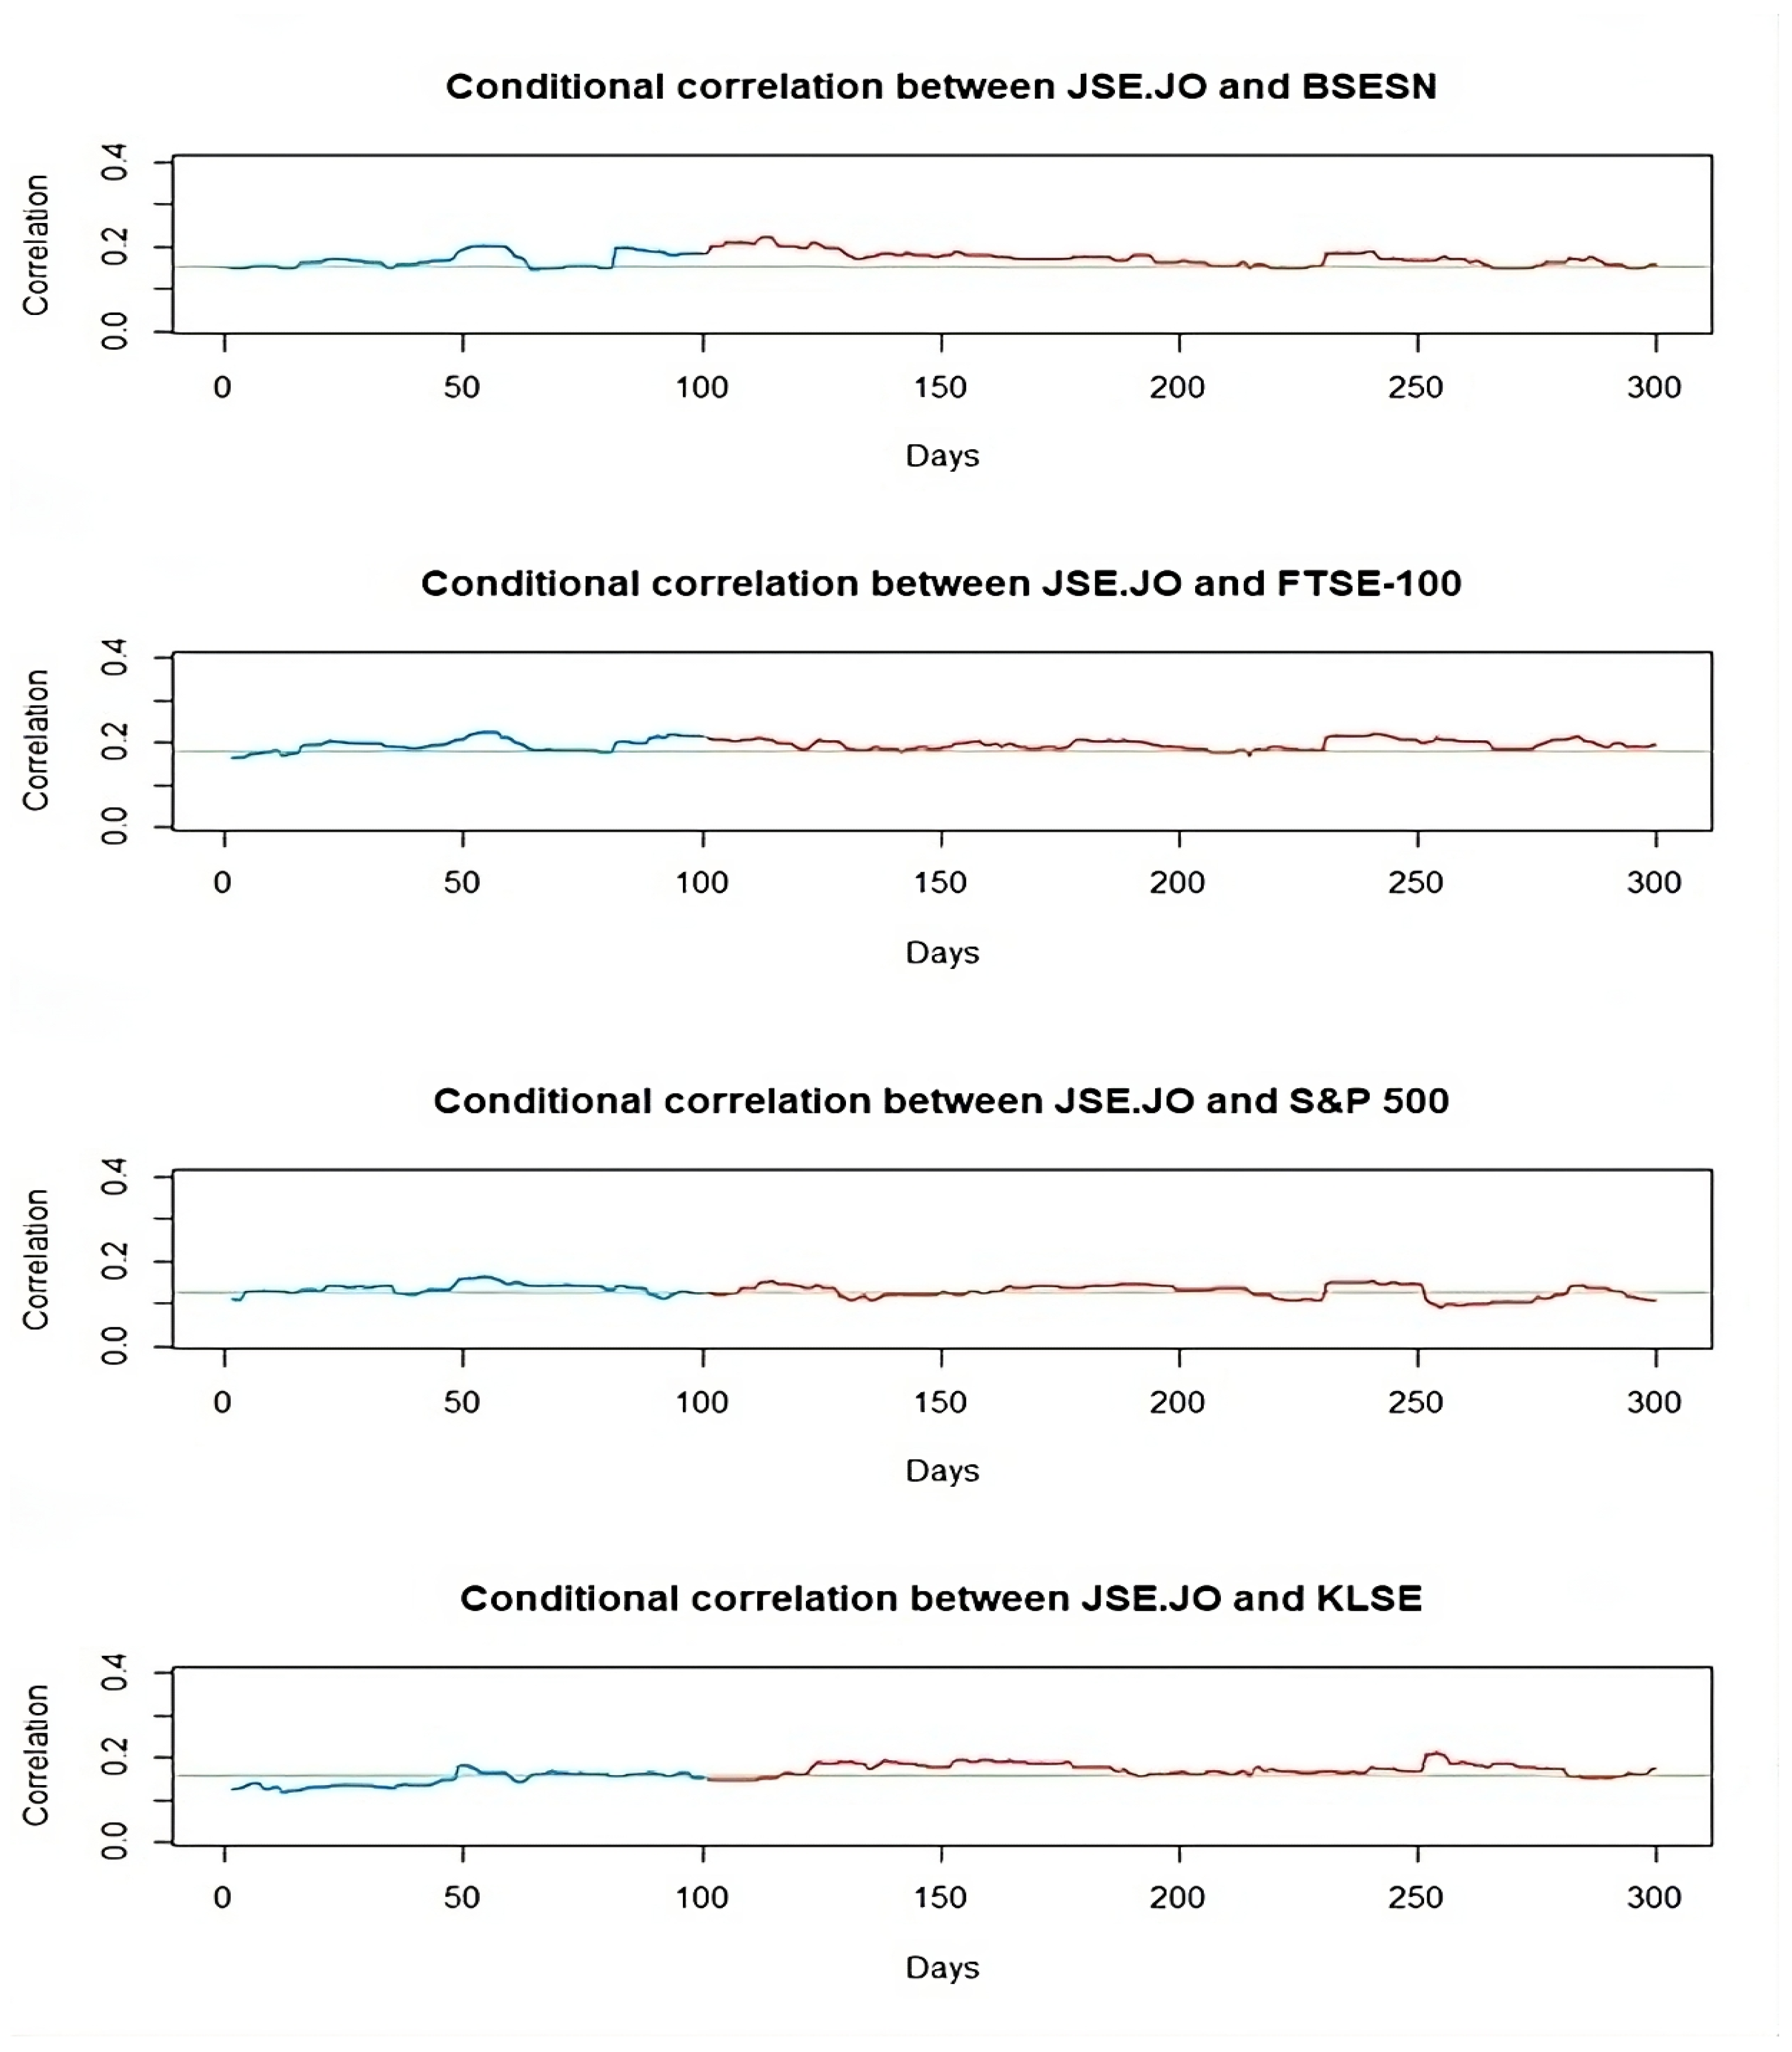
Figure 5 exhibits the fitted and forecasted conditional correlation between the JSE.JO of South Africa and its respective partners. In this figure, the green line represents the estimated unconditional correlation, the blue line represents the conditional correlation fitted by the model, and the red line represents the conditional correlation forecasted by the model.
It is evident from the plots that the fitted and forecasted correlations fluctuate around the unconditional correlation. Additionally, the conditional correlation forecast mirrors the movement of the fitted correlation and appears to converge to the unconditional correlation over the long term.
5. Discussion
The examination of volatility values for the JSE.JO and its developed and emerging partner markets indicate changing patterns over time. The JSE.JO market in South Africa exhibited marginally distinct behavior, especially after 2015. This implies that investors have a good chance to diversify their holdings outside of the JSE.JO stock market and its partners. During the COVID-19 crisis in 2020, the volatility peaked, indicating a reduction in the benefits of diversification and an increase in market integration. The conditional correlations also show significant co-movement among stock markets, and their higher values indicate fewer opportunities for diversification.
Generally, the conditional correlations between the JSE.JO stock market and its partners are low, less than 0.5, offering promising opportunities for investors to diversify between developed and developing stock markets. This is consistent with the findings of [
24], which highlight the pivotal role of switching between different investment regimes for effective portfolio diversification.
The analysis underscores substantial volatility and correlations among global markets, emphasizing the need for understanding market dynamics for effective diversification, particularly during crises like COVID-19. The asymmetric DCC-EGARCH model proves robust in capturing these complex relationships, providing valuable insights for investors and researchers alike.
6. Conclusions
The DCC model stands out as one of the premier models for capturing dynamic volatility and correlation among financial assets and stock market returns across various domestic and international markets. The model’s capture of conditional correlations provides valuable insights for investors, signaling opportunities for diversification across markets and aiding in risk management when constructing portfolios. Additionally, volatility insights aid in steering clear of investments during periods of crisis.
Based on the findings, investors should leverage low correlations between specific markets, such as the JSE.JO and S&P 500, to diversify their portfolios and lighten risk. In addition to that, they should prepare for increased market synchronization during global crises, which can reduce the benefits of diversification, while policymakers should focus on enhancing market stability through effective regulations and coordinated international responses during crises, as well as ensuring transparency and timely information to help investors navigate volatile periods.
More detailed studies are needed to examine the impact of the COVID-19 pandemic on stock markets. This can be achieved by incorporating COVID-19 as a dummy variable and/or dividing the study period into three phases: pre-crisis, crisis, and post-crisis. For enhanced accuracy, it is preferable to customize a GARCH-type model for each stock market return, rather than assuming a uniform GARCH model for all stock market returns, before integrating them through the DCC model.
