Article

Sensitivity Analysis of Start Point of Extreme Daily Rainfall Using CRHUDA and Stochastic Models

by
Martin Muñoz-Mandujano
1,
Alfonso Gutierrez-Lopez
2,*,
Jose Alfredo Acuña-Garcia
1,*,
Mauricio Arturo Ibarra-Corona
1,
Isaac Carpintero Aguilar
3 and
José Alejandro Vargas-Diaz
1
1
Facultad de Informatica, Autonomous University of Queretaro Juriquilla, Queretaro 76230, Mexico
2
Water Research Center, International Flood Initiative, Latin-American and the Caribbean Region (IFI-LAC), Intergovernmental Hydrological Programme (IHP), Autonomous University of Queretaro, Queretaro 76010, Mexico
3
Facultad de Ingenieria, Ingenieria Civil, Autonomous University of Queretaro Centro Universitario, Queretaro 76010, Mexico
*
Authors to whom correspondence should be addressed.
Stats 2024, 7(1), 160-171; https://doi.org/10.3390/stats7010010
Submission received: 17 December 2023 / Revised: 25 January 2024 / Accepted: 4 February 2024 / Published: 8 February 2024
(This article belongs to the Section Applied Stochastic Models)

Abstract

:
Forecasting extreme precipitation is one of the basic actions of warning systems in Latin America and the Caribbean (LAC). With thousands of economic losses and severe damage caused by floods in urban areas, hydrometeorological monitoring is a priority in most countries in the LAC region. The monitoring of convective precipitation, cold fronts, and hurricane tracks are the most demanded technological developments for early warning systems in the region. However, predicting and forecasting the onset time of extreme precipitation is a subject of life-saving scientific research. Developed in 2019, the CRHUDA (Crossing HUmidity, Dew point, and Atmospheric pressure) model provides insight into the onset of precipitation from the Clausius–Clapeyron relationship. With access to a historical database of more than 600 storms, the CRHUDA model provides a prediction with a precision of six to eight hours in advance of storm onset. However, the calibration is complex given the addition of ARMA(p,q)-type models for real-time forecasting. This paper presents the calibration of the joint CRHUDA+ARMA(p,q) model. It is concluded that CRHUDA is significantly more suitable and relevant for the forecast of precipitation and a possible future development for an early warning system (EWS).

1. Introduction

Extreme hydrometeorological events represent one of the most important hazards in the countries of Latin America and the Caribbean (LAC). At least three countries in this region have coasts on the Pacific and Atlantic oceans. Mexico, principally due to its orographic characteristics and its geographical position in the Intertropical-zone; make it annually vulnerable to the tracks of tropical cyclones and severe storms of convective origin. [1,2]. Heavy rainfall triggers severe floods, which in turned cause economic losses, damage to infrastructure, social impacts, and health hurt to the population [3]. The implementation of early warning systems, for both floods and extreme precipitation, is one of the ways to reduce the effect of flood damage in the LAC region. However, the technological development used in warning systems in developed countries is far from being applied in LAC lands. Although techniques like neural networks, fuzzy logic, and artificial intelligence have been applied to develop learning algorithms based on the monitoring of climatological variables, the prediction of extreme phenomena is complex [4,5].
Forecasting models allow warning, in the most favorable case, hours in advance. However, it is thoroughly distinguished that phenomena as dynamic as convective cells of extraordinary intensity, such as vertically developed cumulus nimbus, are difficult to predict [6,7]. Recently, the need to incorporate combined models for the spatio-temporal analysis of extreme events associated with early warning systems has been highlighted. The cartography of extreme events is solved with the appropriate selection of anisotropy functions, for example the CH-Glo estimator proposed by Gutierrez-Lopez [8]. Coupling and calibrating warning systems with complex temporal mathematical frameworks is even more difficult.
In the temporal approach, the connection to the warning systems is even more difficult. One of the most often used tools for this goal represent positively the application of stochastic models of the ARMA(p,q) autoregressive type [9,10]. Used in the modeling of most of the processes of the hydrological cycle, these models are adapted to worries related to the representation of groundwater flow as well as to problems involved in the rainfall and runoff regime of a region [11]. The usefulness of these models makes it possible to analyze the incidence of extreme events, uncertainties, potential climatic changes, and strategies to determine even the policies for the operation of hydraulic infrastructure [12,13].
At present, the study of rainfall–runoff processes developed for several climate scenarios can be explored with autoregressive models [14]. Even anomalies due to climate change are studied with ARMA models [15]. A framework that integrates the climatological part with time series analysis is the CRHUDA model, which employs the combination of humidity, atmospheric pressure, and dew point series to predict the onset of precipitation.
Presented by Gutierrez-Lopez et al. in (2019) [16], this CRHUDA model is based on the graphical crossing of the time series of the mentioned variables. It has proved to represent an efficient and effective model for the calibration of the warning system (RedCIAQ) operated by the Civil Protection authorities of the city of Queretaro, Mexico [17]. However, it has been shown that the warning time can be reduced if a scaling factor is introduced to force the crossing of the model series to become increasingly evident. Therefore, the objective of this work is to provide a proportional scaling factor to allow the use of the time series used in the CRHUDA model, hence improving the forecast of the onset of precipitation.

2. Materials and Methods

2.1. CRHUDA Proposed Model

The dew point temperature is the temperature at which air is saturated if it is chilled at a constant pressure [18,19]; that is, the temperature at which the vapor pressure is equal to the saturation pressure of the air. In the same way, the vapor volume present in the atmosphere can be expressed through the pressure that this vapor generates [20,21]. However, the total pressure of the atmosphere is the sum of the pressure caused by dry-air plus the pressure produced by water vapor [22,23]. Thus, the maximum vapor pressure that may be present depends on the ambient temperature [24]. As the temperature increases, more vapor pressure can be contained in the air [25,26]. This can be expressed by the Clausius–Clapeyron relationship [27,28]. Therefore, when the air is saturated with water vapor, the pressure of the water vapor depends only on the temperature [10,29,30]. In this way, two time series are plotted; the first is the humidity data ( Z 1 ) and the second is the series defined by dew point and atmospheric pressure ( Z 2 ). The crossing of these two series will indicate the beginning of the alert; eight hours later, the series will cross again and, at that moment, the precipitation will start (Figure 1).
This means that, for the precipitation to begin, it must happen on t 1 Z t k 1 Z t k 2 , and considering T k + T   a t   t 2 Z t k 1 Z t k 2 . If T = 0 , the forecast of the start of precipitation event H p is precise. If T 0 , there is a time delay in the start of the precipitation event H p [16].

2.2. Autoregressive Moving-Average Models ARMA(p,q)

These models are applied to annual series; they comprise a combination of the autoregressive AR(p) models and the moving average MA(q) models [31]; the value of p refers to the number of parameters associated with the autoregressive component, and q represents the number of parameters of the moving average component. The general representation of the ARMA(p,q) models is:
Z t = ϕ 1 Z t 1 + ϕ 2 Z t 2 + + ϕ p Z t p + ε t θ 1 ε t 1 θ 2 ε t 2 θ q ε t q ,
where ε t is a random variable independent of time, ϕ p are parameters of the autoregressive component, and θ q are parameters of the moving average component. If a representative sample of the process is available, the parameters ϕ p are determined so as to reproduce the correlations r 1 , r 2 , , r p calculated with the data. This method considers the data and residuals to be normal and independent. A property of ARMA(p,q) models is that the autocovariances from order 1 to order q depend on the autoregressive parameters ϕ p and the moving averages θ q , while for higher orders they depend only on the autoregressive parameters. For the case of a discrete series, the autocovariance is calculated as:
C k = 1 n t = 1 N K X t X ¯ X t k X ¯ ; 0 < k < N .

2.3. Multivariate Stochastic Models

The practice of multivariate analysis combined with time series in hydrometeorological subjects has been developed to estimate hydrological variables at ungauged sites or without data. While spectral functions allowed the study of frequency relationships between two time series, the fundamental question in the time domain is how to improve the predictions of univariate models. Hydrologists use the time (frequency) domain in multivariate series to consider climatic phenomena simultaneously.
Predictions of Z t can be made using the past history of the single variable Z t , or by considering a richer set of information ( Z t k 1 , Z t k 2 , Z t k 3 , Z t k n ; k = 0,1 , 2 , ), and by building a multivariate model Z t = f ( Z t k 1 , Z t k 2 , Z t k 3 , Z t k n , ε t k 1 , ε t k 2 , ε t k 3 ε t k n ; k > 0 ) . This multivariate modeling is of double interest: it provides an explanatory framework that is descriptive of the evolution of Z t , and theoretically it should lead to better forecasts than those provided by the univariate model ( B ) Z t θ ( B ) ε t . With this background, the use of stochastic models is proposed to describe the behavior of the CRHUDA model series Z t = f ( Z t k 1 , Z t k 2 , Z t k 3 , Z t k n , ε t k 1 , ε t k 2 , ε t k 3 ε t k n ; k > 0 ) —multivariate models distributed in time, in which the inputs X t are climatic variables.

2.4. Autocorrelation as Validation of CRHUDA Model

The autocovariance function C k provides a covariance measure for a couple of values with an offset of time lag k. It provides information about the variability of the series and the temporal relations between the different components of the X t series. If only the correlations between the different pairs X t , X t + k are of interest, it is necessary to define the autocorrelation function r k of the process X t , i.e.,
r k = C k C 0 = t = 1 N K X t X ¯ X t k X ¯ / n t = 1 N X t X ¯ 2 ,
where
C o = n t = 1 N X t X ¯ 2
C o v = X t X t k = E X t X ¯ X t k X ¯ .
r k represents the correlation coefficient for a couple of values separated by a lag time k. As k increases, the correlation between X t   a n d   X t k decreases. Then, for our case, Z t k 1 , Z t k 2 , Z t k 3 , Z t k n ; k = 0,1 , 2 , . will be the three time series of the CRHUDA model. That is:
C R H U D A Z t k 1 Z t k 2 Z t k 1 Z t k 2 Z t k 1 = h u m i d i t y Z t k 2 = a t m o s p h e r i c   p r e s s u r e d e w   p o i n t .

2.5. Sensitivity Analysis

A scaling factor β is introduced, which will be proportional to the series of serial autocorrelation values.
Z t k 1 Z t k 2 β Z t k 1 Z t k 2 .
The autocorrelation function can be defined by r k = f Z t k 1 Z t k 2 for any process, proportional to f = [ β Z t k 1 Z t k 2 ] . Thus, a sensitivity analysis item of the CRHUDA model is proposed. Residuals from the two series ε Z t k 1 Z t k 2 must have zero mean and must be uncorrelated, which implies that it is independent of time k; this is ε = ε t , t   ϵ   N ; E ε t ε t 1 = 0 and V a r ε t = σ ε 2 . From the properties of the autocorrelation function, it is known that C 0 = E X t X ¯ 2 = V a r X t = σ x 2 if k = 0 , then C 0 is the stationary variance in t 0 . Thus, if the series Z t k 1 &   Z t k 2 are independent, then r k = C k C 0 0 tends to zero. However, being a multivariate stochastic model, the series must fulfill the condition of independence and joint stationarity. This can be verified in a systematical manner with the help of the correlogram-multivariate limits; in this way, it is proposed that:
Lemma 1. 
An autocorrelation coefficient  r k  calculated from a multivariate stochastic series  f Z t k 1 ,   Z t k 2 ,   Z t k 3 ,   Z t k n  outside the confidence limits of the correlogram; it represents a break point in the  Z t k n  series. This break point in itself locates the times  t 1  and  t 2  of crossing between the series that compose the CRHUDA model.
Lemma 2. 
The crossing time k between the series of the CRHUDA model can be modified by a time  T k  using a scaling factor  β  such that  Z t k 1 Z t k 2 β Z t k 1 Z t k 2 .
Fitting the autocorrelation function, the result is as follows:
C k = E ( X t X ¯ ) X t + k X ¯ = E X t k X ¯ X β X ¯   with   β = t + k .
To associate the time lag that occurs in r k , it is possible to do:
L a g k = L a g L a g + 1 L a g + k 1 = Γ L a g + k Γ L a g L a g + k 1 ! L a g 1 ! .
If β > 0   ;   β 0 = 1   &   1 k = k ! , then k is the time lag, where r k (Lemma 1) for r k = β 1 > 0
β k = β β + 1 β + 2 β + k 1 β k = r + 1 r + 2 r + k β k = 1 r r r + 1 r + 2 r + k = 1 r r k + 1 .
Then, the scaling factor can be written as:
β k = β 1 k + 1 β 1 β k + 1 = β β + 1 k .

3. Results

Data from the extreme precipitation monitoring network RedCIAQ, which includes the alert system for the city of Queretaro in central Mexico [8], were used. This network includes more than 40 Automatic Weather Stations (AWS) located in the metropolitan area of the city of Queretaro. The data were collected in real-time, minute by minute. The database managed in this work consists of 2800 CSV files, totaling 12 GB of information. To calculate the scale factor, correlograms of each event studied must be calculated using the autocorrelation function values. To produce the autocorrelograms, we selected a sample of convective storms from several stations and dates, handling approximately 145,000 records and generating a total of 720 autocorrelograms. The method involved three phases. In the first phase, the data of the precipitation height, humidity, dew point, and atmospheric pressure were extracted for more than 500 storms between 2012 and 2021 collected every minute to generate the series Z t k 1 and Z t k 2 . The second phase of the process includes calculating the values of the autocorrelation coefficient and plotting the correlograms of all the series r k = f Z t k 1 Z t k 2 to evaluate the breakpoints. In the third phase, the scaling factor is calculated and verified as β .

3.1. Presentation of CRHUDA Model

The CRHUDA model, in its initial version, used two time series comprising three climatological variables: humidity, atmospheric pressure, and dew point. The series are presented in a scaled graph that highlights the moments of crossing between them. The calculation and application of the proposed scale factor optimize the crossing time between the two series for forecasting the onset of precipitation.
The CRHUDA model (Equation (6)) was applied to the data of the storms that occurred between 2012 and 2021 in the metropolitan area of the city of Queretaro. In a synoptic sense, it is possible to see, remarkably, that the crossing of these two time series C R H U D A Z t k 1 Z t k 2 Z t k 1 Z t k 2 , a point in time that provides a warning 9 to 10 h prior to the onset of the storm. For example, Figure 2 shows the results of the application of the CRHUDA model in the AWS-Candiles for the storm data of 24 and 25 June 2013. At around 10:20, the first crossing is observed; the humidity drops fast, which allows the alert to be initiated. After this point, the crossing occurs in the opposite direction and precipitation starts. Results revealed a mean time of 10 h T t   + Δ t = 619.58   min between warning t 1 and the onset of precipitation t 2 , with a mean of 8.9 h (534 min). The same analysis can be performed for the next day’s storm. With this example, it is evident that the scale of the ordinate axis is important and strongly influences the location of the points in time ( t 1   &   t 2 ) as precise instants of crossings. Lemmas 1 and 2 are important here. Finding the precise instants of t 1   a n d   t 2 crossings is critical to generate warnings and communicate to the local civil protection authorities. Thus, the scaling factor between the two series must be visualized and calculated Z t k 1 Z t k 2 β Z t k 1 Z t k 2 . The visual calibration results of the scaling factor were between 0.4 and 2.6 with a mean of 1.784.
Figure 3 and Figure 4 show the results for other stations and with different storm data. Storms where the need to estimate the scaling factor is evident are especially highlighted. For example, in Figure 3, the crossing between the two time series is imperceptible at some times. A synoptic recognition is very compromised to associate the result with a warning system. Lemma 2 must then be mathematically tested through the components and parameters of the time series processed as a multivariate stochastic autoregressive model.
Figure 4 shows a large sequence of storms for the AWS University Center station. The application of the CRHUDA model is remarkable due to the number of storms that occurred. In all cases, the crossings are perfectly identified, which allows a very trustworthy forecast of the onset of precipitation to be made. Next, it is important to mathematically validate the calculation of the scaling factor β using the autocorrelation function values.

3.2. Calculation of Correlograms

An autocorrelation coefficient r k calculated from a multivariate stochastic series f Z t k 1 , Z t k 2 , Z t k 3 , Z t k n outside the confidence limits of the correlogram; it represents a break point in the Z t k n series. This break point itself locates the times t 1 and t 2 of crossing between the series that form the CRHUDA model. With this hypothesis, the values of the autocovariance and autocorrelation functions of each of the variables, series, and the complete CRHUDA model were calculated. The main question remains—what is the forecast time of rainfall events?—since the answer has important implications, as a successful rainfall forecasting model can be used in a flood early warning system. Thus, the correlograms obtained from Equations (2)–(4) allow the scaling factor to be calculated with precision. Figure 5 shows the correlograms for the atmospheric pressure time series for the AWS-Juriquilla station during the 17 September 2017 storm: (a) 1 h; (b) 6 h; (c) 12 h; and (d) 24 h. For the same storm, Figure 6 and Figure 7 show the correlograms for the humidity and dew point series, respectively. To be specific, this storm caused severe damage in the Queretaro metropolitan area including a large sinkhole and losses of road infrastructure, to mention a few. It is critical to highlight that the management of extreme precipitation in this city has already been studied in terms of its spatial component associated with the city’s warning system [8].
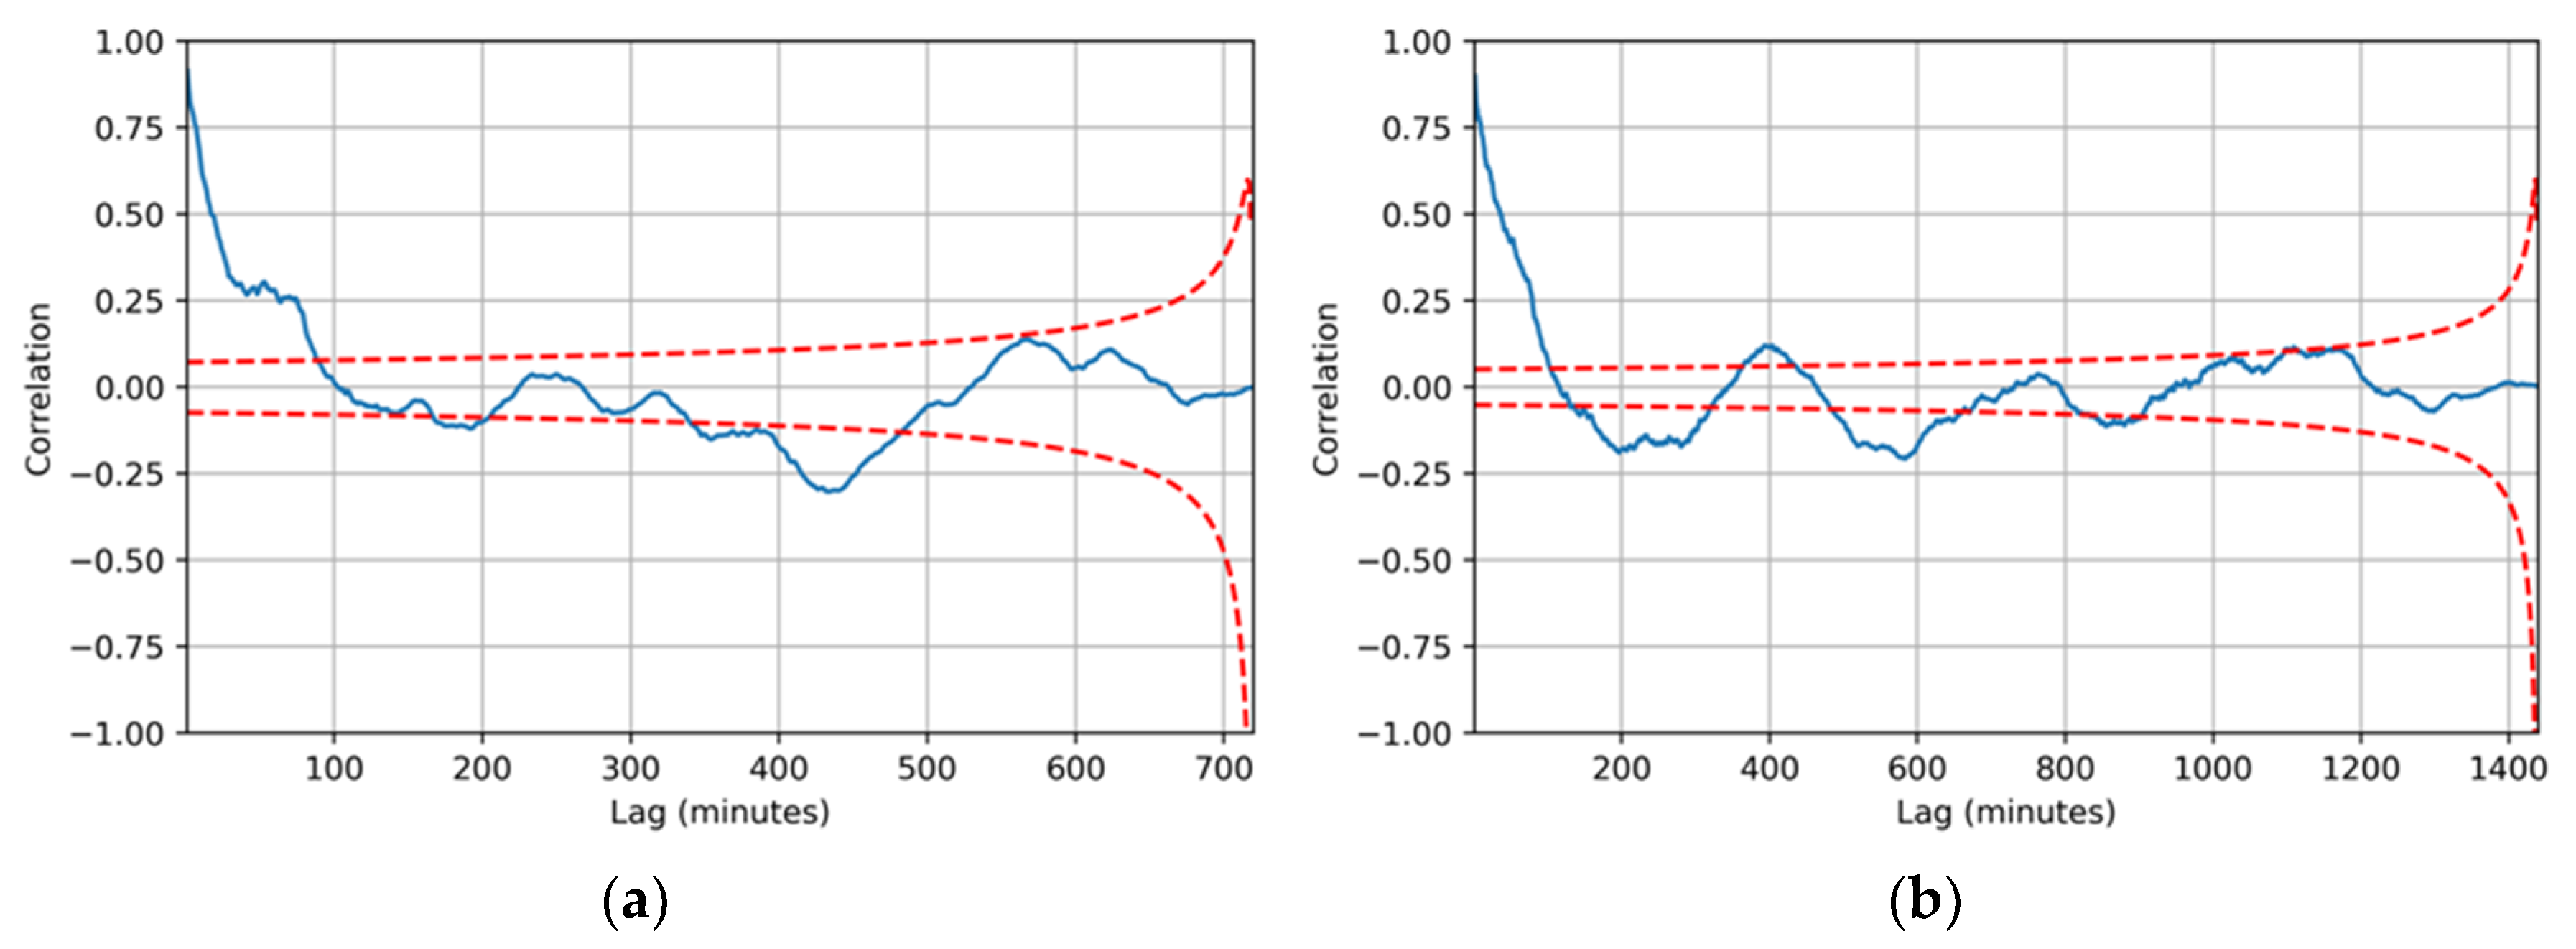
The results of the correlograms of the series analyzed individually show, in almost all cases, a break in one of the k times. With these results, two facts are verified: (i) the correlograms allow us to locate in time the changes in the behavior of the series, identified from the correlogram as points outside the confidence limits; (ii) the estimated values of the autocorrelation coefficients allow us to calculate a scaling factor. In Figure 6, Figure 7 and Figure 8, the blue line represents the correlogram, while the red line represents its limits.

3.3. Calculation of Scaling Factor β

These results show that, as was expected when Equation (9) was derived, it is possible to represent the scaling factor employing the full model. At that point, the results of the correlograms of the full model provide the necessary values of the autocorrelation coefficients to build the scaling factor. The calculation of the scaling factor is performed on the basis of the premise proposed in this work, where the crossing time k between the series of the CRHUDA model is modified by a time T k using a scaling factor β such that Z t k 1 Z t k 2 β Z t k 1 Z t k 2 . From the values of the autocorrelation function, the correlograms of the complete model are calculated; for example, for one of the most destructive storms in recent years in the metropolitan area of the city of Queretaro, on 17 September 2017. Figure 8 shows the results of the correlograms of the complete CRHUDA model for this storm. At some points (k times), the correlogram goes out of its limits. These points represent the values of β k + 1 = β β + 1 k for computing the scaling factor. As a complement to the mentioned before, Table 1 shows the results of calculating the autocorrelation coefficients and all the parameters of the CRHUDA model for storms occurring in September, which is the rainiest month of the year in the city of Queretaro. The mean scaling factor for the month of September is 1.107, the mean value of T = 0 : 24 : 01 , and the mean value of T k = 1 : 46 : 45 . From the above it can be deduced that, for the month of September, a warning can be given with a time of around two hours in advance 1 : 46 : 45 + 0 : 24 : 01 = 2 : 10 : 46 whenever the scaling factor is used with the calculated values. It is worth mentioning that only results for some storms and some AWS-stations are shown. Complete results for all storms and all source data are available upon request.

4. Discussion

4.1. Calculation of Scaling Factor β

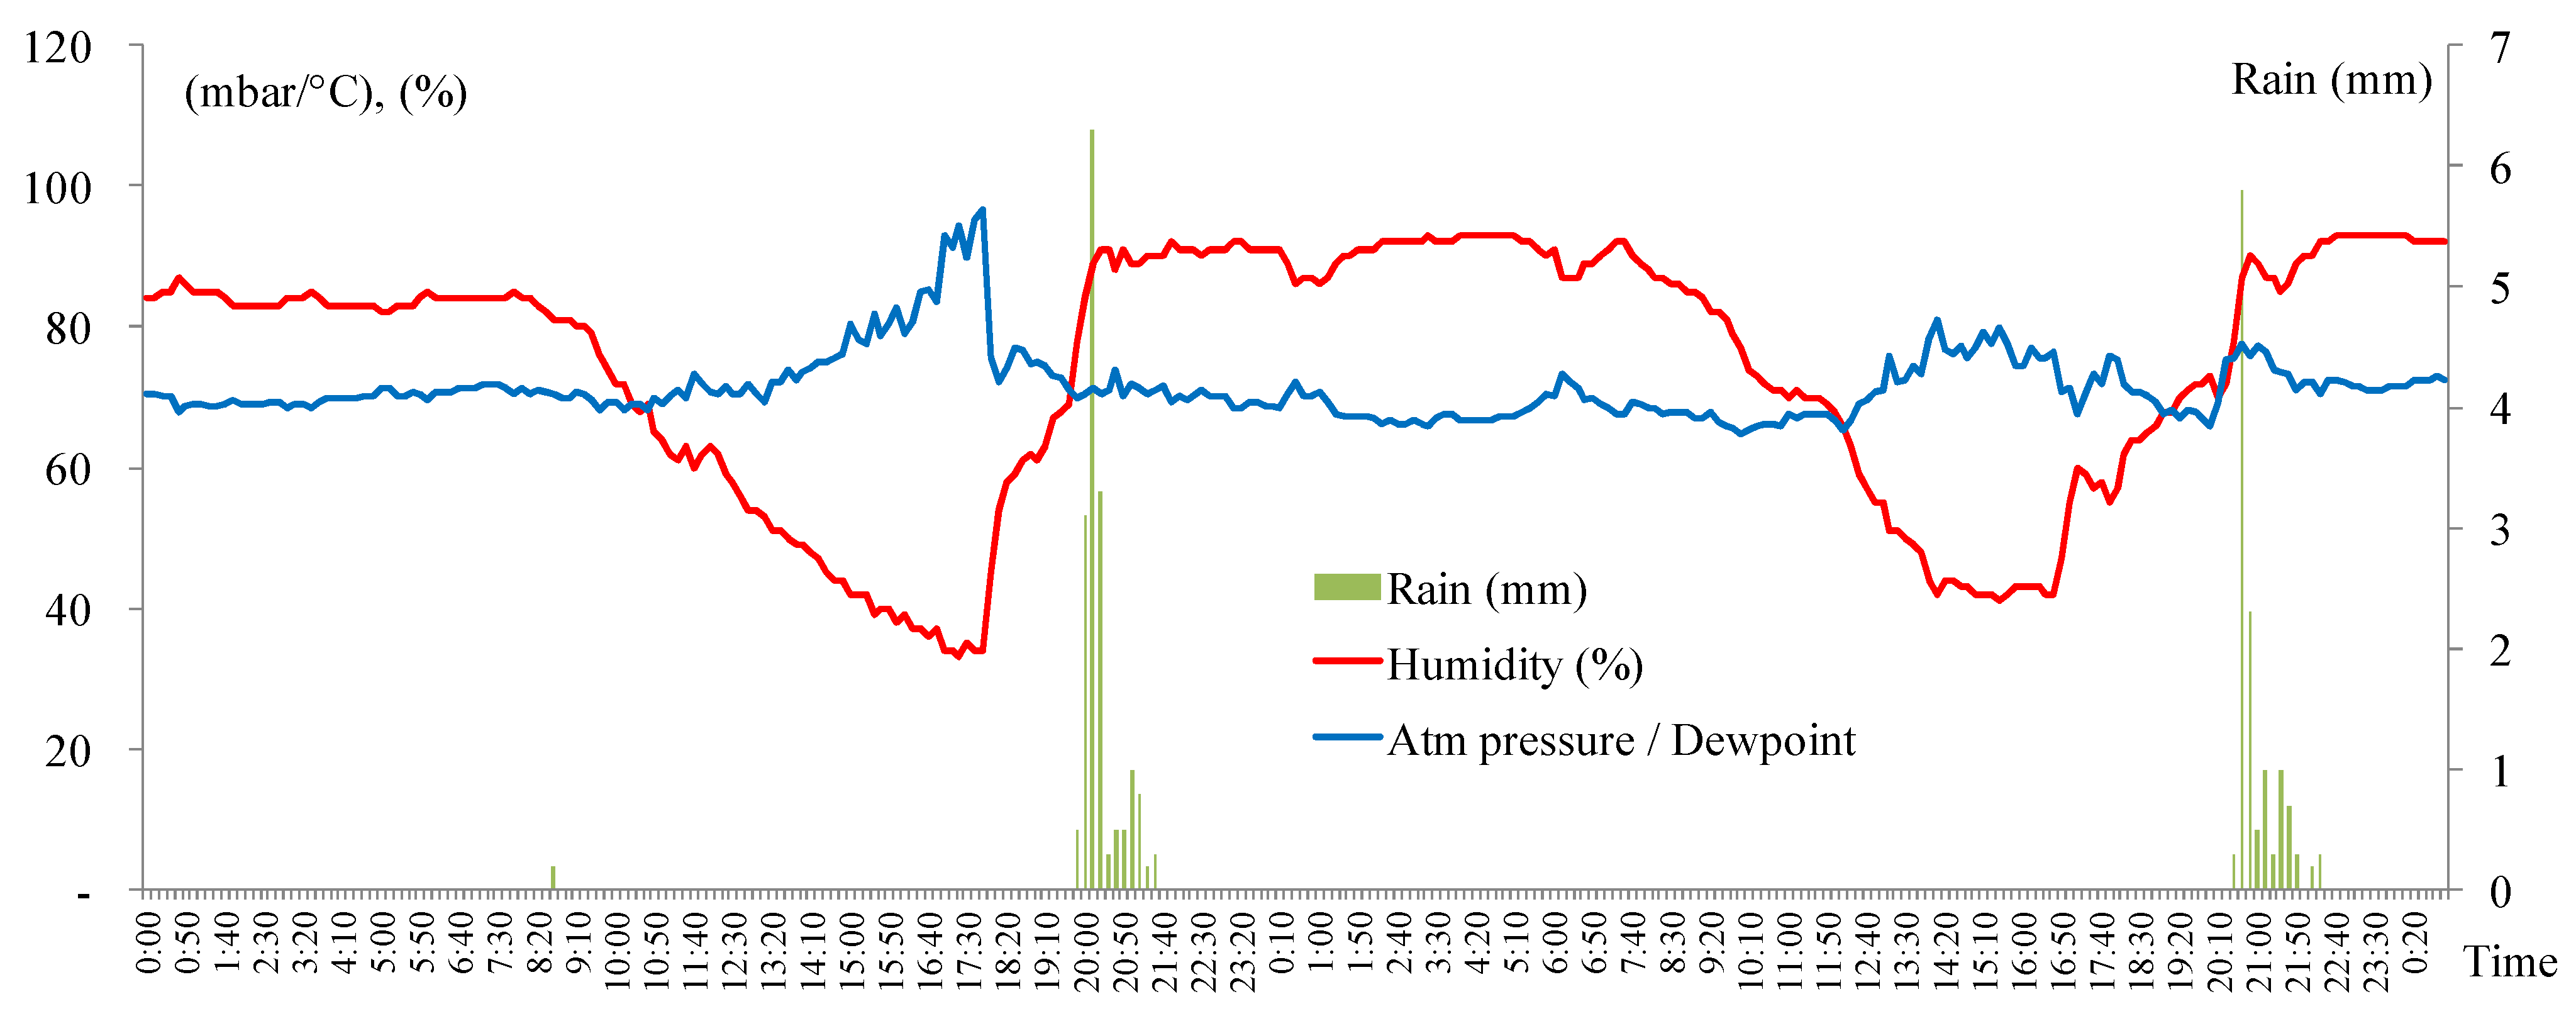
At this point, it has been proven that the CRHUDA model that was designed to detect the effect of the Clausius–Clapeyron (C-C) ratio (combination of atmospheric pressure, dew point, and humidity) is able to predict the onset of precipitation with excellent accuracy. These variables have already been manipulated, but individually and in meteorological models [9,28,32]. However, the results are consistent with those of other studies that suggest there is a correlation between the dew point and the C-C ratio. This is for the coherent physical argument that C-C behavior arises from the physics of convective clouds [25,33]. Thus, CRHUDA as a fundamental synoptic model can forecast the onset of precipitation reliably, on mean nine to ten hours before the onset of precipitation; this forecast seems acceptable. This is also in agreement with our previous observations that showed that it is possible to use the real-time hydrometeorological data set on a minute-by-minute basis [34,35]. Therefore, it can be suggested that a daily precipitation database allows the correct spatiotemporal disaggregation of spatially distributed hourly precipitation [36,37]. This finding has important implications for the development of a precipitation forecasting model to provide forecasts in advance, since it is only necessary to find the right combination of climatic variables [38,39]. Once the synoptic part of the validation is accepted, the stochastic forecast model is critical. A scaling factor having been verified, a sensitivity analysis can be presented as shown in Figure 9 and Figure 10. Figure 9 shows four crossover zones for two storms recorded at the AWS-Milenio station on 24 and 25 June 2013. Considering a scaling factor equal to one, the forecast and warning are performed normally. However, when the scaling factor is modified (for discussion purposes only); the crossing does not occur and therefore the alert cannot be triggered (Figure 10). It is evident that the scaling factor is of considerable importance when the CRHUDA model is linked to a real-time warning system. It is necessary, then, that the calculation and the previous calibration of the scaling factor is the function of the autocorrelation coefficients according to Equation (10).

4.2. Model Calibration, Validation and Precision

The calibration and validation process of the CRHUDA model were conducted in 2019 [16]. However, it is believed that the model’s precision, particularly when coupled with early warning systems, can be improved. Therefore, this paper presents the estimation of a scaling factor based on the autocorrelation coefficient of the time series that comprise the model.
The CRHUDA model is currently coupled to the RedCIAQ extreme precipitation monitoring network [8] and is in operation. The daily operation of the CRHUDA model is vital for the intervention protocols of the local Civil Protection authorities, especially during the months of July to September. Improving the accuracy of early warning models for extreme precipitation remains a priority, particularly in underdeveloped countries. Therefore, it is appropriate to conduct a sensitivity analysis of the scaling factor proposed in this work. Figure 9 illustrates the daily application of the CRHUDA model. For instance, in June, the warning time is appropriate for a scaling factor of one at the AWS-Milenio station. However, Figure 10 shows hypothetically how a change in the scaling factor’s value can affect the crossing times’ location and, consequently, the alert times issued by the authorities.
Although the focus of this work was on obtaining the scale factor, a comprehensive sensitivity analysis of all climatological stations in the RedCIAQ is required. Therefore, it is necessary to adjust the precision of the CRHUDA model using the proposed scale factor for each AWS station and for each month. It is recommended that this analysis be conducted at least once a year before the rainy season.

5. Conclusions

The results of this study show that it is possible to combine the climatic variables—atmospheric pressure, dew point, and humidity—to forecast the onset of precipitation. These variables are represented in two time series that can be plotted to determine, synoptically, the time (instant) of crossing between both series. This instant of crossing triggers the warning to be considered as the onset of precipitation at the subsequent crossing. From the results obtained, it is concluded that the warning time from the first crossing to the onset of precipitation at the second crossing, on mean, represent nine to ten hours. It was exposed that the crossing times of both series are a function of the autocorrelation coefficients of the complete model. It has been found that a scaling factor can improve forecast precision at crossing times. This scaling factor is calculated using the autocorrelation coefficients. The systematic application of the CRHUDA model with its respective scaling factor adjusted to the historical data of each AWS represents a suitable tool to be linked to a real-time precipitation warning system. The study of the CRHUDA model as an extremely practical algorithm for warning systems should be extended.

Author Contributions

Conceptualization, M.M.-M. and A.G.-L.; methodology, A.G.-L.; software, M.M.-M.; validation, M.A.I.-C., I.C.A. and J.A.V.-D.; formal analysis, A.G.-L.; investigation, M.M.-M. and A.G.-L.; resources, J.A.A.-G.; data curation, M.M.-M.; writing-original draft preparation, A.G.-L.; writing-review and editing, A.G.-L. All authors have read and agreed to the published version of the manuscript.

Funding

This work was financially supported by the National Council of Science and Technology, Mexico. Call for proposals 2021–2022, national research and incidence projects on extensive knowledge and watershed management of the socio-natural water cycle for the collective good and environmental justice (CONACYT/PRONAII-318956).

Institutional Review Board Statement

Not applicable.

Informed Consent Statement

Not applicable.

Data Availability Statement

Data are available from the corresponding author, upon reasonable request.

Acknowledgments

The author is grateful to the Risk Management Unit of the UNESCO Regional Office of Science for Latin America and the Caribbean.

Conflicts of Interest

The authors declare no conflicts of interest.

References

  1. Lepore, C.; Allen, J.T.; Tippett, M.K. Relationships between Hourly Rainfall Intensity and Atmospheric Variables over the Contiguous United States. J. Clim. 2016, 29, 3181–3197. [Google Scholar] [CrossRef]
  2. Vincent, L.A.; van Wijngaarden, W.A.; Hopkinson, R. Surface Temperature and Humidity Trends in Canada for 1953–2005. J. Clim. 2007, 20, 5100–5113. [Google Scholar] [CrossRef]
  3. CENAPRED. Disasters in Mexico: Social and Economic Impacts (1980–2014); Centro Nacional de Prevension de Desastres: Ciudad de Mexico, Mexico, 2016.
  4. Valverde Ramírez, M.C.; de Campos Velho, H.F.; Ferreira, N.J. Artificial neural network technique for rainfall forecasting applied to the São Paulo region. J. Hydrol. 2005, 301, 146–162. [Google Scholar] [CrossRef]
  5. Zahraei, A.; Hsu, K.-L.; Sorooshian, S.; Gourley, J.J.; Hong, Y.; Behrangi, A. Short-term quantitative precipitation forecasting using an object-based approach. J. Hydrol. 2013, 483, 1–15. [Google Scholar] [CrossRef]
  6. Egerer, M.H.; Lin, B.B.; Kendal, D. Temperature Variability Differs in Urban Agroecosystems across Two Metropolitan Regions. Climate 2019, 7, 50. [Google Scholar] [CrossRef]
  7. Emmanuel, L.A.; Hounguè, N.R.; Biaou, C.A.; Badou, D.F. Statistical Analysis of Recent and Future Rainfall and Temperature Variability in the Mono River Watershed (Benin, Togo). Climate 2019, 7, 8. [Google Scholar] [CrossRef]
  8. Gutierrez-Lopez, A. A Robust Gaussian variogram estimator for cartography of hydrological extreme events. Nat. Hazards 2021, 107, 1469–1488. [Google Scholar] [CrossRef]
  9. Rogers, J.C.; Wang, S.-H.; Coleman, J.S.M. Evaluation of a Long-Term (1882–2005) Equivalent Temperature Time Series. J. Clim. 2007, 20, 4476–4485. [Google Scholar] [CrossRef]
  10. Millán, H.; Ghanbarian-Alavijeh, B.; García-Fornaris, I. Nonlinear dynamics of mean daily temperature and dewpoint time series at Babolsar, Iran, 1961–2005. Atmos. Res. 2010, 98, 89–101. [Google Scholar] [CrossRef]
  11. Mohr, S.; Kunz, M. Recent trends and variabilities of convective parameters relevant for hail events in Germany and Europe. Atmos. Res. 2013, 123, 211–228. [Google Scholar] [CrossRef]
  12. Dahm, R.; Bhardwaj, A.; Weiland, F.S.; Corzo, G.; Bouwer, L.M. A Temperature-Scaling Approach for Projecting Changes in Short Duration Rainfall Extremes from GCM Data. Water 2019, 11, 313. [Google Scholar] [CrossRef]
  13. Damrath, U.; Doms, G.; Frühwald, D.; Heise, E.; Richter, B.; Steppeler, J. Operational quantitative precipitation forecasting at the German Weather Service. J. Hydrol. 2000, 239, 260–285. [Google Scholar] [CrossRef]
  14. Polotzek, K.; Kantz, H. An ARFIMA-based model for daily precipitation amounts with direct access to fluctuations. Stoch. Environ. Res. Risk Assess. 2020, 34, 1487–1505. [Google Scholar] [CrossRef]
  15. Gil-Alana, L.A.; Martin-Valmayor, M.A.; Hube-Antoine, C. An analysis of temperature anomalies in Chile using fractional integration. Stoch. Environ. Res. Risk Assess. 2023, 37, 2713–2724. [Google Scholar] [CrossRef]
  16. Gutierrez-Lopez, A.; Cruz-Paz, I.; Mandujano, M.M. Algorithm to Predict the Rainfall Starting Point as a Function of Atmospheric Pressure, Humidity, and Dewpoint. Climate 2019, 7, 131. [Google Scholar] [CrossRef]
  17. Gutierrez-Lopez, A.; Trejo, M.F.; Gonzalez, N.I.A.; Prado, F.B. Análisis de la variabilidad espacial en la precipitación en la zona metropolitana de Querétaro empleando ecuaciones de anisotropía. Investig. Geográficas 2019, 99, 1–16. [Google Scholar] [CrossRef]
  18. Shaw, S.B.; Royem, A.A.; Riha, S.J. The Relationship between Extreme Hourly Precipitation and Surface Temperature in Different Hydroclimatic Regions of the United States. J. Hydrometeorol. 2011, 12, 319–325. [Google Scholar] [CrossRef]
  19. Agard, V.; Emanuel, K. Clausius–Clapeyron Scaling of Peak CAPE in Continental Convective Storm Environments. J. Atmos. Sci. 2017, 74, 3043–3054. [Google Scholar] [CrossRef]
  20. Lorenz, D.J.; DeWeaver, E.T. The Response of the Extratropical Hydrological Cycle to Global Warming. J. Clim. 2007, 20, 3470–3484. [Google Scholar] [CrossRef]
  21. Camuffo, D. Theoretical Grounds for Humidity. In Microclimate for Cultural Heritage; Elsevier: Amsterdam, The Netherlands, 2014; Chapter 2A; pp. 49–76. ISBN 9780444632982. [Google Scholar] [CrossRef]
  22. Romps, D.M. An Analytical Model for Tropical Relative Humidity. J. Clim. 2014, 27, 7432–7449. [Google Scholar] [CrossRef]
  23. Holley, D.M.; Dorling, S.R.; Steele, C.J.; Earl, N. A climatology of convective available potential energy in Great Britain. Int. J. Clim. 2014, 34, 3811–3824. [Google Scholar] [CrossRef]
  24. Chang, W.; Stein, M.L.; Wang, J.; Kotamarthi, V.R.; Moyer, E.J. Changes in Spatiotemporal Precipitation Patterns in Changing Climate Conditions. J. Clim. 2016, 29, 8355–8376. [Google Scholar] [CrossRef]
  25. Lenderink, G.; Barbero, R.; Loriaux, J.M.; Fowler, H.J. Super-Clausius–Clapeyron Scaling of Extreme Hourly Convective Precipitation and Its Relation to Large-Scale Atmospheric Conditions. J. Clim. 2017, 30, 6037–6052. [Google Scholar] [CrossRef]
  26. Bürger, G.; Heistermann, M.; Bronstert, A. Towards Subdaily Rainfall Disaggregation via Clausius–Clapeyron. J. Hydrometeorol. 2014, 15, 1303–1311. [Google Scholar] [CrossRef]
  27. Peleg, N.; Marra, F.; Fatichi, S.; Molnar, P.; Morin, E.; Sharma, A.; Burlando, P. Intensification of Convective Rain Cells at Warmer Temperatures Observed from High-Resolution Weather Radar Data. J. Hydrometeorol. 2018, 19, 715–726. [Google Scholar] [CrossRef]
  28. Velasco, S.; Fernández-Pineda, C. Sobre la obtención de la ecuación de Clapeyron-Clausius. Rev. Española Física 2008, 22, 7–14. [Google Scholar]
  29. Seidel, T.M.; Grant, A.N.; Pszenny, A.A.P.; Allman, D.J. Dewpoint and Humidity Measurements and Trends at the Summit of Mount Washington, New Hampshire, 1935–2004. J. Clim. 2007, 20, 5629–5641. [Google Scholar] [CrossRef]
  30. Harder, P.; Pomeroy, J. Estimating precipitation phase using a psychrometric energy balance method. Hydrol. Process. 2013, 27, 1901–1914. [Google Scholar] [CrossRef]
  31. Box GE, P.; Jenkins, G.M. Time Series Analysis: Forecasting and Control; Holden-Day: San Francisco, CA, USA, 1976; ISBN 9780816211043. [Google Scholar]
  32. Sim, I.; Lee, O.; Kim, S. Sensitivity Analysis of Extreme Daily Rainfall Depth in Summer Season on Surface Air Temperature and Dew-Point Temperature. Water 2019, 11, 771. [Google Scholar] [CrossRef]
  33. Danladi, A.; Stephen, M.; Aliyu, B.; Gaya, G.; Silikwa, N.; Machael, Y. Assessing the influence of weather parameters on rainfall to forecast river discharge based on short-term. Alex. Eng. J. 2018, 57, 1157–1162. [Google Scholar] [CrossRef]
  34. Li, P.; Lai, E.S. Short-range quantitative precipitation forecasting in Hong Kong. J. Hydrol. 2004, 288, 189–209. [Google Scholar] [CrossRef]
  35. Moon, S.-H.; Kim, Y.-H.; Lee, Y.H.; Moon, B.-R. Application of machine learning to an early warning system for very short-term heavy rainfall. J. Hydrol. 2019, 568, 1042–1054. [Google Scholar] [CrossRef]
  36. Segond, M.-L.; Onof, C.; Wheater, H. Spatial–temporal disaggregation of daily rainfall from a generalized linear model. J. Hydrol. 2006, 331, 674–689. [Google Scholar] [CrossRef]
  37. Dyson, L.L.; van Heerden, J.; Sumner, P.D. A baseline climatology of sounding-derived parameters associated with heavy rainfall over Gauteng, South Africa. Int. J. Clim. 2014, 35, 114–127. [Google Scholar] [CrossRef]
  38. Berg, P.; Haerter, J. Unexpected increase in precipitation intensity with temperature—A result of mixing of precipitation types? Atmos. Res. 2013, 119, 56–61. [Google Scholar] [CrossRef]
  39. Park, I.-H.; Min, S.-K. Role of Convective Precipitation in the Relationship between Subdaily Extreme Precipitation and Temperature. J. Clim. 2017, 30, 9527–9537. [Google Scholar] [CrossRef]
Figure 1. Conceptual scheme of the CRHUDA model (Crossing HUmidity, Dew point, and Atmospheric pressure). Adapted from [16].
Stats 07 00010 g001
Figure 2. Results of the application of the CRHUDA model at AWS-Candiles station on 24–25 June 2013.
Stats 07 00010 g002
Figure 3. Results of the application of the CRHUDA model at the AWS-Cimatario station on 16 August 2014 (maximum rainfall 15.4 mm in 1-h; maximum intensity 41.2 mm/h; 32-year return period).
Stats 07 00010 g003
Figure 4. Results of the application of the CRHUDA model to the AWS-UAQ Cerro Campanas data of 16 August 2014 (maximum rainfall 55.2 mm in 1-h; maximum intensity 63.8 mm/h; 53-year return period).
Stats 07 00010 g004
Figure 5. Atmospheric pressure correlograms for AWS-Juriquilla Station on 17 September 2017 at different time intervals (a) 6 h, (b) 12 h, and (c) 24 h.
Stats 07 00010 g005
Figure 6. Humidity correlograms for AWS-Juriquilla Station on 17 September 2017 at different time intervals (a) 6 h (b) 12 h and (c) 24 h.
Stats 07 00010 g006
Figure 7. Dew point correlograms for AWS-Juriquilla Station on 17 September 2017 at different time intervals (a) 6 h, (b) 12 h, and (c) 24 h.
Stats 07 00010 g007
Figure 8. Correlogram for the full CRHUDA model at AWS-Juriquilla Station on 17 September 2017 at different time intervals (a) 12 h, and (b) 24 h.
Stats 07 00010 g008
Figure 9. CRHUDA model for the 24–25 June 2013 AWS-Milenio station ( β = 1 ). Humidity (red line), Atmospheric pressure/dewpoint (blue line).
Stats 07 00010 g009
Figure 10. CRHUDA model for the 24–25 June 2013 AWS-Milenio station ( β = 0.5 ). Humidity (red line), Atmospheric pressure/dewpoint (blue line).
Stats 07 00010 g010
Table 1. Results of the sensitivity analysis and scaling factor for the CRHUDA model applied to data from various extreme storms recorded in the month of September. AWS-Milenio station.
Storm Date β t 2 T t 1 T k
8 September 20131.2316:40:000:13:0016:37:000:03:00
16 September 20131.3115:15:000:06:0014:51:000:24:00
21 September 20131.2813:54:460:44:1413:54:160:00:30
25 September 20161.2415:37:000:05:0015:36:000:01:00
17 September 20170.720:00:000:00:000:00:000:00:00
26 September 20170.9319:26:001:40:0019:12:000:14:00
9 September 20181.2421:18:000:39:0021:16:000:02:00
19 September 20191.1420:52:000:02:0011:41:009:11:00
29 September 20191.2218:10:000:18:0018:08:000:02:00
7 September 20210.7718:17:000:13:0010:27:007:50:00
Disclaimer/Publisher’s Note: The statements, opinions and data contained in all publications are solely those of the individual author(s) and contributor(s) and not of MDPI and/or the editor(s). MDPI and/or the editor(s) disclaim responsibility for any injury to people or property resulting from any ideas, methods, instructions or products referred to in the content.