Estimating the RMSE of Small Area Estimates without the Tears
Abstract
1. Introduction
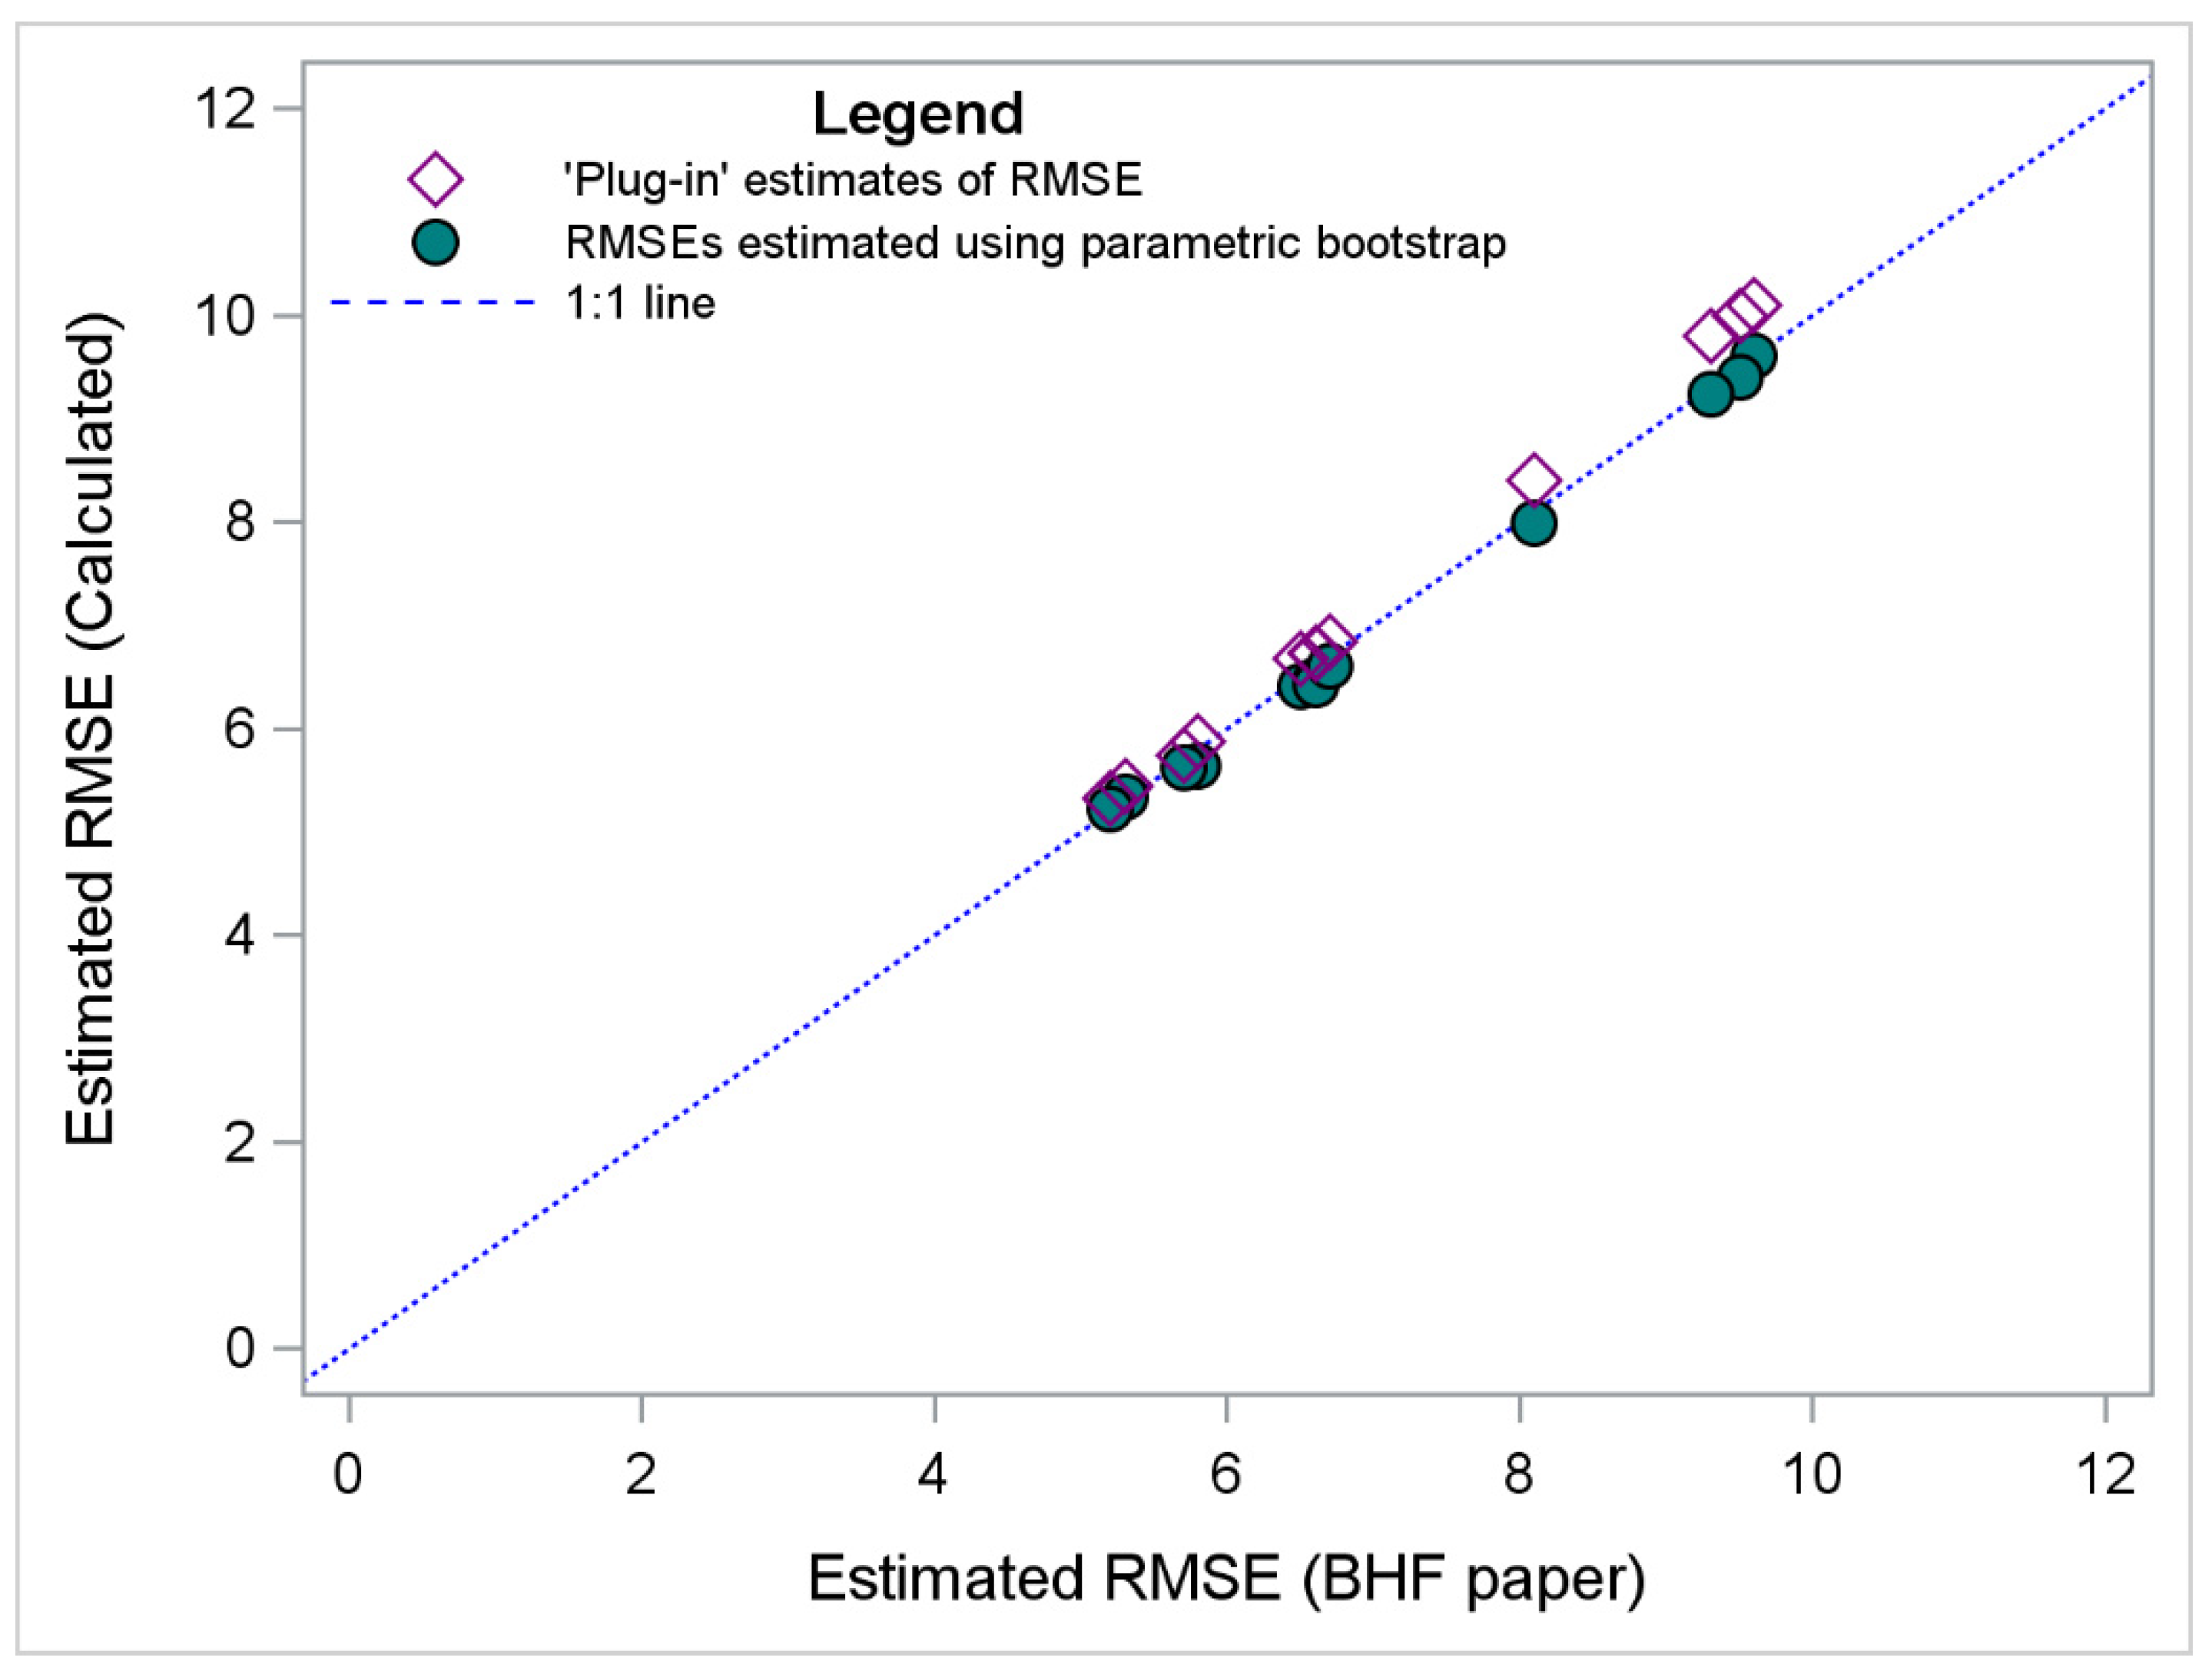
- When applying the EBLUP estimator to the BHF corn data how well do the estimated RMSEs using the parametric bootstrap compare with the estimated RMSEs created by the MIXED procedure in SAS and the estimated RMSEs from Battese et al. [14]?
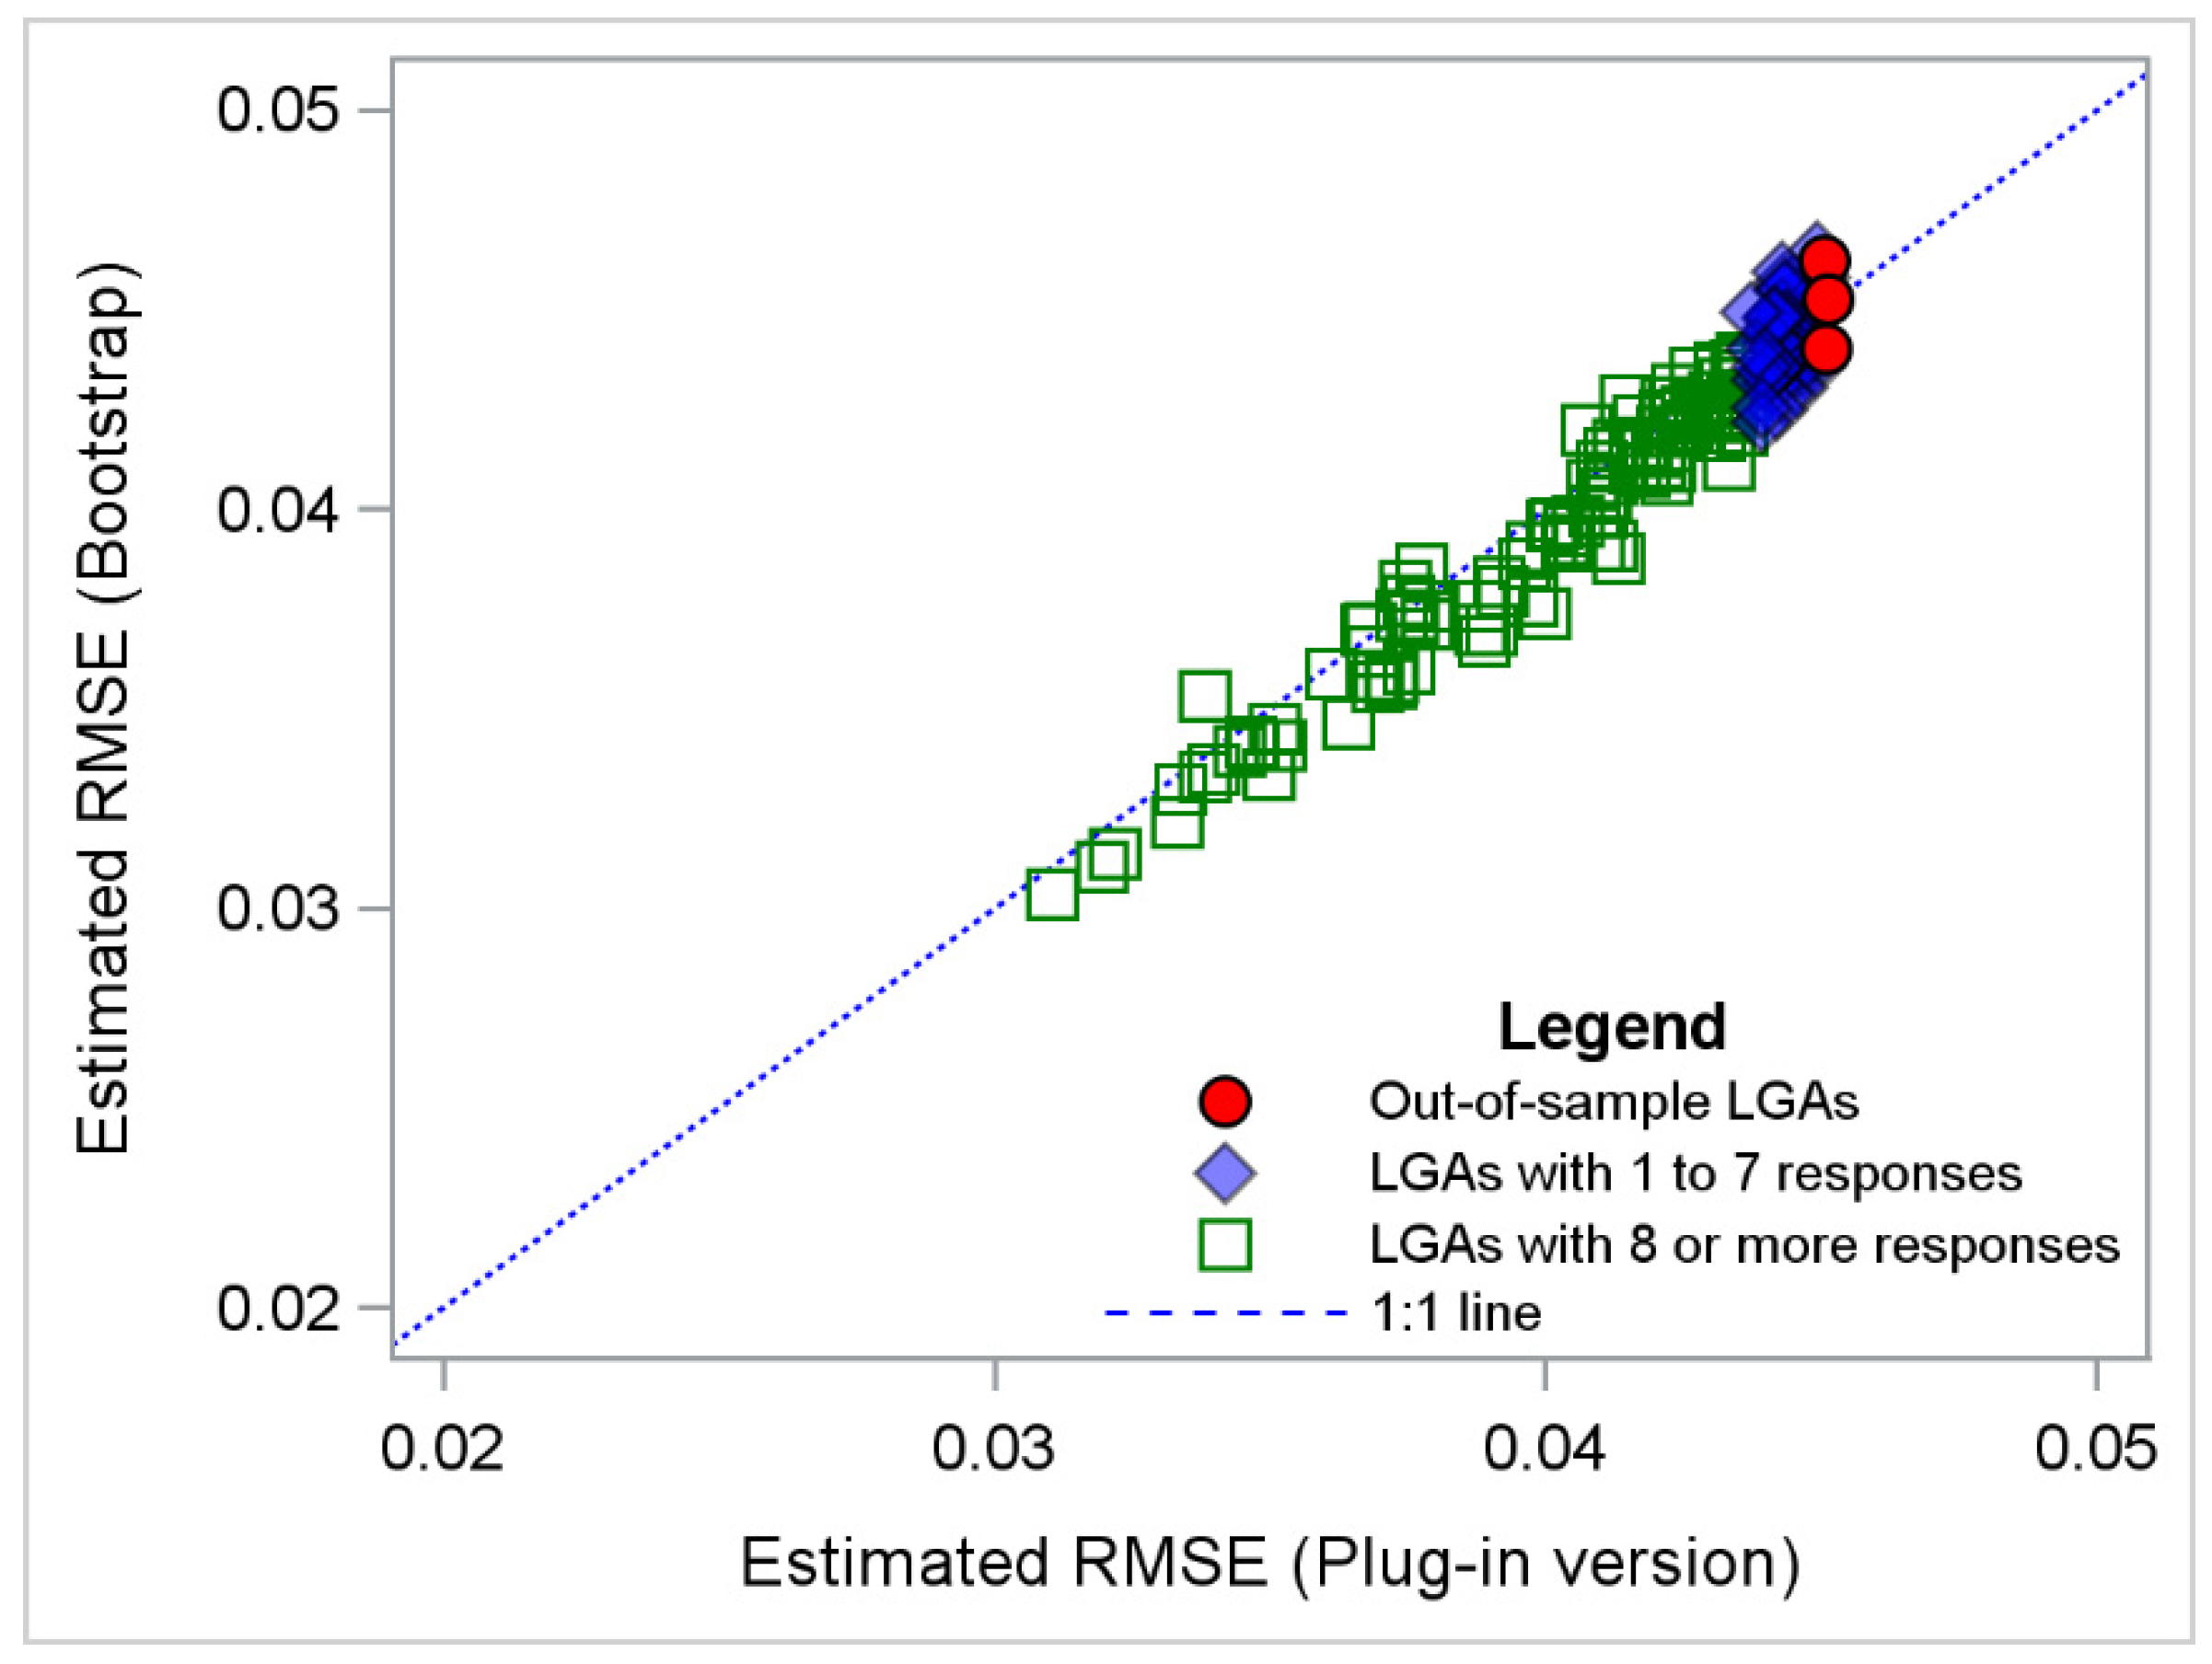
- When applying the EBLUP estimator to the data from NSWPHS, how do the estimated RMSEs from a parametric bootstrap compare with the estimated RMSEs obtained from the MIXED procedure?
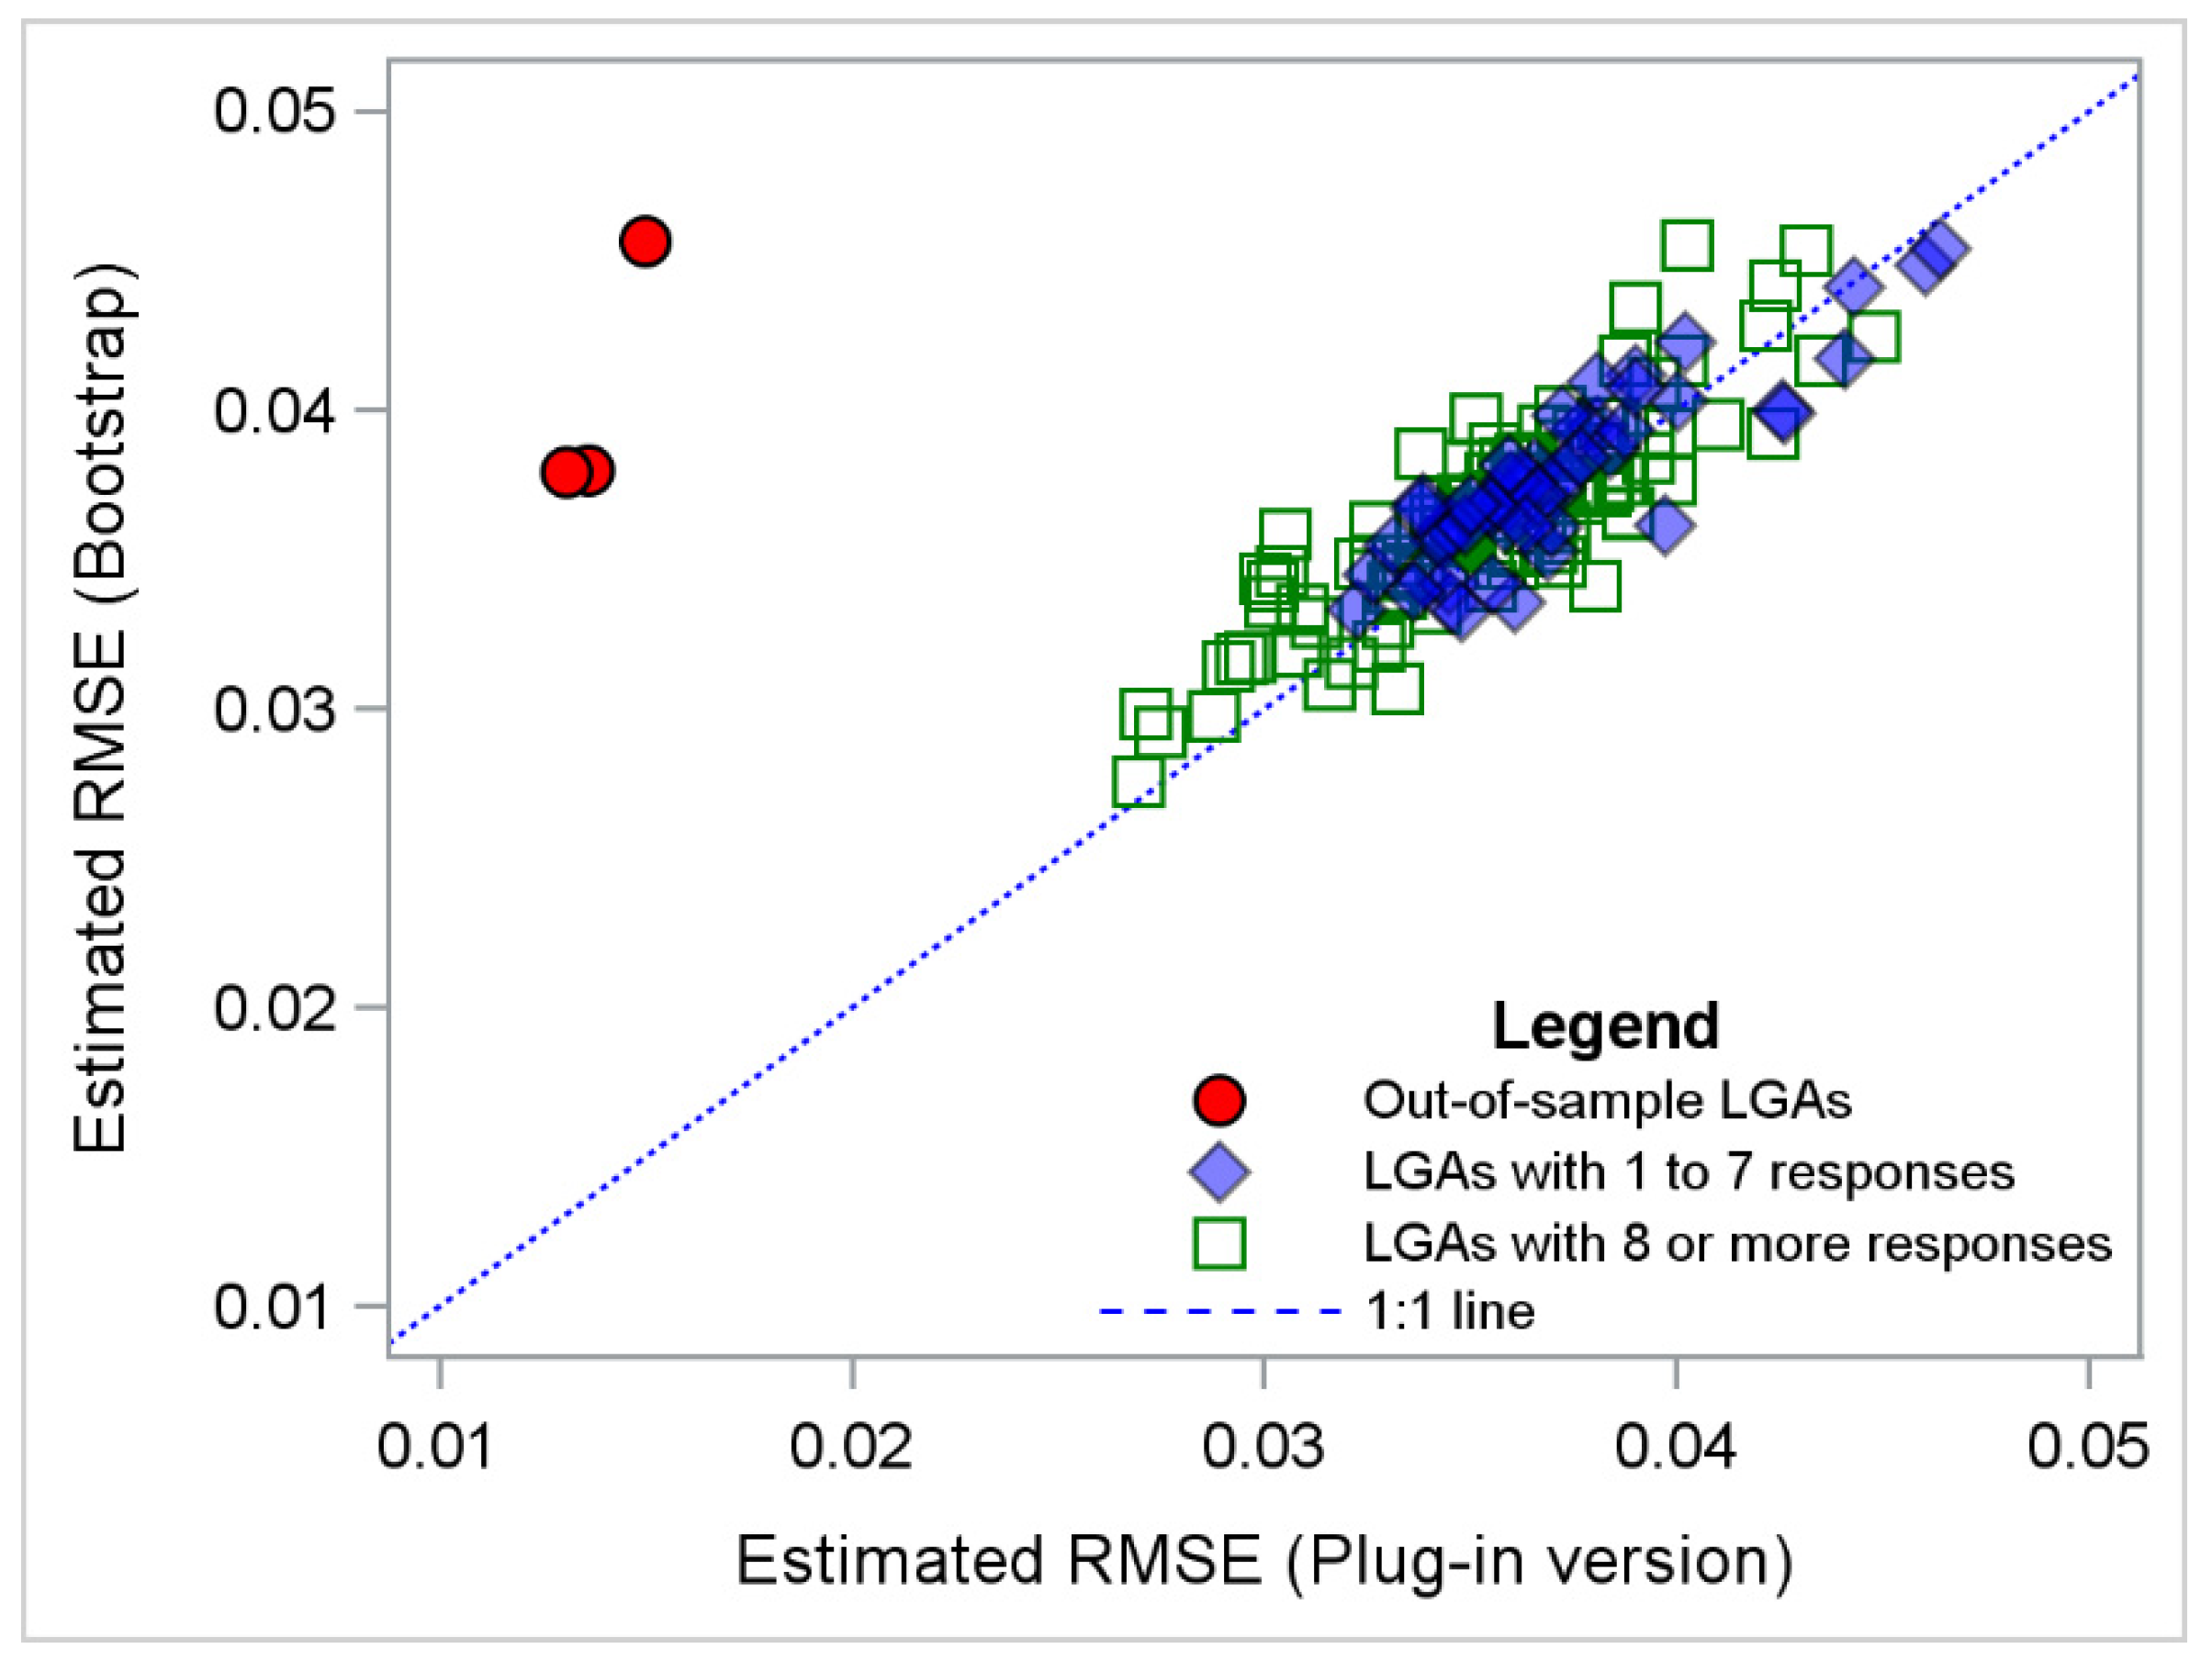
- When fitting the more appropriate EBP to the data from the NSWPHS, how do estimated RMSEs from a parametric bootstrap compare with the RMSEs of predictions obtained using the SAS GLIMMIX procedure?
- Does the parametric bootstrap for estimating RMSEs for the EBP provide sufficient improvement over using the estimated RMSEs created by the GLIMMIX procedure to require the additional time required to run the parametric bootstrap when presenting results?
2. Materials and Methods
2.1. Model and Parametric Bootstrap Estimation in SAS
2.2. Data Sources
2.3. Fitting the Models to the Data Sources
3. Results
3.1. Validation Using BHF Data
3.2. Estimated RMSE When Fitting EBLUP to Data from NSWPHS
3.3. Estimated RMSE When Fitting EBP to Data from the NSWPHS
4. Discussion
- The linear model may be the issue here. The outcome variable is binary in nature, and this may provide evidence that the linear model is not appropriate when the sample size is very small.
- It may indicate a breakdown of the SAS version of the Prasad-Rao estimate of RMSE. The Kenward-Roger method of variance estimation in SAS uses a Satterthwaite-type method to estimate the degrees of freedom. And the behavior of the Satterthwaite method of assessment has not been assessed fully when there are small sample sizes [16].
- The Taylor series linearization approximation process used to estimate the Prasad-Rao estimator of RMSE in SAS may not be accurate with small sample sizes.
Supplementary Materials
Author Contributions
Funding
Institutional Review Board Statement
Informed Consent Statement
Data Availability Statement
Acknowledgments
Conflicts of Interest
Appendix A. Steps to Create Parametric Bootstrap Estimate of MSE of EBLUP Estimator
- Fit the linear mixed model (Equation (A1)) to the data and save the values of and .where is the response of the person in the small area,
- is the sample size in the small area, , ,
- is the vector of covariate values from the survey,
- is the vector of regression coefficients,
- is a random effect reflecting area level effects, are independent N(0, ),
- are the random errors independent N(0, ).
- 2.
- For each area () generate a random area term from the distribution .
- 3.
- For each observation , generate a normal error term from the distribution .
- 4.
- Use Equation (A1) to simulate values of , using and generated in steps 2 and 3, together with the covariates and vector of regression coefficients, and with being the same as in the sample.
- 5.
- Fit the linear mixed model to the simulated values and obtain the EBLUP estimates for each simulation () for each area (Equation (A2)).where is the vector of covariates associated with the person in the small area, obtained from census or other origin, and assumed known without error.
- 6.
- Also, calculate the ‘true’ value of (Equation (A3)) associated with the simulation.
- 7.
- Repeat steps 2 to 6, K times (at least 1000 is suggested).
- 8.
- Calculate the bootstrap estimate of the MSE of the EBLUP estimator for the area using Equation (A4).
Appendix B. Steps to Create Parametric Bootstrap Estimate of MSE of EBP Estimator
- Fit the non-linear mixed model (Equation (A5)) to the data using a logit link with the required covariates and save the values of and .where is the response of the person in the small area, ,
- is the sample size in the small area, ,
- is the vector of covariate values from the survey,
- is the vector of regression coefficients
- is a random effect reflecting area level effects, are independent, ,
- 2.
- For each area () generate a random area term from the distribution .
- 3.
- Generate simulated values of . This is a two-step process.
- First, use Equation (A6) to calculate substituting generated in step 2, together with the observed value of covariates and vector of estimated regression coefficients from step 1.
- Create a random variable between 0 and 1, for the n observations. For each observation, if the random variable is less than then for the similation, otherwise .
- 4.
- Fit the same model as in step 1 to this set of simulated values, obtaining the estimated EBP for each area (Equation (A7)) associated with the simulation.
- 5.
- For each replicate also calculate the ‘true’ value, given the simulated value of the random error variance term (Equation (A8)).
- 6.
- Repeat steps 2 to 6, K times (at least 1000 is suggested).
- 7.
- Calculate the bootstrap estimate of the MSE of the EBP estimator for the area using Equation (A9).
References
- Williamson, M.; Baker, D.; Jorm, L. The NSW Health Survey Program Overview and Methods, 1996–2000. N. S. W. Public Health Bull. Suppl. Ser. 2001, 12, 1–31. [Google Scholar] [CrossRef] [PubMed]
- Hindmarsh, D.M.; Steel, D. Creating local estimates from a population health survey: Practical application of small area estimation methods. AIMS Public Health 2020, 7, 403–424. [Google Scholar] [CrossRef] [PubMed]
- Rao, J.N.K. Small Area Estimation (Methods and Applications), 1st ed.; John Wiley and Sons: Hoboken, NJ, USA, 2003; p. 137. [Google Scholar]
- Prasad, N.G.N.; Rao, J.N.K. On robust small area estimation using a simple random effects model. Surv. Methodol. 1999, 25, 67–72. [Google Scholar]
- Saei, A.; Chambers, R. Small Area Estimation under Linear and Generalized Linear Mixed Models with Time and Area Effects. S3RI Methodology Working Papers, M03/15 2001. Available online: https://eprints.soton.ac.uk/8165/1/8165-01.pdf (accessed on 28 June 2021).
- Hall, P.; Maiti, T. On parametric bootstrap methods for small area prediction. J. R. Stat. Soc. Ser. B Stat. Methodol. 2006, 68, 221–238. [Google Scholar] [CrossRef]
- Kreutzmann, A.-K.; Pannier, S.; Rojas-Perilla, N.; Schmid, T.; Templ, M.; Tzavidis, N. The R Package emdi for Estimating and Mapping Regionally Disaggregated Indicators. J. Stat. Softw. 2019, 91, 1–33. [Google Scholar] [CrossRef]
- Molina, I.; Marhuenda, Y. Sae: An R Package for Small Area Estimation. R J. 2015, 7, 81–98. [Google Scholar] [CrossRef]
- Molina, I.; Strzalkowska-Kominiak, E. Estimation of proportions in small areas: Application to the labour force using the Swiss Census Structural Survey. J. R. Stat. Soc. A 2020, 183 Pt 1, 281–310. [Google Scholar] [CrossRef]
- González-Manteiga, W.; Lombardía, M.J.; Molina, I.; Morales, D.; Santamaría, L. Bootstrap mean squared error of a small-area EBLUP. J. Stat. Comput. Simul. 2008, 78, 443–462. [Google Scholar] [CrossRef]
- Lahiri, S.N.; Maiti, T.; Katzoff, M.; Parsons, V. Resampling-based empirical prediction: An application to small area estimation. Biometrika 2007, 94, 469–485. [Google Scholar] [CrossRef][Green Version]
- Pereira, L.; Coelho, P. Assessing different uncertainty measures of EBLUP: A resampling-based approach. J. Stat. Comput. Simul. 2010, 80, 713–727. [Google Scholar] [CrossRef]
- Herrador, M.; Morales, D.; Esteban, M.; Sanchez, A.; Santamaria, L.; Marhuenda, Y.; Perez, A. Sampling design variance estimation of small area estimators in the Spanish Labour Force Survey. SORT-Stat. Oper. Res. Trans. 2008, 32, 177–197. [Google Scholar]
- Battese, G.E.; Harter, R.M.; Fuller, W.A. An error-components model for prediction of county crop areas using survey and satellite data. J. Am. Stat. Assoc. 1988, 83, 28–36. [Google Scholar] [CrossRef]
- Gomez-Rubio, V.; Best, N.; Richardson, S.; Li, G.; Clarke, P. Bayesian Statistics for Small Area Estimation; Technical Report (Unpublished); Imperial College London: London, UK, 2010; Available online: http://eprints.ncrm.ac.uk/1686/1/BayesianSAE.pdf (accessed on 28 June 2021).
- SAS Institute Inc. SAS/STAT 9.2 Users Guide, 2nd ed.; SAS Institute Inc.: Cary, NC, USA, 2009; Online Documentation. [Google Scholar]
- Mukhopadhyay, P.K.; McDowell, A. Small Area Estimation for Survey Data Analysis Using SAS Software. SAS Global Forum 2011 Paper 336-2011. 2011. Available online: http://support.sas.com/resources/papers/proceedings11/336-2011.pdf (accessed on 28 June 2021).
- Australian Bureau of Statistics. 2006 Census Community Profile Series: Basic Community Profile. Cat. No. 2001.0. 2007. Available online: https://www.abs.gov.au/websitedbs/censushome.nsf/home/communityprofiles?opendocument&navpos=230 (accessed on 28 June 2021).
- Glover, J.; Tennant, S. Social Health Atlas of New South Wales (incl. ACT) Local Government Areas. 2010. Electronic Report. Available online: https://phidu.torrens.edu.au/social-health-atlases/data-archive/data-archive-social-health-atlases-of-australia#social-health-atlas-of-australia-data-released-august-november-december-2011-by-statistical-local-area-local-government-area-based-on-the-asgc-2006-and-medicare-local (accessed on 28 June 2021).
- Hindmarsh, D.M. Small Area Estimation for Health Surveys. Doctoral Thesis, University of Wollongong: School of Mathematics and Applied Statistics, Wollongong, NSW, Australia, March 2013. Available online: https://ro.uow.edu.au/theses/3746 (accessed on 3 November 2021).
- Wu, P.; Jiang, J. Robust estimation of mean squared prediction error in small-area estimation. Can. J. Stat. 2021, 49, 362–396. Available online: https://doi-org.ezproxy.uow.edu.au/10.1002/cjs.11567 (accessed on 3 November 2021). [CrossRef]
- González-Manteiga, W.; Lombardía, M.J.; Molina, I.; Morales, D.; Santamaría, L. Estimation of the mean squared error of predictors of small area linear parameters under a logistic mixed model. Comput. Stat. Data Anal. 2007, 51, 2720–2733. [Google Scholar] [CrossRef]


| Source of Estimates of RMSE | Minimum | Median | Mean | Maximum |
|---|---|---|---|---|
| Plug-in (from procedure) | 1.3% | 3.5% | 3.5% | 4.6% |
| Parametric Bootstrap | 2.7% | 3.6% | 3.6% | 4.5% |
Publisher’s Note: MDPI stays neutral with regard to jurisdictional claims in published maps and institutional affiliations. |
© 2021 by the authors. Licensee MDPI, Basel, Switzerland. This article is an open access article distributed under the terms and conditions of the Creative Commons Attribution (CC BY) license (https://creativecommons.org/licenses/by/4.0/).
Share and Cite
Hindmarsh, D.; Steel, D. Estimating the RMSE of Small Area Estimates without the Tears. Stats 2021, 4, 931-942. https://doi.org/10.3390/stats4040054
Hindmarsh D, Steel D. Estimating the RMSE of Small Area Estimates without the Tears. Stats. 2021; 4(4):931-942. https://doi.org/10.3390/stats4040054
Chicago/Turabian StyleHindmarsh, Diane, and David Steel. 2021. "Estimating the RMSE of Small Area Estimates without the Tears" Stats 4, no. 4: 931-942. https://doi.org/10.3390/stats4040054
APA StyleHindmarsh, D., & Steel, D. (2021). Estimating the RMSE of Small Area Estimates without the Tears. Stats, 4(4), 931-942. https://doi.org/10.3390/stats4040054


