Article

Tagging Fluorescent Reporter to Epinecidin-1 Antimicrobial Peptide

by
Sivakumar Jeyarajan
1,2,
Harini Priya Ramesh
1,†,
Atchyasri Anbarasu
3,
Jayasudha Jayachandran
1 and
Anbarasu Kumarasamy
1,*
1
Microbial Biotechnology Laboratory, Department of Marine Biotechnology, Bharathidasan University, Tiruchirappalli 620024, Tamil Nadu, India
2
Transgenic Animal Model Core, Biomedical Research Core Facilities, University of Michigan, Ann Arbor, MI 48108, USA
3
Swamy Vivekananda Medical College Hospital and Research Institute, Tiruchengode 637205, Tamil Nadu, India
*
Author to whom correspondence should be addressed.
Equal first authorship.
Submission received: 13 June 2025 / Revised: 16 October 2025 / Accepted: 29 October 2025 / Published: 2 November 2025
(This article belongs to the Special Issue Feature Papers of J—Multidisciplinary Scientific Journal in 2025)

Abstract

In this study, we successfully cloned the fluorescent proteins eGFP and DsRed in-frame with the antimicrobial peptide epinecidin-1 (FIFHIIKGLFHAGKMIHGLV) at the N-terminal. The cloning strategy involved inserting the fluorescent reporters into the expression vector, followed by screening for positive clones through visual fluorescence detection and molecular validation. The visually identified fluorescent colonies were confirmed as positive by PCR and plasmid migration assays, indicating successful cloning. This fusion of fluorescent reporters with a short antimicrobial peptide enables real-time visualization and monitoring of the peptide’s mechanism of action on membranes and within cells, both in vivo and in vitro. The fusion of eGFP and DsRed to epinecidin-1 did not impair the expression or fluorescence of the reporter protein.

1. Introduction

Genetically encoded tags, such as fluorescent proteins, are powerful tools for studying the dynamics of proteins and peptides using fluorescence microscopy or any other fluorescence-based detection systems. The incorporation of a fluorescent tag as a reporter enables the precise localization of individual protein or peptide molecules within the microscopic resolution of cells. One of the most transformative developments in this field has been the discovery of green fluorescent protein (GFP), originally derived from the jellyfish Aequorea victoria [1]. GFP has revolutionized biological imaging and become an essential tool for observing cellular processes in vivo [2,3]. Since its introduction, extensive protein engineering has led to the development of a wide array of fluorescent proteins with diverse color palettes and enhanced properties [4]. This diverse spectrum of palettes derived from GFP exhibits significant variation in spectral characteristics, allowing for specialized applications in biological imaging [5]. The use of fluorescent proteins, particularly eGFP and DsRed from Discosoma striata, has enabled researchers to quantitatively analyze protein diffusion, exchange, and targeted localization in living cells, offering unprecedented insights into cellular dynamics [6].
Green fluorescent protein (GFP), composed of 238 amino acids, adopts a compact tertiary structure characterized by six alpha helices and eleven beta strands arranged in a β-barrel configuration, interconnected by flexible loops. The intrinsic fluorescence of GFP originates from a chromophore formed through the post-translational cyclization of a serine-tyrosine-glycine tripeptide, followed by oxidation of the tyrosine residue. Importantly, this process occurs autonomously, without the requirement of exogenous cofactors, substrates, or enzymatic activity, thereby facilitating its application in live-cell imaging [6]. GFP fusion constructs are typically generated by attaching the protein of interest to either the N- or C-terminus of GFP. Given the spatial proximity of these termini, they can be linked via short peptide sequences, preserving the structural integrity and fluorescence of the fusion protein. The exceptional stability of GFP under a wide range of chemical and physical conditions has further contributed to its widespread use as a molecular marker [7,8], particularly in Golgi apparatus and lysosomes. The versatility of GFP has enabled the real-time visualization of numerous cellular and developmental processes in vivo. These include, but are not limited to, gene expression profiling, subcellular protein localization, protein–protein interactions, cell cycle progression, chromosomal dynamics, intracellular trafficking, and organelle biogenesis [9,10]. Moreover, GFP can function as a reporter gene under the control of specific promoters, with fluorescence intensity serving as a direct proxy for transcriptional activity in living cells and tissues [11]. A significant advancement in GFP technology was the development of enhanced GFP (eGFP) through codon optimization, which improved expression efficiency and fluorescence intensity in a broad range of transgenic organisms [12]. These innovations have solidified GFP as an indispensable tool in molecular and cellular biology.
Antimicrobial peptides (AMPs) represent a structurally diverse and functionally versatile class of molecules, typically ranging from 12 to 50 amino acids in length, categorized into subgroups based on their amino acid composition and structural motifs [13]. The secondary structures of AMPs generally conform to one of four major types: (i) α-helical structures, (ii) β-stranded conformations stabilized by two or more disulfide bonds, (iii) β-hairpin or loop structures formed by a single disulfide bond and/or peptide cyclization, and (iv) extended conformations. Many AMPs are intrinsically unstructured in aqueous solution but undergo conformational folding upon interaction with biological membranes. This membrane-induced folding often results in amphipathic structures, where hydrophilic residues align along one face of the helix and hydrophobic residues along the opposite face, facilitating membrane association and disruption.
Antimicrobial peptides (AMPs) are evolutionarily conserved components of the innate immune system, present across a wide range of organisms including bacteria, plants, invertebrates, and vertebrates. They are also referred to as peptide antibiotics, due to exhibiting a broad spectrum of antimicrobial activity, and are less prone to inducing resistance compared to conventional antibiotics. Remarkably, many bacterial species have retained sensitivity to AMPs despite extensive evolutionary pressure. Unlike the adaptive immune system, which relies on immunological memory to mount specific and enhanced responses upon re-exposure to pathogens, AMPs function through a distinct, non-specific mechanism of action. Most AMPs are effective against a wide array of pathogens, making them particularly valuable for treating both localized and systemic infections [14,15]. Beyond their antimicrobial properties, several AMPs also exhibit immunomodulatory functions. For instance, defensins have been implicated in the recruitment of effector T cells to the sites of inflammation, thereby contributing to the effector phase of adaptive immunity [16]. These multifunctional characteristics make AMPs promising candidates for the development of novel therapeutic agents.
In this study, epinecidin-1, an antimicrobial peptide originally identified in orange groupers (Epinephelus coioides) which was reported to have antibacterial activity against both Gram-negative and Gram-positive bacteria [17,18,19] and antifungal properties [20,21,22], was cloned in-frame with eGFP and DsRed. As epinecidin-1 is a potent antimicrobial peptide, experimental validation of its mode of action is essential. The fluorescently tagged peptide serves as a good indicator of protein expression and allows us to monitor reactivity in intracellular localization in live cells.

2. Materials and Methods

2.1. Bacterial Strains, Vectors, and Reagents

The Escherichia coli (E. coli) DH5α strain was used for cloning. Restriction enzymes (BamHI, EcoRI, XhoI) and T4 DNA ligase were obtained from New England Biolabs (Ipswich, MA, USA). The plasmid vector pET-32a-Epi-1, previously described in [19], was used for cloning the eGFP and DsRed genes in the upstream of antimicrobial peptide Epi-1. Luria–Bertani (LB) broth and agar were purchased from Sigma-Aldrich (Millipore Sigma Burlington, MA, USA).

2.2. Preparation of Competent Cells and Transformation

Competent E. coli DH5α cells were prepared by growing a few colonies in 100 mL of LB broth to the mid-log phase, followed by chilling on ice for 15 min. Cells were harvested by centrifugation at 4000 rpm for 10 min at 4 °C, washed with 30 mL of ice-cold divalent cationic solution (80 mM MgCl2, 20 mM CaCl2), and centrifuged again. The pellet was washed with 10 mL of 100 mM CaCl2, centrifuged, and finally resuspended in 1 mL of 100 mM CaCl2. For transformation, 100 µL of competent cells were mixed with 10 ng of plasmid DNA, incubated on ice for 30 min, heat-shocked at 42 °C for 90 s, and returned to ice for 10 min. After recovery, 800 µL LB medium was added and incubated at 37 °C for 1 h, and then cells were plated on LB agar containing 100 µg/mL ampicillin and incubated overnight at 37 °C in an inverted position.

2.3. Plasmid Isolation

A single transformed colony was inoculated into 10 mL LB broth with 100 µg/mL ampicillin and incubated overnight at 37 °C with shaking. Cells were pelleted by centrifugation at 10,000 rpm for 10 min at 4 °C. The pellet was resuspended in 250 µL of Solution I (50 mM glucose, 25 mM Tris-HCl pH 8.0, 10 mM EDTA), followed by the addition of 250 µL of Solution II (0.2 N NaOH, 1% SDS). After gentle mixing, 350 µL of Solution III (5 mM potassium acetate with glacial acetic acid) was added. The lysate was centrifuged at 10,000 rpm for 5 min at 4 °C, and the supernatant was transferred to a fresh tube. Plasmid DNA was precipitated with 0.6 volumes of isopropanol, centrifuged, washed with 70% ethanol, air-dried, and resuspended in 50 µL of double-distilled water. DNA concentration was measured spectrophotometrically and stored at 4 °C (short-term) or −20 °C (long-term). The plasmids used were pET32a-Epi-1, peGFP-C1 (courtesy of Dr. J.Y. Chen, Academia Sinica, Taiwan), and pDsRed-C1 Monomer (Takara Bio, San Jose, CA, USA).

2.4. PCR Amplification of eGFP and DsRed

Target genes were amplified using the following primers: For eGFP amplification, forward (BamHI): 5′-GGCGTGGATCCATGGTGAGCAAGGGCGAGGAG-3′ and reverse (EcoRI): 5′-GATCCGAATTCCTTGTACAGCTCGTCCATGCCG-3′ primers were used. For DsRed amplification, forward (BamHI): 5′-CCATGGATCCATGGACAACACCGAG-3′ and reverse (EcoRI): 5′-GGTGGAATTCCTGGGAGCCGGAG-3′ primers were used. The restriction sites in the primers are italicized and underlined. PCR was performed using Taq polymerase (Takara, Japan). Products were resolved on 1.2% TAE agarose gel, visualized under UV light, and extracted using the QIAquick Gel Extraction Kit (Qiagen, Hilden, Germany).

2.5. Restriction Digestion of Vector and Insert

The PCR products and pET-32a-Epi-1 vector were simultaneously digested with BamHI and EcoRI (NEB) at 37 °C for 4 h. Digested products were resolved on 1% agarose gel, and the desired bands were excised and purified using the QIAquick Gel Extraction Kit.

2.6. Ligation and Transformation

Ligation reactions (10 µL) were set up using the digested vector and either eGFP or DsRed insert, incubated overnight at 16 °C. Five microliters of the ligation mix were used to transform 100 µL of competent E. coli DH5α cells, as described in Section 2.2.

2.7. Colony Patching, Screening and Validation

Transformed colonies were individually picked using sterile toothpicks and patched onto LB agar plates containing ampicillin. Colonies were arranged in a grid format and screened for the presence of inserts using colony PCR with gene-specific primers. After 48 h, colonies exhibited red and green fluorescence. For preliminary screening, NF (Non-Fluorescent) and F (Fluorescent) colonies were dissolved in 15 µL of sterile deionized water, boiled at 94 °C for 10 min, and centrifuged at 14,000 rpm for 10 min. The supernatant was used as the PCR template for amplification with eGFP or DsRed-specific primers (amplicon length 717 bp for eGFP and 685 bp for DsRed). Spanning PCR using fluorescent protein forward primer and Epi-1 reverse primer were used to confirm the correct orientation of the fluorescent reporter in-frame with Epi-1. The size of the amplicon for spanning PCR for eGFP-epi-1 is (717 + 84 = 801 bp) and for DsRed-Epi-1 is (685 + 84 = 769 bp). Plasmids were isolated from colonies as described in Section 2.3.

2.8. Overexpression, Fluorescent MEASUREMENT, and Purification of eGFP-epi-1 and Ds-Red-epi-1

To overexpress eGFP-epi-1 and DsRed-epi-1, both plasmids were transformed into E.coli C43(DE3) strain and plated on Luria–Bertani (LB) agar plates containing ampicillin (100 µg/mL).
To overexpress and measure the fluorescence intensity, a single colony was picked from the plate, inoculated in LB broth, and incubated overnight. From the overnight culture, 0.1% was used as inoculum into fresh medium and grown till OD600 of 0.6–0.8. One set of un-induced cells were harvested by centrifugation and other set was induced with 0.3 mM IPTG and harvested after 4 h. The harvested cell pellets were lysed with RIPA buffer and sonicated (5/5 s on/off cycle for 45 s at 40% Amplitude on QSONICA-500 Sonicator, Newtown, CT, USA). The fluorescence intensity of lysates was measured by dispensing the samples into individual wells of a microtiter plate and analyzing them using a Fluoroskan Ascent FL (Thermo Fisher Scientific, Waltham, MA, USA). Measurements were taken at excitation/emission wavelengths of 355/460 nm for eGFP and 485/538 nm for DsRed. The relative fluorescence intensities were plotted in a graph.
To analyze the overexpression profile, a single transformed colony was picked from the plate and inoculated in flasks containing 20 mL LB broth. The flasks were incubated at 30 °C in an orbital shaker at 250 rpm, cultured till mid-log phase (optical density OD600 of 0.6–0.8) and aliquots of 1 mL were collected as un-induced control. Induction was performed with 0.3 mM IPTG and aliquots of 1 mL culture were taken out at the 2nd, 3rd, and 4th hours, respectively, and pelleted by centrifugation at 10,000× g for 10 min at 4 °C. Supernatant (spent medium) was discarded. To the pellets, RIPA-lysis buffer (50 mM Tris-HCl (pH 7.4), 150 mM NaCl, 1% NP-40 and 1 mM EDTA) was added and sonicated to lyse the cells. The lysates were loaded on 12% Tris-glycine SDS-PAGE.

2.9. Antimicrobial Activity of eGFP-epi-1 and DsRed-epi-1

The antimicrobial activity of eGFP-epi-1 and DsRed-epi-1 were determined using the agar well diffusion method [23] with slight modifications. Mueller–Hinton agar (MHA) was dissolved in distilled water to a concentration of 38 g/L, sterilized and poured into sterile Petri dishes, and allowed to solidify. Using sterile cotton swab, Staphylococcus aureus (ATCC 25923) was spread onto MHA and allowed to dry; a 7 mm diameter hole was punched aseptically on the swabbed plate using a sterile cork borer. Fifty microliters at 100 µg concentration of AMPs was pipetted into the pierced hole. The buffer in which the proteins were present (50 mM Tris–HCl (pH 8.0)) served as the negative control and the ampicillin (100 µg/mL) served as the positive control. The plates were then placed in an upright position at 37 °C in an incubator overnight to evaluate the antimicrobial activity of AMPs. The zone of inhibition diameter was measured in millimeters (mm).

3. Results

3.1. Construction of Fluorescent Epi-1 Vector

In our previous studies, we cloned the Epi-1 gene into the pET32a vector for antimicrobial peptide overexpression. To that vector, eGFP and DsRed genes were inserted between BamH1 and EcoRI sites. The schematic of the constructs is shown in Figure 1. The genes are driven by the T7 promoter to express in the bacterial host. The start codon is in the thioredoxin protein, followed by His-Tag for purification, followed by the enterokinase site for cleavage. The fluorescent reporter eGFP or DsRed is after the enterokinase cleavage site. The thioredoxin helps in protein expression because of its chaperone properties. The thioredoxin protein can be removed by cleaving with enterokinase and captured by the His-Tag binding resin releasing the fluorescent tagged Epi-1. The advantage of this vector is the thioredoxin gene; if not needed, it can be removed by NdeI enzyme digestion [24] so that only the eGFP and antimicrobial peptide gene will be in-frame and can be purified by His-Tag affinity chromatography. After the active epi-1 gene, a stop codon is present. Following the stop codon is the T7-terminator signal to terminate the transcription. The size of pET32a-Epi-1 vector before fluorescent reporter gene ligation is 5944 bp. After ligation of the eGFP insert (717 bp) and the DsRed insert (685 bp), the resultant pET32a-eGFP-epi clone is 6661 bp and the pET32a-DsRed-epi-1 clone is 6629 bp. As shown in the figure, the Epi-1 following the fluorescent protein is shown in pink. The expression cassette contains a stop codon after the Epi-1 gene followed by a T7 termination signal to stop transcript synthesis after completion of the synthesis of the required portion.

3.2. Visual Screen of Fluorescent Reporter Epi-1 Clones

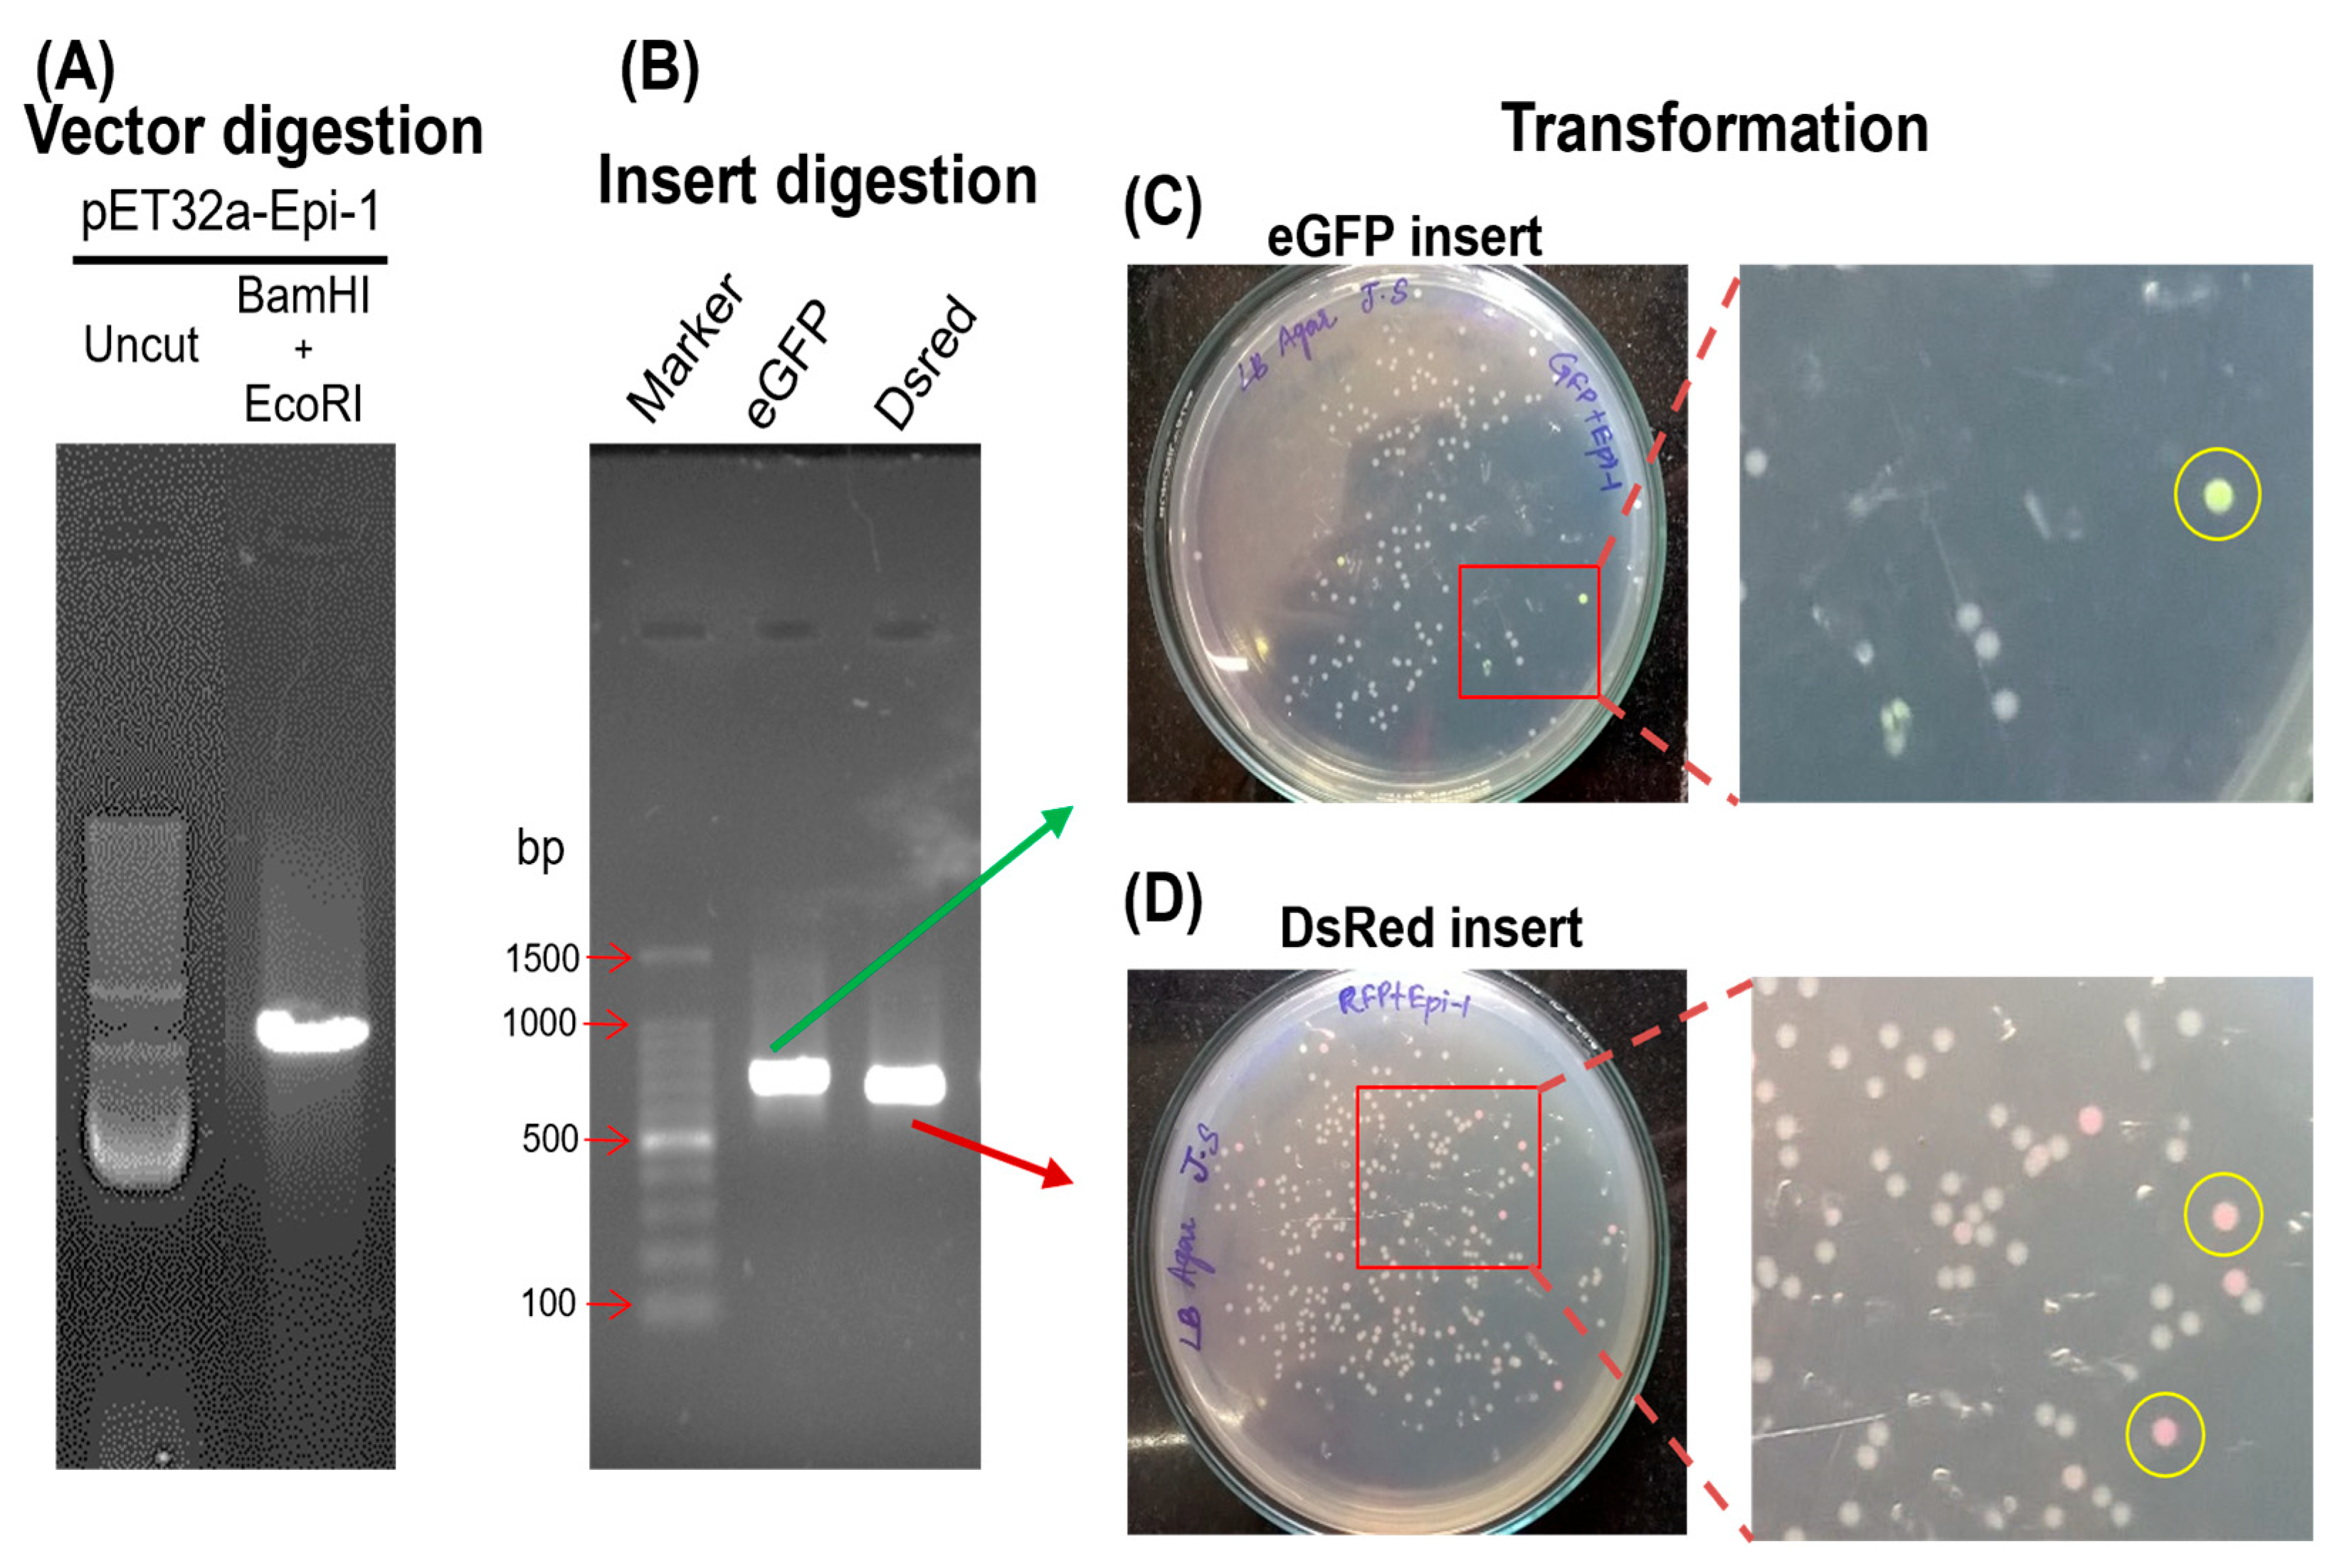
After the molecular cloning, the strategies were designed for incorporating the fusion fluorescent reporter genes to Epi-1, and the pET32a-Epi-1 vector was digested using the restriction enzymes BamHI and EcoRI, resulting in a single linear DNA band. The eGFP and DsRed inserts were PCR-amplified from peGFP-C1 and pDsRed-Monomer-C1 from Clonetech. The amplified products were also digested with the same enzyme pair of restriction enzymes. The ligation of inserts to the pET32a-Epi-1 vector yielded numerous colonies after spreading on the LB agar plate. After 48 h, the fluorescence in colonies were observed as shown in Figure 2; the enlarged plate photographs show a clear distinction between fluorescent and non-fluorescent colonies. The fluorescent colonies were subjected to PCR and plasmid isolation. Simultaneously the non-fluorescent colonies were used for molecular characterization as controls.

3.3. Validation of Visually Fluorescent Colonies by Molecular Techniques

To validate the visually screened fluorescent bacterial clones, molecular techniques such as PCR and plasmid migration assays (Figure 3) were performed. Insert-specific and spanning PCR resulted in fluorescent colonies containing bands in agarose gel, while the non-fluorescent colonies did not show any band in gel. Likewise, the plasmid migration assay was performed for the fluorescent and non-fluorescent colonies and reflected the result obtained from PCR. The fluorescent colony showed slower migration of plasmids compared to the non-fluorescent colony. This is because the fluorescent gene insert caused a bigger plasmid size compared to the vector alone.

3.4. Fluorescence Quantitation of Overexpressed eGFP-epi-1 and DsRed-epi-1

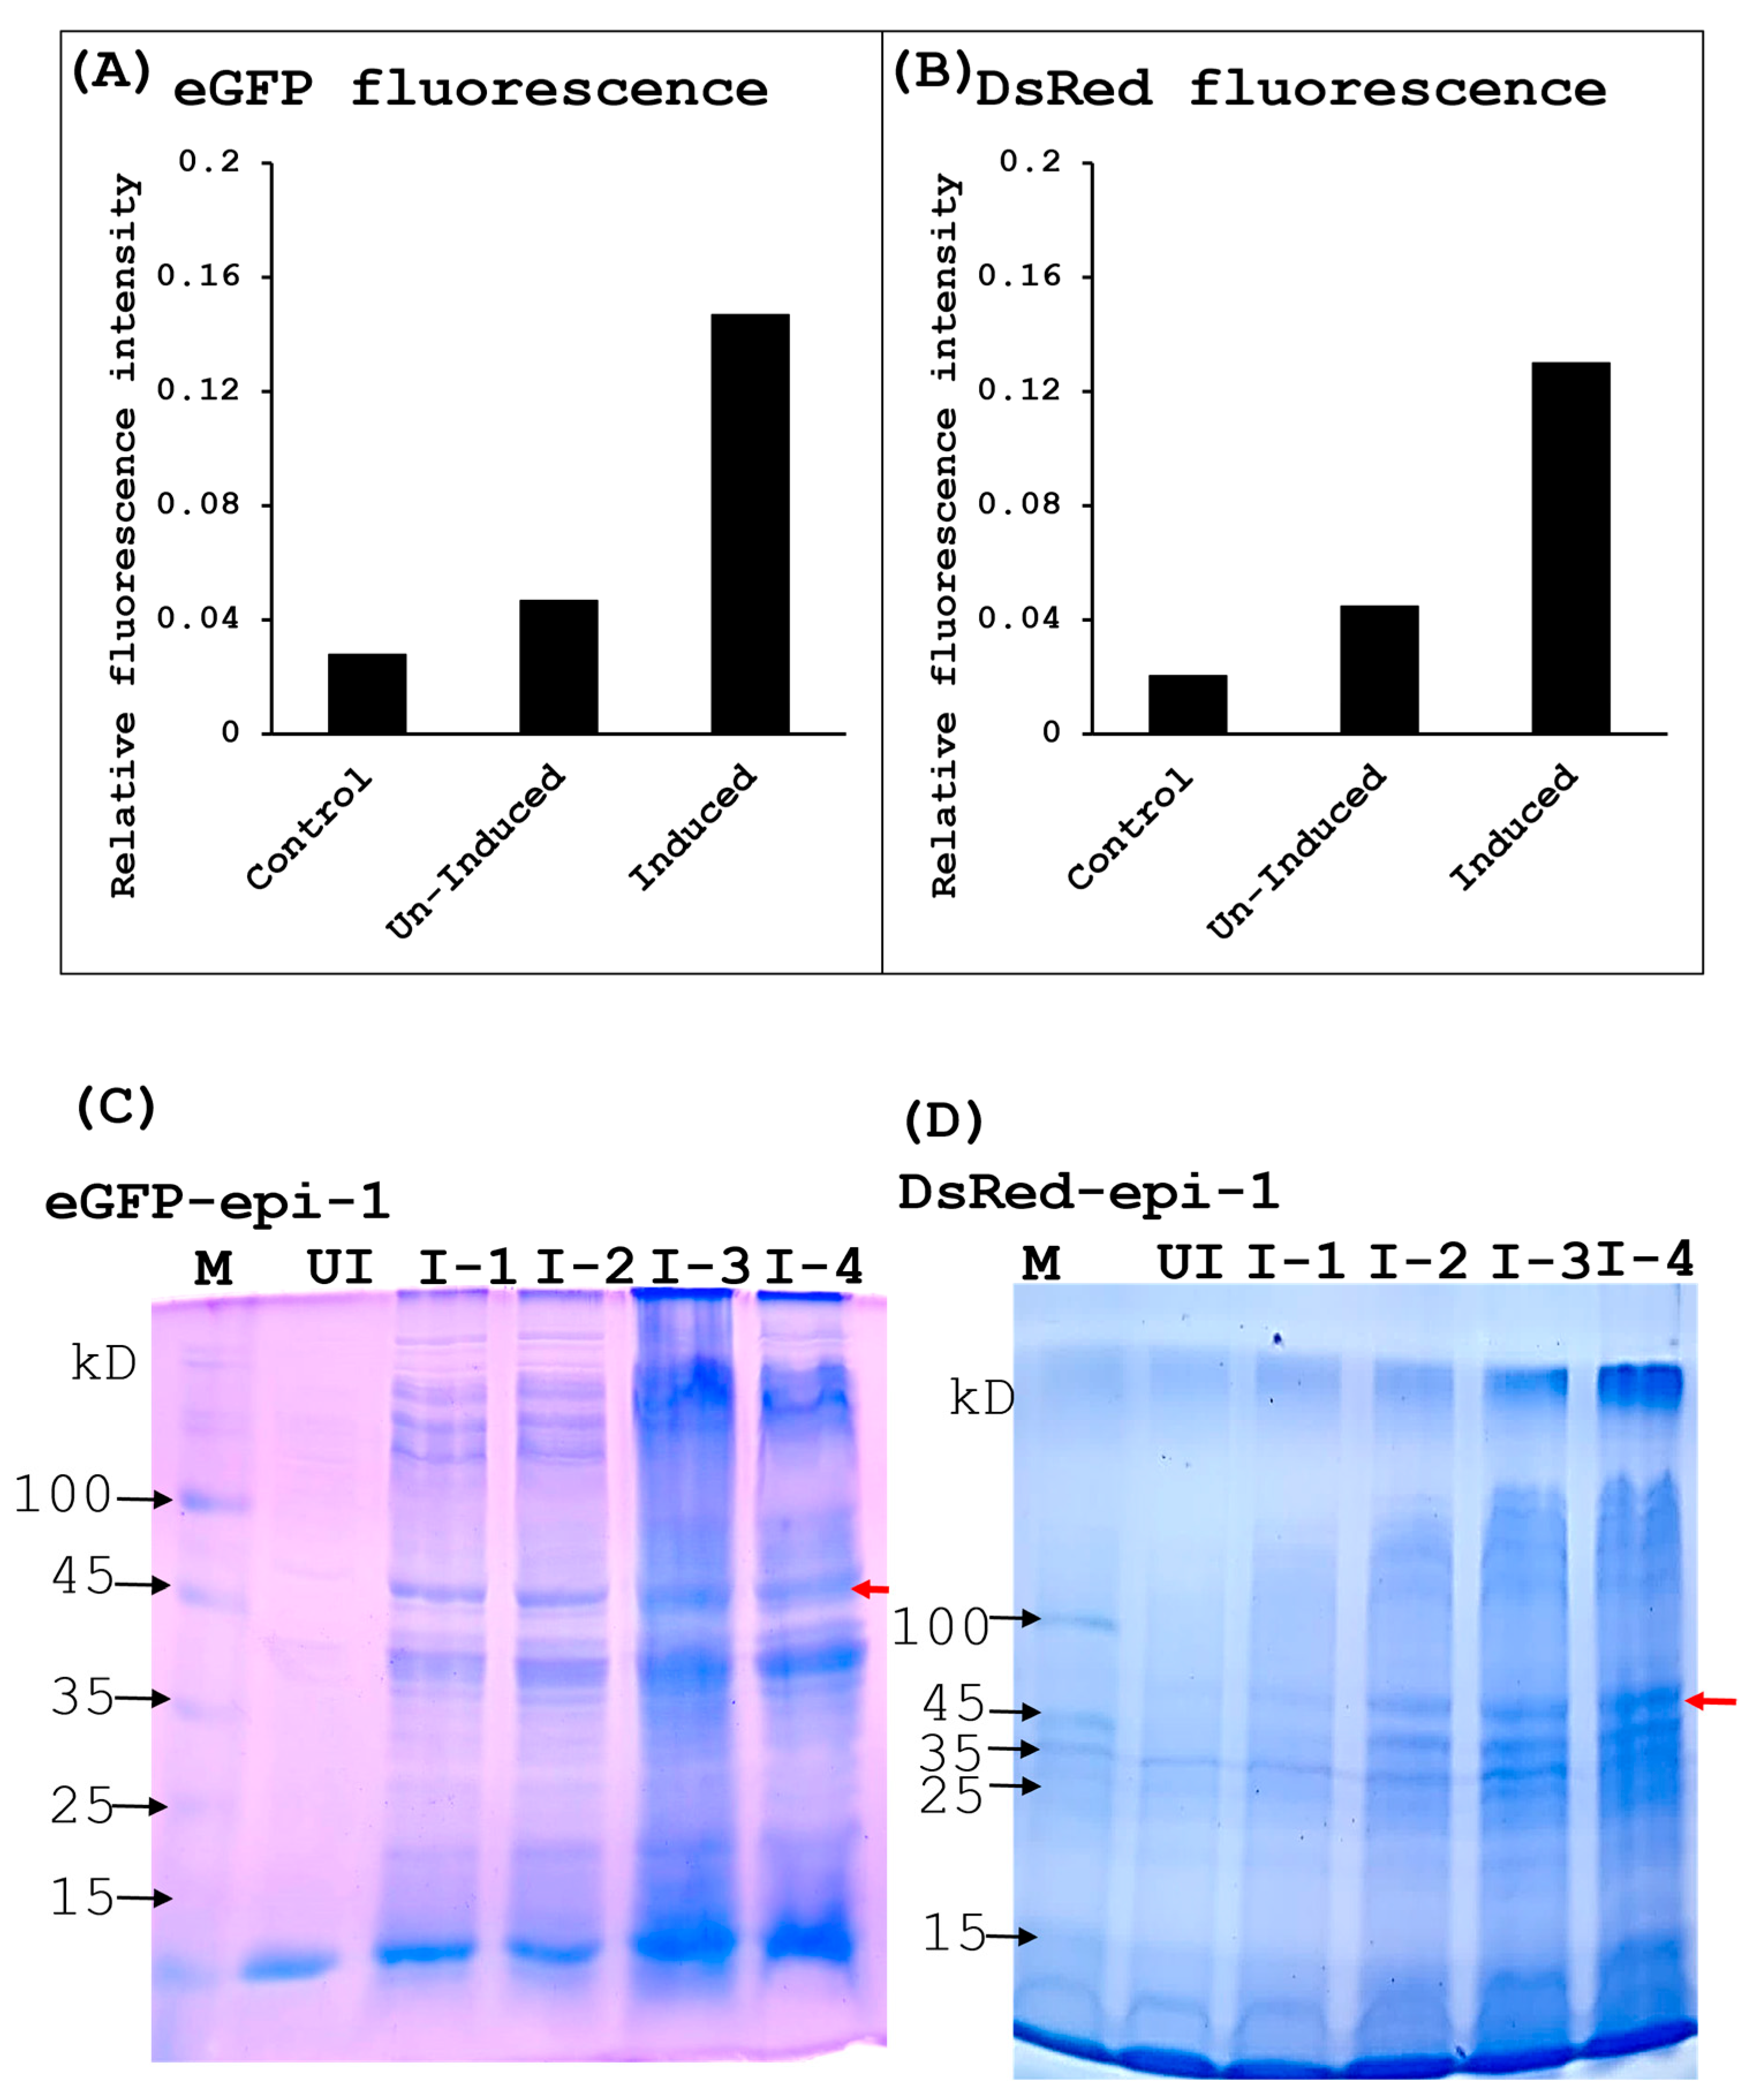
To overexpress the fusion proteins eGFP-epi-1 and DsRed-epi-1, the respective plasmids were transformed into E. coli C43(DE3) and plated on LB agar containing ampicillin (100 µg/mL). Fluorescence measurement (Figure 4A,B) shows that induced samples exhibit the highest fluorescence intensity, followed by un-induced samples, while control samples show minimal baseline signal. This confirms successful significant levels of expression in the fluorescent tagged peptides upon IPTG induction.
The SDS-PAGE electrophoretic panel (Figure 4C,D) show un-induced and induced lanes. The IPTG induced lane shows a distinct protein band at the expected molecular weight (~45 kD), confirming the successful expression of the fusion tagged peptides. In contrast, un-induced samples show faint or no visible bands, indicating minimal protein production without induction. Collectively, IPTG induction leads to a marked increase in both fluorescence signal and protein expression, validating the functionality of the inducible system and the successful production of the fluorescent tagged epinecidin-1.

3.5. eGFP-epi-1 and Ds-Red-epi-1 Functional Bioactivity

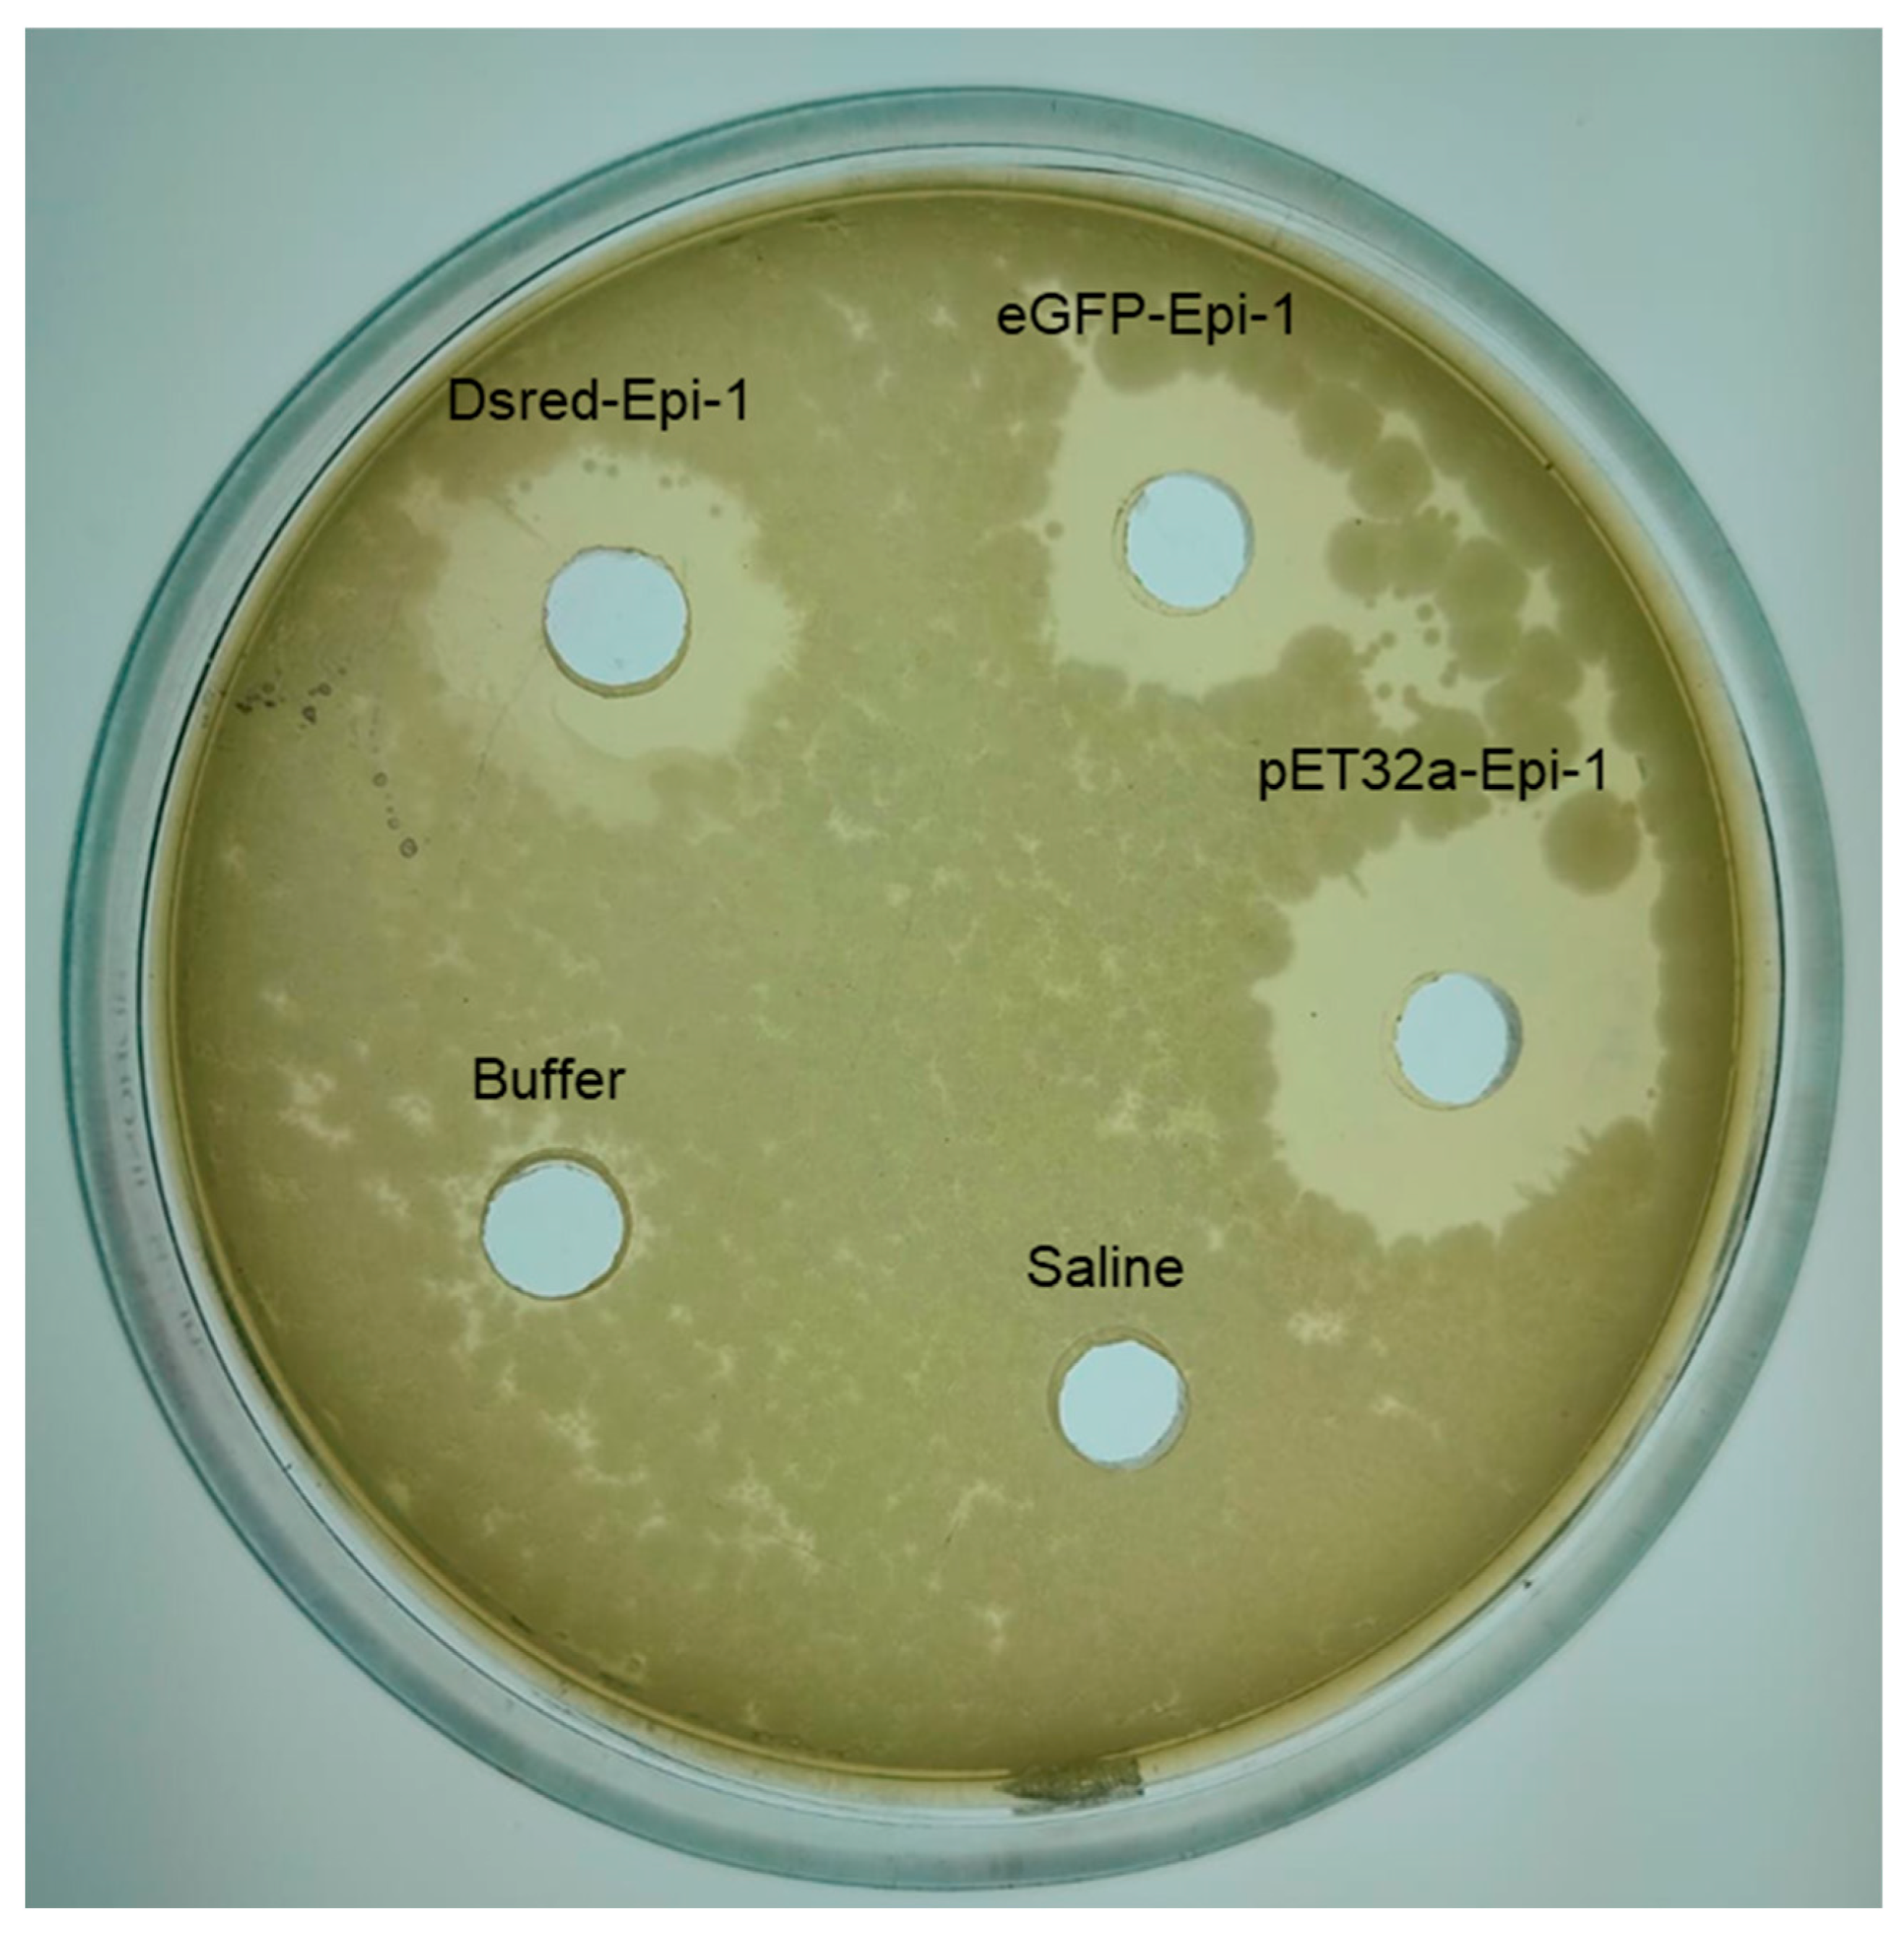
To validate the bioactivity of eGFP-Epi-1 and DsRed-Epi-1, an agar well diffusion assay was performed using Staphylococcus aureus (ATCC 25923). Figure 5 illustrates the assay results, including wells containing buffer (vehicle control), saline (growth control), and epinecidin-1 protein expressed from pET32a-Epi, as well as the fusion proteins eGFP-Epi-1 and DsRed-Epi-1. Clear zones of inhibition were observed around the wells containing pET32a-Epi, eGFP-Epi-1, and DsRed-Epi-1, indicating antibacterial activity. These results suggest that fusion of epinecidin-1 with fluorescent tags (eGFP or DsRed) does not compromise the antimicrobial function of the peptide.

4. Discussion

This study outlines the rationale and advantages behind the design of fluorescent protein-based DNA constructs for the purpose of screening, fusion tag, overexpression, and reporter assays for studying the dynamic function of small antimicrobial peptides (AMPs) epinecidin-1.
The high costs associated with chemical synthesis and low yields obtained from natural sources have prompted the exploration of recombinant bacterial expression systems as a more viable alternative for AMPs production. Cationic AMPs pose a significant challenge in therapeutic development due to the need for the large-scale production of highly purified compounds at competitive costs. Although chemical synthesis can produce both natural and modified cationic peptides, it is often prohibitively expensive and involves the use of hazardous reagents. In contrast, recombinant expression in host cells offers a more efficient and environmentally sustainable approach. Various recombinant systems have been explored for AMP production, including Escherichia coli [25], insect cells, transgenic mammals, and plants [26]. Each of these systems presents unique advantages, and the success of any one could enable scalable, cost-effective AMP production without the environmental burden of chemical synthesis. The key advantage of recombinant technology lies in its potential for long-term, sustainable peptide production—something that chemical synthesis cannot reliably offer. AMPs and newly designed chimeric AMPs with multifunctions are produced in a bacterial host via molecular cloning techniques. AMPs such as hepcidin, LL-37 [27], cecropin-melittin hybrid [28] , indolicidin [29], serpin [30], crustin, lactoferricin [31], etc., were produced by recombinant expression.
In general, it is difficult to produce antimicrobial peptides in cassette vector because of their short peptide sequence, cationicity, unusual structure, and high pI. In addition to the aforementioned factors, the toxicity of small peptides [32,33,34] against bacterial host cells and their susceptibility to proteolytic degradation hinder the overexpression of small peptides. These problems can be overcome by the expression of a peptide gene in fusion with a larger protein, followed by enzymatic or chemical cleavage to release the active peptide [26]. The fusion partner serves to neutralize the positive charge of the peptide while providing some protection against proteolysis. In one study, Morin et al. [29] inserted a linker of a short negatively charged spacer peptide sequence that helped to neutralize the cations of the AMPs, which facilitated the expression in the bacterial host. In the earlier reviews by [35,36,37], a comprehensive list of carrier proteins used for the expression of AMPs is described. Carrier proteins can be classified as solubility-enhancing carriers, aggregation-promoting carriers, self-cleavable carriers, and secretion signal carriers [38,39,40]. Solubility-enhancing carriers can establish the fusion protein in soluble form in the host cytoplasm, for example, Thioredoxin and glutathione transferase (GST). On the other hand, the aggregation-promoting carrier proteins are reported to be more efficient than solubility-enhancing carrier proteins in protecting the host and masking the peptides from harming the host and segregating into inclusion bodies, which helps with easy isolation and quick purification. PurF fragment, ketosteroidisomerase, PaP3.30, and TAF12 histone fold domain [36] are some of the examples of such a category.
The goal of this study is to design a construct that expresses a single fusion gene of GFP and AMP that can be overexpressed as a fusion protein and used for localization of peptide within the live cells via confocal microscopy. In this case, the AMP is epinecidin-1, fused with eGFP and DsRed at its N-terminus. GFP has been reported as a more stable carrier protein for expressing AMPs [41] and it has a unique property of allowing its detection within the live cells. In one study, GFP fused small AMPs such as tachyplesin partitions into inclusion bodies, facilitating easy purification [42] and helping with the extraction of small polypeptides with physiological buffers.
For the purpose of screening, bacterial transformants carrying a recombinant plasmid with the gene of interest has become more rapid and simple because it can be visually detected. GFP as a fluorescent probe lacks the requirement for an exogenous cofactor [43]. GFP can be expressed in intact tissues and processes can be monitored without the disturbance caused by the introduction of reagents. This saves time and money, and more importantly, less effort and manpower are needed to screen for the correct clones. In this study, we cross-verified the fluorescent colonies with gene-specific and spanning PCR compared to the non-fluorescent colonies. The fluorescent colonies had the insert in the correct orientation.
As a biological marker, eGFP or DsRed expression are visually observable when expressed in bacteria. The use of GFP as a tag does not alter the normal function or localization of the peptide or protein [44]. GFP is broadly used in almost all organisms and all major cellular compartments. In cellular biology, GFP has been used as reporter gene, cell marker, fusion tag, indicator for protease action, calcium sensitizer [45,46], etc. GFP can also be called a tracker molecule since it has been used in intracellular trafficking applications, such as determining the migration dynamics of proteins within subcellular sites, acting as sensors of neuronal membrane potential, etc. It is easy to find out where GFP is at any given time by shining ultraviolet light. For instance, GFP attached to AMPS can be actively monitored through green glow inside the host (helps with answering questions such as whether it reaches the cytoplasm/membrane/any specific organelle).
GFP cloned in an expression vector can be screened for positive clones with the luminescence observed with the naked eye. The intensity of fluorescence would also indicate the extent of solubility of the fusion protein. Banerjee et al. [47] have shown that the solubility of the target protein can be predicted in situ at the time of recombinant screening based on the intensity of the GFP fusion proteins. They demonstrated that the higher the solubility of the target protein, the higher the intensity of the GFP fluorescence on the agar plate, rendering the screening of the recombinants a dual objective of identification and predicting the solubility of the gene of interest attached to the reporter gene. If the fusion protein is expressed as an insoluble aggregate, the E. coli has shown less or no luminescence [48]. The soluble E. coli protein exhibits a higher intensity of luminescence or fluorescence. Thus, with this one molecule, multiple functionalities can be studied.
The successful overexpression of fusion proteins eGFP-Epi-1 and DsRed-Epi-1 in E. coli C43(DE3) was confirmed through both fluorescence analysis and SDS-PAGE electrophoresis. Fluorescence measurements demonstrated a clear increase in signal intensity upon IPTG induction, indicating that the fusion proteins were effectively overexpressed and retained their fluorescent properties. SDS-PAGE analysis corroborated these findings, with distinct protein bands appearing at the expected molecular weight (~45 kDa) in the IPTG induced samples. The bioactivity of the fusion proteins using an agar well diffusion assay on Staphylococcus aureus (ATCC 25923) shows the presence of clear zones of inhibition around wells containing pET32a-Epi-1, eGFP-Epi-1, and DsRed-Epi-1 indicating that all three constructs possess antimicrobial activity. Importantly, the fusion of epinecidin-1 with fluorescent tags (eGFP or DsRed) did not abolish its antibacterial function, suggesting that the fusion proteins retain the bioactive conformation of epinecidin-1.
In investigating the functionalities of GFP or DsRed as a carrier protein we have successfully cloned the fluorescent eGFP gene and DsRed gene in-frame with epinecidin-1 using a recombinant molecular biology technique and ascertained the presence of genes in-frame. These clones were subsequently involved in experiments regarding overexpression and purification. One of the challenges associated with expression is the expression of AMPs in soluble form. At the initial time points, as the protein was expressed in lower quantities, a bright fluorescence was observed. However, when the plates were incubated for a long time, a drop in fluorescent signal was observed, which may be a sign of cell death due to a higher expression of antimicrobial peptides. This will be a drawback when aiming for expression in large bioreactors. Hence, continuous batch collection harvest will need to be devised for optimum harvest of the desired protein.

5. Conclusions

In this study, eGFP-Epi-1 and DsRed-Epi-1 were successfully constructed using molecular cloning methods, confirmed using PCR, fluorescence expression, and plasmid migration assay, and their bioactivity was examined.

Supplementary Materials

The following supporting information can be downloaded at https://www.mdpi.com/article/10.3390/j8040042/s1, Figure S1: The original vector digestion agarose gel image; Figure S2: (a) PCR to validate the eGFP-epi-1, (b) Plasmid migration assay to validate the eGFP-epi-1, (c) PCR to validate the DsRed-epi-1, (d) Plasmid migration assay to validate the DsRed-epi-1.

Author Contributions

Conceptualization: S.J. and A.K.; methodology: S.J., H.P.R., A.A., J.J., and A.K.; validation, S.J., J.J., and A.K.; formal analysis, S.J., J.J., and A.K.; investigation, A.K.; resources, S.J., and A.K.; data curation, S.J., J.J., and A.K.; writing—original draft preparation, S.J., J.J., H.P.R., and A.K.; writing—review and editing, S.J., J.J., H.P.R., A.A., and A.K.; visualization, S.J. and A.K.; supervision, A.K.; project administration, A.K.; funding acquisition, S.J. and A.K. All authors have read and agreed to the published version of the manuscript.

Funding

Indian Council of Medical Research, Govt. of India, New Delhi—Ref. No. ICMR-IIRPSG-2024-01-01898.

Data Availability Statement

The original contributions presented in this study are included in the article/Supplementary Material. Further inquiries can be directed to the corresponding authors.

Acknowledgments

We thank Indian Council of Medical Research, Govt. of India, New Delhi for partial financial support via the sanctioned research project to the corresponding author (Ref. No. ICMR-IIRPSG-2024-01-01898).

Conflicts of Interest

The authors declare no conflict of interest.

References

  1. Shimomura, O.; Johnson, F.H.; Saiga, Y. Extraction, Purification and Properties of Aequorin, a Bioluminescent Protein from the Luminous Hydromedusan, Aequorea. J. Cell Comp. Physiol. 1962, 59, 223–239. [Google Scholar] [CrossRef]
  2. Kahana, J.A.; Silver, P.A. Use of the A. Victoria Green Fluorescent Protein to Study Protein Dynamics in Vivo. Curr. Protoc. Pharmacol. 2001, 14, 5–15. [Google Scholar] [CrossRef]
  3. Shaner, N.C.; Lambert, G.G.; Chammas, A.; Ni, Y.; Cranfill, P.J.; Baird, M.A.; Sell, B.R.; Allen, J.R.; Day, R.N.; Israelsson, M.; et al. A Bright Monomeric Green Fluorescent Protein Derived from Branchiostoma Lanceolatum. Nat. Methods 2013, 10, 407–409. [Google Scholar] [CrossRef]
  4. Kremers, G.-J.; Gilbert, S.G.; Cranfill, P.J.; Davidson, M.W.; Piston, D.W. Fluorescent Proteins at a Glance. J. Cell Sci. 2011, 124, 157–160. [Google Scholar] [CrossRef]
  5. Stepanenko, O.V.; Verkhusha, V.V.; Kuznetsova, I.M.; Uversky, V.N.; Turoverov, K.K. Fluorescent Proteins as Biomarkers and Biosensors: Throwing Color Lights on Molecular and Cellular Processes. Curr. Protein Pept. Sci. 2008, 9, 338–369. [Google Scholar] [CrossRef]
  6. Lippincott-Schwartz, J.; Snapp, E.; Kenworthy, A. Studying Protein Dynamics in Living Cells. Nat. Rev. Mol. Cell Biol. 2001, 2, 444–456. [Google Scholar] [CrossRef] [PubMed]
  7. Kjer-Nielsen, L.; van Vliet, C.; Erlich, R.; Toh, B.H.; Gleeson, P.A. The Golgi-Targeting Sequence of the Peripheral Membrane Protein P230. J. Cell Sci. 1999, 112 Pt 11, 1645–1654. [Google Scholar] [CrossRef] [PubMed]
  8. Saint-Jore, C.M.; Evins, J.; Batoko, H.; Brandizzi, F.; Moore, I.; Hawes, C. Redistribution of Membrane Proteins between the Golgi Apparatus and Endoplasmic Reticulum in Plants Is Reversible and Not Dependent on Cytoskeletal Networks. Plant J. 2002, 29, 661–678. [Google Scholar] [CrossRef] [PubMed]
  9. Atkins, D.; Izant, J.G. Expression and Analysis of the Green Fluorescent Protein Gene in the Fission Yeast Schizosaccharomyces Pombe. Curr. Genet. 1995, 28, 585–588. [Google Scholar] [CrossRef]
  10. Rizzuto, R.; Brini, M.; Pizzo, P.; Murgia, M.; Pozzan, T. Chimeric Green Fluorescent Protein as a Tool for Visualizing Subcellular Organelles in Living Cells. Curr. Biol. 1995, 5, 635–642. [Google Scholar] [CrossRef]
  11. Dabrowski, S.; Brillowska-Dabrowska, A.; Kur, J. Fluorescent Protein Vector for Directional Selection of PCR Clones. Biotechniques 2000, 29, 800–808. [Google Scholar] [CrossRef]
  12. Okabe, M.; Ikawa, M.; Kominami, K.; Nakanishi, T.; Nishimune, Y. “Green Mice” as a Source of Ubiquitous Green Cells. FEBS Lett. 1997, 407, 313–319. [Google Scholar] [CrossRef]
  13. Bahar, A.A.; Ren, D. Antimicrobial Peptides. Pharmaceuticals 2013, 6, 1543–1575. [Google Scholar] [CrossRef] [PubMed]
  14. Thankappan, B.; Jeyarajan, S.; Hiroaki, S.; Anbarasu, K.; Natarajaseenivasan, K.; Fujii, N. Antimicrobial and Antibiofilm Activity of Designed and Synthesized Antimicrobial Peptide, KABT-AMP. Appl. Biochem. Biotechnol. 2013, 170, 1184–1193. [Google Scholar] [CrossRef] [PubMed]
  15. Thankappan, B.; Sivakumar, J.; Asokan, S.; Ramasamy, M.; Pillai, M.M.; Selvakumar, R.; Angayarkanni, J. Dual Antimicrobial and Anticancer Activity of a Novel Synthetic α-Helical Antimicrobial Peptide. Eur. J. Pharm. Sci. 2021, 161, 105784. [Google Scholar] [CrossRef] [PubMed]
  16. Fu, J.; Zong, X.; Jin, M.; Min, J.; Wang, F.; Wang, Y. Mechanisms and Regulation of Defensins in Host Defense. Signal Transduct. Target. Ther. 2023, 8, 300. [Google Scholar] [CrossRef]
  17. Jeyarajan, S.; Peter, A.S.; Ranjith, S.; Sathyan, A.; Duraisamy, S.; Kandasamy, I.; Chidambaram, P.; Kumarasamy, A. Glycine-Replaced Epinecidin-1 Variant Bestows Better Stability and Stronger Antimicrobial Activity against a Range of Nosocomial Pathogenic Bacteria. Biotechnol. Appl. Biochem. 2024, 71, 1384–1404. [Google Scholar] [CrossRef]
  18. Jeyarajan, S.; Peter, A.S.; Sathyan, A.; Ranjith, S.; Kandasamy, I.; Duraisamy, S.; Chidambaram, P.; Kumarasamy, A. Expression and Purification of Epinecidin-1 Variant (Ac-Var-1) by Acid Cleavage. Appl. Microbiol. Biotechnol. 2024, 108, 176. [Google Scholar] [CrossRef]
  19. Jeyarajan, S.; Sathyan, A.; Peter, A.S.; Ranjith, S.; Duraisamy, S.; Natarajaseenivasan, S.M.; Chidambaram, P.; Kumarasamy, A. Bioproduction and Characterization of Epinecidin-1 and Its Variants Against Multi Drug Resistant Bacteria Through In Silico and In Vitro Studies. Int. J. Pept. Res. Ther. 2023, 29, 66. [Google Scholar] [CrossRef]
  20. Jeyarajan, S.; Kumarasamy, A. (PDF) Anti-Candida and Antibiofilm Activity of Epinecidin-1 and Its Variants. Available online: https://www.researchgate.net/publication/383685655_Anti-Candida_and_antibiofilm_activity_of_epinecidin-1_and_its_variants (accessed on 29 October 2025).
  21. Jeyarajan, S.; Kumarasamy, A. (PDF) Antifungal Activity of Protamine. Available online: https://www.researchgate.net/publication/386541174_Antifungal_activity_of_protamine (accessed on 29 October 2025).
  22. Jeyarajan, S.; Ranjith, S.; Veerapandian, R.; Natarajaseenivasan, K.; Chidambaram, P.; Kumarasamy, A. Antibiofilm Activity of Epinecidin-1 and Its Variants Against Drug-Resistant Candida Krusei and Candida Tropicalis Isolates from Vaginal Candidiasis Patients. Infect. Dis. Rep. 2024, 16, 1214–1229. [Google Scholar] [CrossRef]
  23. Bauer, A.W.; Kirby, W.M.; Sherris, J.C.; Turck, M. Antibiotic Susceptibility Testing by a Standardized Single Disk Method. Am. J. Clin. Pathol. 1966, 45, 493–496. [Google Scholar] [CrossRef] [PubMed]
  24. Novagen. pET System Manual. In: Novagen (Ed .11). 2005. Available online: https://kirschner.med.harvard.edu/files/protocols/Novagen_petsystem.pdf (accessed on 15 October 2025).
  25. Jeyarajan, S.; Ranjith, S.; Thankappan, B.; Kumarasamy, A. A Step-by-Step Guide for Biosynthesis of Recombinant Fusion Antimicrobial Peptide and Release of the Active Peptide from Its Fusion Partner by Formic Acid Cleavage. Methods Mol. Biol. 2025, 2931, 155–175. [Google Scholar] [CrossRef] [PubMed]
  26. Metlitskaia, L.; Cabralda, J.E.; Suleman, D.; Kerry, C.; Brinkman, J.; Bartfeld, D.; Guarna, M.M. Recombinant Antimicrobial Peptides Efficiently Produced Using Novel Cloning and Purification Processes. Biotechnol. Appl. Biochem. 2004, 39, 339–345. [Google Scholar] [CrossRef] [PubMed]
  27. Luan, C.; Xie, Y.G.; Pu, Y.T.; Zhang, H.W.; Han, F.F.; Feng, J.; Wang, Y.Z. Recombinant Expression of Antimicrobial Peptides Using a Novel Self-Cleaving Aggregation Tag in Escherichia Coli. Can. J. Microbiol. 2014, 60, 113–120. [Google Scholar] [CrossRef]
  28. Osusky, M.; Zhou, G.; Osuska, L.; Hancock, R.E.; Kay, W.W.; Misra, S. Transgenic Plants Expressing Cationic Peptide Chimeras Exhibit Broad-Spectrum Resistance to Phytopathogens. Nat. Biotechnol. 2000, 18, 1162–1166. [Google Scholar] [CrossRef]
  29. Morin, K.M.; Arcidiacono, S.; Beckwitt, R.; Mello, C.M. Recombinant Expression of Indolicidin Concatamers in Escherichia Coli. Appl. Microbiol. Biotechnol. 2006, 70, 698–704. [Google Scholar] [CrossRef]
  30. Butvilovskaya, V.I.; Tsybulskaya, M.V.; Tikhonov, A.A.; Talibov, V.O.; Belousov, P.V.; Sazykin, A.Y.; Schwartz, A.M.; Putlyaeva, L.V.; Surzhikov, S.A.; Stomakhin, A.A.; et al. Preparation of recombinant serpins B3 and B4 and investigation of their specific interactions with antibodies using hydrogel-based microarrays. Mol Biol 2015, 49, 790–799. [Google Scholar] [CrossRef]
  31. Chahardooli, M.; Niazi, A.; Aram, F.; Sohrabi, S.M. Expression of Recombinant Arabian Camel Lactoferricin-Related Peptide in Pichia Pastoris and Its Antimicrobial Identification. J. Sci. Food Agric. 2016, 96, 569–575. [Google Scholar] [CrossRef]
  32. Kumarasamy, A.; Jeyarajan, S.; Kimler, V.A.; Premceski, A.; Cheon, J.; Mishra, V.; Giblin, F.J. In Vitro Studies on the Interaction of Guinea Pig αA Crystallin and αA Crystallin (66-80) Peptide Using Fluorescence Polarization and Transmission Electron Microscopy. Investig. Ophthalmol. Vis. Sci. 2017, 58, 5301. [Google Scholar]
  33. Jeyarajan, S.; Kumarasamy, A.; Cheon, J.; Premceski, A.; Seidel, E.; Kimler, V.A.; Giblin, F.J. TEM Analysis of αA66-80 Peptide-Induced Protein Aggregates and Amyloid Fibrils in Human and Guinea Pig αA-Crystallins. Investig. Ophthalmol. Vis. Sci. 2018, 59, 3043. [Google Scholar]
  34. Yadav, P.; Su, M.; Sivakumar, J.; Giblin, F.; Ohi, M. Structural Organization of the Guinea Pig αA-Crystallin and αA 66−80 Peptide Complex. Microsc. Microanal. 2019, 25, 1318–1319. [Google Scholar] [CrossRef]
  35. Anbarasu, K.; Sivakumar, J. Multidimensional Significance of Crystallin Protein-Protein Interactions and Their Implications in Various Human Diseases. Biochim. Biophys. Acta 2016, 1860, 222–233. [Google Scholar] [CrossRef] [PubMed]
  36. Li, Y. Carrier Proteins for Fusion Expression of Antimicrobial Peptides in Escherichia Coli. Biotechnol. Appl. Biochem. 2009, 54, 1–9. [Google Scholar] [CrossRef] [PubMed]
  37. Li, Y. Recombinant Production of Antimicrobial Peptides in Escherichia Coli: A Review. Protein Expr. Purif. 2011, 80, 260–267. [Google Scholar] [CrossRef] [PubMed]
  38. Govindarajan, S.; Sivakumar, J.; Garimidi, P.; Rangaraj, N.; Kumar, J.M.; Rao, N.M.; Gopal, V. Targeting Human Epidermal Growth Factor Receptor 2 by a Cell-Penetrating Peptide-Affibody Bioconjugate. Biomaterials 2012, 33, 2570–2582. [Google Scholar] [CrossRef] [PubMed]
  39. Jeyarajan, S.; Xavier, J.; Rao, N.M.; Gopal, V. Plasmid DNA Delivery into MDA-MB-453 Cells Mediated by Recombinant Her-NLS Fusion Protein. Int. J. Nanomed. 2010, 5, 725–733. [Google Scholar] [CrossRef]
  40. Li, Y.; Li, X.; Wang, G. On-Resin Cleavage of Bacterially Expressed Fusion Proteins for Purification of Active Recombinant Peptides SK-29, KR-20, LL-29, and LL-23 from Human Sweat or Skin. Protein Expr. Purif. 2007, 55, 395–405. [Google Scholar] [CrossRef]
  41. Ke, T.; Liang, S.; Huang, J.; Mao, H.; Chen, J.; Dong, C.; Huang, J.; Liu, S.; Kang, J.; Liu, D.; et al. A Novel PCR-Based Method for High Throughput Prokaryotic Expression of Antimicrobial Peptide Genes. BMC Biotechnol. 2012, 12, 10. [Google Scholar] [CrossRef]
  42. Skosyrev, V.S.; Rudenko, N.V.; Yakhnin, A.V.; Zagranichny, V.E.; Popova, L.I.; Zakharov, M.V.; Gorokhovatsky, A.Y.; Vinokurov, L.M. EGFP as a Fusion Partner for the Expression and Organic Extraction of Small Polypeptides. Protein Expr. Purif. 2003, 27, 55–62. [Google Scholar] [CrossRef]
  43. Chalfie, M.; Tu, Y.; Euskirchen, G.; Ward, W.W.; Prasher, D.C. Green Fluorescent Protein as a Marker for Gene Expression. Science 1994, 263, 802–805. [Google Scholar] [CrossRef]
  44. Liu, B.-F.; Anbarasu, K.; Liang, J.J.-N. Confocal Fluorescence Resonance Energy Transfer Microscopy Study of Protein-Protein Interactions of Lens Crystallins in Living Cells. Mol. Vis. 2007, 13, 854–861. [Google Scholar]
  45. Jeyarajan, S.; Zhang, I.X.; Arvan, P.; Lentz, S.I.; Satin, L.S. Simultaneous Measurement of Changes in Mitochondrial and Endoplasmic Reticulum Free Calcium in Pancreatic Beta Cells. Biosensors 2023, 13, 382. [Google Scholar] [CrossRef]
  46. Zhang, I.X.; Herrmann, A.; Leon, J.; Jeyarajan, S.; Arunagiri, A.; Arvan, P.; Gilon, P.; Satin, L.S. ER Stress Increases Expression of Intracellular Calcium Channel RyR1 to Modify Ca2+ Homeostasis in Pancreatic Beta Cells. J. Biol. Chem. 2023, 299, 105065. [Google Scholar] [CrossRef]
  47. Banerjee, S.; Kumar, J.; Apte-Deshpande, A.; Padmanabhan, S. A Novel Prokaryotic Vector for Identification and Selection of Recombinants: Direct Use of the Vector for Expression Studies in E. coli. Microb. Cell Factories 2010, 9, 30. [Google Scholar] [CrossRef]
  48. Schultz, T.; Martinez, L.; de Marco, A. The Evaluation of the Factors That Cause Aggregation during Recombinant Expression in E. coli Is Simplified by the Employment of an Aggregation-Sensitive Reporter. Microb. Cell Factories 2006, 5, 28. [Google Scholar] [CrossRef]
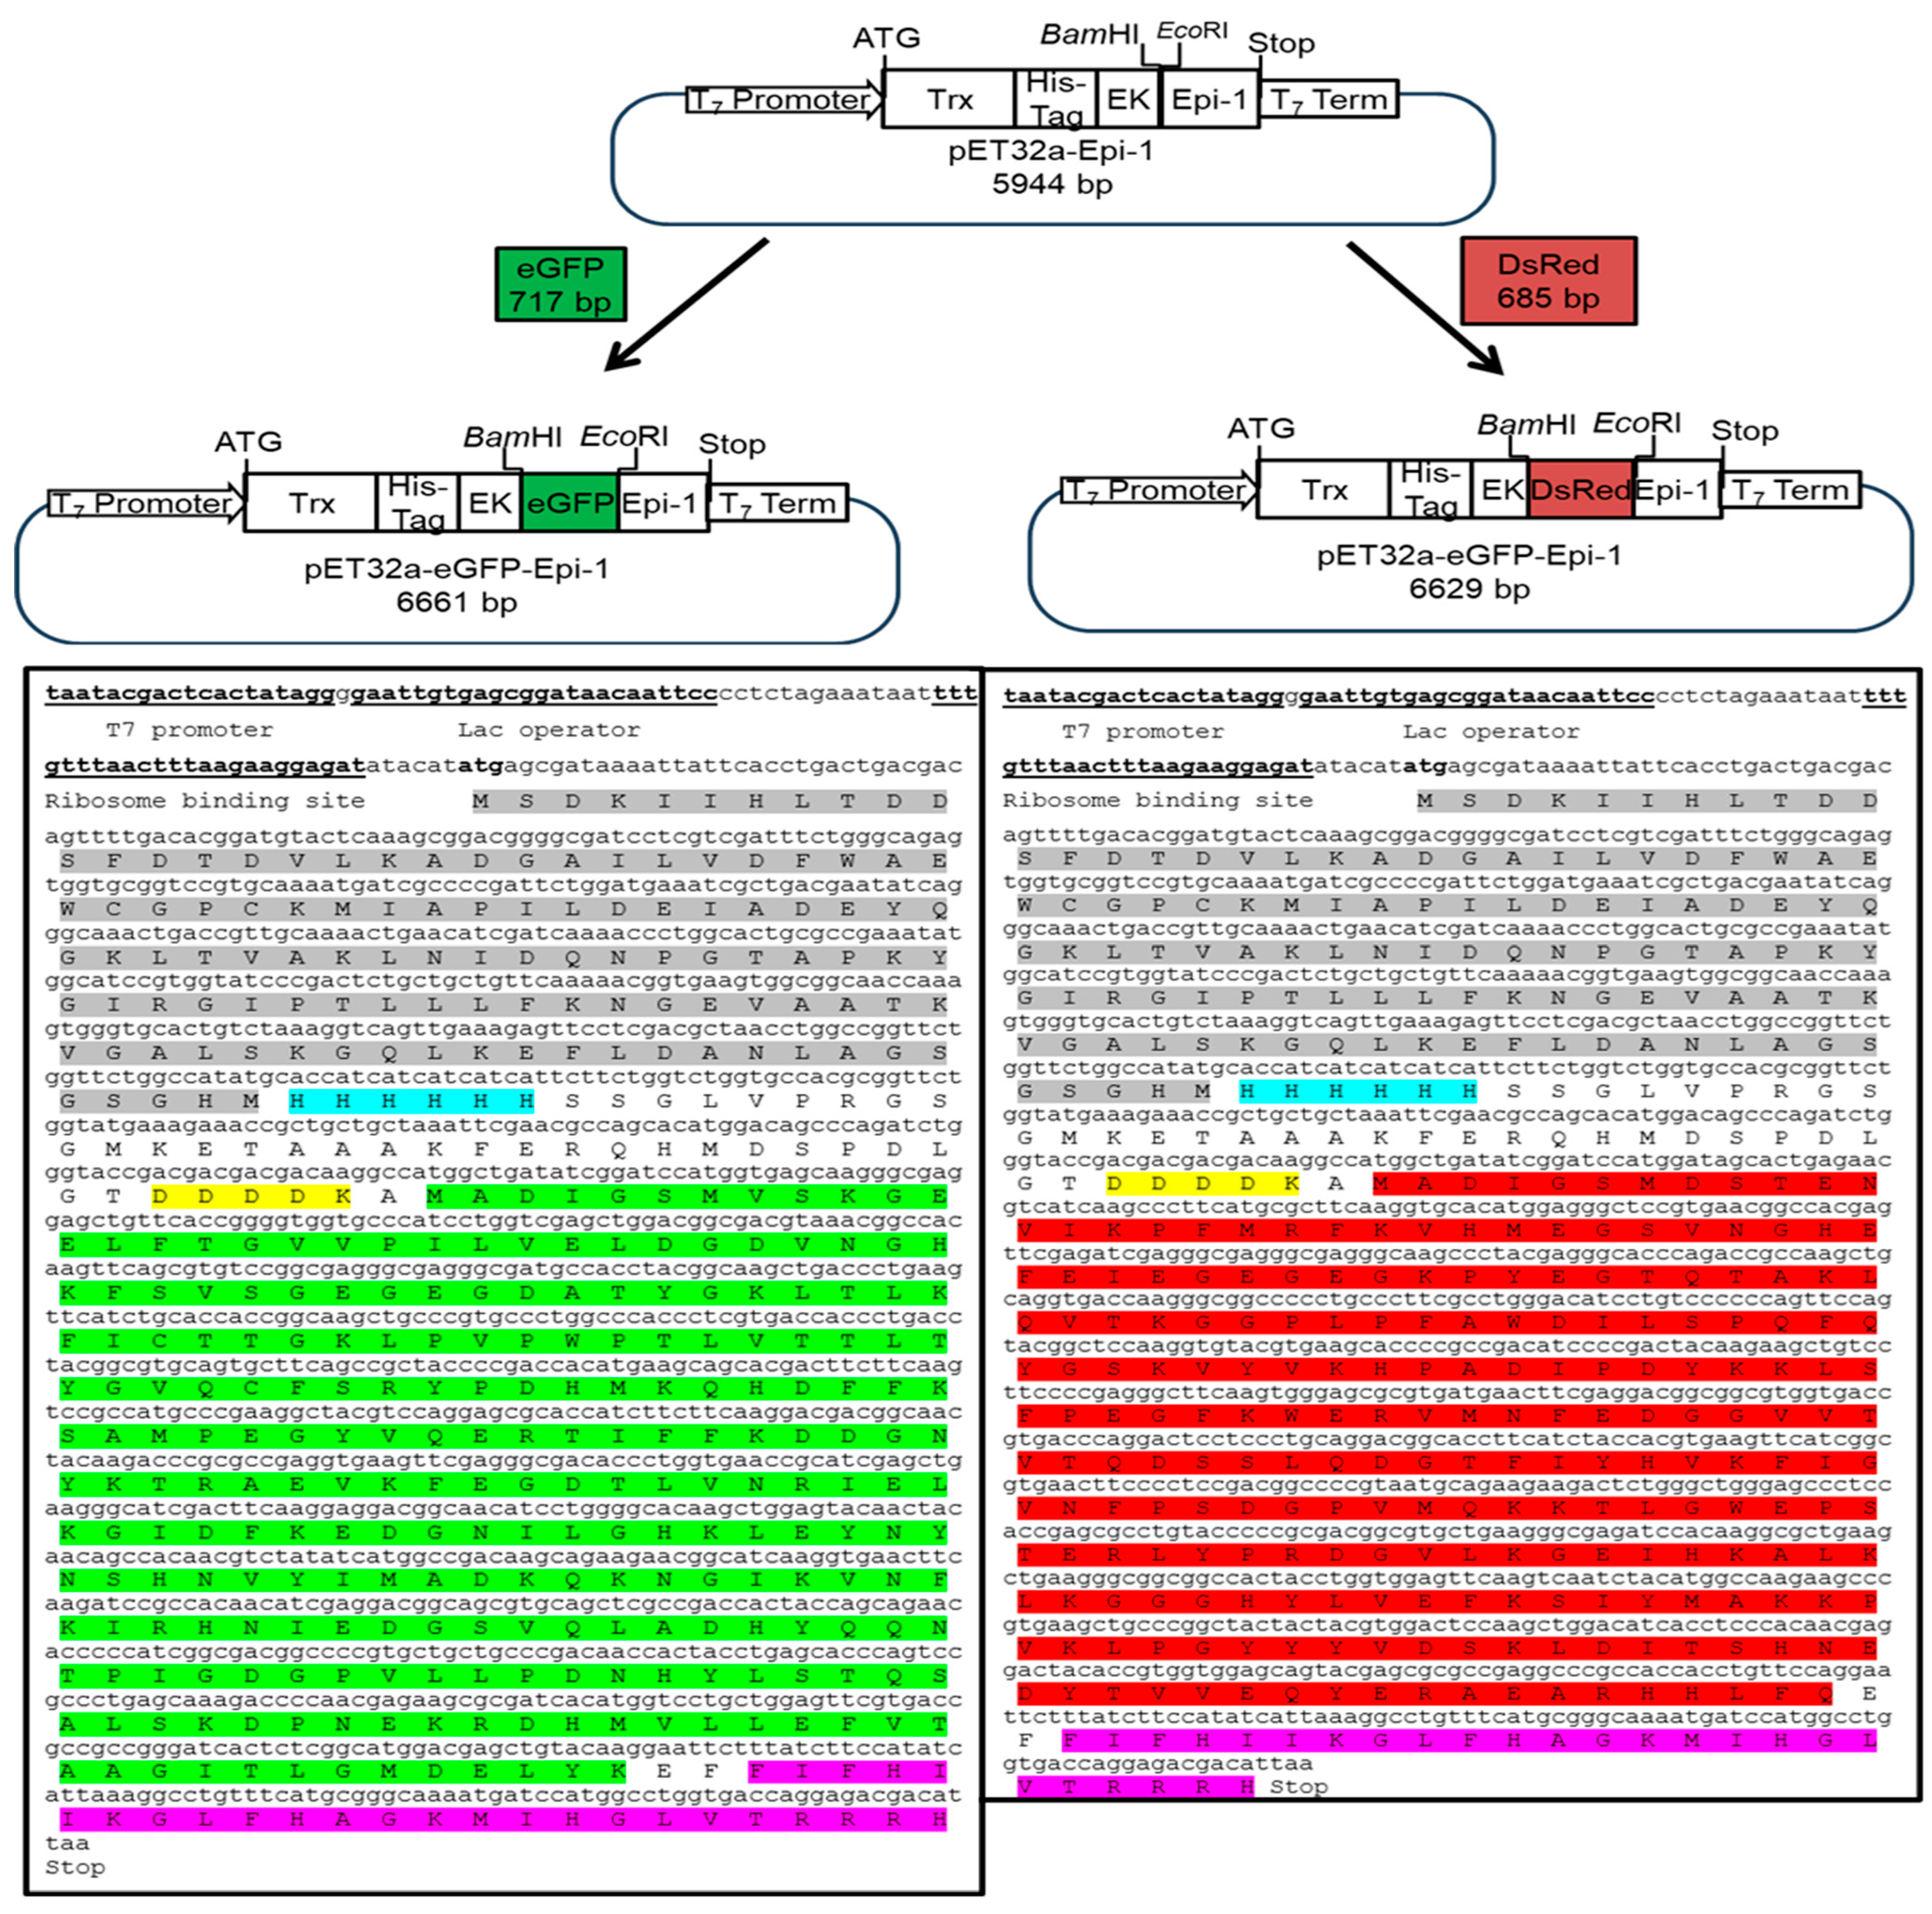
Figure 1. Plasmid constructs for fluorescent Epi-1 expression. This figure presents annotated maps and DNA sequences of two recombinant plasmids: pET32a-eGFP-Epi-1 and pET32a-DsRed-Epi-1. The eGFP (717 bp) and DsRed (685 bp) genes were individually inserted into the pET32a-Epi-1 vector (5944 bp), resulting in total plasmid sizes of 6661 bp for pET32a-eGFP-Epi-1 and 6629 bp for pET32a-DsRed-Epi-1, respectively. The constructs feature key regulatory and expression elements, including a T7 promoter, lac operator, ribosome binding site, Trx tag, His-Tag, enterokinase cleavage site, and the Epi-1 gene. The DNA sequences are color-coded to highlight the fluorescent protein regions, with eGFP in green, DsRed in red, and Epi-1 in pink, facilitating the schematic representation of the gene integration and orientation. The Trx tag is highlighted in grey, His-Tag of 6x histidine is highlighted in blue and the enterokinase site is highlighted in yellow.
J 08 00042 g001
Figure 2. The image illustrates the molecular cloning steps involved in creating fluorescent Epi-1 gene clones. (A). The experiment began with the digestion of the pET32a-Epi-1 vector using BamHI and EcoRI. Restriction digestion yielded a single linear band, while the uncut vector displayed supercoiled, nicked circular, and intact circular forms. (B). The eGFP and DsRed inserts were PCR-amplified and digested with the same restriction enzyme pairs. The vector and fluorescent gene inserts were then ligated individually and transformed into competent cells via heat shock, followed by plating on fresh ampicillin-containing LB agar. (C,D). After 48 h of incubation, colonies that successfully took up the recombinant plasmids exhibited fluorescence corresponding to their respective inserts. The zoomed-in view shows the transformed colonies. The fluorescent colonies which are circled in yellow, indicate successful transformation. The original vector digestion agarose gel image is shown in Supplementary Figure S1.
J 08 00042 g002
Figure 3. (A,B). PCR and plasmid migration assay to validate the eGFP-epi-1 and DsRed-epi-1, which were fluorescent screened in the previous figure. The figure shows agarose gel electrophoresis images of PCR (insert-specific and spanning PCR) and plasmid isolated from individual clones of eGFP-Epi-1 and DsRed-Epi-1 and grouped individually. The individual NF—nonfluorescent colonies and F—fluorescent colonies are shown for representation. M—represents the molecular weight DNA ladder. For insert PCR, the DNA isolated from the fluorescent colonies showed amplification with the corresponding eGFP and DsRed primers. For spanning PCR, the forward primer of the fluorescent gene and the reverse primer of Epi-1 were used. The fluorescent colonies showed amplification and the non-fluorescent colonies did not show amplification. The size of the amplicon for eGFP-epi-1 is (717 + 84 = 801 bp) and for DsRed-Epi-1 is (685 + 84 = 769 bp). The plasmids isolated from fluorescent (F) colonies migrate slower than those from the non-fluorescent (NF) colonies. This is because the non-fluorescent colonies have the same vector size (pET32a-Epi-1: 5944 bp). The fluorescent colonies have a high number of bases due to the insertion of fluorescent genes. eGFP-Epi-1: 6661 bp and DsRed-Epi-1: 6629 bp. The original agarose gel images are shown in Supplementary Figure S2a–d.
J 08 00042 g003
Figure 4. (A,B) show the fluorescence intensity measurements for eGFP and DsRed, respectively. Control refers to lysates from E. coli expressing pET32a-epinecidin-1 without a fluorescent tag. Un-Induced and Induced refer to lysates from cells harboring the respective fusion constructs before and after IPTG induction. (C,D) present SDS-PAGE profiles of eGFP-epi-1 and DsRed-epi-1 expression over time. Lane M represents the protein molecular weight marker, while UI corresponds to lysates from un-induced cultures. Lanes I-1 to I-4 show lysates collected at 1, 2, 3, and 4 h post-induction with 0.3 mM IPTG. The red arrows indicate the expected bands for the induced fusion proteins. Based on amino acid sequence analysis using ProtParam, the calculated molecular weights are approximately 47.88 kDa for eGFP-epi-1 (431 amino acids) and 46.65 kDa for DsRed-epi-1 (417 amino acids).
J 08 00042 g004
Figure 5. The image shows the agar well diffusion assay of Staphylococcus aureus (ATCC 25923), with saline as growth control, buffer, pET32a-epi-1, eGFP-epi-1, and DsRed-epi-1. The results provide evidence that the fluorescence proteins do not interfere with the activity of the AMP epinecidin-1.
J 08 00042 g005
Disclaimer/Publisher’s Note: The statements, opinions and data contained in all publications are solely those of the individual author(s) and contributor(s) and not of MDPI and/or the editor(s). MDPI and/or the editor(s) disclaim responsibility for any injury to people or property resulting from any ideas, methods, instructions or products referred to in the content.