Article

The Impact of the Continental Environment on Boundary Layer Evolution for Landfalling Tropical Cyclones

by
Gabriel J. Williams, Jr.
Department of Applied Physics, The Citadel—Military College of South Carolina, Charleston, SC 29409, USA
Submission received: 1 July 2025 / Revised: 1 August 2025 / Accepted: 27 August 2025 / Published: 28 August 2025
(This article belongs to the Section Physical Sciences)

Abstract

Although numerous observational and theoretical studies have examined the mean and turbulent structure of the tropical cyclone boundary layer (TCBL) over the open ocean, there have been comparatively fewer studies that have examined the kinematic and thermal structure of the TCBL across the land–ocean interface. This study examines the impact of different continental environments on the thermodynamic evolution of the TCBL during the landfall transition using high-resolution, full-physics numerical simulations. During landfall, the changes in the wind field within the TCBL due to the development of the internal boundary layer (IBL), combined with the formation of a surface cold pool, generates a pronounced thermal asymmetry in the boundary layer. As a result, the maximum thermodynamic boundary layer height occurs in the rear-right quadrant of the storm relative to its motion. In addition, azimuthal and vertical advection by the mean flow lead to enhanced turbulent kinetic energy (TKE) in front of the vortex (enhancing dissipative heating immediately onshore) and onshore precipitation to the left of the storm track (stabilizing the environment). The strength and depth of thermal asymmetry in the boundary layer depend on the contrast in temperature and moisture between the continental and storm environments. Dry air intrusion enhances cold pool formation and stabilizes the onshore boundary layer, reducing mechanical mixing and accelerating the decay of the vortex. The temperature contrast between the continental and storm environments establishes a coastal baroclinic zone, producing stronger baroclinicity and inflow on the left of the track and weaker baroclinicity on the right. The resulting gradient imbalance in the front-right quadrant triggers radial outflow through a gradient adjustment process that redistributes momentum and mass to restore dynamical balance. Therefore, the surface thermodynamic conditions over land play a critical role in shaping the evolution of the TCBL during landfall, with the strongest asymmetries in thermodynamic boundary layer height emerging when there are large thermal contrasts between the hurricane and the continental environment.

1. Introduction

As tropical cyclones (TCs) approach a coastal boundary, changes in the underlying surface lead to an asymmetric distribution of surface roughness, sensible heat flux, and latent heat fluxes, which affect the kinematic, thermal, and precipitation structure of TCs. Since the damage associated with TCs principally occurs near coastal zones within the TC boundary layer (TCBL), understanding how the TCBL evolves during the land–ocean transition plays an important role in improving hurricane intensity forecasts near land.
Because of the global radiosonde network [1,2], there is an abundance of observations of the mean TCBL structure over the open ocean, and these have been used to document the vertical thermodynamic and kinematic structure over large regions of the TC [3,4,5,6,7]. As TCs move across the open ocean, asymmetries are primarily produced by the presence of environmental vertical wind shear and the storm motion itself. The relative impact of motion-induced asymmetries to shear-induced asymmetries is primarily driven by the strength of the environmental wind shear. As TCs evolve within environments of weak environmental wind shear, motion-induced asymmetries dominate. Within the TCBL, motion-induced asymmetries lead to maximum Earth-relative winds which reside within the front-right quadrant relative to the storm-motion vector, and maximum storm-relative radial inflow resides within the front-left quadrant relative to the storm-motion vector [8,9,10,11,12]. In response to the TCBL wind field, surface fluxes are enhanced in front of the vortex, which destabilizes the vortex. Thus, the motion-induced asymmetry generates a front-to-rear asymmetry in thermal stability, such that thermal stability decreases from the rear of the vortex to its front [13].
In contrast, as TCs evolve within environments of strong environmental wind shear, shear-induced asymmetries dominate. Observational studies have shown that within the TCBL, shear-induced asymmetries lead to: (1) the strongest inflow within the downshear quadrant of the vortex; (2) the strongest maximum Earth-relative winds left of the shear vector; and (3) a wavenumber-1 structure associated with equivalent potential temperature θ e such that low θ e air resides left of the shear vector and high θ e air resides right of the shear vector [5,14,15,16]. Numerical modeling studies have confirmed these shear-relative, asymmetric TCBL structures [17,18,19,20,21,22,23], and it has been shown that the evolution of asymmetries within the TCBL is linked to the tilt of the TC vortex and rainband processes [24].
Although observations of the TCBL during the landfall transition have not been documented as extensively as over the open ocean, recent observational studies have documented the evolution of the TCBL wind field during landfall. Case study analyses have indicated that as TCs approach land, there is a strong decrease in surface wind speeds and a rotation of maximum inflow angles rotate towards the front-right quadrant at landfall due to changes in storm translation and the frictional interactions with land which generates frictionally induced asymmetries [25,26,27]. As the surface inflow increases due to frictional convergence over land, the radius of maximum winds (RMW) contracts on the landward size, which can lead to a brief intensification of low-level winds. Modeling studies have shown that these asymmetric changes are strongly influenced by terrain and coastline effects such that terrain-induced frictional changes can be felt tens of kilometers offshore [28].
Recent observational studies have shown that the source of these asymmetries is linked to the development of an internal boundary layer (IBL) which forms as the TCBL adjusts to the change in surface characteristics [6,29,30,31,32]. During the landfall transition, the TCBL adjusts to the coastal boundary such that the IBL grows until it represents the complete depth of the fully adjusted boundary layer. The evolution of IBL growth depends upon the presence of topography at the coastal boundary, the coastline geometry, the upwind terrain characteristics, and other inhomogeneities (such as horizontal variations in surface roughness and surface temperatures) associated with the new surface [6,29]. Using dropsonde observations over the open ocean and velocity-azimuth display (VAD) retrievals from ground-based Doppler radars, Alford et al. (2020) [31] examined the mean TCBL kinematic structure of Hurricane Irene (2011) during its landfall, and it was shown that: (1) rainbands are responsible for strengthening the winds within the TCBL; (2) the growth of the IBL weakens the offshore TCBL jet such that the maximum azimuthal winds above the adjusted IBL become the new maximum; and (3) the TCBL jet (which typically resides within the inflow layer within the open ocean) remains elevated above the TCBL at landfall.
Due to the scarcity of high-resolution onshore and offshore observations of the TCBL during landfall, numerical modeling studies have been used to understand the evolution of the TCBL during landfall. Using a high-resolution, multi-layer boundary layer model in storm-relative coordinates, Williams (2019) demonstrated that when a TC approaches land, two asymmetries develop: a motion-induced asymmetry and a land-induced asymmetry [33]. The relative strength of the motion-induced asymmetry and the land-induced asymmetry is driven by the proximity of the vortex to the coastline. When the center of the TC vortex is more than 200 km from land, the motion-induced asymmetry dominates. The motion-induced asymmetry is characterized by nonlinear asymmetric advective interactions between the wind field and the storm motion vector such that maximum in storm-relative radial inflow resides in front of the vortex with significant outflow behind the vortex, similar to previous studies [8,9,10,34]. Dynamically, storm motion leads to asymmetries in surface frictional drag, which induces an asymmetric agradient force that advects angular momentum towards the front of the vortex. When the center of the TC vortex is within 200 km of land, the land-induced asymmetry begins to affect the TCBL structure. The signature feature of the land-induced asymmetry is the presence of a relative vorticity band which forms above the inflow layer in front of the vortex and enhances the winds within the TCBL, consistent with other idealized modeling studies [35,36].
In addition to the proximity of land, the relative strength of the land-induced asymmetries to the motion-induced asymmetries depends upon the orientation of the storm motion vector with respect to the coastline. When the storm motion vector is parallel to the coastline (such as when a northward moving storm moves parallel to a western land boundary), the motion-induced asymmetry opposes the effects of the land-induced asymmetry, which generates a shallower inflow layer and weaker TCBL winds [33]. In contrast, when the storm motion vector is perpendicular to the coastline (such as when a northward moving storm encounters a northern land boundary), the motion-induced asymmetry works in concert with the land-induced asymmetry to generate stronger TCBL winds and a deeper inflow layer [37]. In this scenario, the outer core of the TCBL rapidly decelerates near the surface over land due to increased friction, generating large inflow angles over land and weakening surface winds. In contrast, offshore winds in the outer core of the TCBL experience a sharp reduction in surface friction, resulting in accelerating radial velocity and enhanced angular momentum advection by the secondary circulation. Consequently, the enhanced convergence strengthens vertical velocities near the TC core, which strengthens the secondary circulation and the azimuthal winds to the rear of the vortex before landfall [37].
Regarding the thermal structure of the TCBL during landfall, previous studies focused upon the structure and intensity of TC rainfall during the landfall transition. Observational studies indicate that the rainfall intensity peaks near landfall within the eyewall in the front-right quadrant relative to storm motion [38,39]. As TCs weaken upon landfall, the precipitation rate decreases while the spatial extent of precipitation increases, leading to widespread but less intense precipitation. In addition to storm motion, rainfall asymmetries are influenced by environmental factors such as vertical wind shear such that the rainfall maximum is located downshear left [40].
Since there are few observational studies that have directly measured the boundary layer thermal fields of TC during landfall, Williams (2023) [13] used a high-resolution, multi-layer boundary layer model to examine the evolution of the thermal structure of the TCBL during landfall. It was shown that the thermal and moisture contrast between the storm environment and the continental environment affected the TCBL wind field. Based upon vorticity budget analysis, the band of relative vorticity, characteristic of the land-induced asymmetry, is primarily produced by baroclinic generation from the land–sea thermal contrast, which is then amplified by vortex tilting and advected into the vortex core. Second, the vorticity band due to the presence of land affects the thermal fields through the interaction of the vorticity band with the overall vortex. It was shown that the wind speed within the vorticity band is weaker than the surrounding environment, which results in reduced latent heat transfer from the ocean surface along the band. For this reason, thermal stability increases within the vorticity band, consistent with previous studies [35]. Third, the changes in the TCBL thermal and moisture fields associated with a landfalling TC depend upon the orientation of the storm motion vector with respect to the coastline. When a northward moving storm approaches a northern coastline, a wavenumber-1 feature in θ e is produced with warm, moist air to the right of the vortex and cool, dry air to the left of the vortex, resulting in a front-like structure in the rear quadrant of the vortex, consistent with observations of the low-level thermal fields associated with Hurricane Bonnie (1998) [41]. Hence, when the TC is near the shoreline, a sharp θ e gradient forms, indicative of frontogenesis.
Although the previous works have explained some of the dynamics and thermodynamics associated with the TCBL near landfall [13,33], these conclusions were based upon diagnostic boundary-layer models in which the TCBL flow is driven by the same pressure gradient force that occurs above the TCBL. In addition, it is assumed that the TC above the boundary layer remains in gradient balance with a pressure gradient which does not evolve over time. Thus, diagnostic boundary layer models can only describe how the TCBL evolves in response to the pressure gradients above the TCBL. For the atmosphere, the free atmosphere environment will change as it interacts with the continental environment during the landfall transition. In addition, the development of an internal boundary layer (IBL) as the storm approaches land and the changes in surface fluxes will affect moist convection within the eyewall which will affect the free atmosphere environment. For example, if the air above the TCBL has less enthalpy than inflowing air, then the vertical exchange between the TCBL and the free atmosphere would reduce moist static energy of the inflow approaching the eyewall. Furthermore, during the landfall process, it is expected that the thermal and kinematic fields in the free atmosphere will evolve as the TC moves over land, which impacts the evolution of the TCBL. Thus, a full-physics model is needed to understand the full two-way interaction between the TCBL and the overlying atmosphere.
The goal of this study is to extend the analysis from Williams (2023) [13] by examining the evolution of the TCBL thermal and moisture fields during landfall using a full-physics modeling framework. The major questions that will be answered in this study are as follows:
  • How do the moisture and thermal fields within the TCBL evolve during the development of the IBL as TCs approach landfall? The goal here is to simulate the structure of the thermal and moisture fields before and during landfall so that the differences between the offshore and onshore thermal fields can be determined. We seek to determine how the motion-induced and storm-motion asymmetries affect the thermal and moisture fields within the TCBL. As mentioned above, this is best examined through a full-physics modeling framework, which provides a more accurate depiction of precipitation changes, cold pool dynamics, and turbulent mixing. Each of these processes plays a role in modulating the thermal structure of the TCBL.
  • How does the thermodynamic boundary layer height evolve during the development of the IBL as TCs approach landfall? Previous studies have shown that there is a clear separation between the dynamical boundary layer height (defined as the height of the maximum wind speed and the inflow layer depth) and the thermodynamic boundary layer height (defined as the mixed layer depth) [4]. The evolution of the dynamical boundary layer height during TC landfall has been examined in recent observational and modeling studies [31,33,35]. For this study, specific attention will be given to how the thermodynamic boundary layer height evolves during the landfall transition. For this reason, particular attention will be given to the evolution of the mean and turbulent structure of the TCBL during landfall. Since the thermodynamic boundary layer depends sensitively upon boundary layer mixing and thermal stability, a full-physics model can capture these effects better than a diagnostic boundary layer model.
  • How does the thermodynamic contrast between the storm environment and the continental environment affect the evolution of the TCBL fields during landfall? Previous studies have examined how inland surface features (such as roughness length, available soil moisture, soil thermal inertia, coastline geometry, and coastal topography) affect the evolution of landfalling hurricanes [42,43,44,45]. For this study, specific attention will be given to how the continental environment (such as the continental temperature and moisture profiles) affects the thermodynamic evolution of the TCBL. A full-physics modeling framework is needed to examine the full interaction of the storm environment with the continental environment.
The outline of this paper is as follows. A description of the numerical model, along with a description of the idealized simulations for this study, is given in Section 2. The evolution of the TCBL of a northward-moving storm towards a northern coastline associated with a warm, moist continental environment will be discussed in Section 3. Particular attention will be given to how the thermal and moisture fields within the TCBL evolve as the TC is within 100 km of the coastal boundary and how the growth of the IBL affects the thermodynamics of the TCBL. The impact of modifying the continental environment (as discussed previously) will be discussed in Section 4. The main conclusions (along with implications) are summarized in Section 5.

2. Methods

The model used here is the three-dimensional, non-hydrostatic Cloud Model 1 (CM1, release 21.1) [46,47]. The simulated TC is on an f -plane with a Coriolis parameter of f 0 = 5 × 10 5   s 1 , which corresponds roughly to 20 °   N . The total size of the domain is 3000 × 3000   k m 2 and has periodic lateral boundary conditions. The inner region has uniform 4 km horizontal grid spacing and 800 × 800   k m 2 . Sensitivity tests were conducted using 2 km horizontal resolution to assess how increased resolution affects the evolution of the tropical cyclone boundary layer (TCBL) during landfall. While fine-scale processes—such as boundary layer rolls and vortex-scale turbulence—introduce noticeable spatial variability in TCBL features near landfall, the primary differences between experiments driven by changes in continental moisture and temperature profiles are well captured even at 4 km resolution. Outside this region, the grid spacing is stretched from 4 km to 16 km. To accurately resolve the vertical structure of the TCBL, a stretched grid is employed, which starts with a grid space of 50 m and gradually increases to a grid spacing of 500 m at a height of 5.5 km. The vertically stretched grid yields 79 total model levels with 22 model levels below 2 km. To minimize the reflectance of vertically propagating waves, a Rayleigh damping zone is introduced in the uppermost 5 km of the model and beyond the 2500 km radius of the model.
The planetary boundary level (PBL) parameterization for this study is the Mellor-Yamada-Nakanishi-Niino (MYNN) level 2.5 scheme [48]. This decision was based upon its better performance in reproducing the vertical profiles of eddy viscosity and boundary layer wind profiles for mature TC conditions [49]. The surface layer is modeled using the MYNN surface layer parameterization where sensible and latent heat fluxes are calculated standard bulk aerodynamic formulas with surface exchange coefficients for momentum C D based on Fairall et al. (2003) [50] at low wind speeds and Donelan et al. (2004) [51] at high wind speeds. Sensitivity tests using alternative parameterizations for surface exchange coefficients showed that increasing the surface drag coefficient leads to excessive generation of turbulent kinetic energy (TKE) and an overly smooth kinematic structure within the TCBL. Enthalpy fluxes were computed using a constant moisture roughness length over water (isftcflx = 1 within CM1), and a moisture roughness length that varies based upon turbulent kinetic energy and atmospheric stability was used over land. Cloud microphysics processes were parameterized using the Morrison double moment parameterization scheme [52]. To minimize the effect of the TC diurnal cycle on the thermal and moisture fields within the TCBL, radiation is parameterized by enforcing a simple Newtonian cooling term that relaxes the temperature profile towards its initial state, capped at 2 K/day [53]. The effects of radiative forcing on the thermodynamics of the TCBL during landfall will be examined in a future study.
The experimental procedure used in this study is similar to Hlywiak and Nolan (2022) [37]. The model simulation is initialized as a stationary TC over the open ocean with a fixed sea surface temperature of 301 K. The wind field is initiated with a modified Rankine vortex with a maximum wind speed of 12.5 m s−1 at a radius of maximum wind of 75 km with the vortex centered 300 km south of the domain center as shown in Figure 1. The initial temperature and moisture profiles over the open ocean are taken from the Atlantic hurricane season observations described in Dunion and Marron (2008) [54]. As shown in Figure 1, the coastline is located 300 km north of the domain center. The land surface corresponds to a wooded wetland in which the surface roughness length is 40 cm, the available soil moisture is 35%, and the soil thermal inertia (defined as the square root of the product of the thermal diffusivity and specific heat capacity) is 5 × 10 3   J m 2 K 1 s 1 / 2 . These parameters roughly match the land surface parameters associated with the Florida Everglades [37,45].
During the first 96 h of the simulation, the initial vortex gradually intensifies in the absence of any background environmental flow. By approximately 90 h, the vortex reaches quasi-equilibrium, characterized by a steady minimum central surface pressure and maximum azimuthal wind speed. The azimuthally averaged radial cross-section of the steady-state kinematic and thermal fields associated with the TCBL at the end of 96 h is given in Figure 2. As shown in Figure 2a, the depth of the inflow layer (defined by where the radial velocity V R equals 10% of the peak inflow) decreases with radius from 60 km at a height of 1.00 km to below 100 m in the eye region, consistent with observations [4]. In addition, the region of maximum inflow resides at a height of 75 m, and significant radial outflow exists above the inflow layer, consistent with observations and modeling studies [4,13]. As shown in Figure 2b, the frictionally forced updraft peaks near the radius of maximum wind (RMW) with weak subsidence in the eye and the outer core of the TC. The TCBL jet (corresponding to a maximum azimuthal wind of approximately 58 m s−1) develops at the RMW near the top of the inflow layer at a height of approximately 650 m, according to Figure 2c. Based on Figure 2d, the eyewall is characterized by constant equivalent potential temperature θ e as would be expected by moist adiabatic ascent, and θ e reaches its maximum value at the storm center, consistent with observations of mature TCs [55,56]. As shown by the virtual potential temperature gradient in Figure 2e, the TCBL can be divided into three distinct regions: a near-surface superadiabatic layer in which d θ v / d z < 0 , a mixed layer in which d θ v / d z 0 , and a stable layer in which d θ v / d z > 0 . The structure of θ e and d θ v / d z is connected to the moisture distribution within the TCBL, in which the lowest-level specific humidity increases towards the eye of the vortex. In conclusion, the spun-up vortex reproduces the salient features of the mean kinematic and thermodynamic structure of the TCBL, consistent with observations and modeling studies of the TCBL.
To mimic the effects of environmental flow upon the TC, the CM1 model used a large-scale nudging method to add environmental flow without a large-scale horizontal temperature gradient [19]. After 96 h, the background wind field is gradually nudged towards a uniform background southerly flow of 5 m/s over a 24 h period, and the background wind is held constant thereafter. Simultaneously, a large-scale pressure gradient force is applied to ensure that the nudged background wind remains in geostrophic balance [19]. To investigate the impact of the continental environment of the TCBL during landfall, a collection of landfall simulations was performed. Each landfall simulation was initiated from CNTR after t = 96   h and was integrated up to t = 192   h . The vortex continues to move northward with a storm translation speed of 5.00 m s−1 due to the large-scale environmental flow, so that the vortex makes landfall approximately two days after restarting. Although the surface roughness and soil properties of each simulation remain the same, the land surface temperature (LST) and the atmospheric conditions above the land surface (i.e., the continental environment) will vary for each landfall simulation.
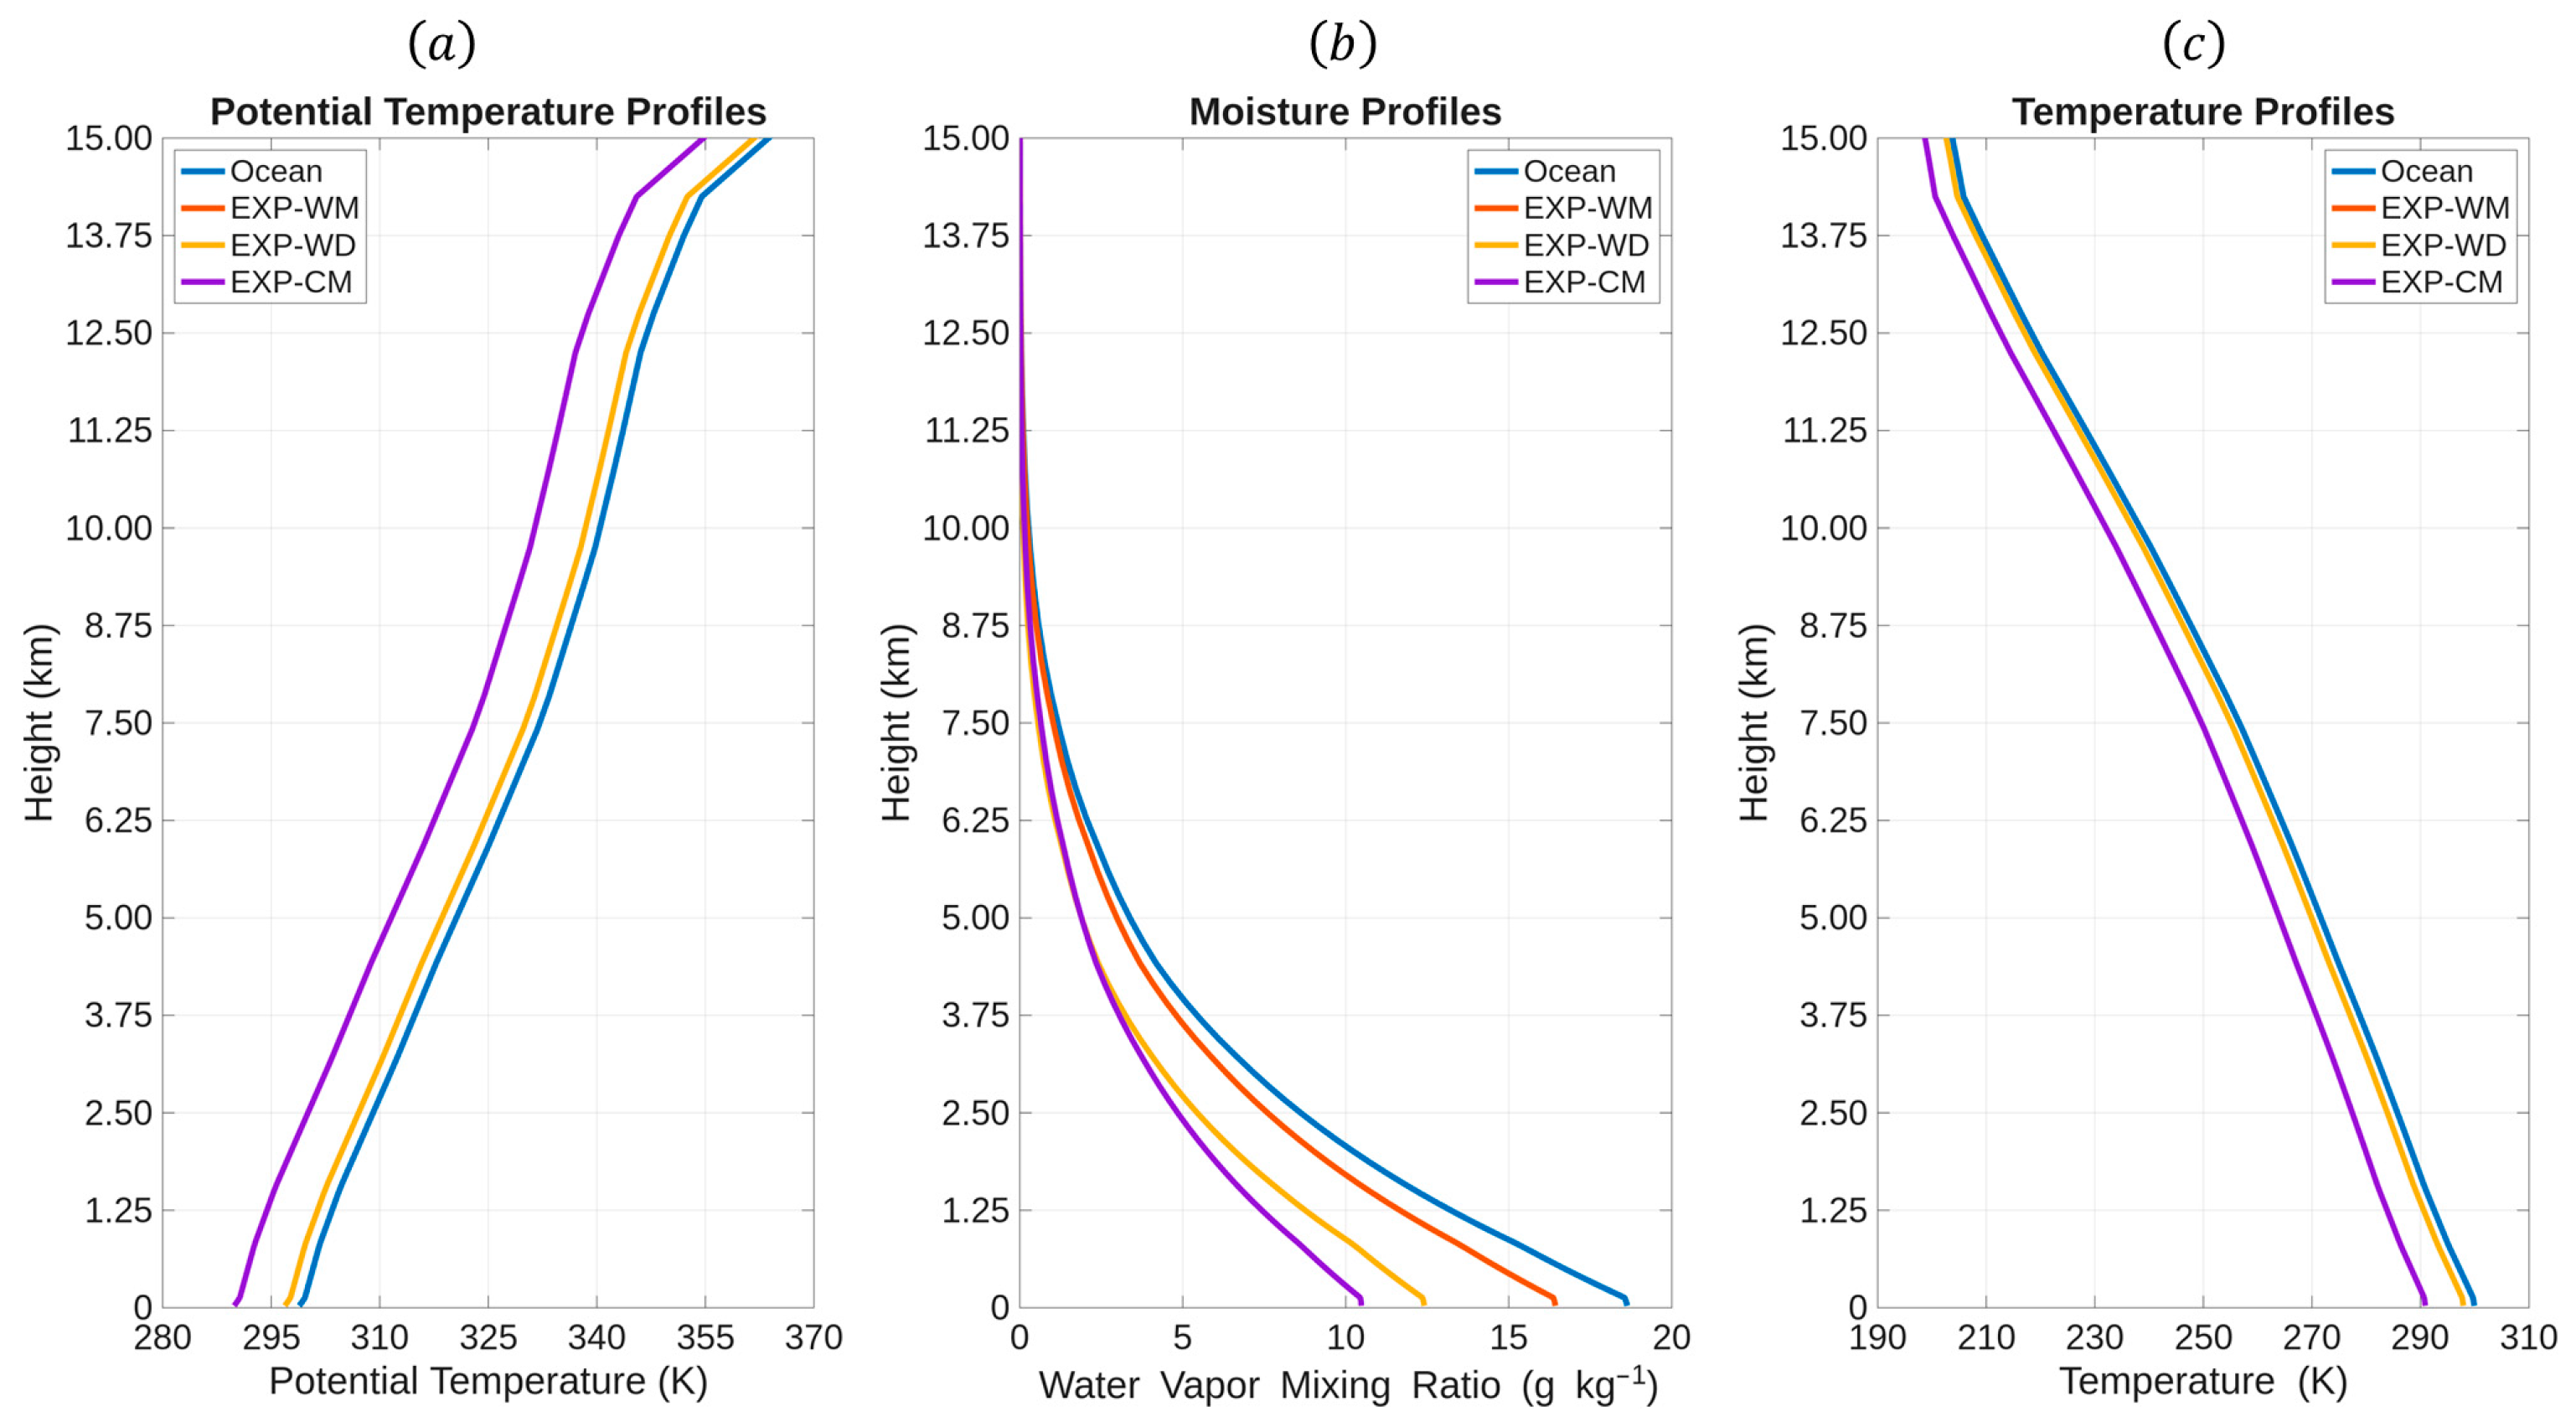
The base-state temperature and moisture profiles associated with the continental environment are specified using the parameters given in Table 1. The first experiment (EXP-WM) corresponds to a warm, moist continental environment in which the relative humidity profile over land matches the relative humidity profile over the open ocean. The LST for EXP-WM is 299.15 K, which is 2 K less than the sea surface temperature, and the vertical potential temperature profile over land is 2   K less than the vertical potential temperature profile over the open ocean. The second experiment (EXP-WD) corresponds to a warm, dry continental environment in which the temperature profile over land matches EXP-WM while the relative humidity profile over land is 20% less than over the open ocean. EXP-WD is designed to mimic the role of dry air intrusion during the landfall transition where the 20% reduction in relative humidity is representative of values found in previous modeling and observational studies of dry air intrusions upon TCs during landfall [57,58,59,60,61]. The third experiment (EXP-CM) corresponds to a cool, moist continental environment in which the relative humidity profile over land matches the relative humidity profile over the open ocean. However, the LST and the vertical potential temperature profile are 9 K less than the open ocean. The vertical temperature and moisture profiles for our three experiments are given in Figure 3. Notice that the temperature profile over land for EXP-WM is the same as for EXP-WD, as shown in Figure 3a,c. However, due to the temperature and relative humidity combinations for each experiment, the moisture profiles for each experiment varies as shown in Figure 3b. The evolution of the TCBL for each landfall simulation is given in the following section.

3. Control Experiment

As mentioned in Section 2, EXP-WM corresponds to a warm, moist land surface in which the initial LST is 299 K. This experiment will function as the control simulation for our analysis. In this section, the evolution of the kinematic and thermal structure of the TCBL will be examined.

3.1. Kinematic and Thermal Structure of the TCBL During Landfall

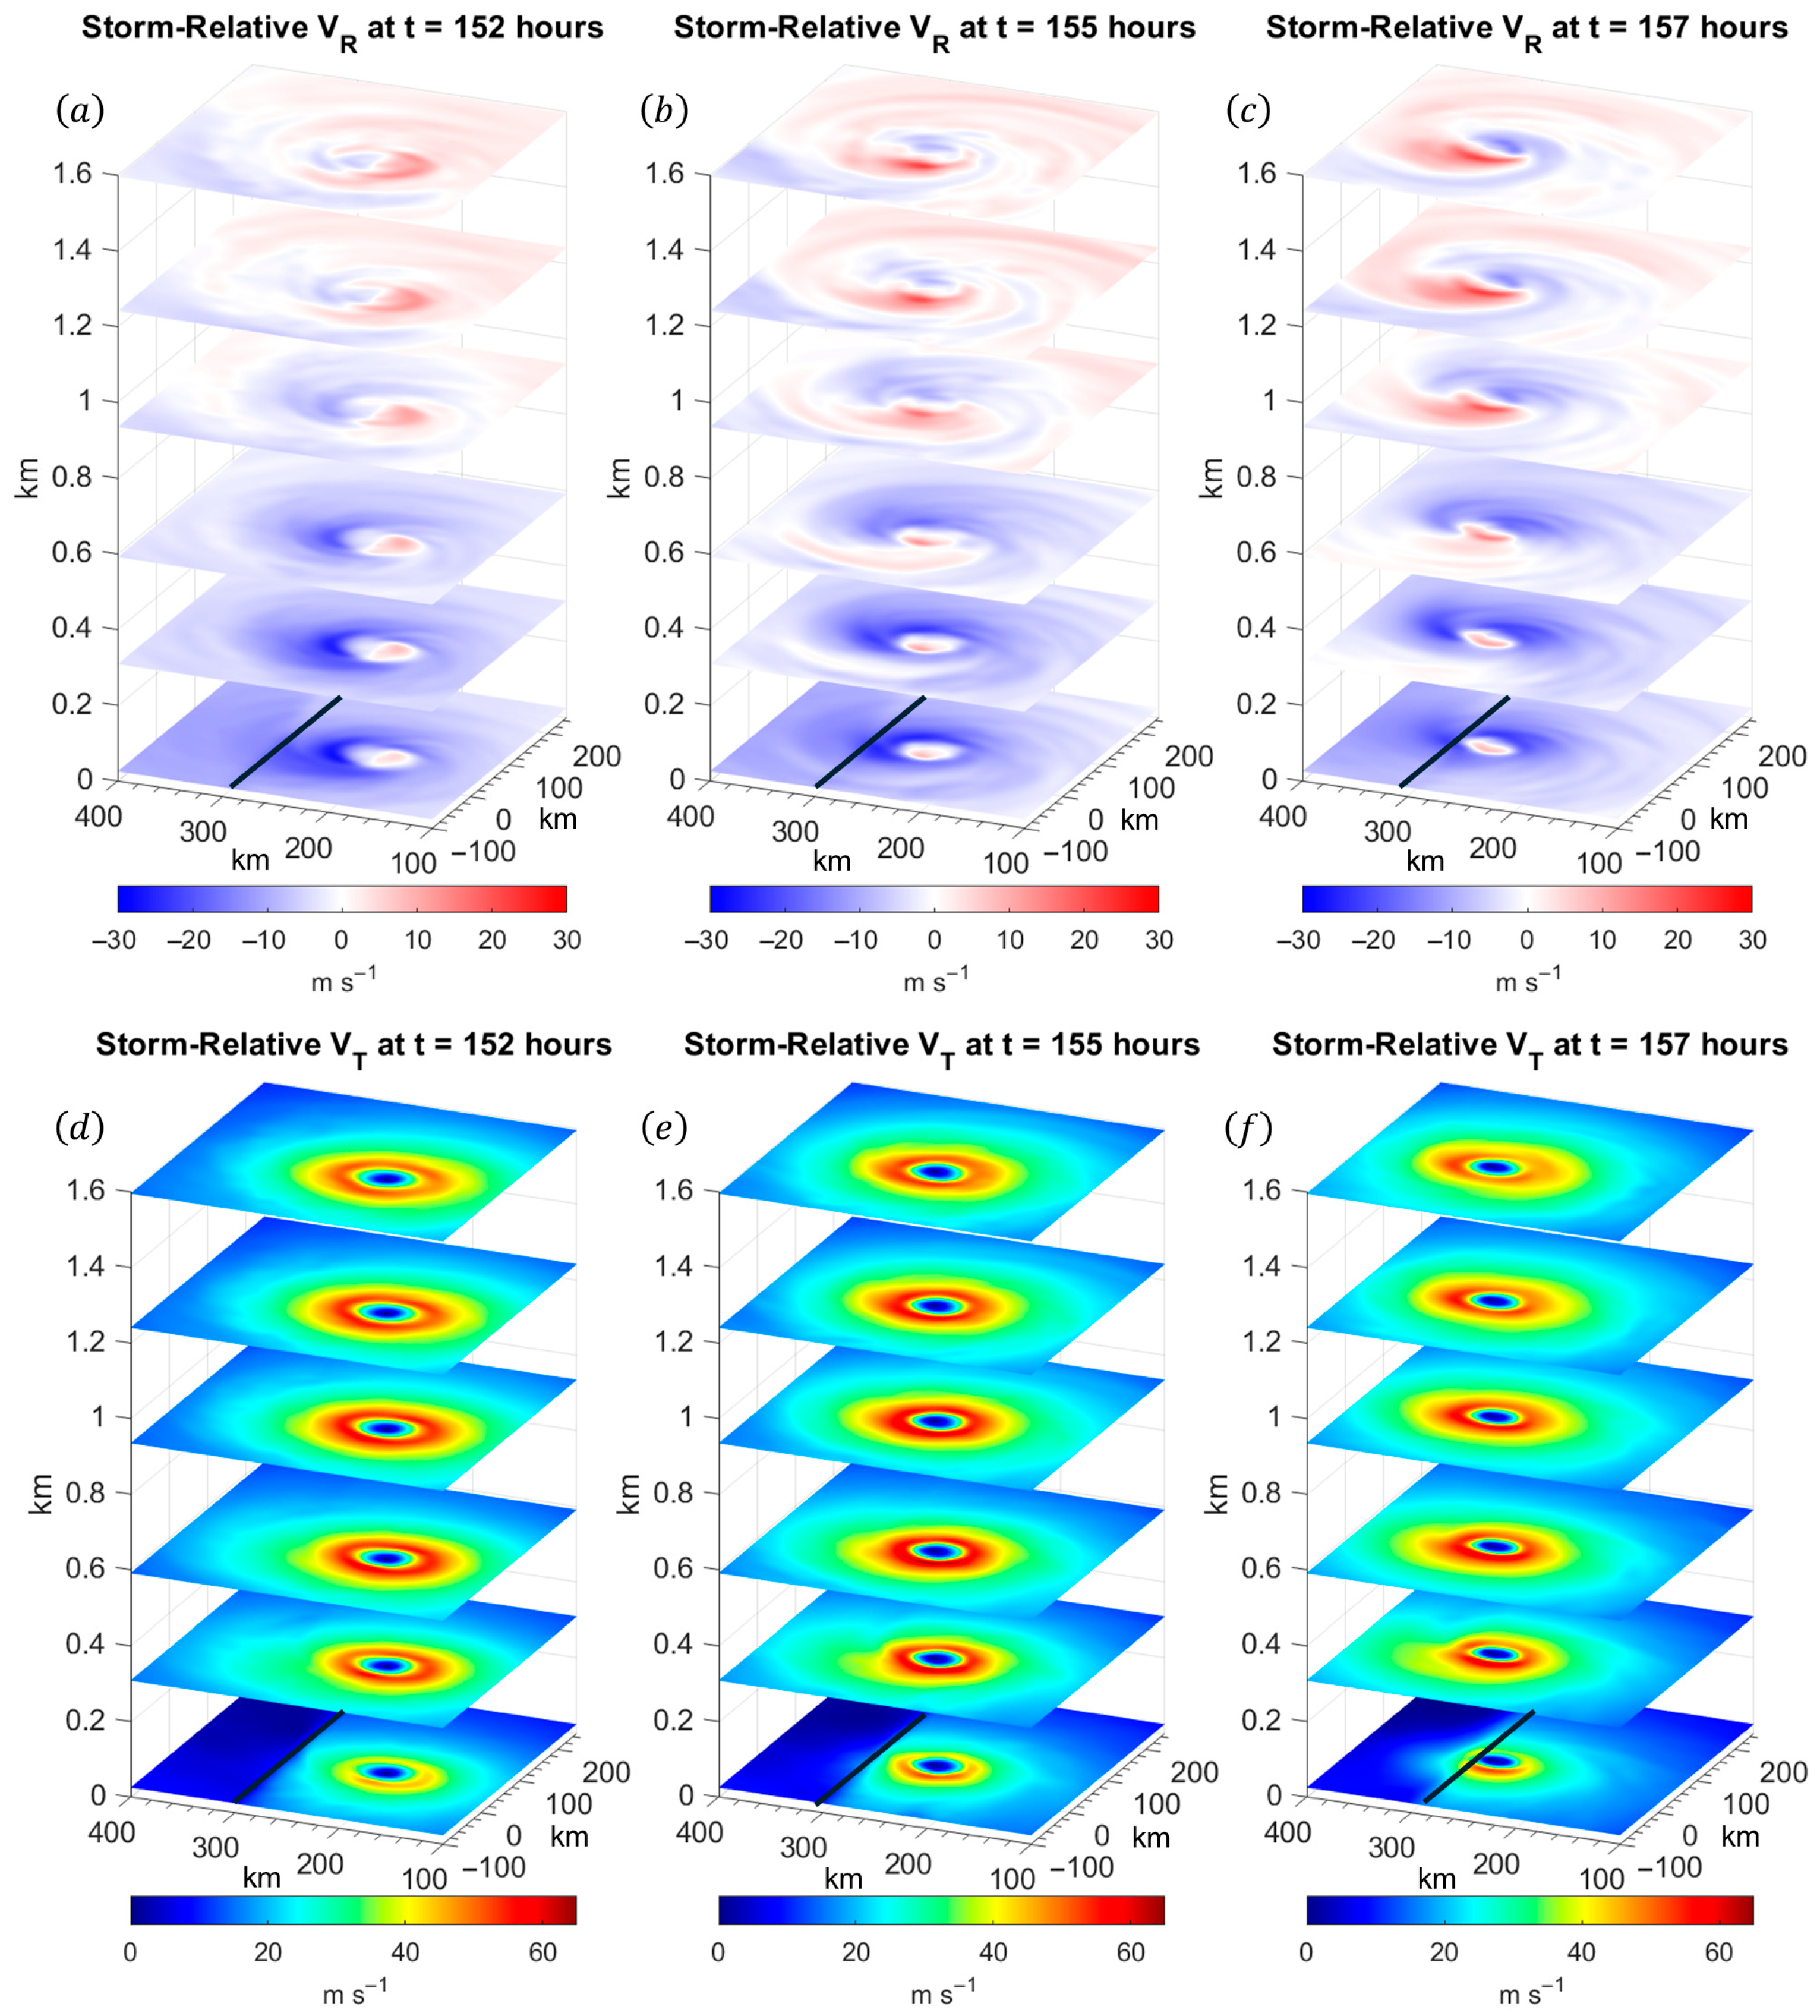
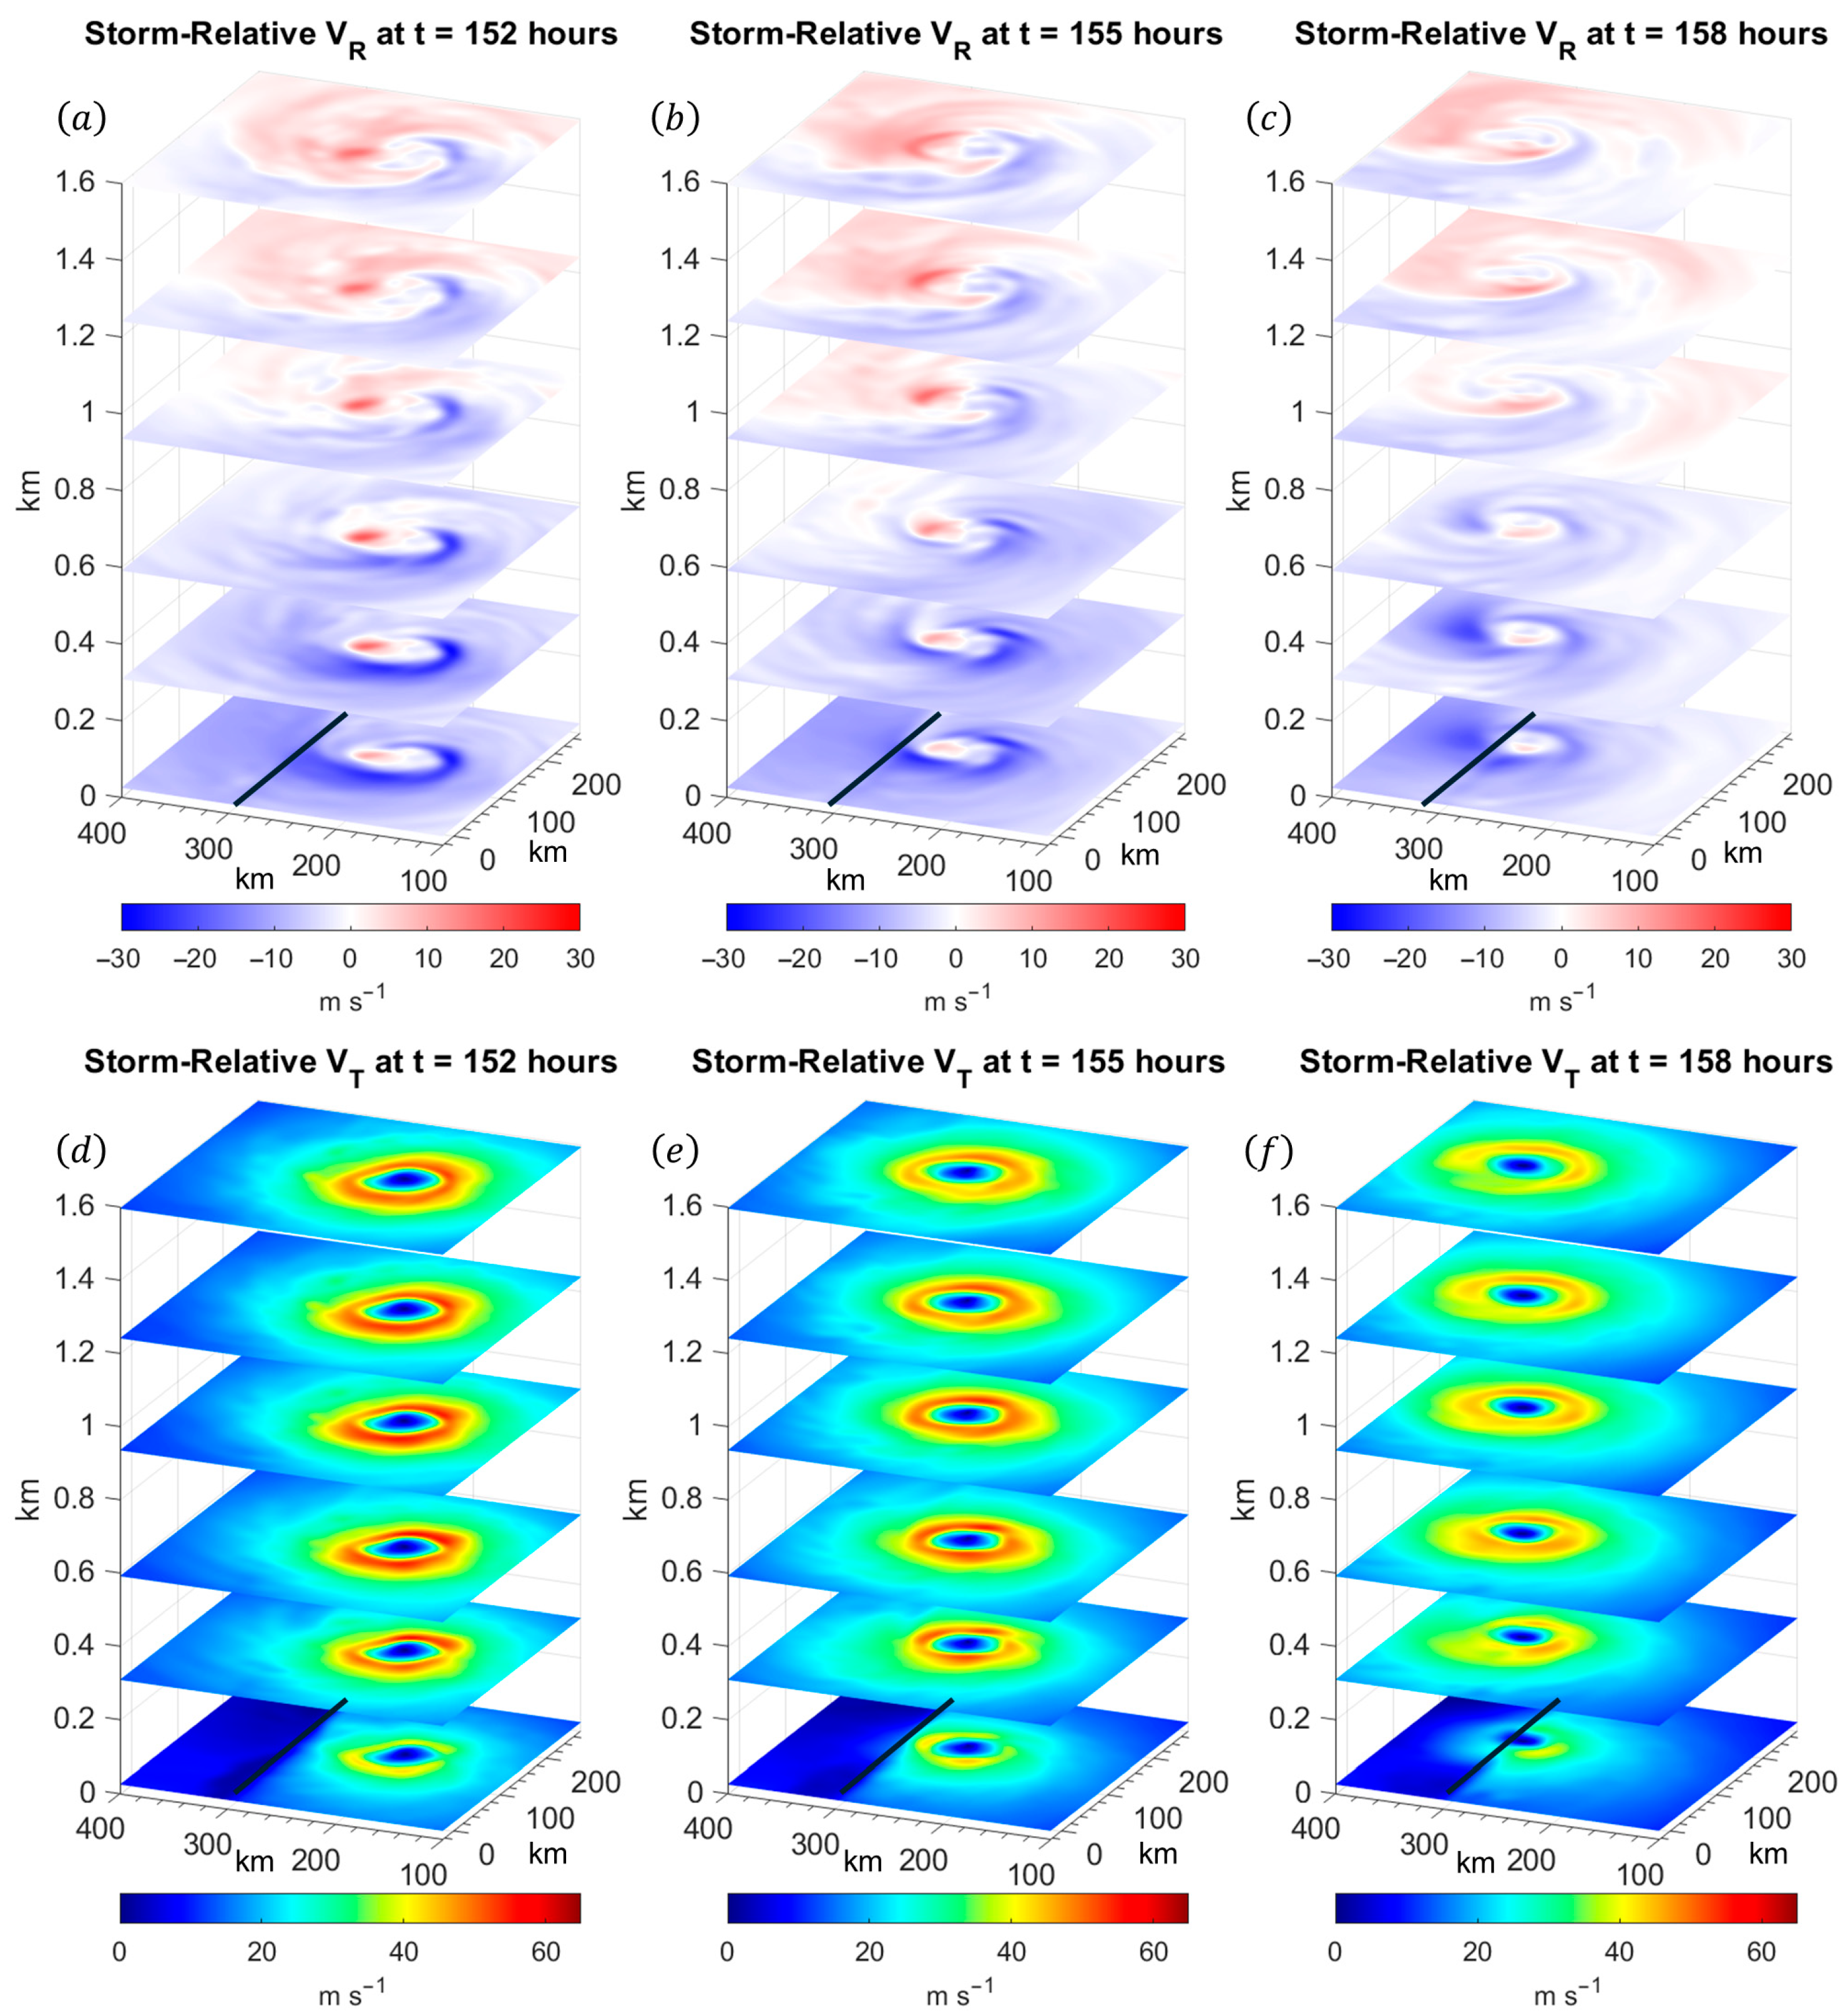
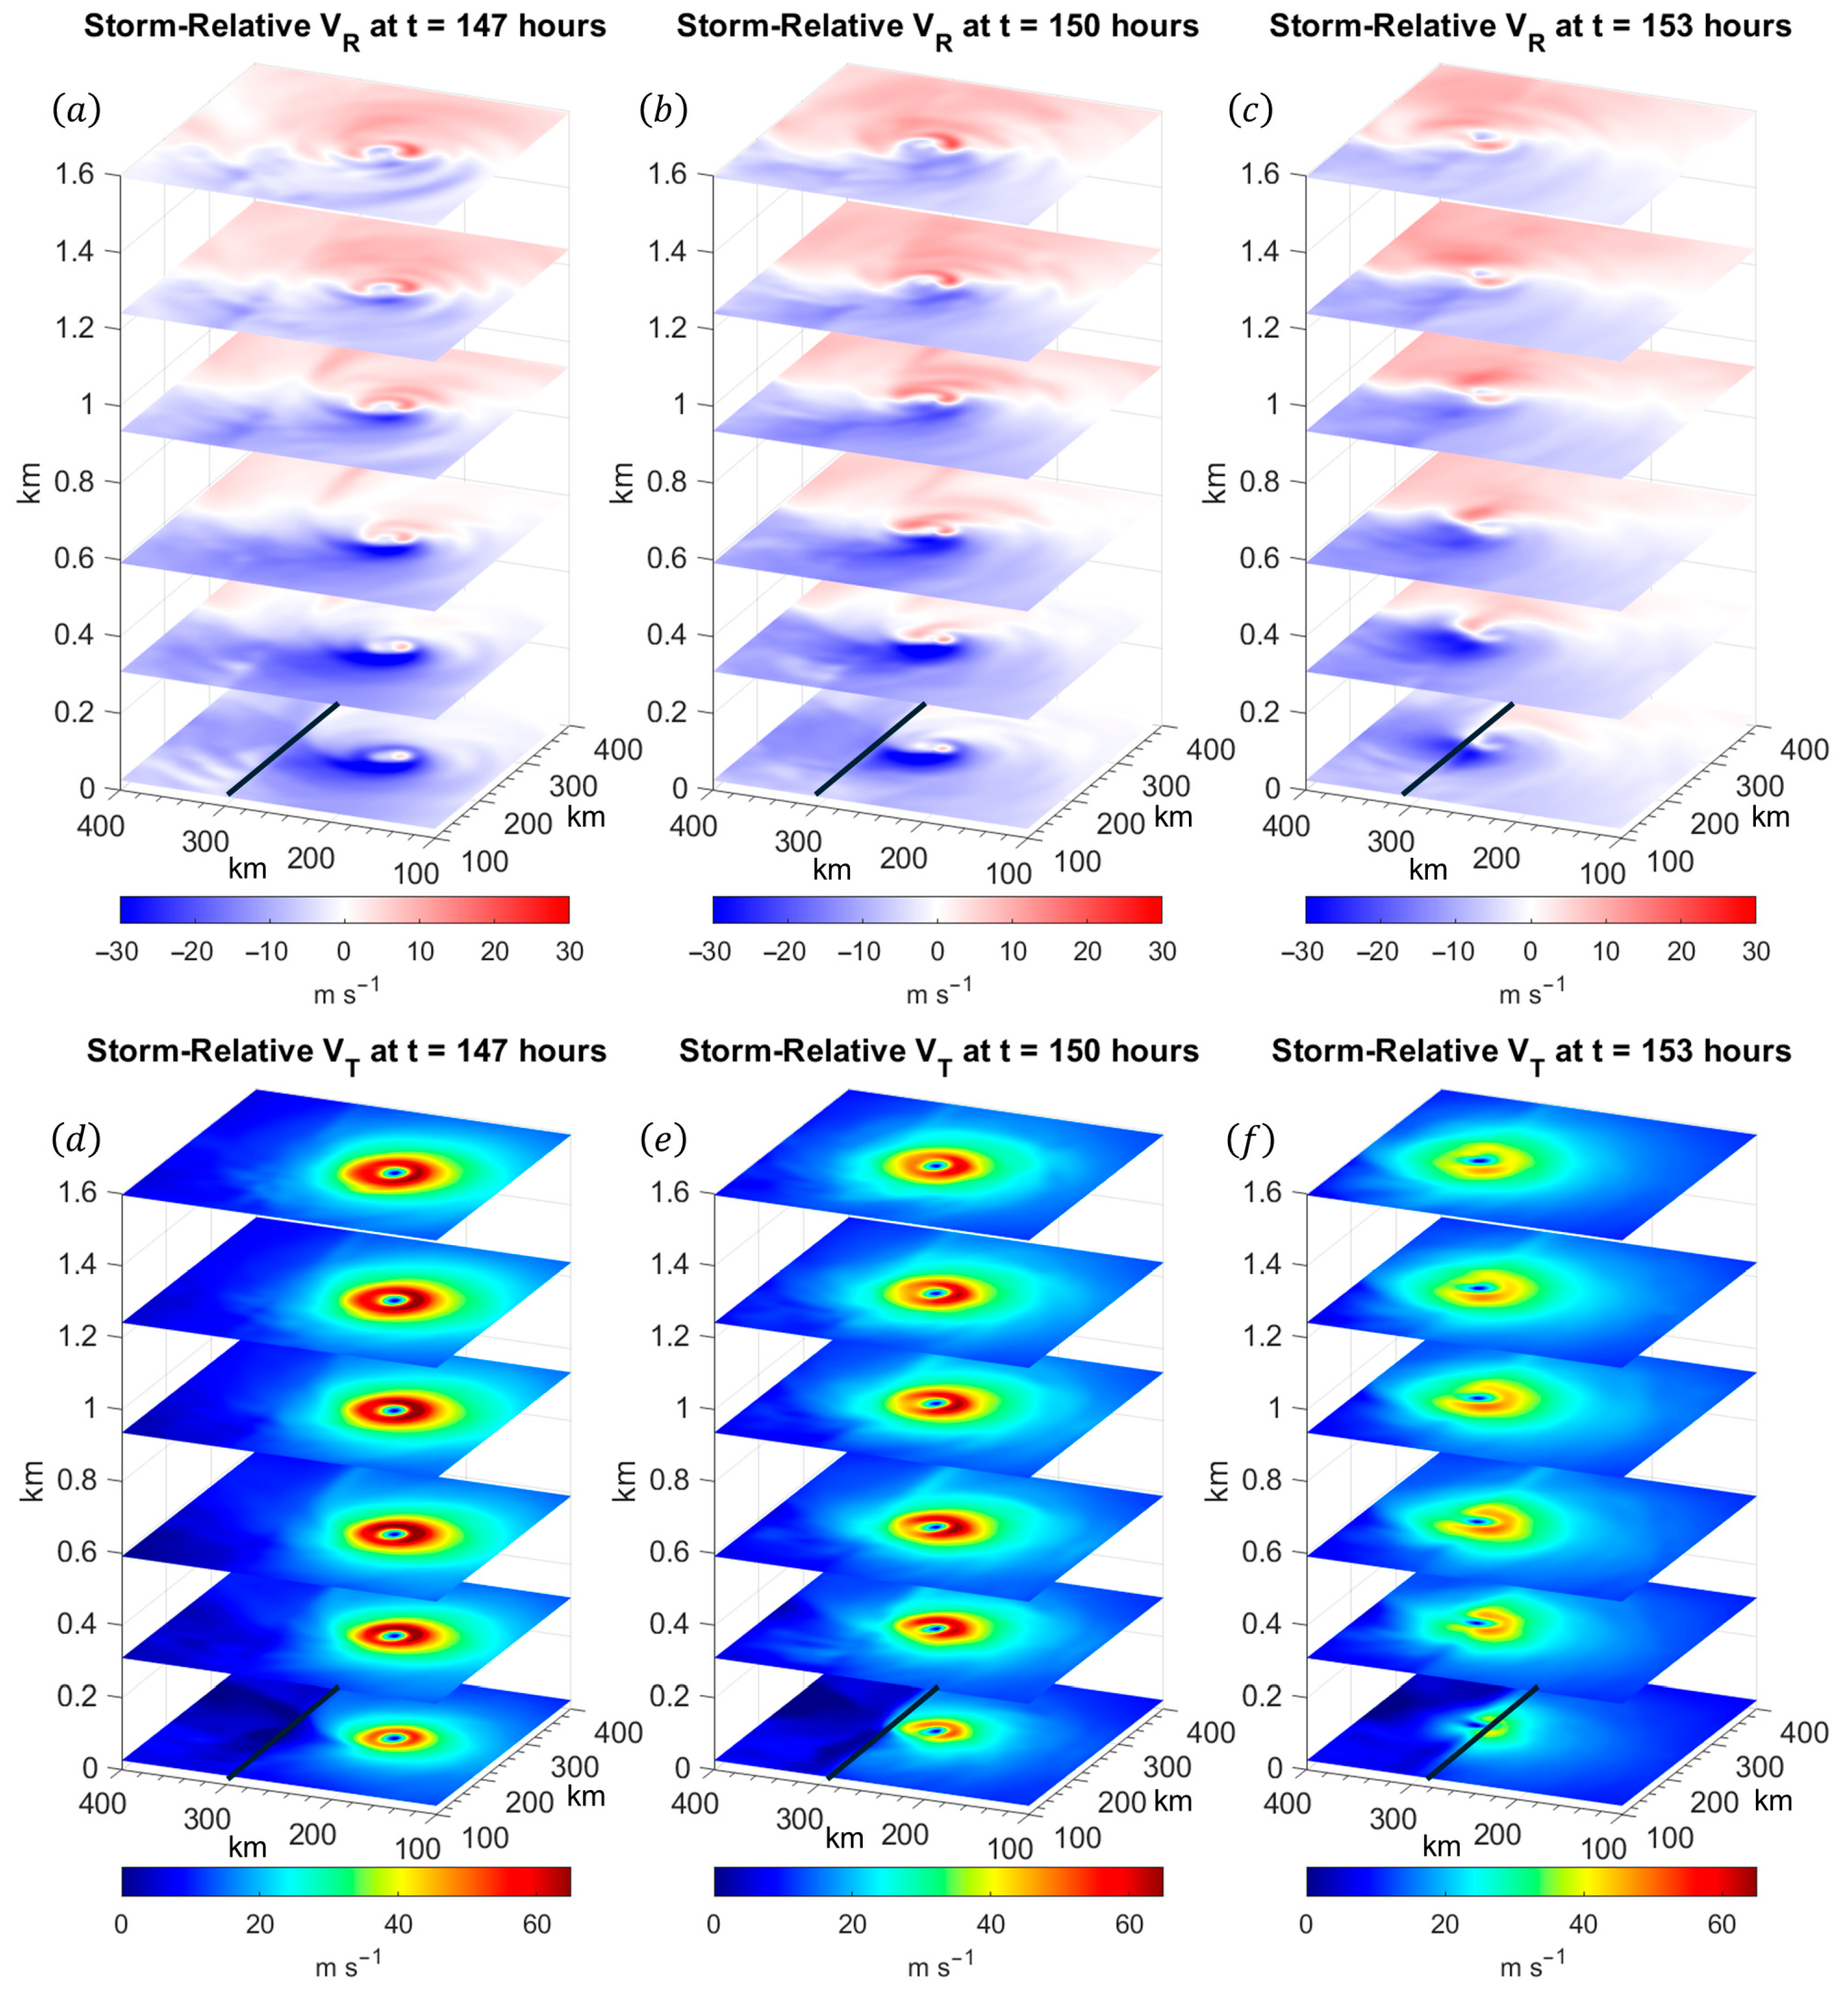
As the vortex moves towards the coastline, the kinematic fields undergo changes that are consistent with previous modeling and observational studies. Figure 4 shows the evolution of the storm-relative radial velocity when the vortex is within 100 km of the coastline. When the vortex center is 100 km from the coastline, radial inflow near the surface has shifted towards the front-left quadrant, and radial outflow persists ahead of the vortex above 1 km depth, as shown in Figure 4a. As the vortex moves closer to the coastline, radial inflow intensifies in the front-left quadrant within the inflow layer (as shown in Figure 4b), and the azimuthal winds shift towards the front-right quadrant, as shown in Figure 4d,e. By comparing Figure 4a with Figure 4c, it should be noted that the radial outflow has increased ahead of the vortex above 1 km, and the depth of the inflow layer has increased to the rear of the vortex. This increase in radial outflow is collocated with a decrease in azimuthal winds above 1 km, as shown by comparing Figure 4d with Figure 4e. As the vortex approaches the coastline, offshore flow wraps around the rear of the vortex, leading to divergence to the left of the vortex. Conversely, the front-right quadrant of the vortex experiences significant convergence as onshore flow decelerates in the presence of enhanced surface friction.
As the vortex center is near land, there is significant storm-relative inflow below 1 km in front of the vortex, and the outflow has shifted towards the rear of the vortex, as shown in Figure 4c. Thus, as the storm approaches the coastline, the inflow-layer depth increases from the front of the vortex to the rear of the vortex. The increase in inflow-layer depth is connected to the enhanced convergence towards the front of the vortex, which leads to enhanced rising motion to the front of the vortex and weak subsidence towards the rear of the vortex. In contrast, storm-relative radial outflow resides above the inflow layer in front of the vortex. As shown in Figure 4f, there is significant azimuthal flow above the inflow layer for the onshore portion of the vortex. This is consistent with the observational study of Alford et al. (2020) [31] in which an azimuthal wind maximum was observed above the TCBL onshore for Hurricane Irene (2011).
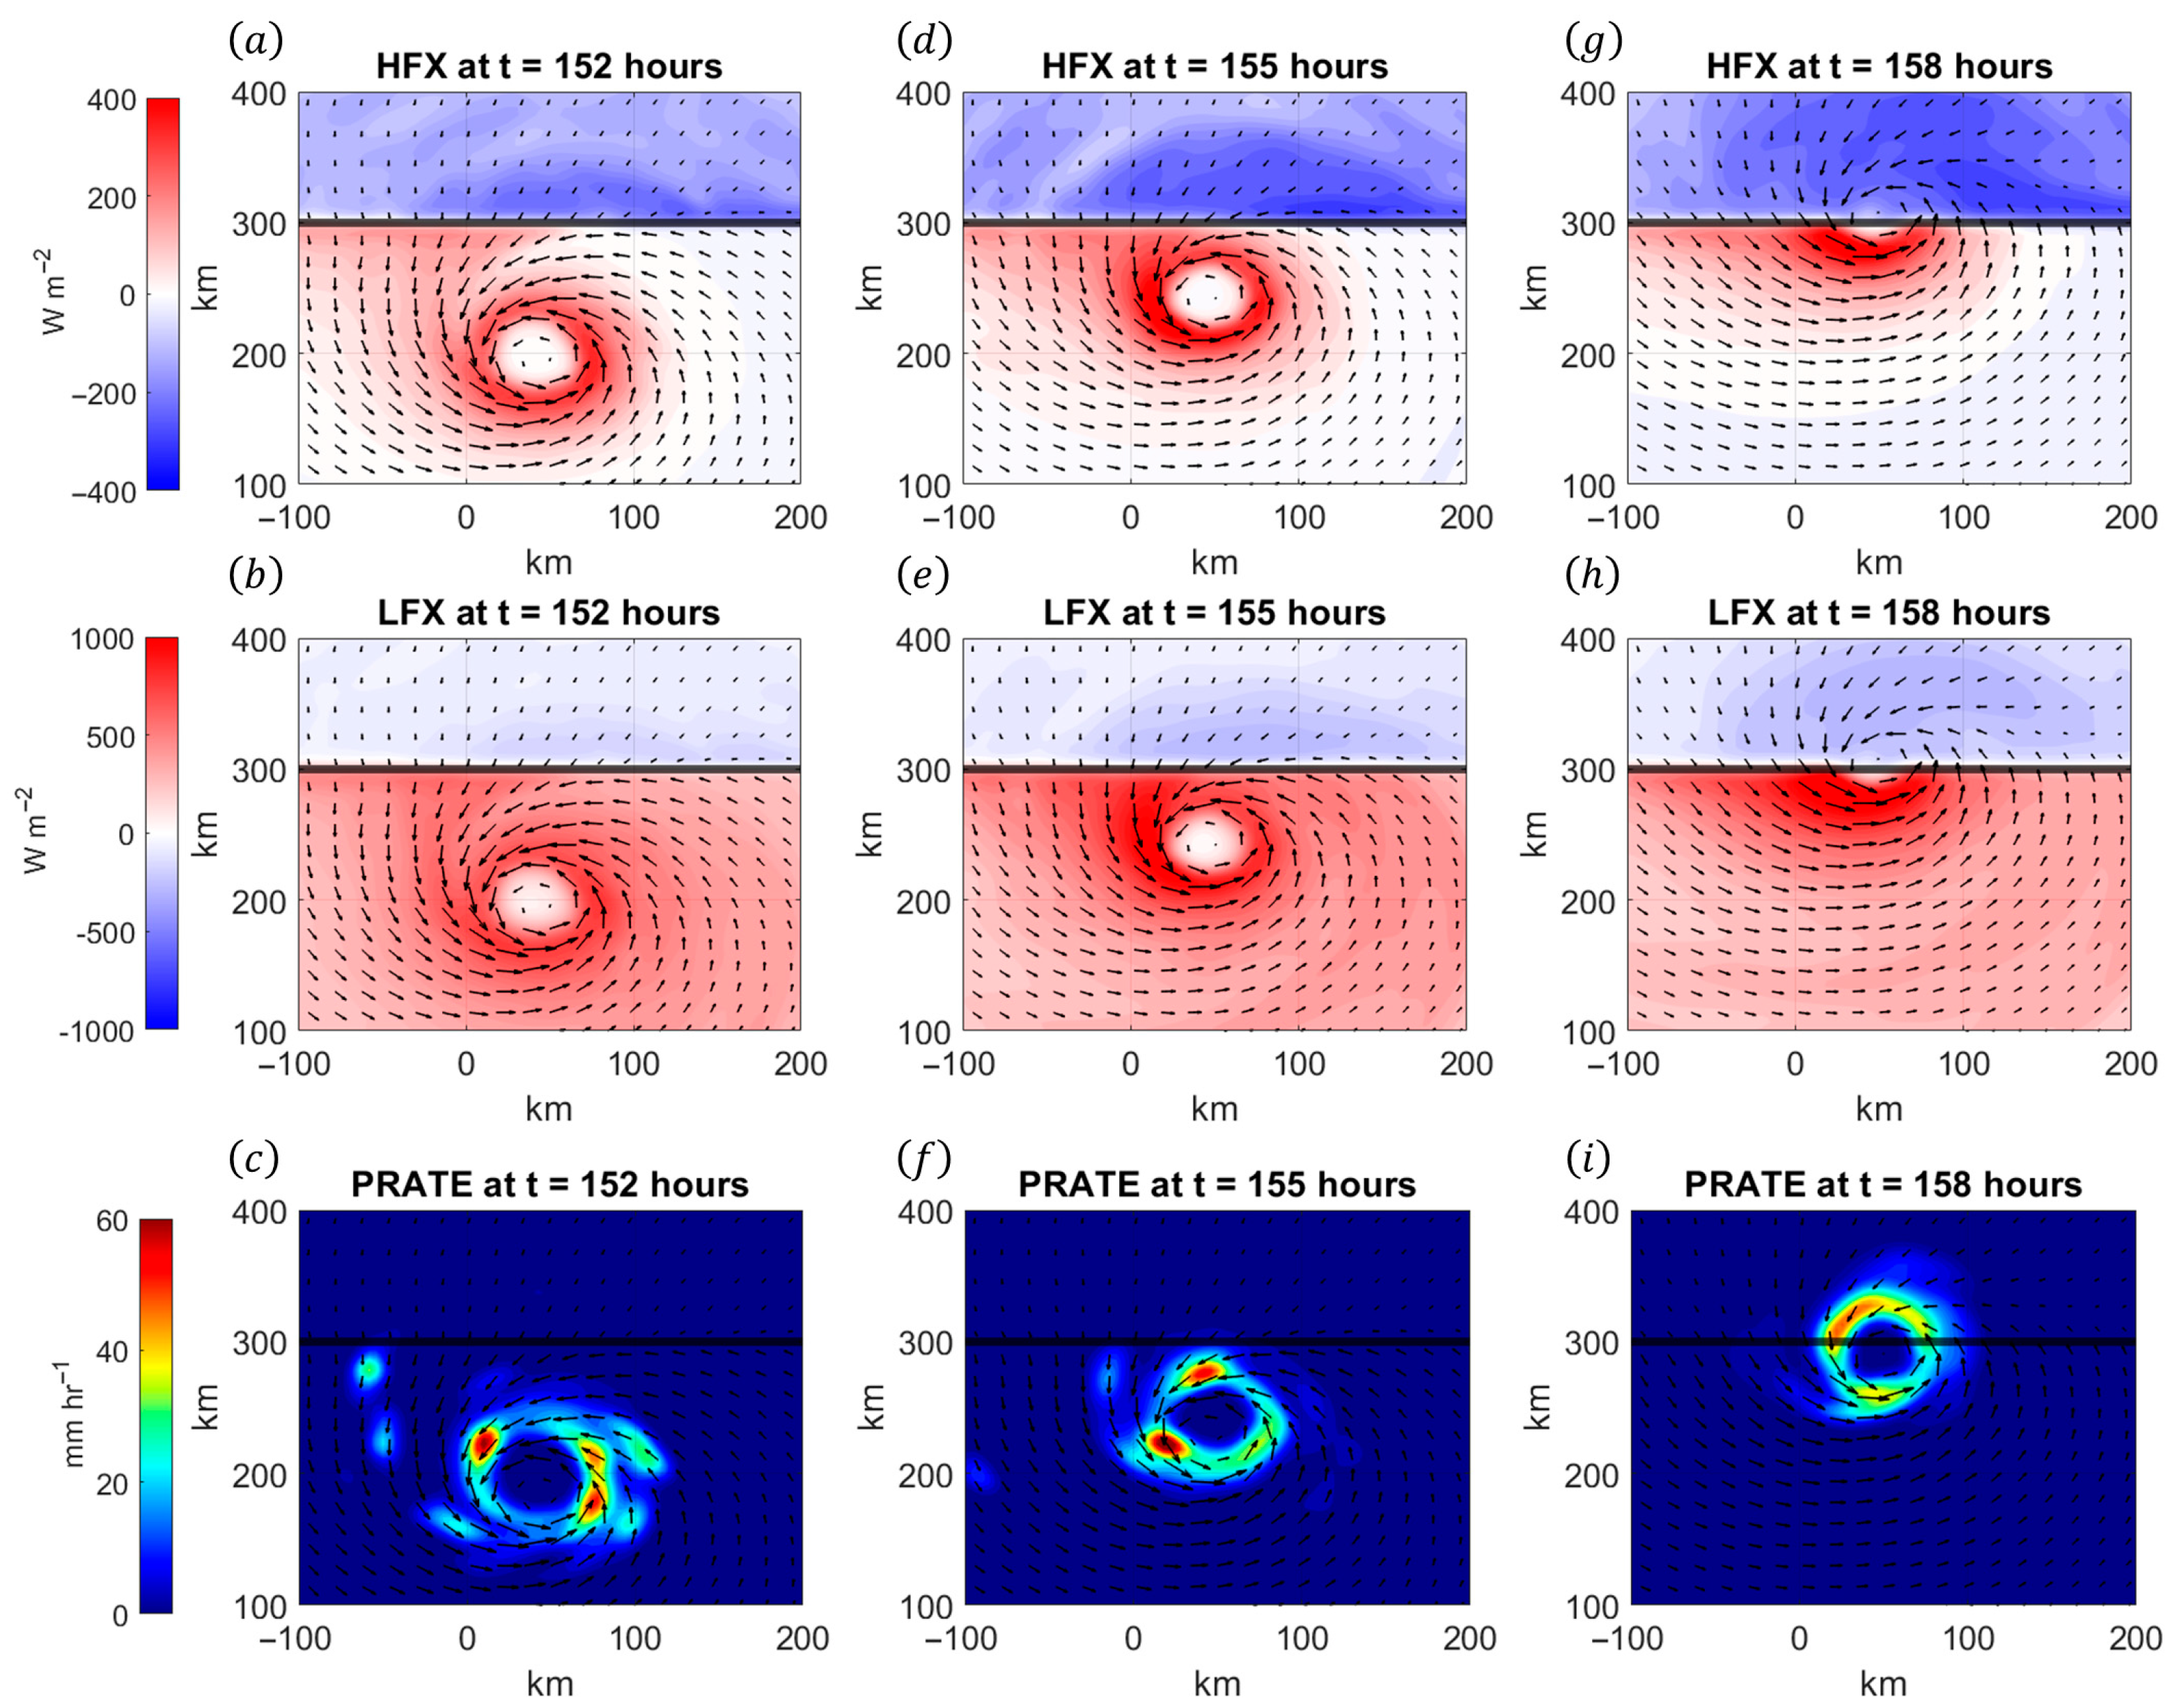
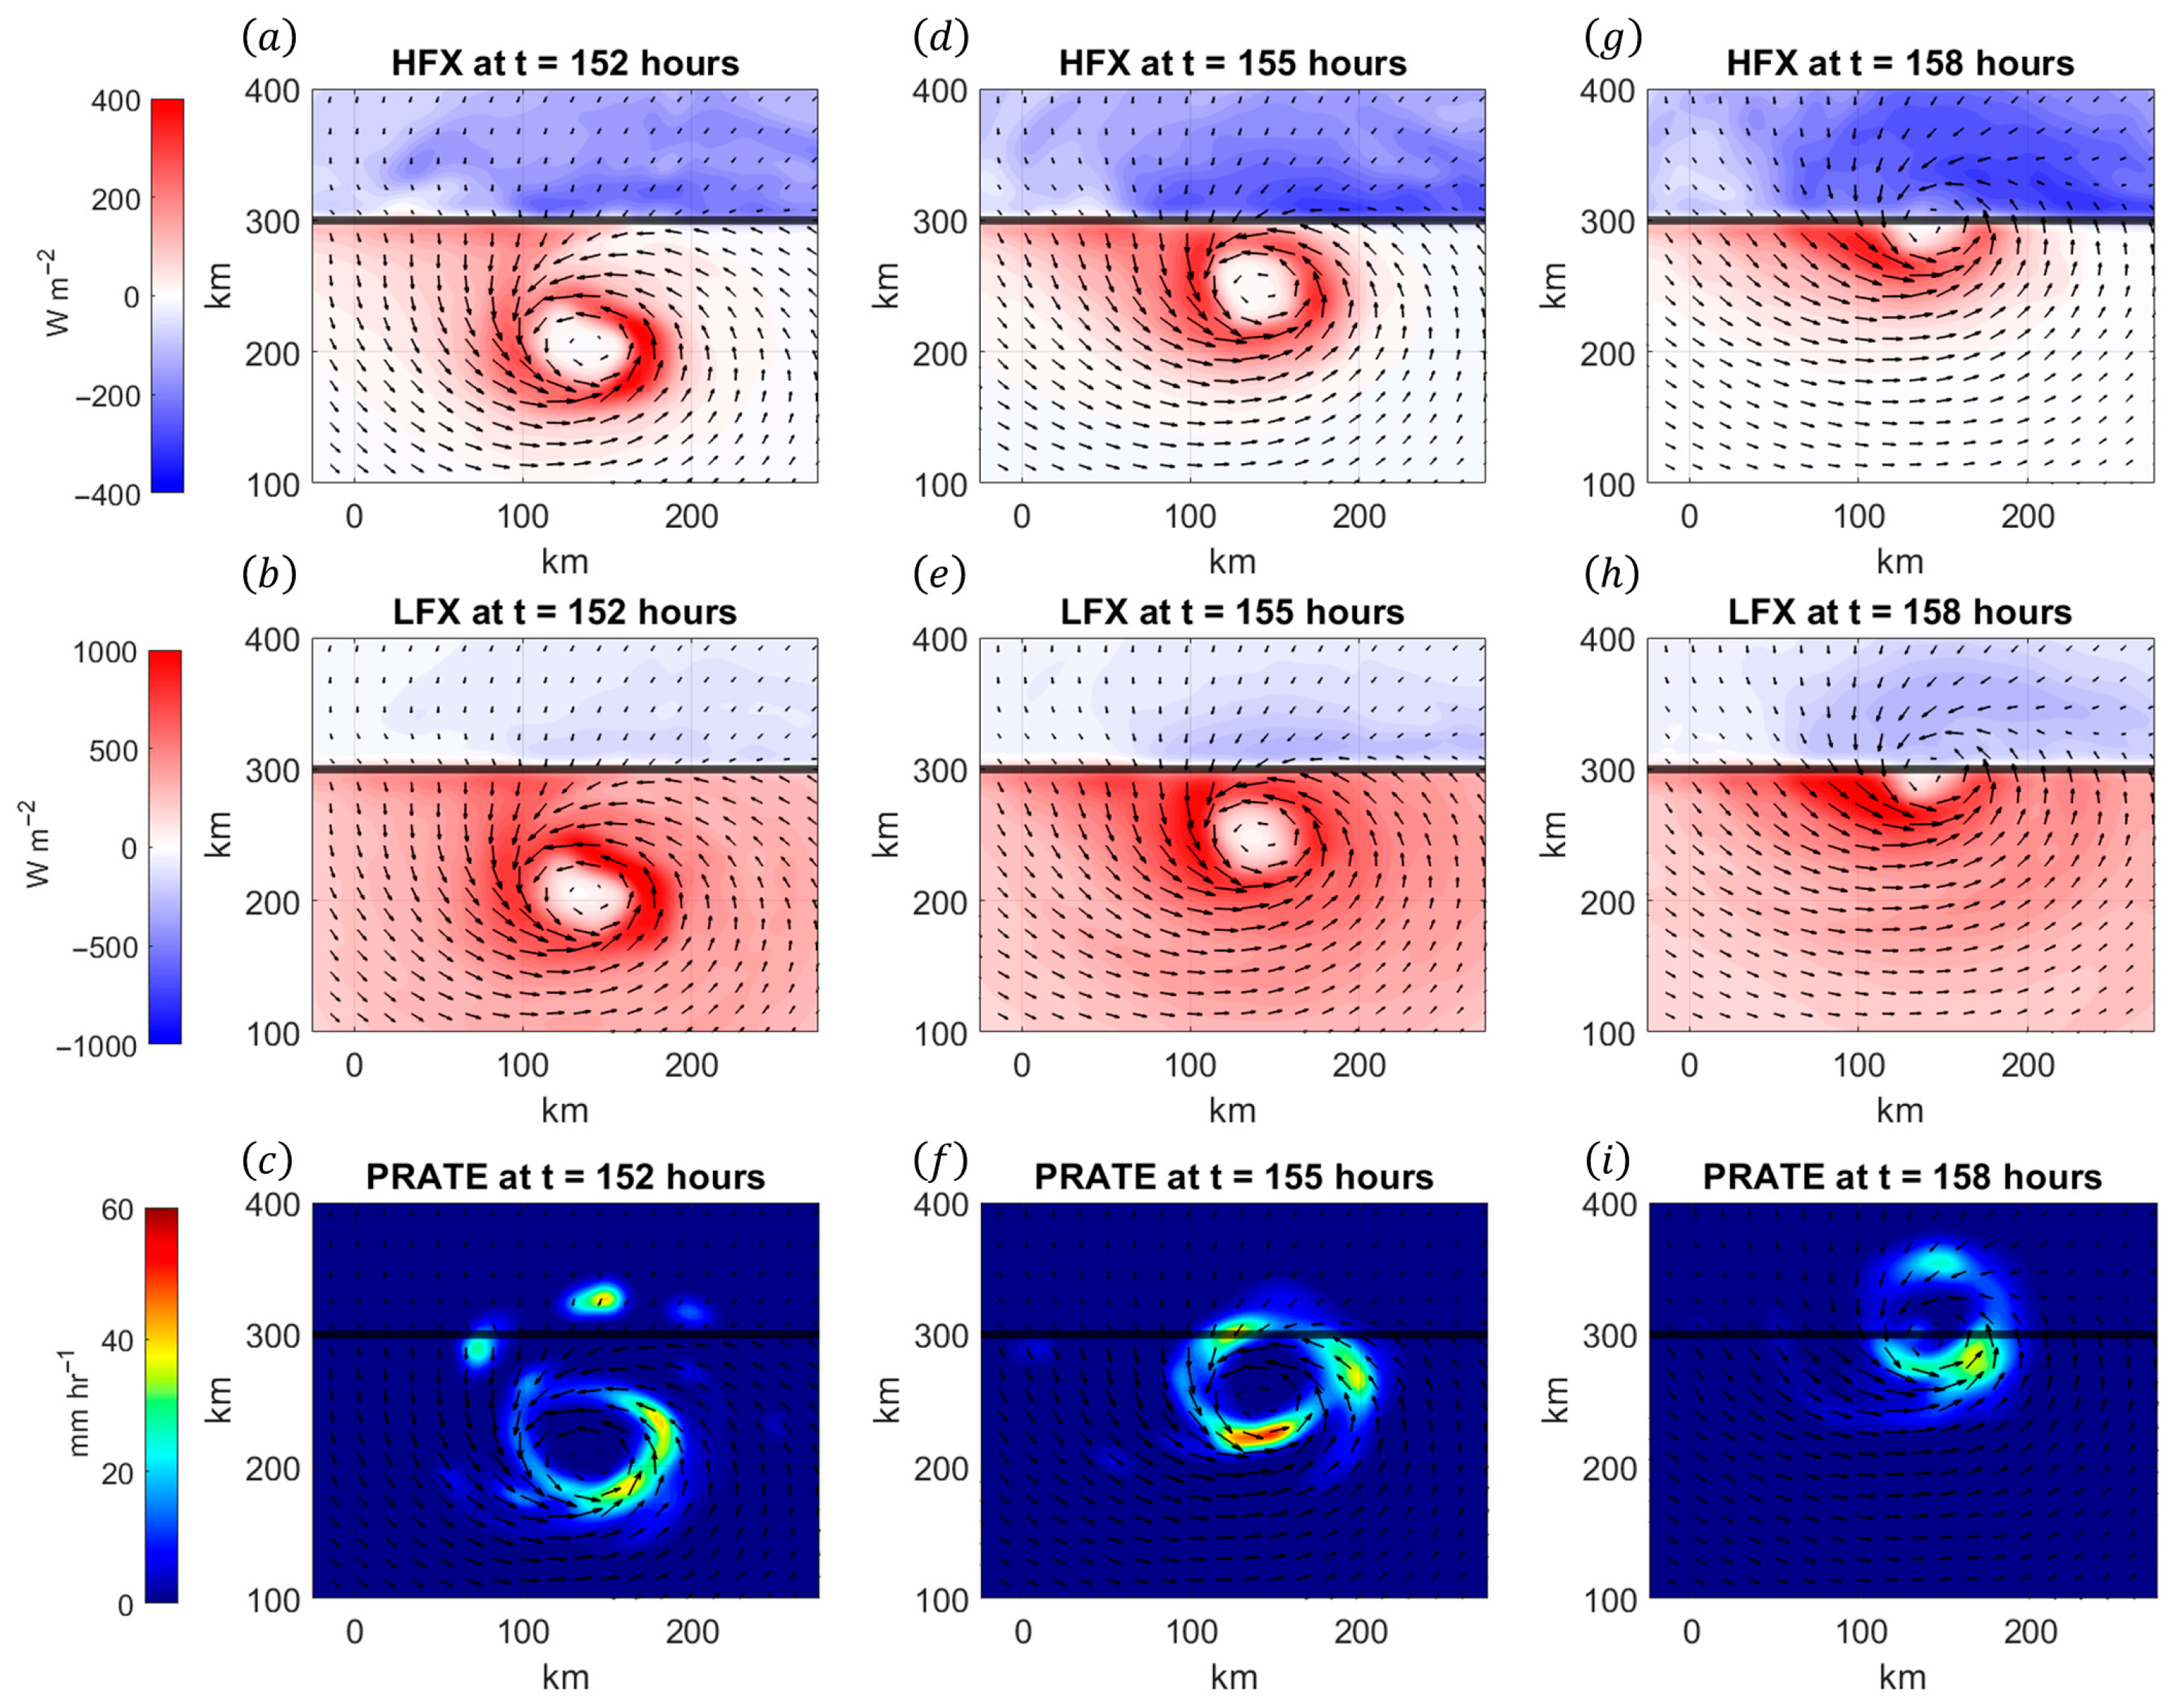
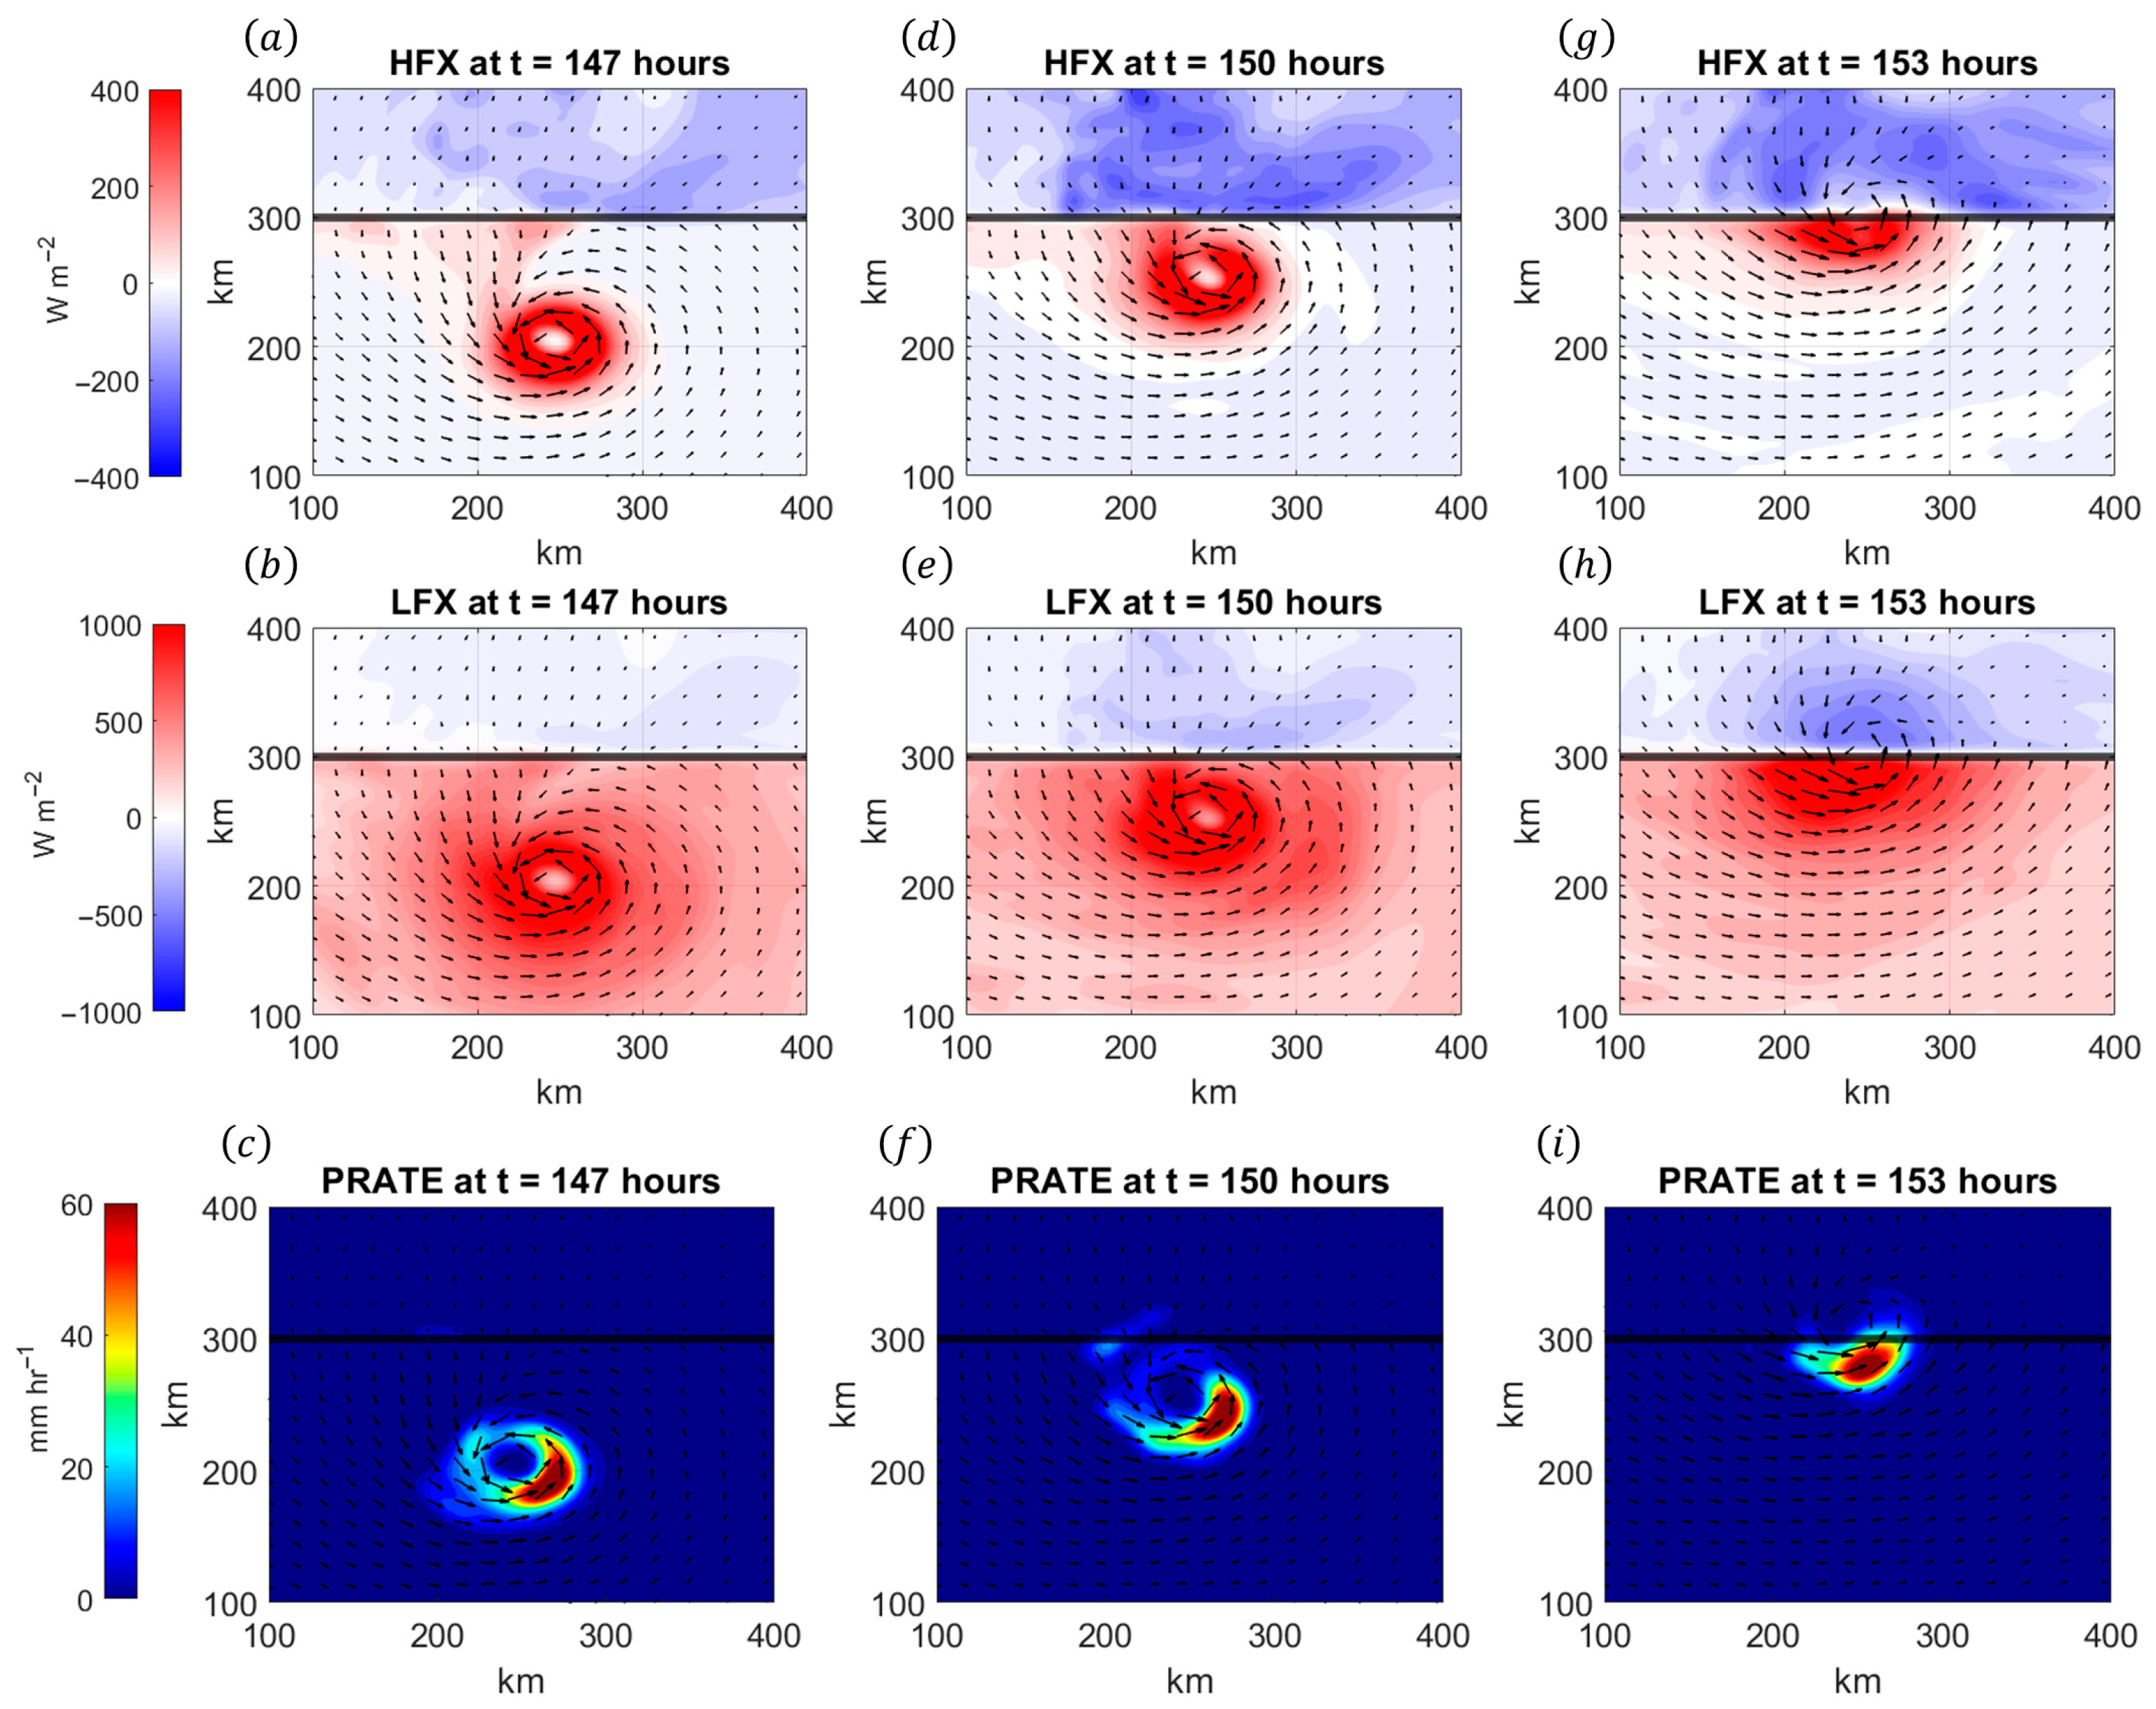
To begin our examination of the thermal changes in the TCBL during landfall, we begin with the surface fields. Figure 5 shows the evolution of the sensible heat flux, latent heat flux, and accumulated precipitation rate as the vortex approaches the coastal boundary. As shown in Figure 5a,b, the largest sensible and latent heat fluxes occur within the eyewall with a maximum in the front-right quadrant when the vortex is 100 km from the coastline, whereas the sensible and latent heat fluxes are negative onshore. The sign changes in the fluxes reflect the direction of potential temperature flux and specific humidity flux between the ocean and the near-surface air. Over the open ocean, there is an upward-directed moisture and heat flux due to the underlying surface. In contrast, as warm, moist onshore flow from the outer core of the TC moves across the land, the near-surface air temperature begins to exceed the LST, producing negative sensible heat flux. Similarly, the moisture content of near-surface onshore flow compared to the underlying land surface produces negative latent heat flux. As the vortex approaches the coastline, there is a temporary increase in sensible heat flux (as shown in Figure 5d,g) and latent heat flux (as shown in Figure 5e,h). By examining the 10 m wind field, it should be noted that the increase in heat flux corresponds to the enhanced convergence by the 10 m wind in front of the vortex. As the vortex makes landfall, enhanced surface convergence shifts towards the rear of the vortex, leading to enhanced surface heat fluxes within this region as shown in Figure 5g,h. The dynamical connection between the enhanced heat flux and the radial velocity field for a landfalling vortex is consistent with the anomalous secondary circulation generated by a landfalling TC as shown in recent modeling studies [13,37].
The structure of the TCBL is not only affected by heat fluxes from the underlying surface, but it is also influenced by precipitation changes above the TCBL. As the vortex approaches the coastline, a maximum in rainfall precipitation rate develops to the front-left quadrant of the vortex, as shown in Figure 5f. By comparing Figure 5 with Figure 4, it should be noted that asymmetries in rainfall precipitation are strongly influenced by the radial velocity field. When the vortex is 100 km away from the coastline, the maximum precipitation rate in the front-left quadrant in Figure 5c corresponds to the maximum in storm-relative inflow shown in Figure 4a. As the vortex moves towards the coastline, storm-relative inflow shifts preferentially towards the front of the vortex, and the azimuthal wind advects rainfall downstream such that the precipitation rate maximizes ahead of the vortex, consistent with previous studies on rainfall distribution for landfalling TCs [58]. In addition, the azimuthal shift in precipitation maxima is modulated by land surface conditions. Sensitivity analysis indicates that increases in land surface roughness lengths lead to a greater deceleration of the near-surface winds over land, which produces more asymmetric convergence shortly. The enhanced asymmetric convergence leads to locally elevated rainfall immediately before and immediately after the landfall transition.
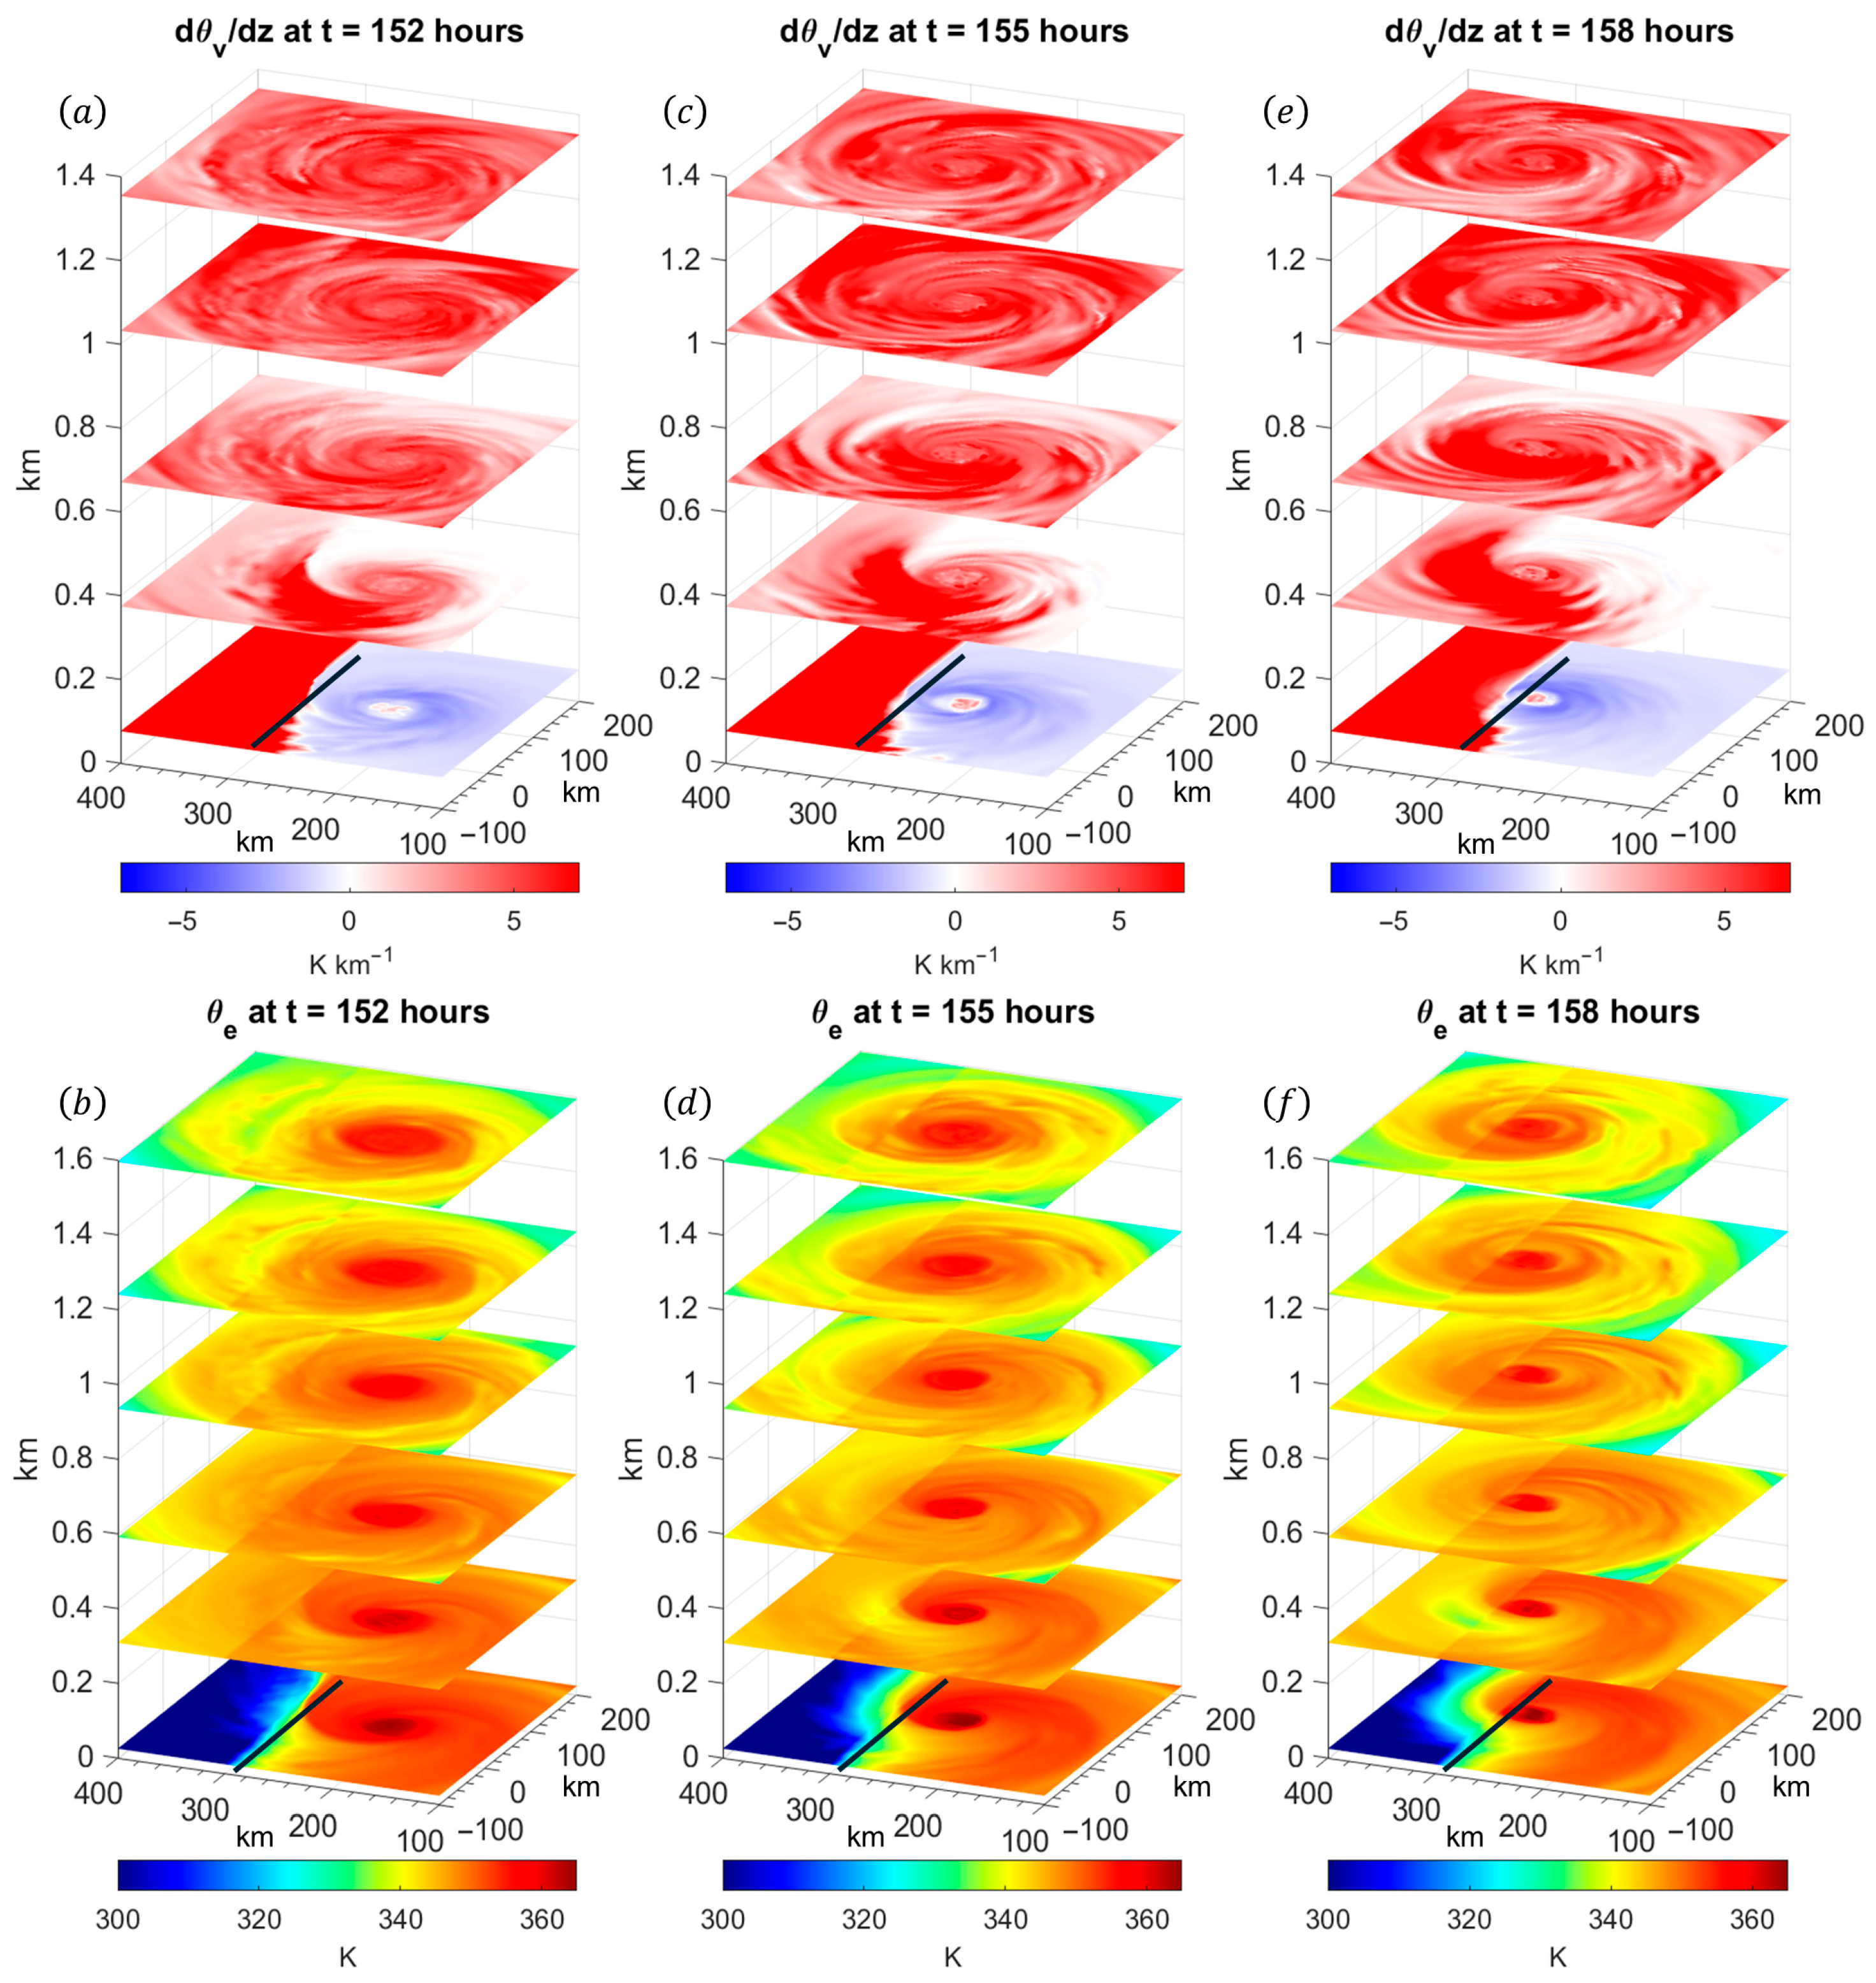
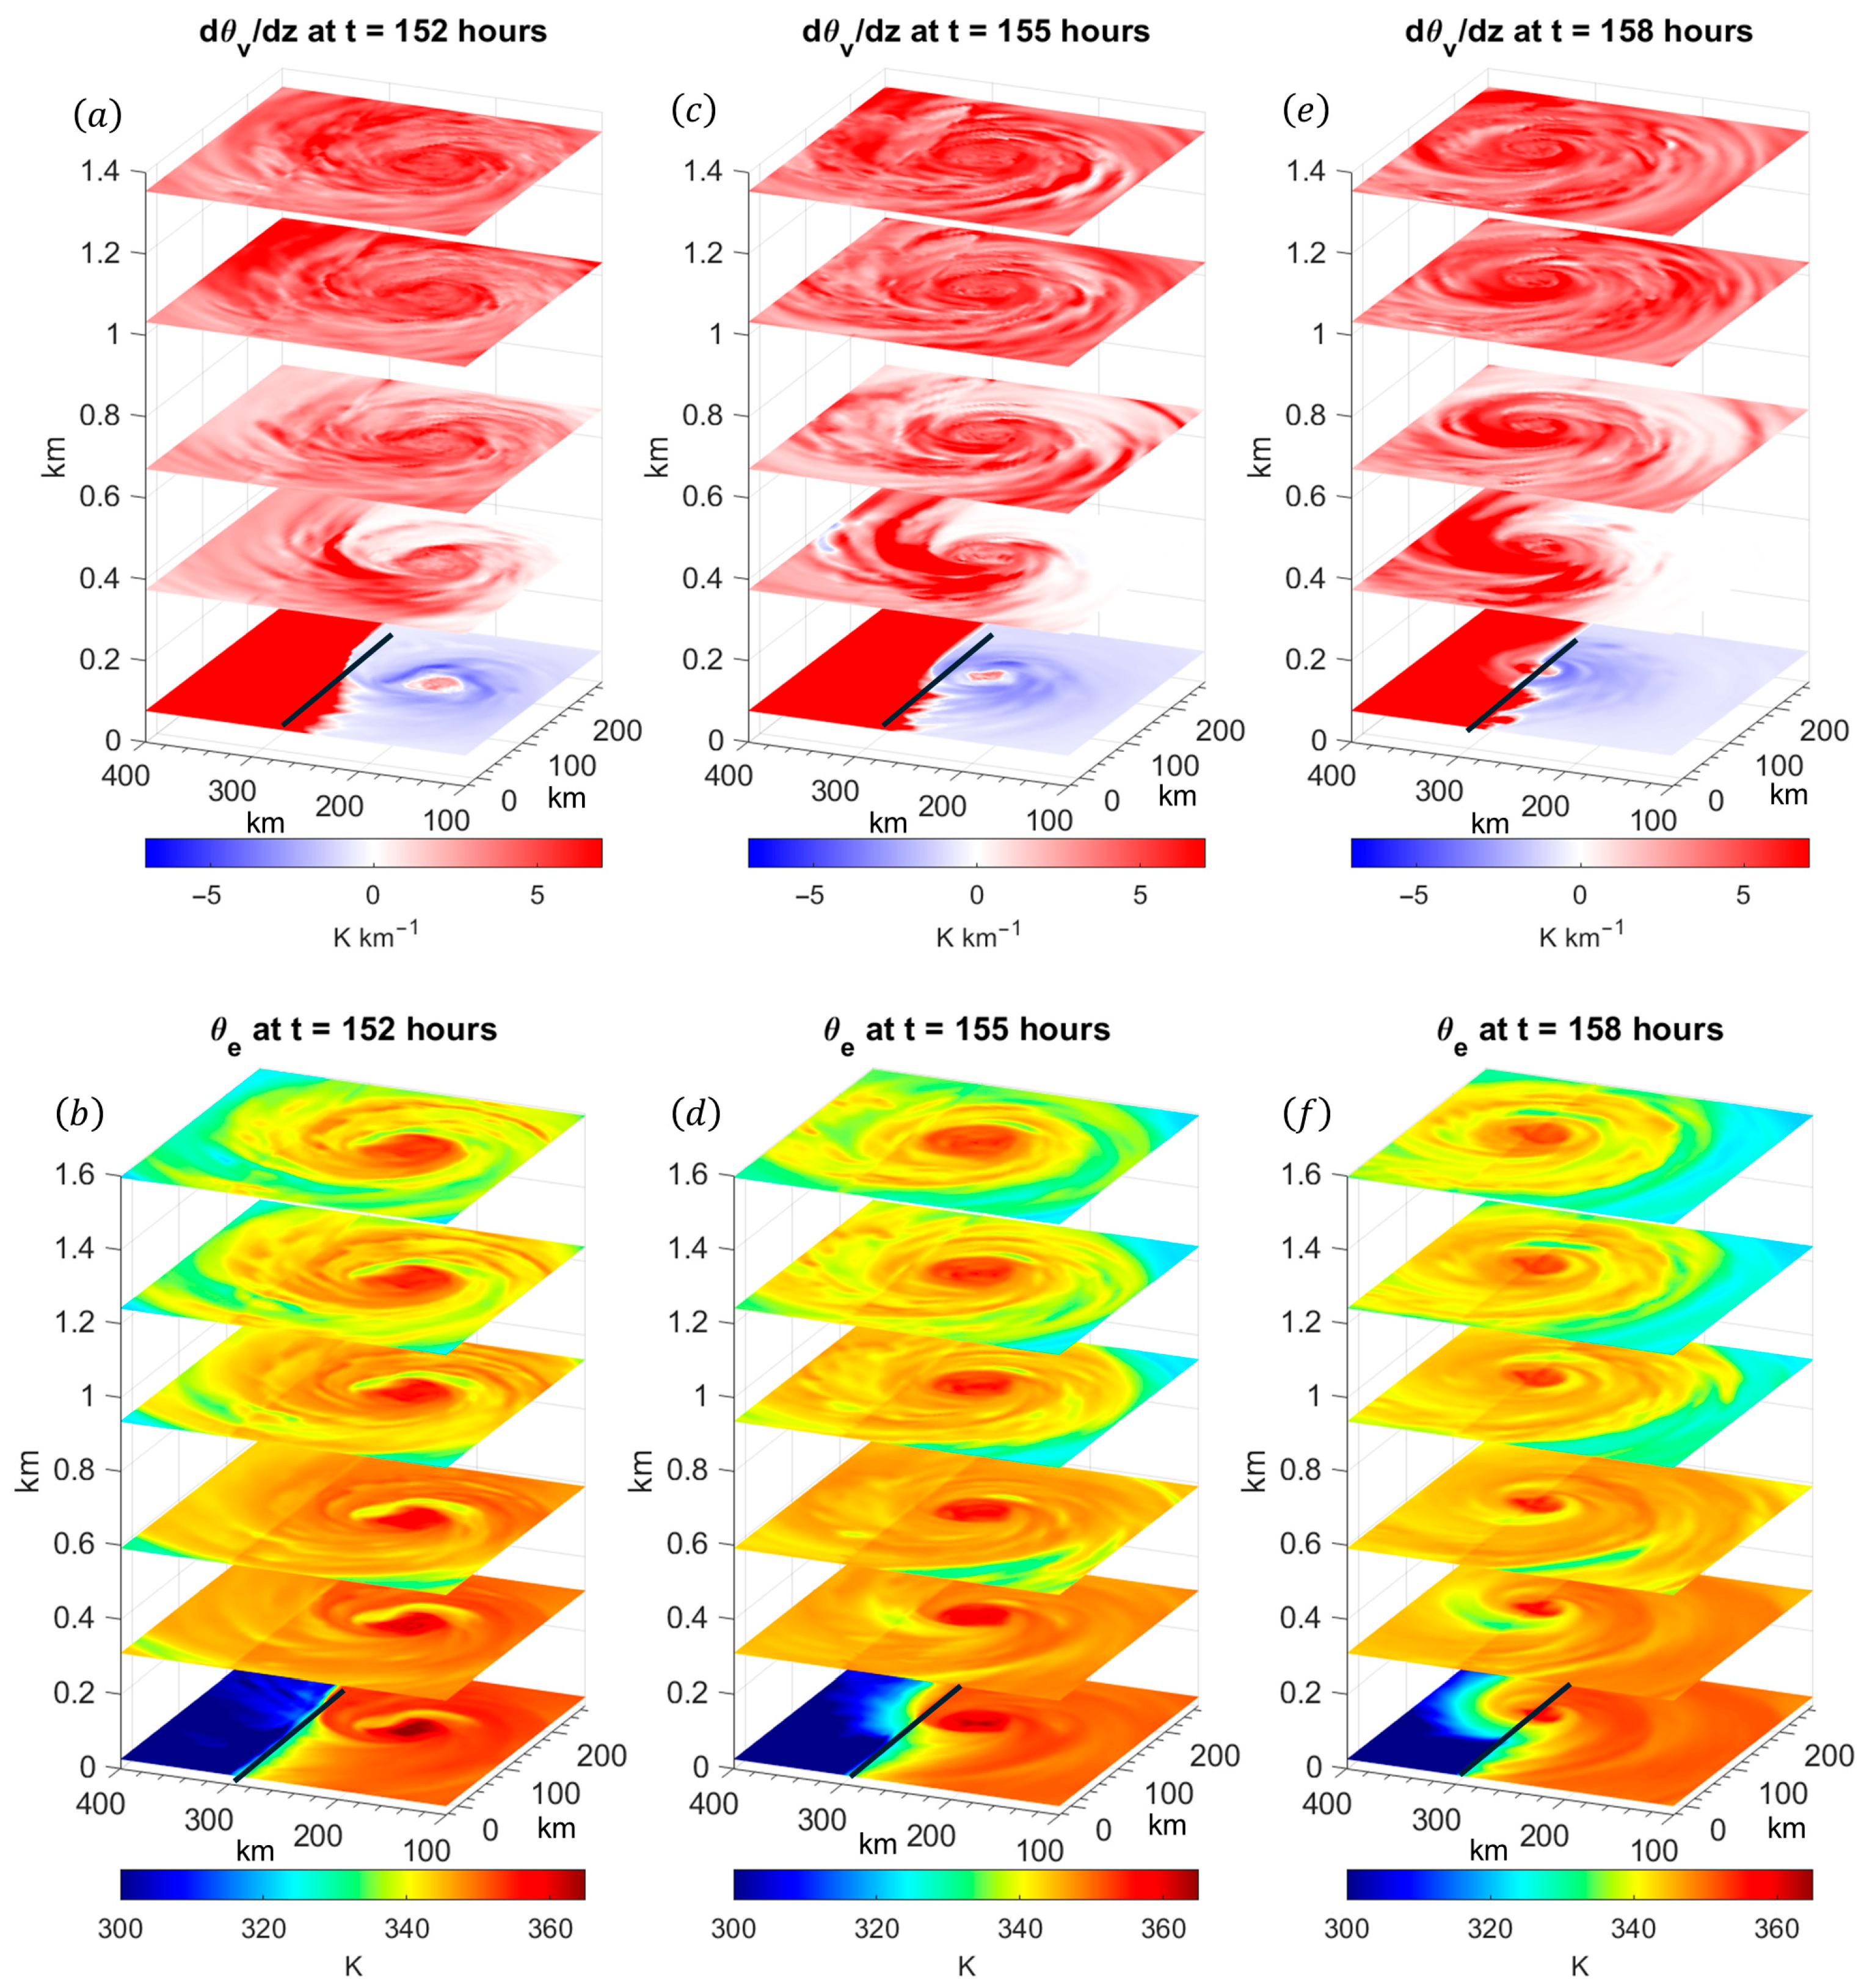
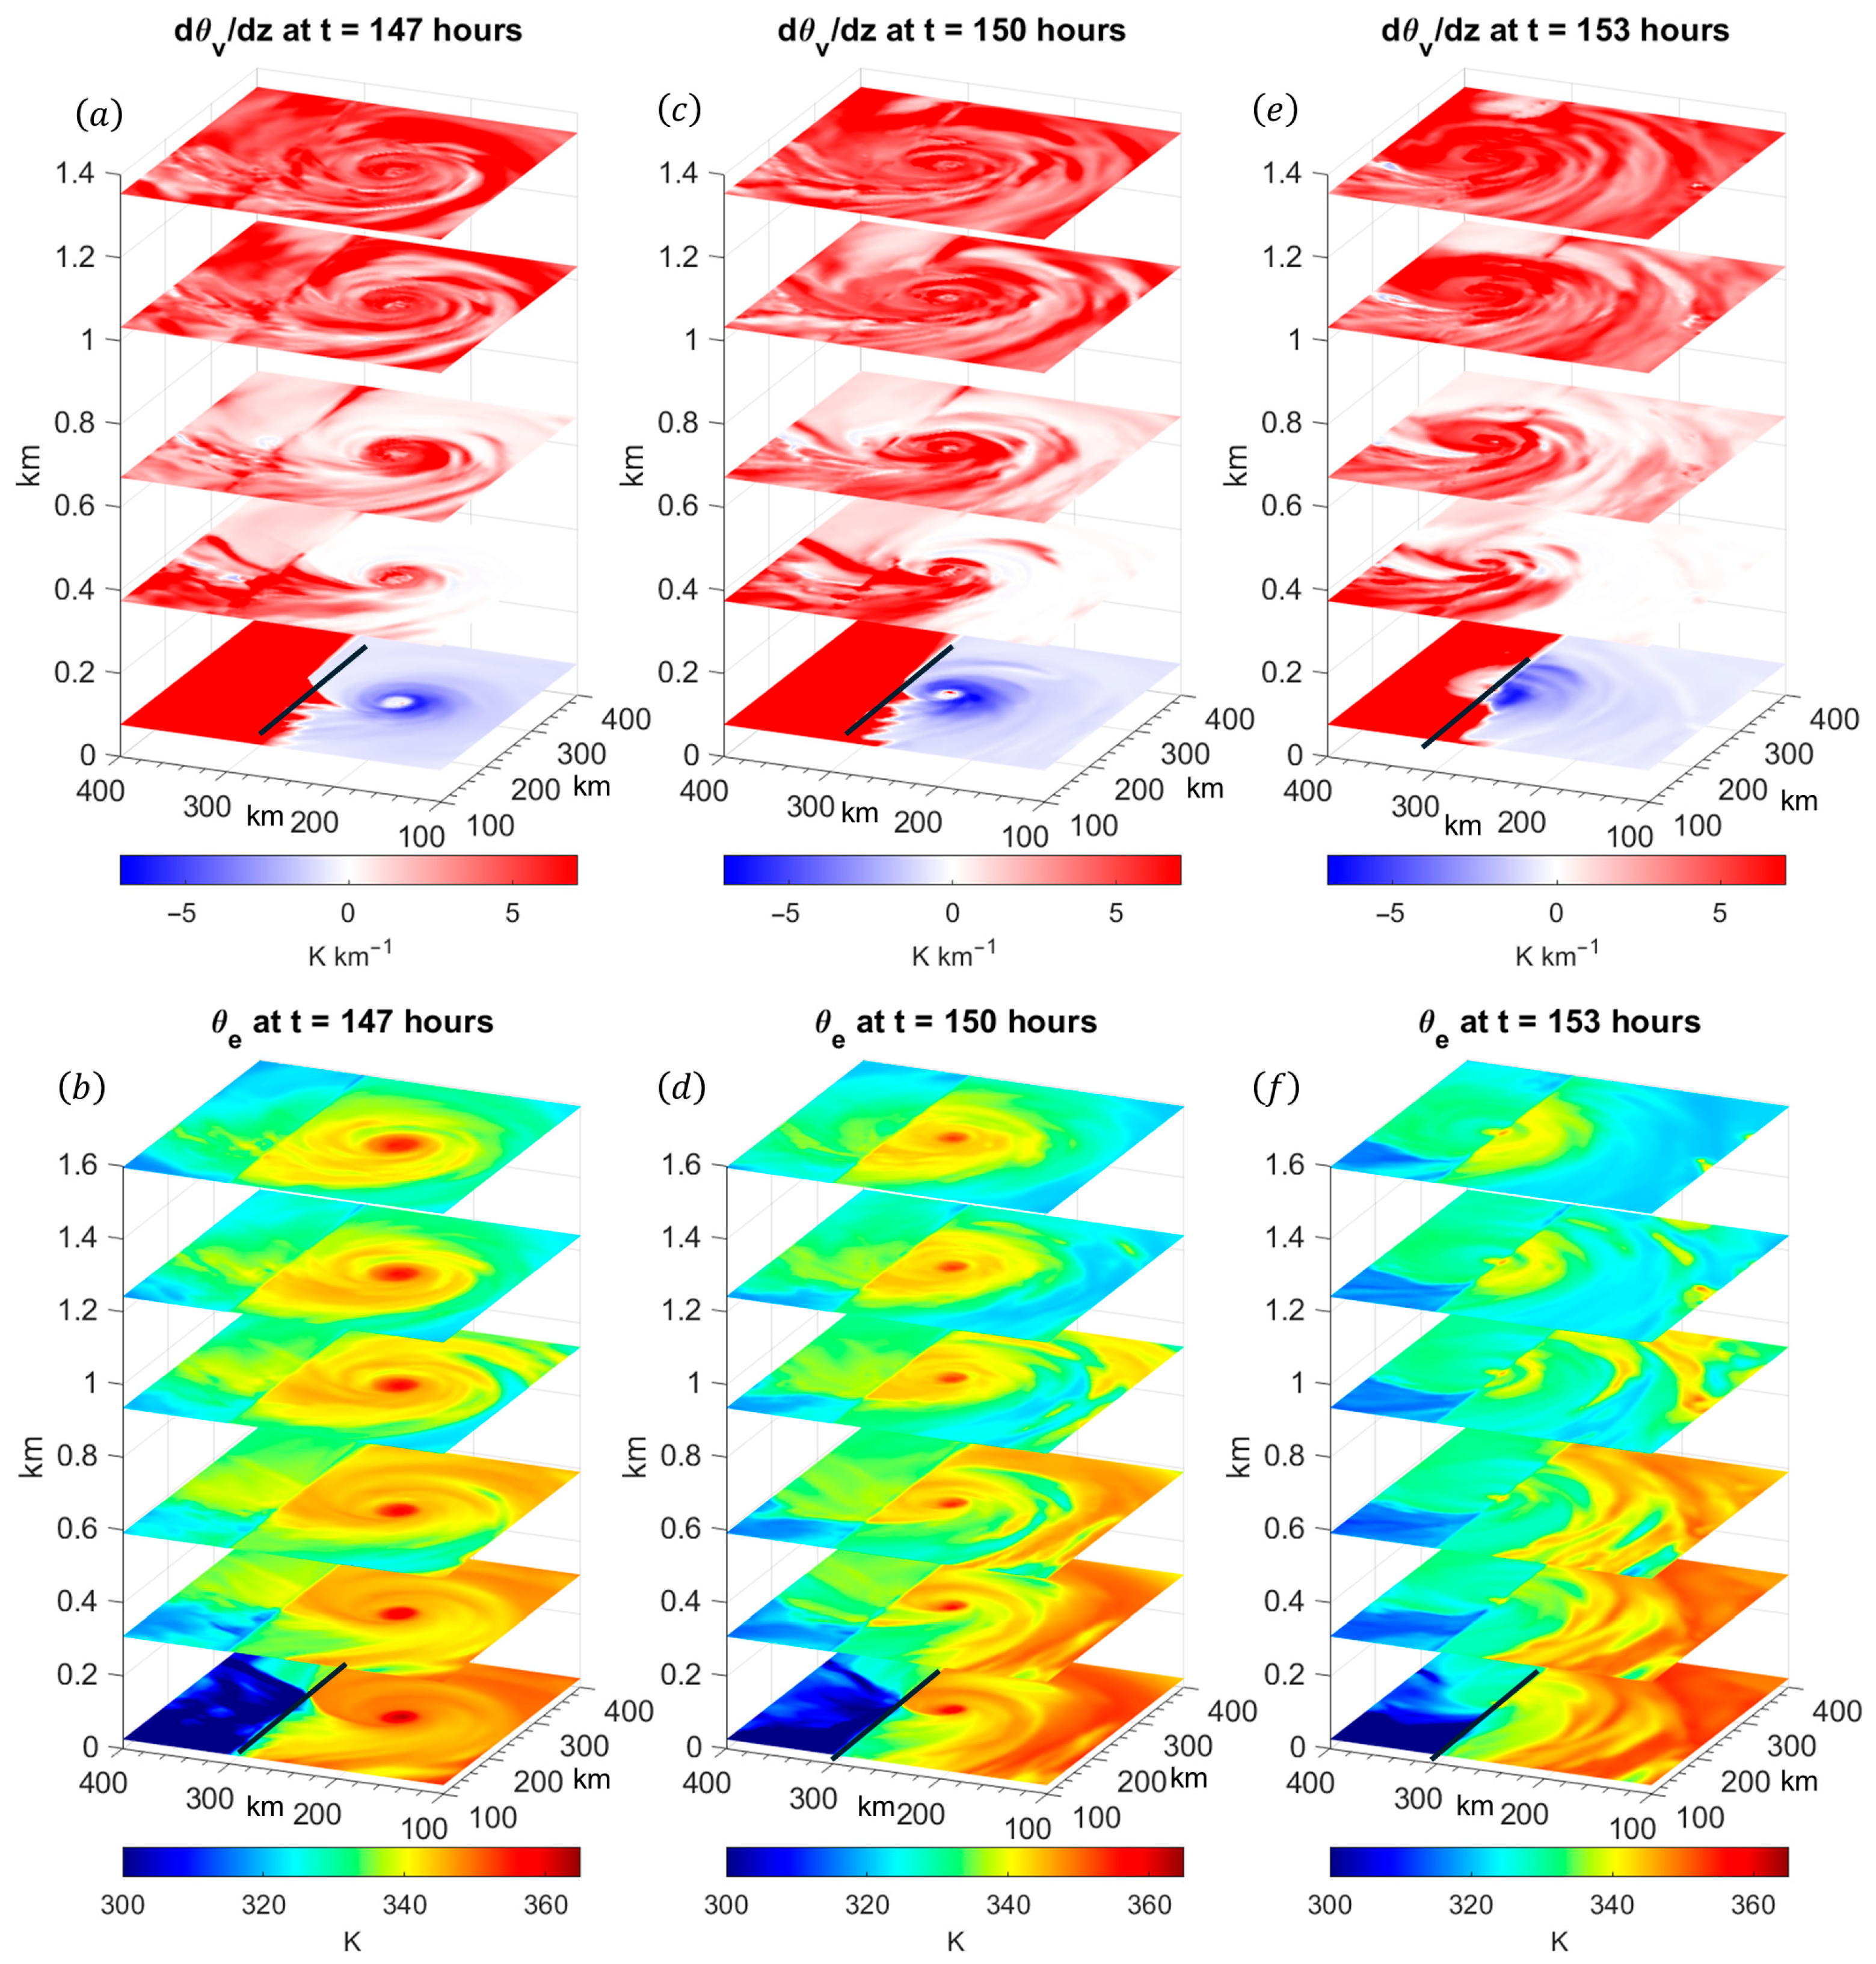
The evolution of the heat fluxes and kinematic fields has a direct impact upon the thermal stability of the TCBL, as shown in Figure 6. When the vortex is 100 km from the coast, there is a minimum of thermal stability behind the vortex within the eyewall as shown in Figure 6a. By comparing Figure 6a to Figure 5a, we note that the maximum in sensible and latent heat flux is partly responsible for the reduced thermal stability. As shown in Figure 6b, offshore flow advects low θ e air towards the vortex such that the left-side of the vortex is characterized by lower θ e compared to the right side. As the vortex approaches land, there is a noticeable decrease in θ e onshore (as shown in Figure 6d), which is connected to the decrease in sensible heat flux (as shown in Figure 5d). As low θ e air is advected towards the left of the vortex, there is a gradual increase in the thermal stability in this region as shown in Figure 6c. However, there is a decrease in thermal stability to the rear and to the right of the vortex, which is collocated with the enhanced heat flux within this region as shown in Figure 5d,e. Thus, as the vortex approaches the coastline, thermal stability decreases from left to right across the vortex. When the vortex reaches the coastline, the minimum in thermal stability rotates towards the rear-right quadrant of the vortex. The reduced thermal stability enables turbulent mixing to occur such that the thermodynamic mixed layer extends to greater depth behind the vortex. The impact of this mixing can be seen in θ e in which the spiral band in the right-rear quadrant is characterized by nearly constant θ e as shown in Figure 6d. As the vortex approaches the coast, this spiral band rotates towards the left of the vortex above the thermodynamic TCBL height.

3.2. Turbulence and Moisture Structure of the TCBL During Landfall

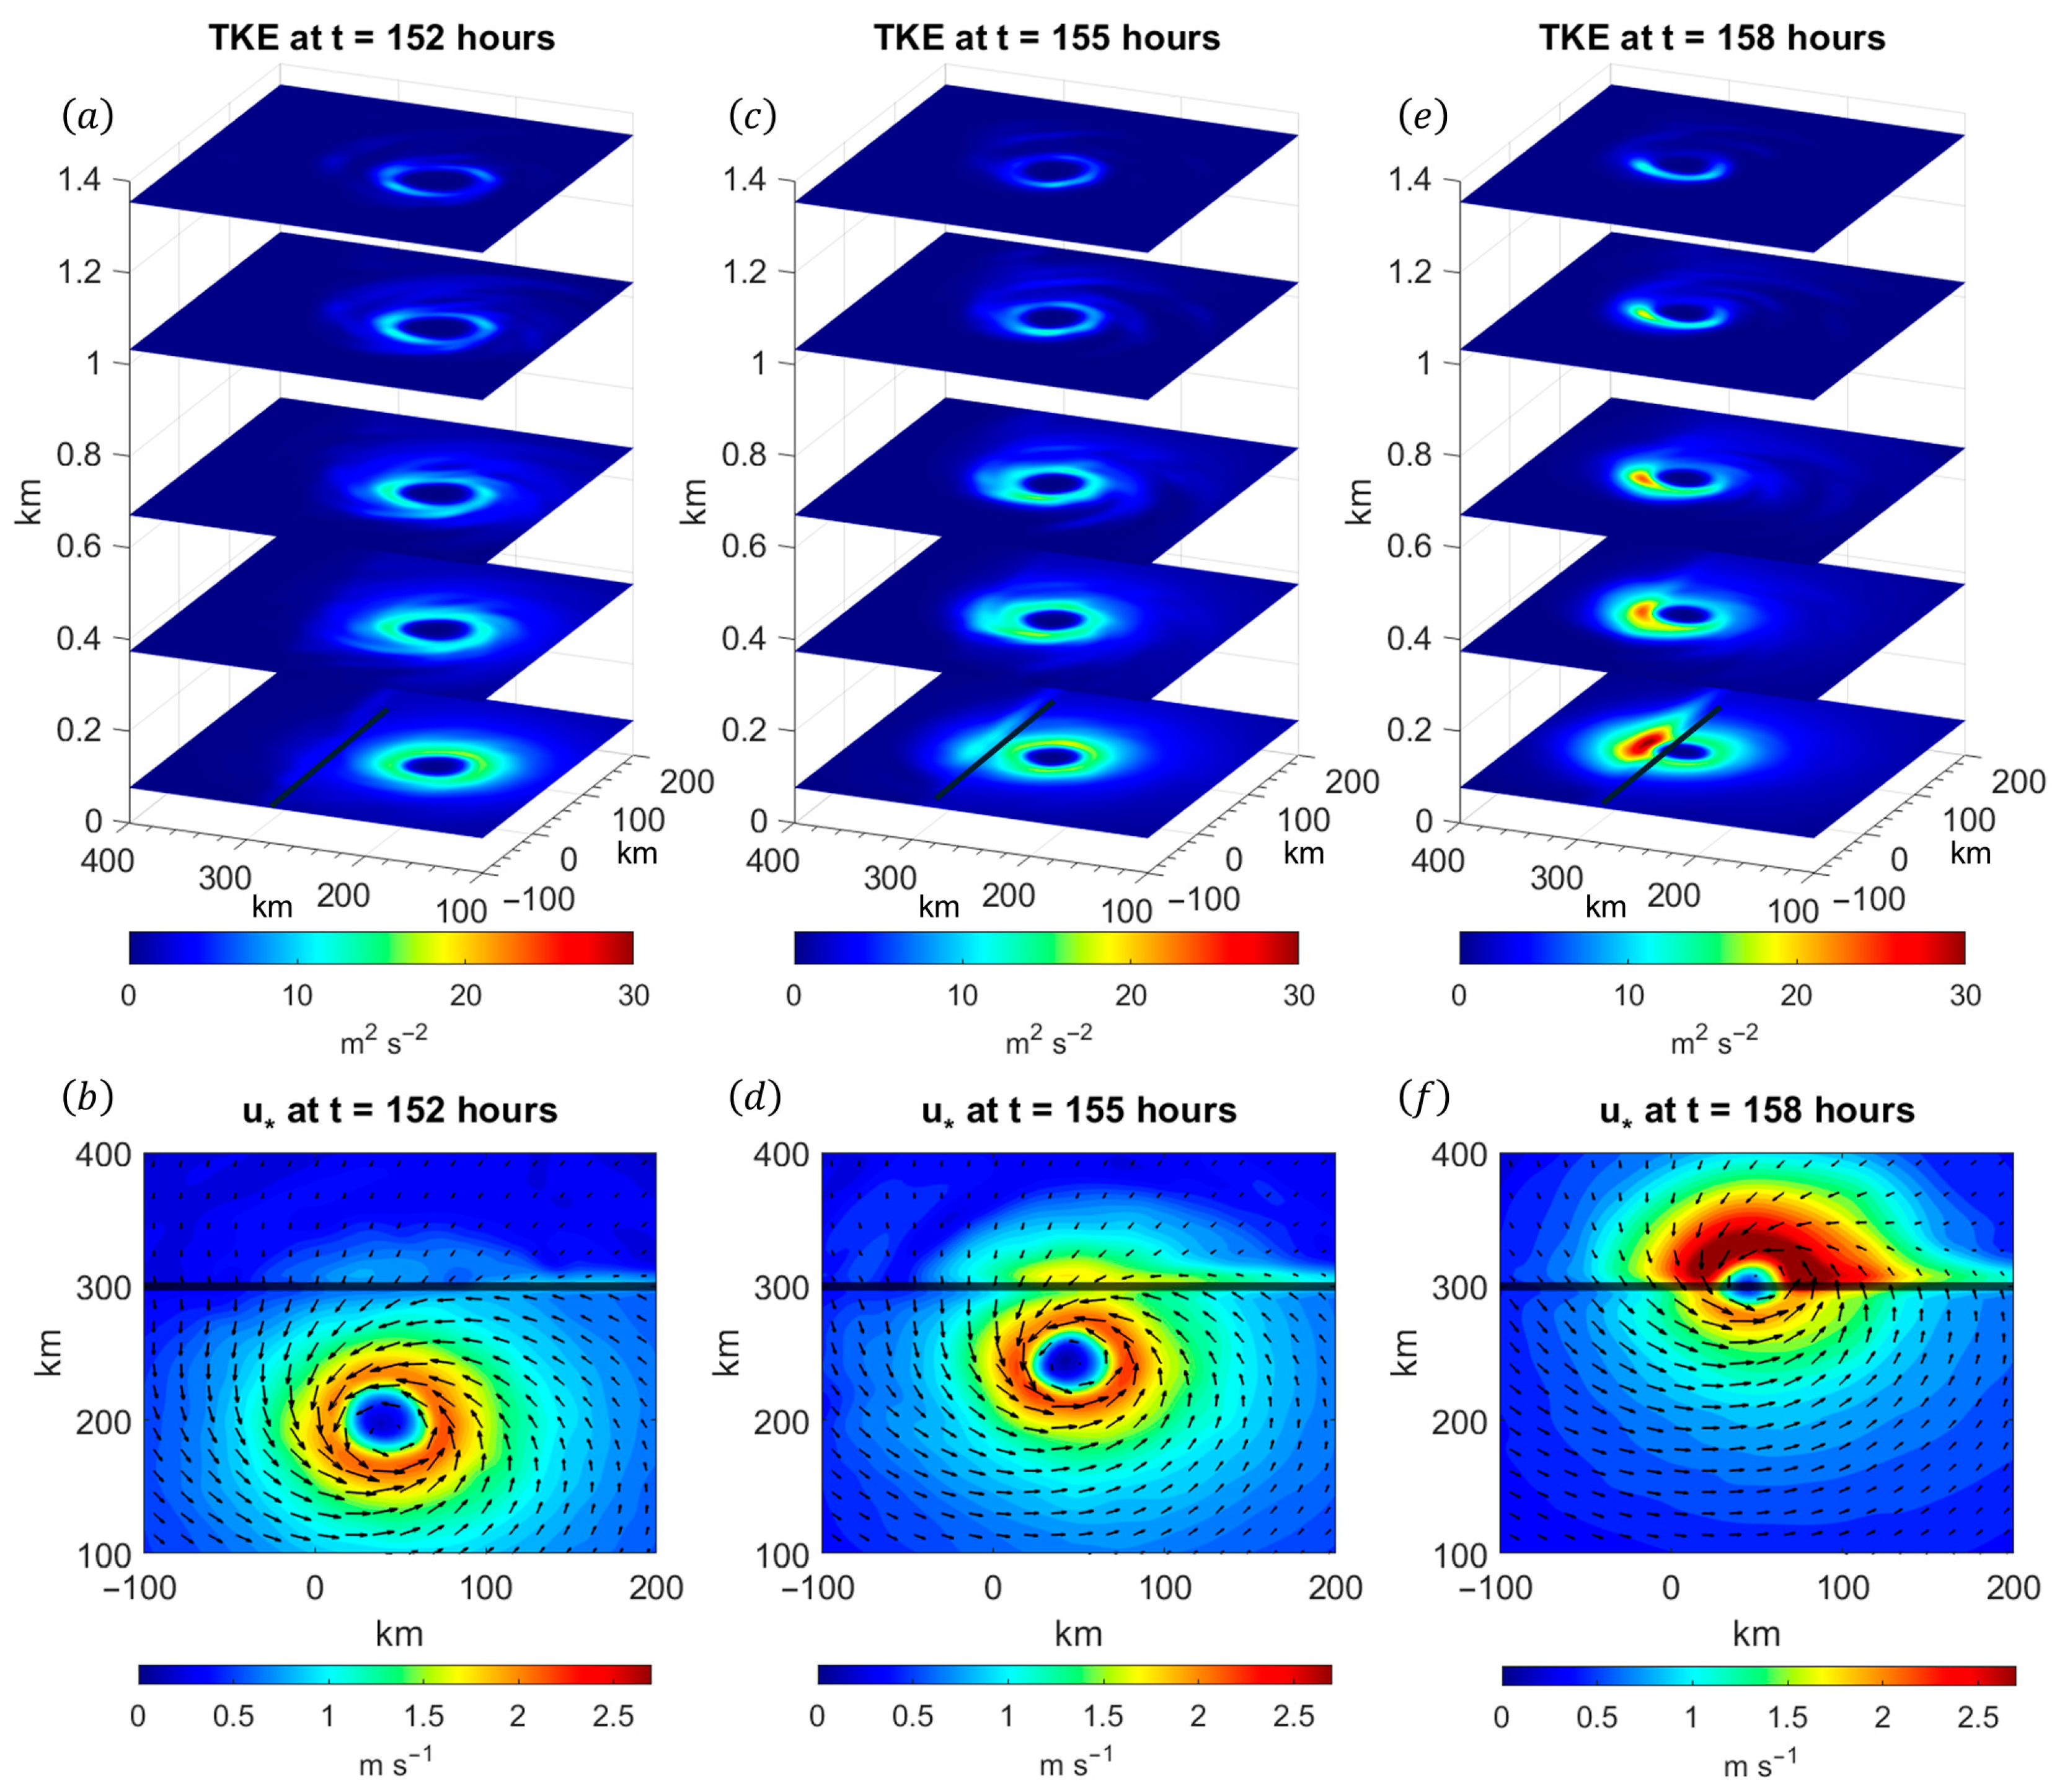
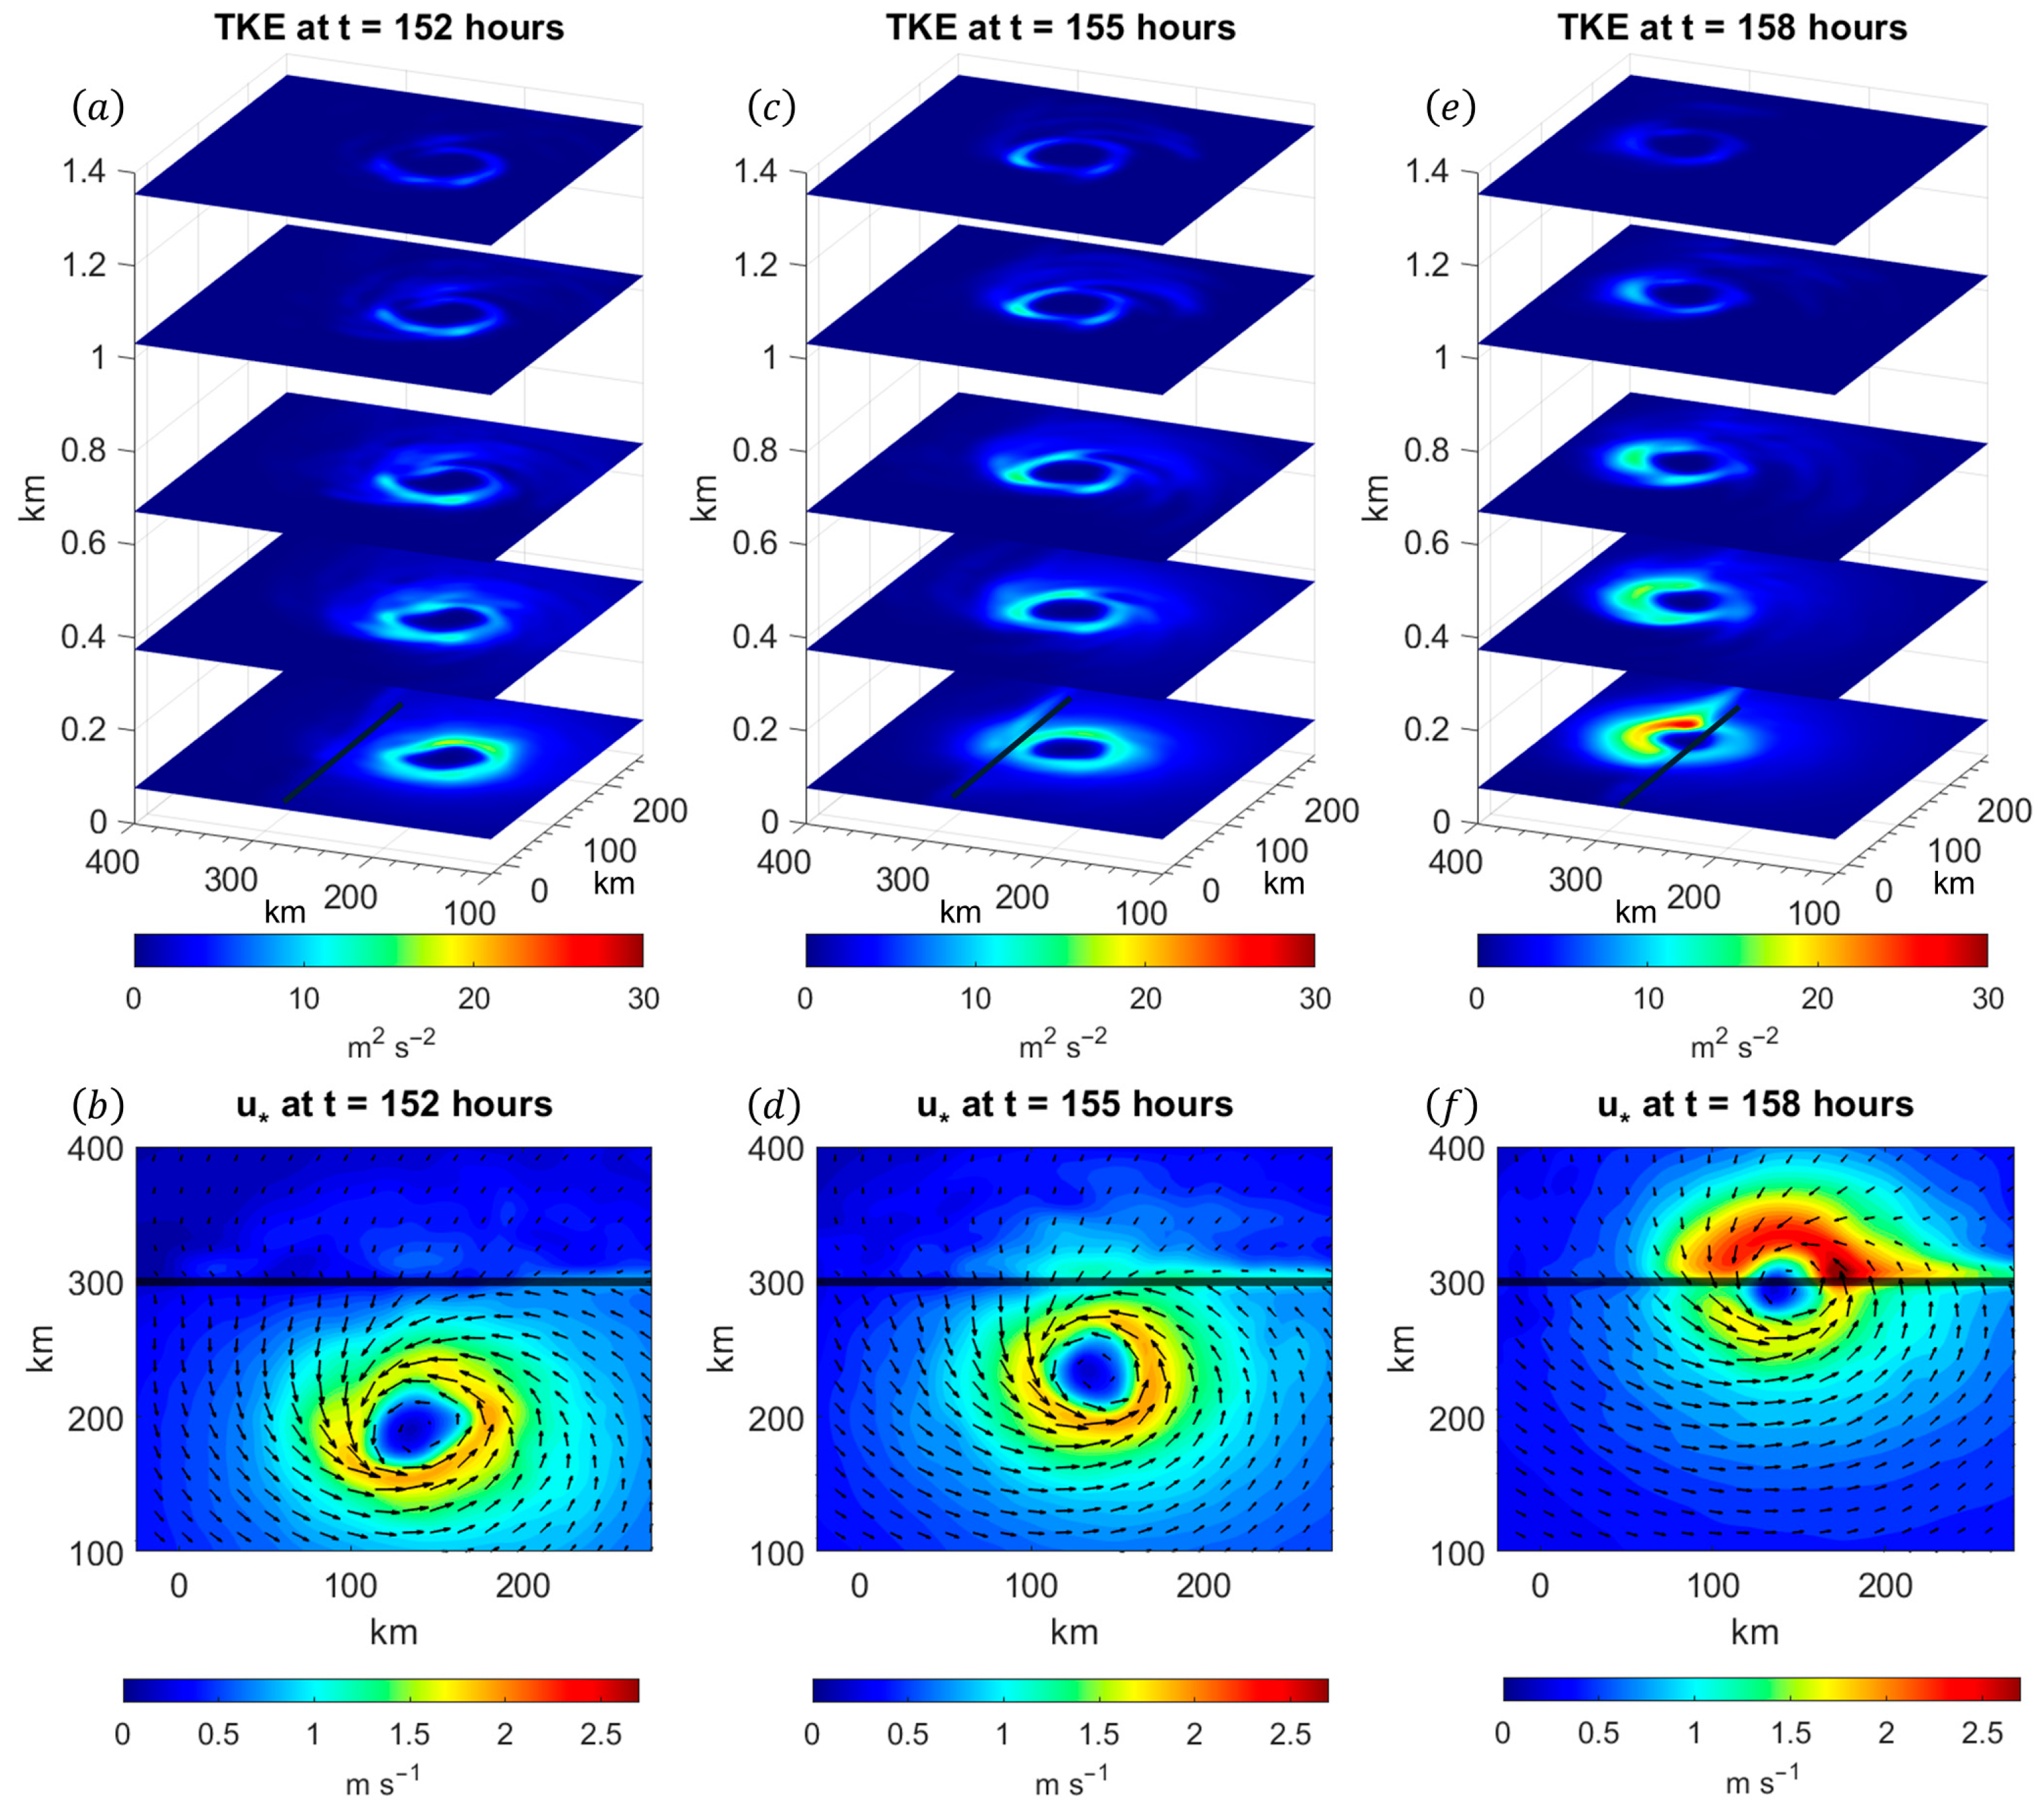
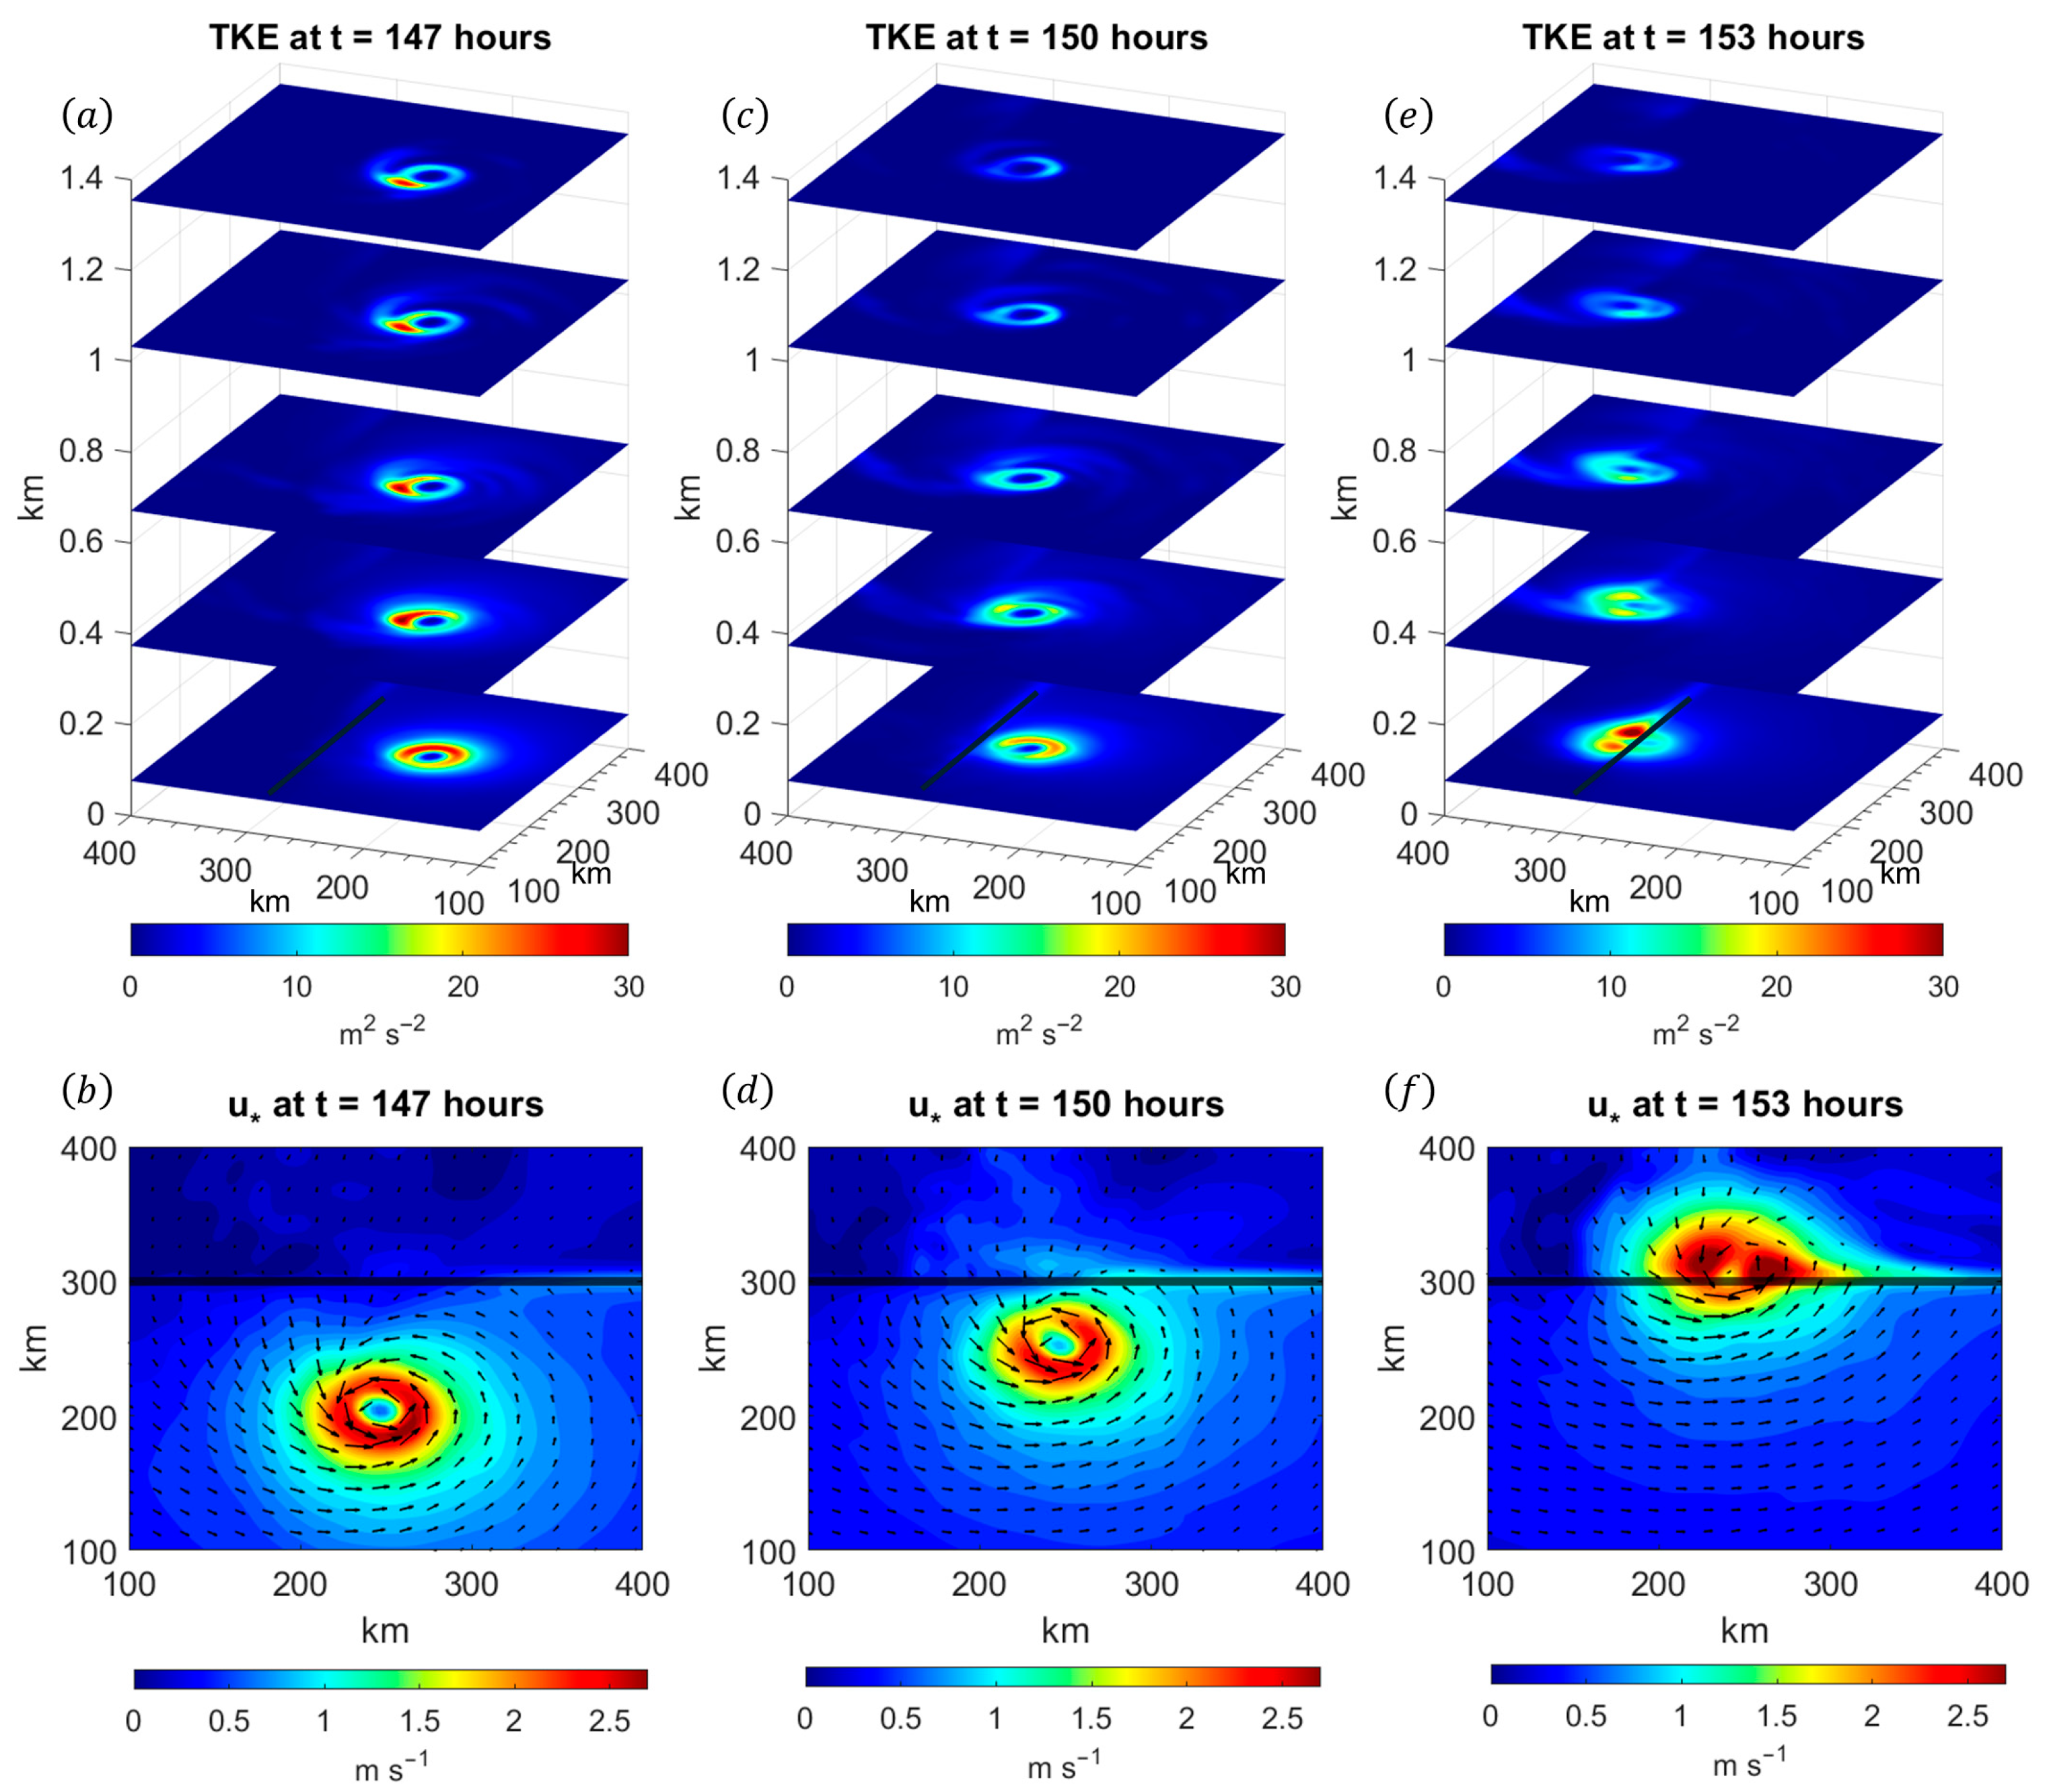
Since the thermal stability of the vortex governs the turbulence within the TCBL, it is expected that thermodynamic TCBL height should be linked to the presence of turbulent kinetic energy (TKE). Figure 7 examines the evolution of TKE and the friction velocity as the vortex approaches the coastline. First, it should be noted that the magnitude of TKE over the open ocean and during landfall are consistent with recent observational analyses of turbulent mixing of mature TCs during landfall [62,63]. As shown in Figure 7b, the friction velocity (which provides a measure of the surface drag associated with the TC) maximizes to the right of the vortex when it is 100 km from the coastline. The large surface drag produces enhanced vertical shear, which explains why the TKE has its largest magnitude near the surface as shown in Figure 7a–c. However, as the vortex moves towards the coastline, onshore flow leads to TKE growth over land (as shown in Figure 7c,e), which is a consequence of enhanced surface roughness associated with the coastline transition as shown in the enlarged friction velocity in Figure 7d,f. Thus, there is a gradual increase in turbulent mixing onshore, which is consistent with the deepening boundary layer onshore to the right of the vortex. In addition, there is an increase in TKE near the top of the TCBL to the left of the vortex, which matches the increase in azimuthal flow near the top of the TCBL (as shown in Figure 4f). The enhanced TKE to the left of the vortex is connected to the enhanced horizontal deformation and vertical shear to the left of the storm track immediately at landfall, which increases the mechanical production of turbulence.
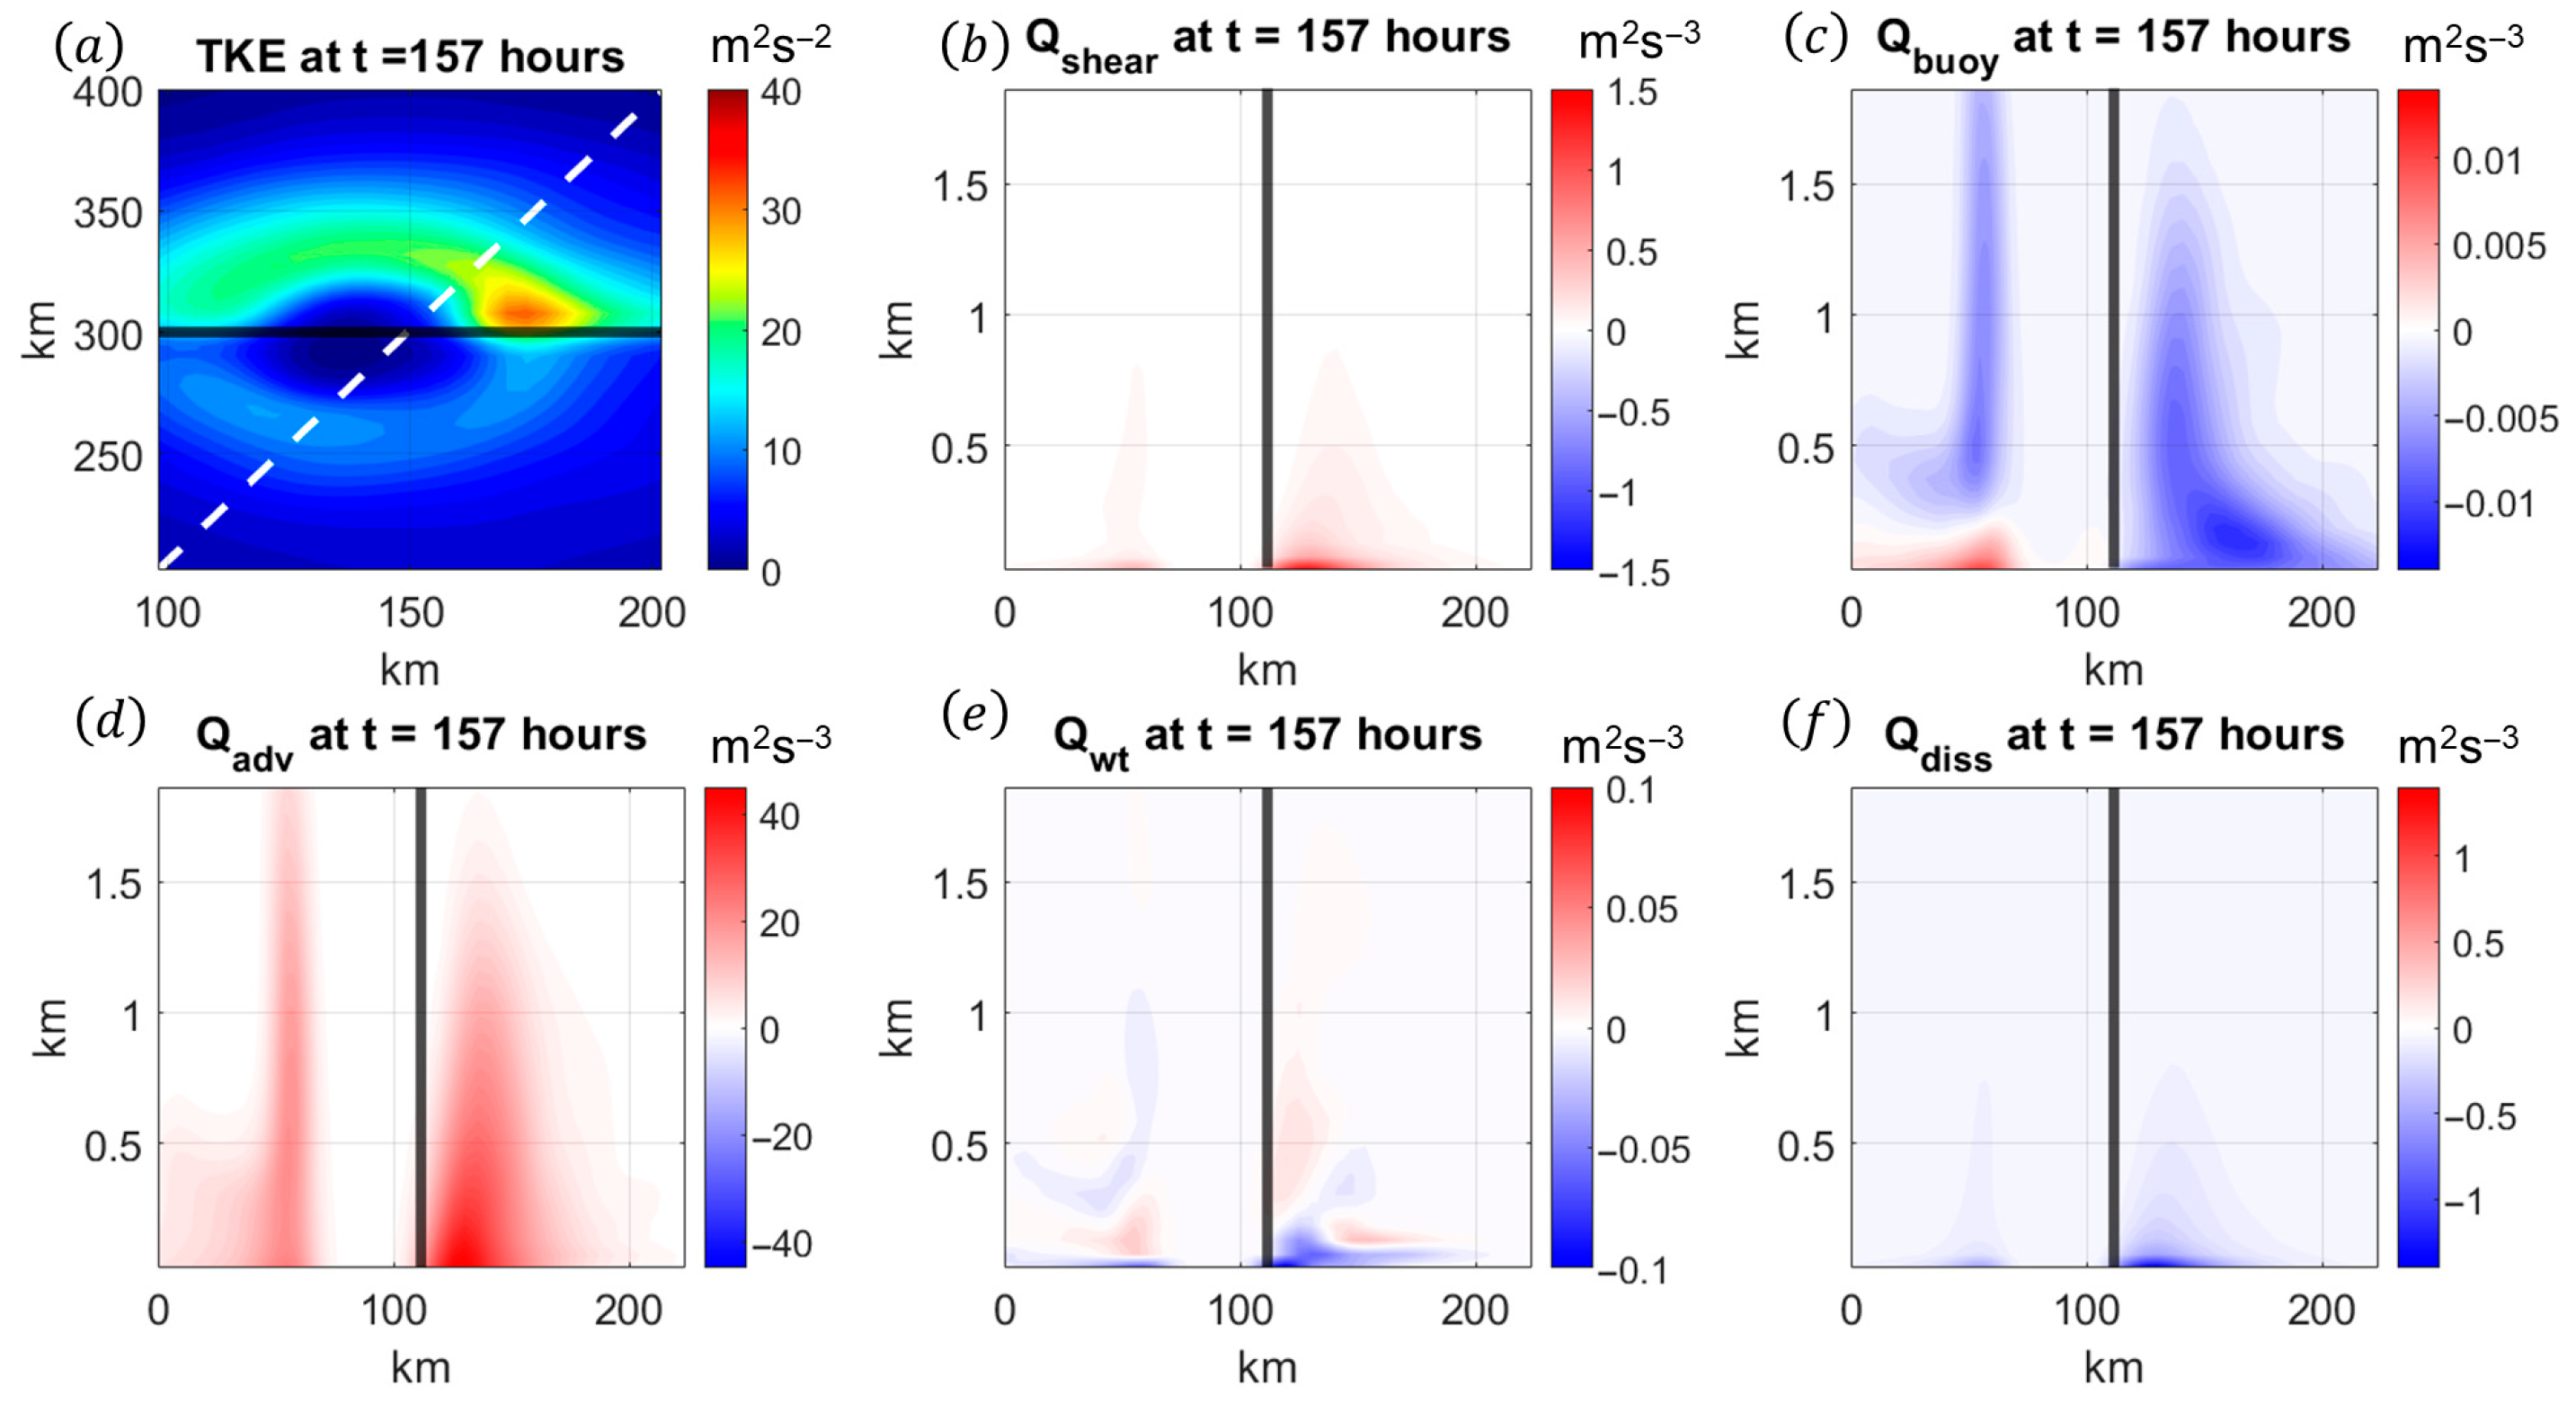
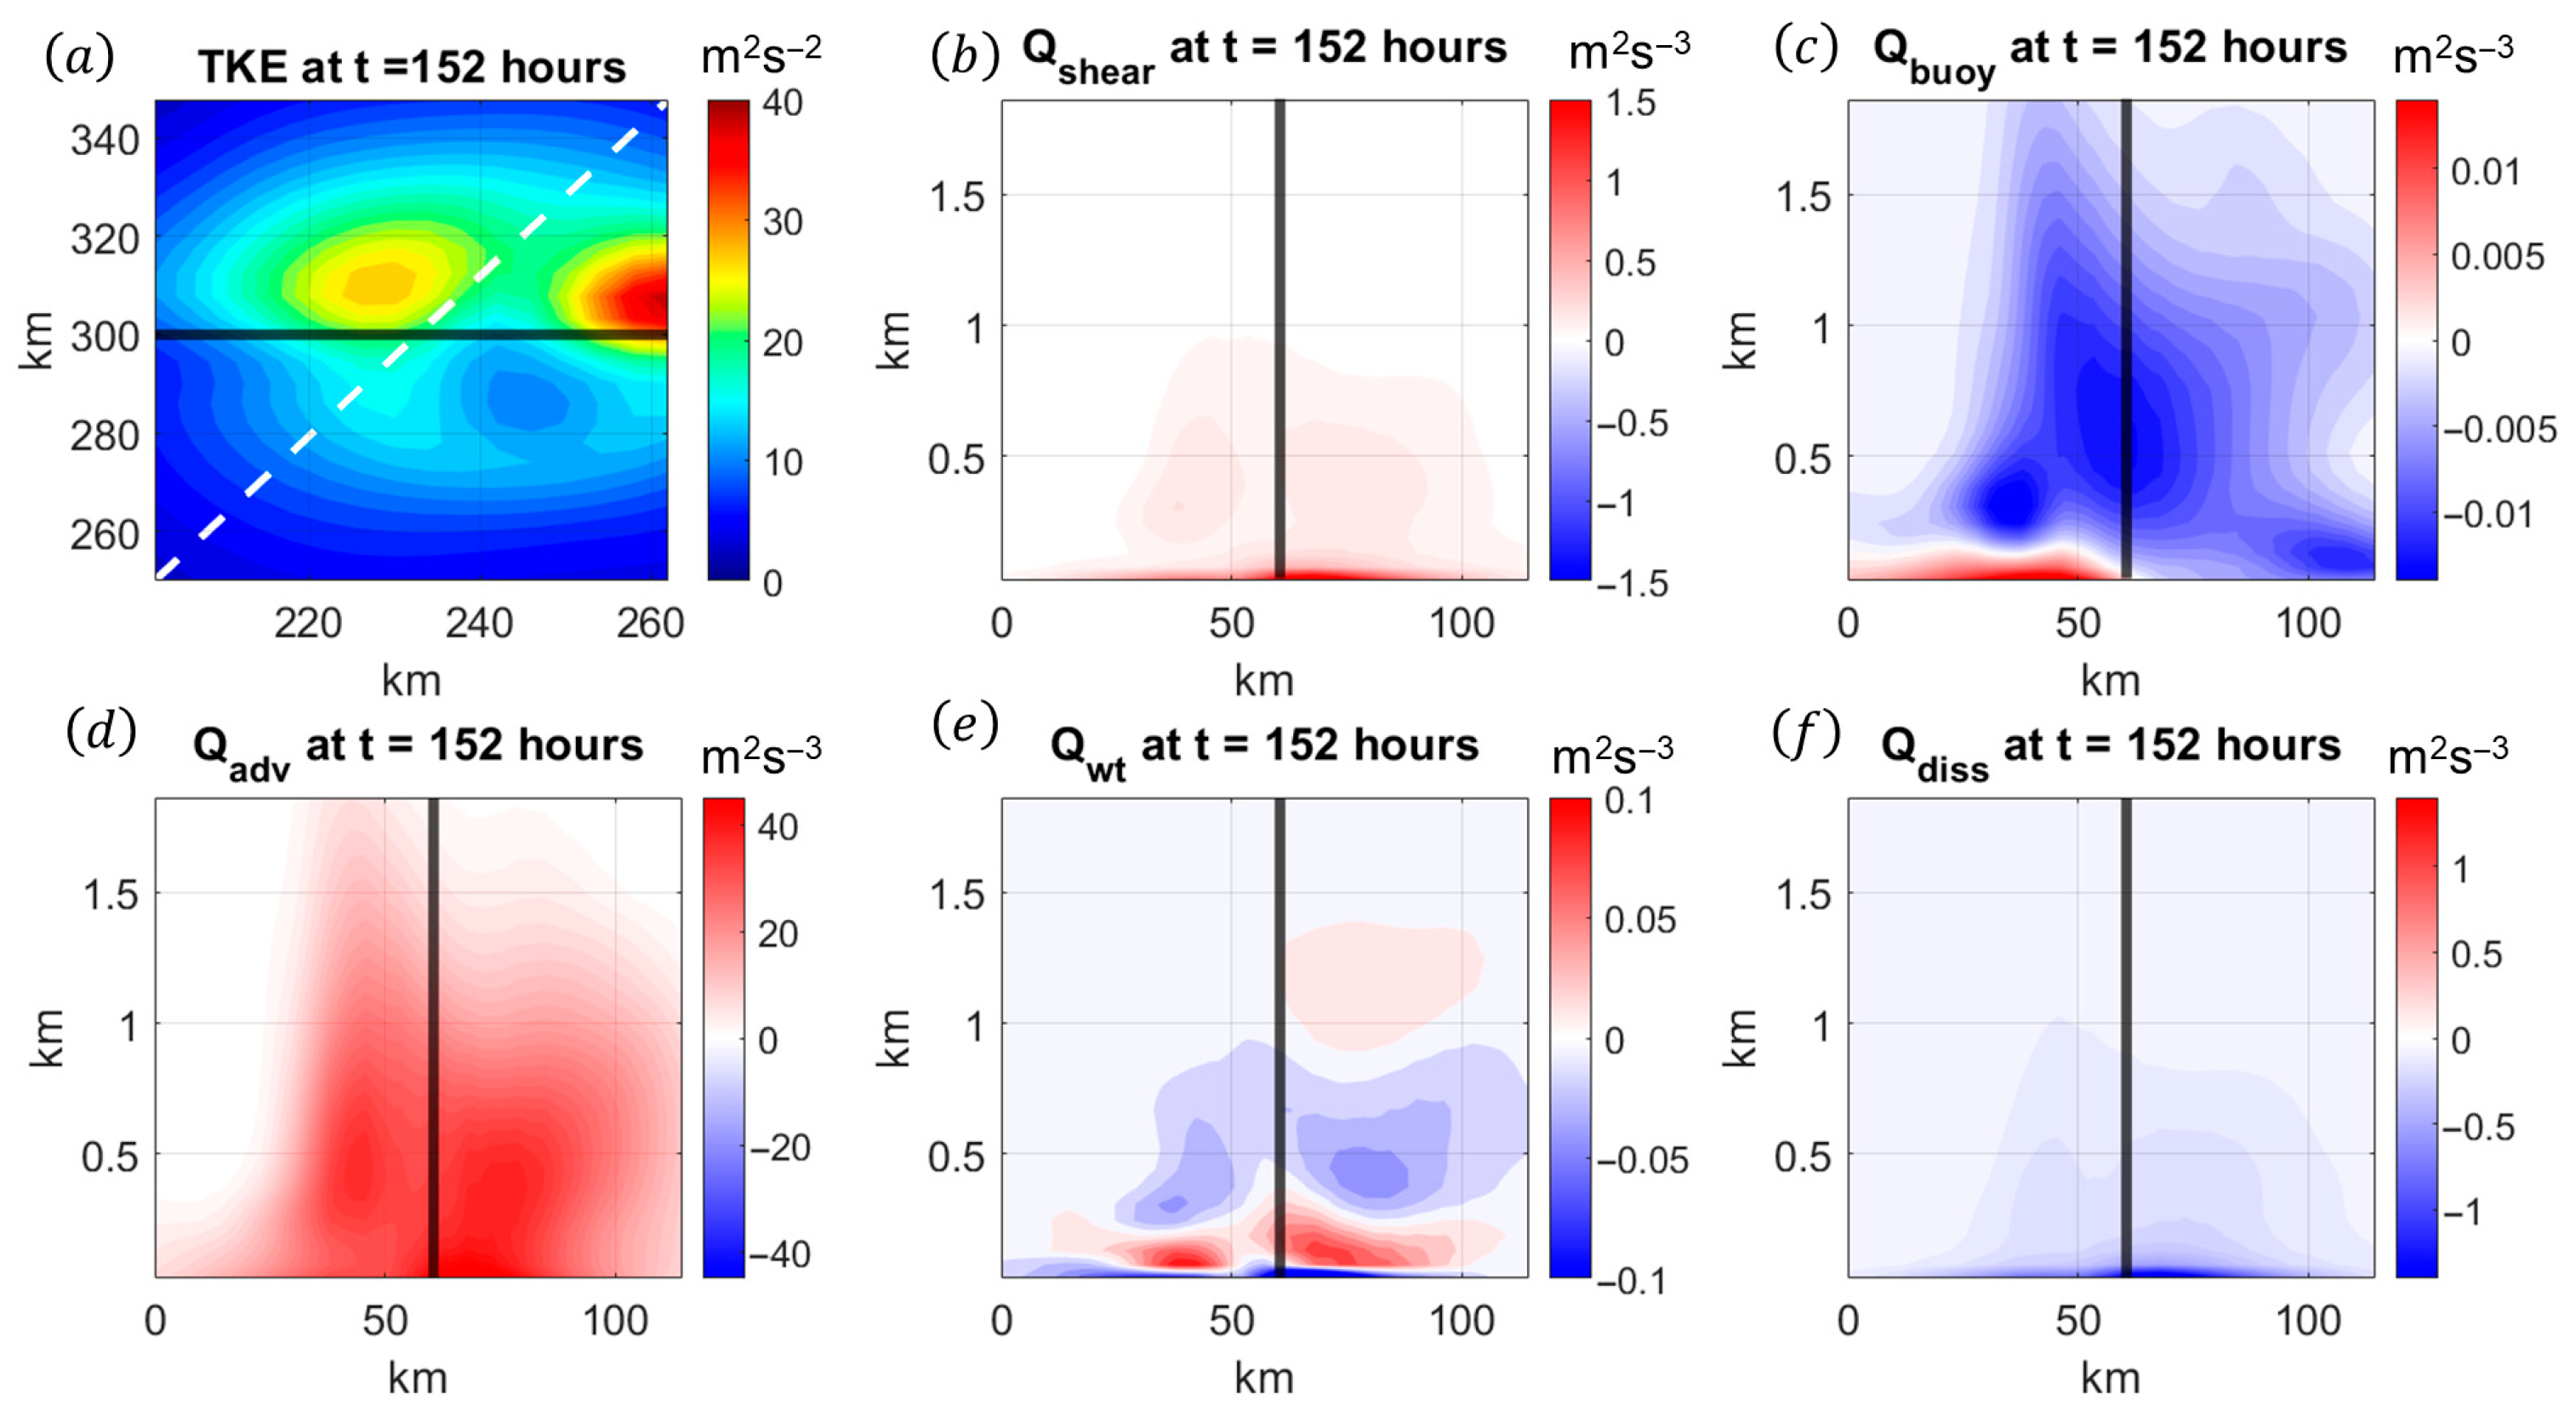
To understand the growth of TKE near the coastline, it is useful to examine the TKE budget. Figure 8 provides the TKE budget for a cross-section of the vortex which extends from the rear-right quadrant to the front-left quadrant. The shear production of turbulence is strongest near the surface (as shown in Figure 8b) due to presence of strong vertical shear near the surface, and it is primarily balanced by turbulent dissipation (as shown in Figure 8f). Since the magnitude of vertical shear is smaller over the ocean than over land, the shear production of turbulence is larger for the onshore portion of the vortex than for the offshore portion. However, there is a rapid increase in turbulent dissipation onshore due to the larger surface roughness, consistent with the increased friction velocity in Figure 7f. Dynamically, turbulent dissipation represents the conversion of turbulent kinetic energy into internal energy due to eddy viscosity. Therefore, the growth of turbulent dissipation onshore implies that there must be an increase in dissipative heating near the surface immediately onshore. This explains why the surface layer remains unstable as the vortex crosses the coastline, as shown in Figure 6e. As the vortex continues to traverse the continental surface, the surface winds decrease, which reduces the turbulent dissipation of the vortex. Previous numerical studies have suggested the efficiency of surface heat transfer during a landfall transition is a function of soil roughness [39,41]. However, the examination of the impact of surface roughness on the thermal stability of the surface layer is beyond the scope of this study.
As shown in Figure 8c, the buoyant production of turbulence is about two orders of magnitude smaller than the shear production of turbulence, which is consistent with previous studies that indicate the hurricane boundary layer is nearly neutral near the surface [4]. For the offshore portion of the vortex, there is buoyant production of turbulence near the surface, which corresponds to the enhanced surface heat fluxes within this region as shown in Figure 5g,h. However, in the offshore region, there is buoyant destruction of turbulence above the surface, which corresponds to the top of the thermodynamic TCBL height in which there is strong thermal stability. For the onshore portion of the vortex, there is buoyant destruction of turbulence, which is associated with the vertical temperature gradient near the surface (as discussed previously) and the development of evaporative cooling from cloud formation and precipitation (which will be discussed later).
The dominant term in the TKE budget corresponds to the advection of TKE by the resolved flow as shown in Figure 8d. For the offshore portion of the vortex, the TKE advection term is largely confined to the eyewall of the vortex, which corresponds to the transport of TKE vertically through the eyewall and azimuthally around the eyewall. Furthermore, vertical advection of TKE leads to enhanced TKE above the inflow layer, which helps to maintain the TCBL jet over land. For the onshore portion of the vortex, the positive contribution from the TKE advection term is spread over a large portion of this region especially below 500 m. As mentioned previously, there is a large increase in TKE onshore and a corresponding decrease in TKE offshore as the vortex moves towards the coastline. This suggests that the positive contribution from the TKE advection term is due to the transport of TKE from behind the vortex to the front of the vortex during landfall.
The azimuthal advection of TKE towards the front of the vortex partially explains why the growth of the IBL weakens the offshore TCBL jet as observed in observational studies [31]. Previous modeling studies indicate that the TCBL jet is produced by strong inward advection of angular momentum, and the inflow is maintained primarily by vertical advection (acting as a source) and vertical diffusion (acting as a sink) [9,10]. As the vortex begins the landfall transition, the TC largely maintains its storm intensity; however, there is an increase in TKE due to mechanical mixing (as shown in Figure 7e,f) and by azimuthal advection (as shown in Figure 8d). This leads to a vertical redistribution of angular momentum, which weakens the offshore TCBL jet. However, it should be noted as shown in Figure 4 that the TCBL jet does not immediately adjust to the new underlying surface. The TCBL jet remains within the inflow until the TCBL fully adjusts to land.
As shown in Figure 8e, the advection of TKE by the turbulent eddies are more than 2 orders of magnitude smaller than the advection of TKE by the resolved flow. In the offshore region of the vortex, positive turbulent transport resides below a region of negative turbulent transport, which corresponds to the upward transport of TKE from the mechanically generated surface turbulence. For the onshore region of the vortex, negative turbulent transport resides near the surface, indicating that TKE is transported away from the surface by turbulence. This likely corresponds to the redistribution of TKE from the region of strongest vertical shear to higher altitudes.
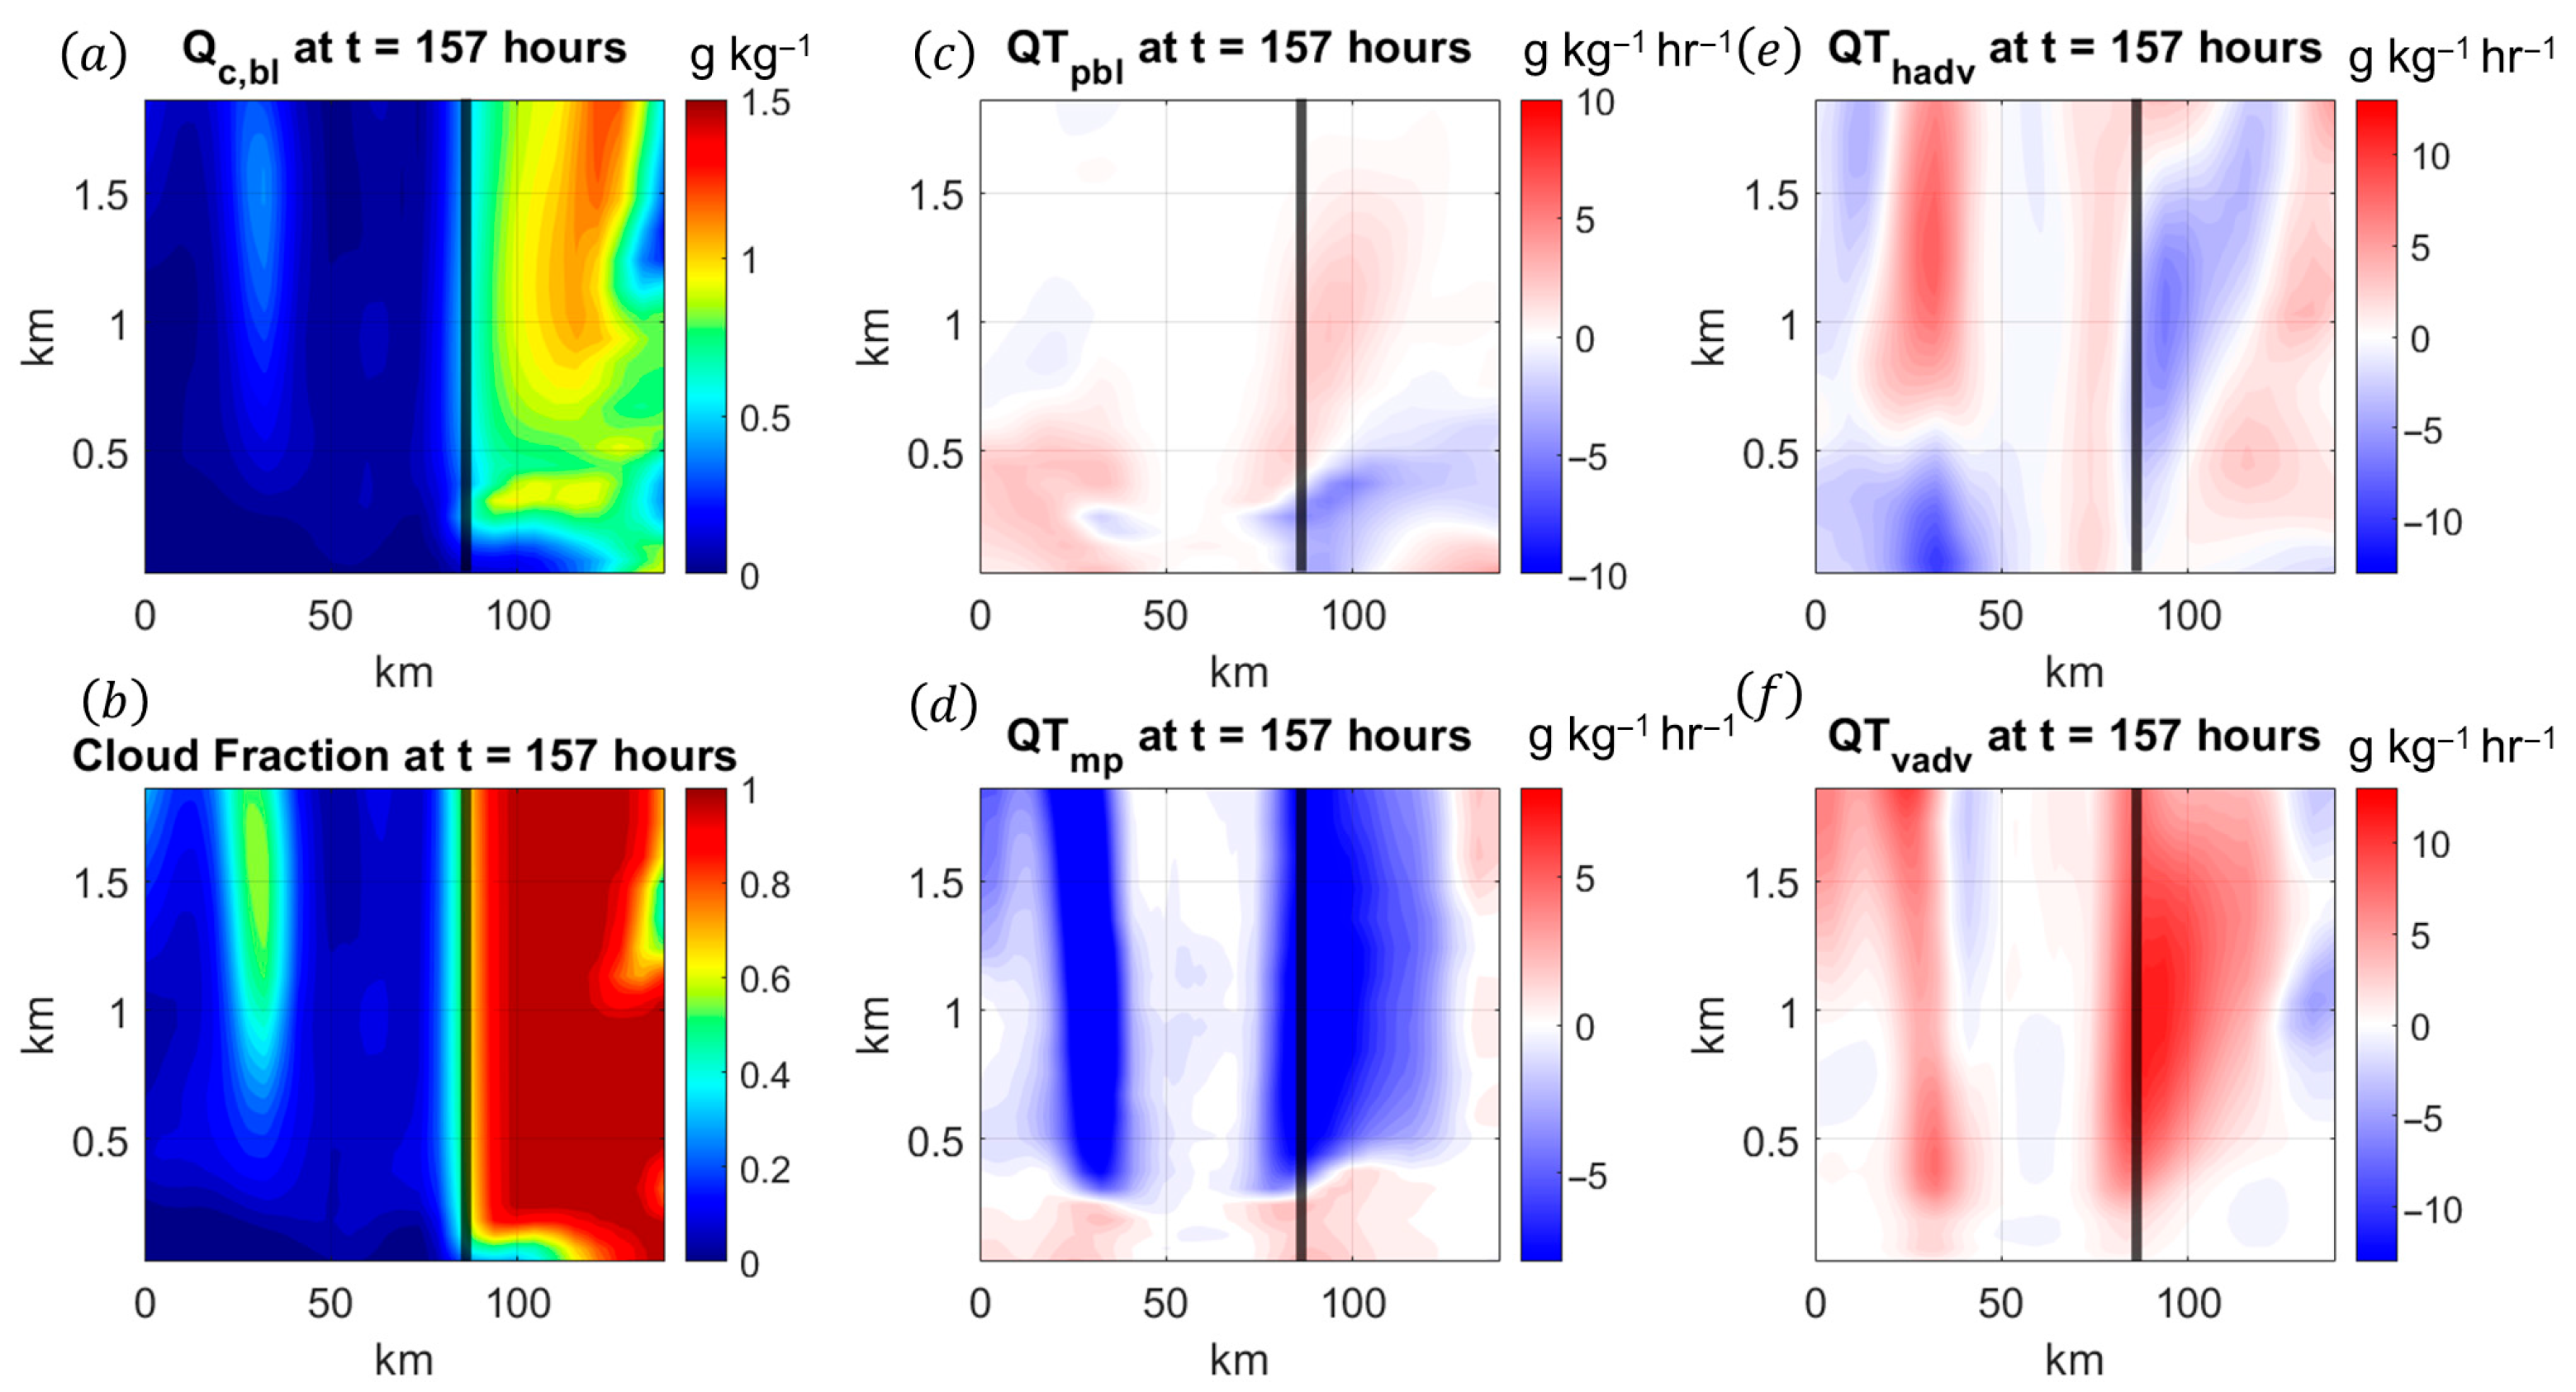
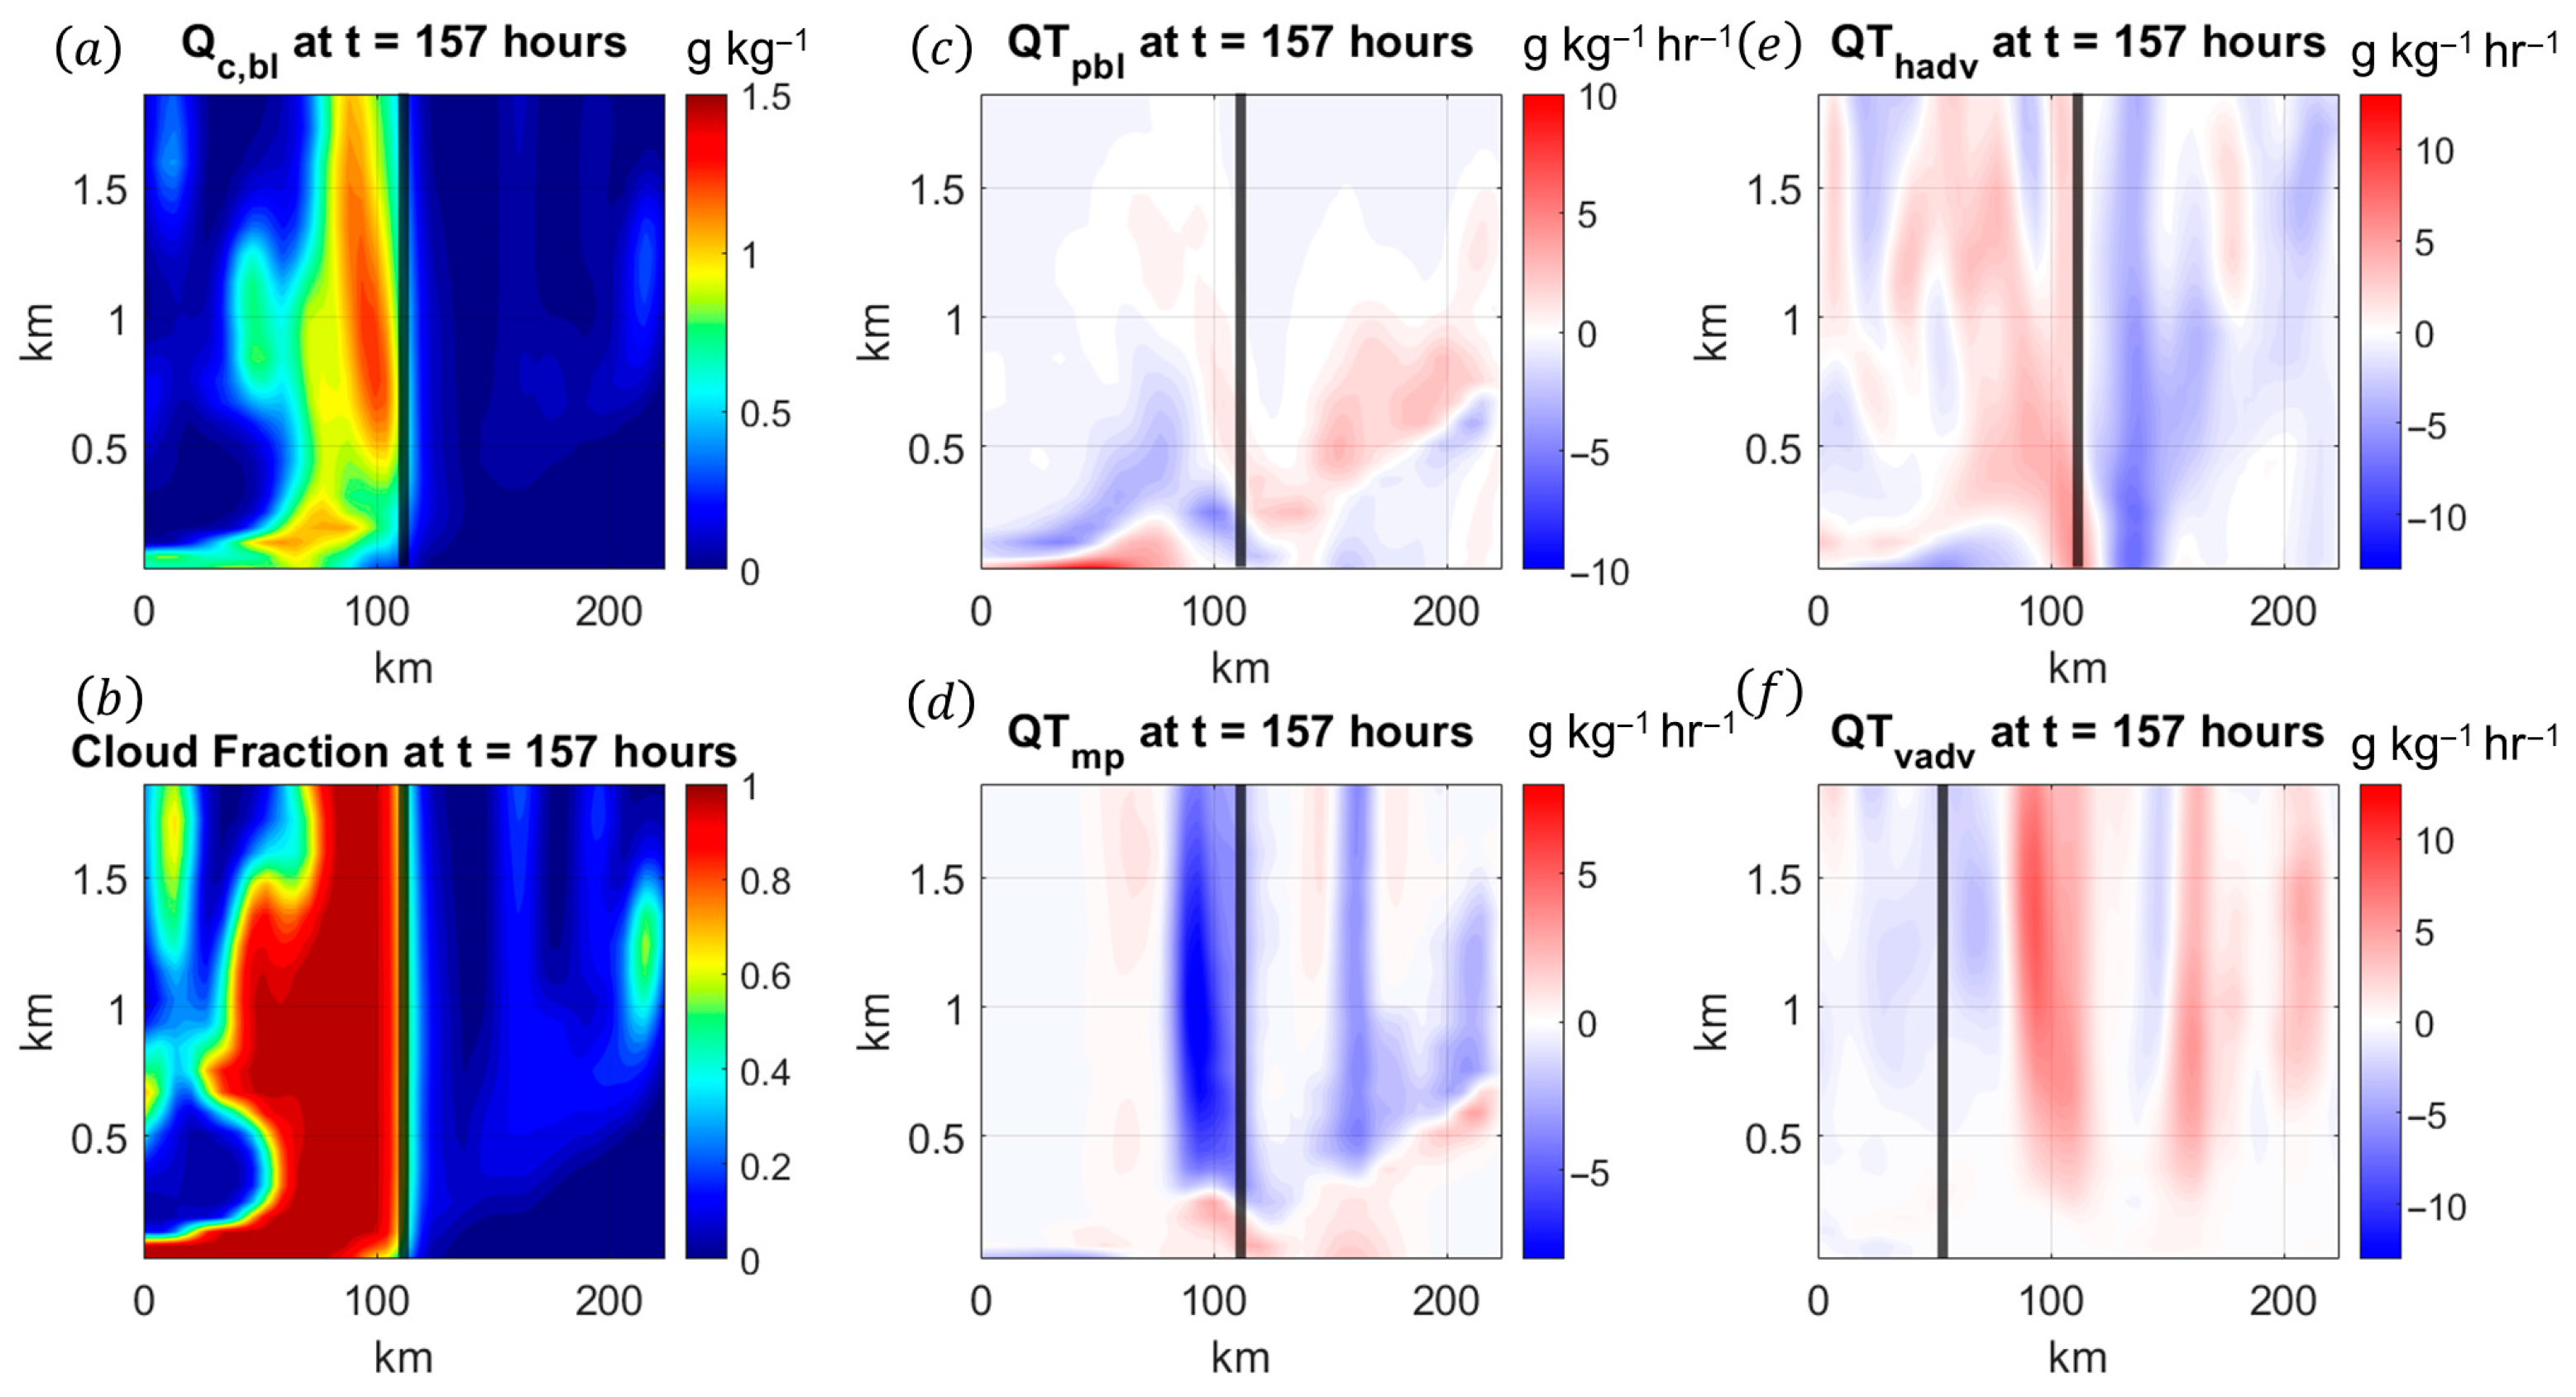
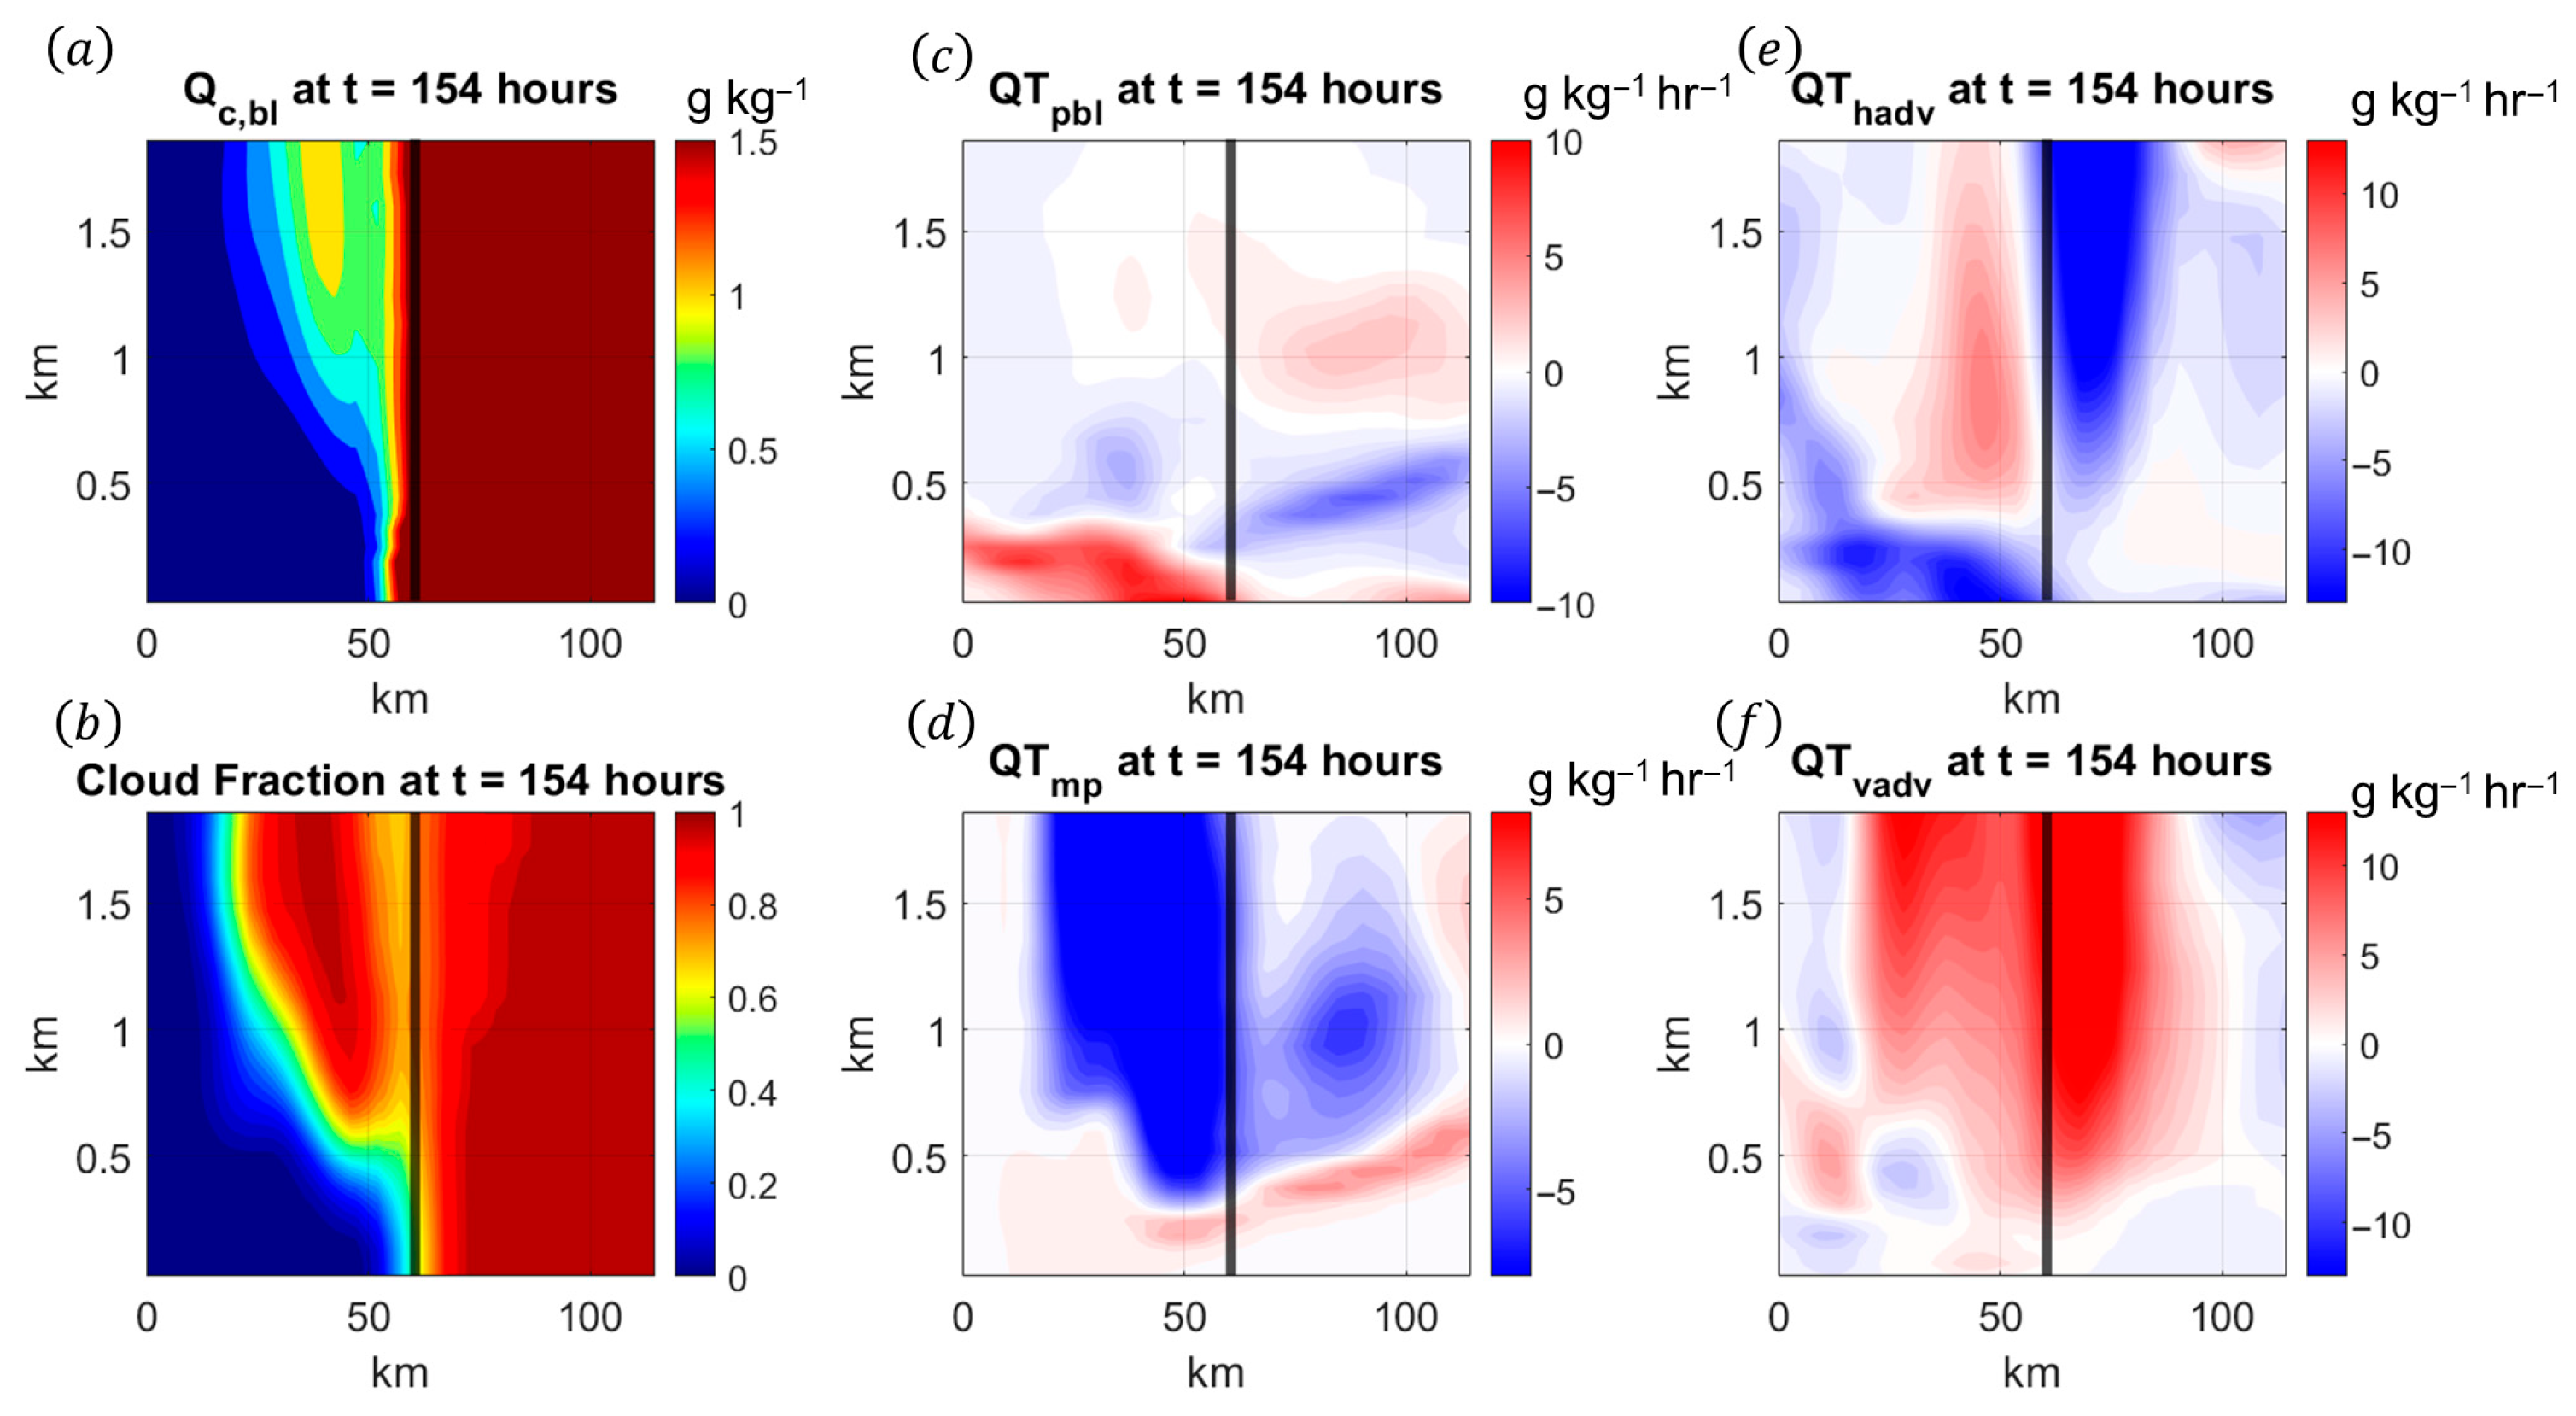
The transport of TKE by the resolved flow onshore in Figure 8 along with the accumulated precipitation shown in Figure 5 implies enhanced moistening of the continental air as the vortex moves towards the coastline. Figure 9 provides the moisture budget for the same cross-section defined in Figure 8. As shown in Figure 9a, the local maximum in cloud water within the TCBL occurs for the onshore portion of the vortex. Cloud formation begins for z 0.4   k m and increases with height. As the vortex moves towards the coast, the cloud water signature rotates from the left of the vortex towards the front of the vortex (as inferred from the accumulated precipitation rate shown in Figure 5f,i), and the cloud fraction significantly grows towards the onshore side of the vortex, as shown in Figure 9b.
Above the subcloud layer, the water vapor budget is dominated by advection by the resolved flow (as shown in Figure 9e,f) and cloud condensation (as shown in Figure 9d). Based upon the signs of the advection terms, the enhanced vertical motion in front of the vortex advects moisture upwards onshore, and the azimuthal wind advects moisture downstream. Thus, the high θ e air that was advected onshore (as discussed in Figure 6) saturates the continental air immediately onshore, leading to cloud formation. Immediately below the cloud base, the water vapor budget dominated by evaporation of cloud water (which corresponds to a source term in Figure 9d) and the turbulent transport of water vapor, as shown in Figure 9c. Further investigation indicates that as the vortex moves towards the coastline, the moisture-temperature covariance q v θ ¯ is largely negative through the eyewall and the rainbands, indicating the presence of evaporative cooling and entrainment near the cloud base. Thus, the evaporation of cloud droplets leads to local production of cloud water below the cloud base for the onshore portion of the vortex, and turbulent mixing processes transport away from the cloud base. This is consistent with the structure of the TKE field in Figure 7e, which demonstrates that TKE maximizes on the onshore-left portion of the vortex.
Near the surface, the water vapor budget is dominated by the rain evaporation (which corresponds to a source term in Figure 9d) and the turbulent transport of water vapor, as shown in Figure 9c. The local maximum in rain evaporation onshore leads to evaporative cooling near the surface. For the offshore portion of the vortex, rain evaporation and turbulent transport work in concert as a local source for cloud water near the surface, which is consistent with the enhanced latent heat fluxes as shown in Figure 5h. For the onshore portion, there is a local maximum in rain evaporation due to the enhanced rainfall to the left of the vortex as shown in Figure 5i, whereas the negative contribution from the turbulent water vapor transport arises due to the negative latent heat flux shown in Figure 5i. Above the surface, the water vapor budget is dominated by cloud condensation behind the vortex (which corresponds to a sink term in Figure 9d), which is balanced by vertical and horizontal advective processes. By comparing Figure 6e with Figure 9d, we note that the reduction in thermal stability behind the vortex helps to sustain convection immediately after landfall.
In the following section, we will examine how changes in environmental temperature and moisture associated with the continental air affect the evolution of the TCBL.

4. The Impact of Continental Air on the TCBL

In this section, we will examine how changes in the temperature and moisture of the continental air affect the thermodynamic evolution of the TCBL during landfall. As mentioned in Section 2, two additional landfall experiments were conducted which consist of two different vertical temperature and moisture profiles.

4.1. Warm, Dry Continental Air (EXP-WD)

As mentioned in Section 2, EXP-WD corresponds to a warm, dry land surface in which the initial LST is 299 K, and the relative humidity is 20% lower than the relative humidity over the open ocean (see Figure 3). This experiment allows us to examine how the moisture of the continental environment influences the evolution of the TCBL.
Figure 10 shows the evolution of the storm-relative radial flow and azimuthal flow when the vortex is within 100 km of the coastline. By comparing Figure 10 with Figure 4, we see that there are important differences in the evolution of the TCBL winds during landfall. Whereas the vortex associated with EXP-WM possesses enhanced storm-relative radial inflow in the front-left quadrant when its center is 100 km from the coastline (as shown in Figure 4a), note that there is enhanced storm-relative inflow to the rear of the vortex associated with EXP-WD when its center is 100 km from the coastline, as shown in Figure 10a. As the vortex associated with EXP-WD approaches the coastline, radial inflow shifts towards the front-left quadrant (as shown in Figure 10b). However, the radial outflow ahead of the vortex associated with EXP-WD (as shown in Figure 10c) is generally weaker than the radial outflow associated with EXP-WM (as shown in Figure 4c). with regard to the differences in the azimuthal flow between EXP-WM and EXP-WD, it should be noted that whereas the azimuthal winds largely maintained their strength when approach the coastline for EXP-WM (as shown in Figure 4d–f), there is a noticeable decay in the azimuthal winds as the vortex associated with EXP-WD approaches the coastline (as shown in Figure 10d–f). This is seen most clearly by noting the sharp differences in offshore winds compared to onshore winds in which there is a clear azimuthal wind maximum to the rear of the vortex (as shown in Figure 10f). Since the surface roughness of the coastline is the same between EXP-WM and EXP-WD, the changes in the TCBL winds must be due to the changes in the continental environment between these two experiments.
The changes in the TCBL winds are also reflected in the surface thermal fields, as shown in Figure 11. Similarly to EXP-WM, the largest sensible and latent heat fluxes occur within the eyewall of the vortex, and the continental region is characterized by negative heat fluxes. However, in contrast to EXP-WM, the largest heat fluxes and precipitation rate occurs within the rear-right quadrant when the vortex is 100 km from the coastline, as shown in Figure 11a–c. These differences are connected to changes in the storm-relative inflow which is enhanced behind the vortex. As the vortex approaches the coastline, the heat fluxes increase in the front-left quadrant of the vortex despite the dry continental air (as shown in Figure 11d,e). This can be understood by noting that lower continental relative humidity generally increases the moisture difference at the land surface. Thus, there will be a temporary increase in latent heat flux near the coastline due to larger vertical moisture gradient. However, the precipitation rate maintains its maximum behind the vortex. This can be understood by noting that the decrease in relative humidity associated with EXP-WD means that offshore flow has lower θ e than in EXP-WM. This dry air intrusion acts to stabilize the left portion of the vortex. In addition, lower continental moisture associated with EXP-WD promotes further rain evaporation onshore as precipitation falls through the dry subcloud layer. This leads to greater evaporative cooling, which stabilizes the onshore boundary layer and suppresses onshore convection. In contrast, larger continental moisture associated with EXP-WM results in less evaporative cooling which causes the onshore boundary layer to remain buoyant. For this reason, precipitation can extend farther inland as shown in Figure 5.
Just as in EXP-WM, low-level convergence towards the rear of the vortex, leading to the asymmetric heat fluxes shown in Figure 11g,h. Although a precipitation rate maximum remains at the rear of the vortex (as shown in Figure 11i), low-level azimuthal flow advects rainfall downstream such that some precipitation is present on the onshore side of the vortex. However, by comparing Figure 5i with Figure 11i, it should be noted that the precipitation rate for EXP-WD is much less than EXP-WM, consistent with previous studies [48].
Since the presence of dry air within the continental environment has produced changes in surface heat fluxes, precipitation rate, and the TCBL kinematic fields, it is expected that this dry air intrusion will impact the thermal stability of the TCBL. The evolution of equivalent potential temperature θ e and virtual potential temperature gradient d θ v / d z as the vortex associated with EXP-WD approaches the coastline is shown in Figure 12. By comparing Figure 12b with Figure 6b, the drier continental environment associated with EXP-WD produces lower θ e onshore compared with EXP-WM, as expected. As the vortex associated with EXP-WD approaches the coast, horizontal and vertical advection of θ e from offshore flow reduces θ e outside of the inner core of the vortex. Consequently, a larger gradient of θ e exists across the vortex compared with EXP-WM with lower θ e to the left of the vortex, as shown in Figure 12d. By comparing Figure 12a with Figure 6a, we note that there is greater instability to the right of the vortex associated with EXP-WD, which is primarily connected to the stronger convergence within this region. As shown in Figure 12c,e, the vortex approaches the coastline, the minimum in thermal stability rotates towards the rear-right quadrant of the vortex similar to the vortex associated with EXP-WM.
By comparing Figure 12e with Figure 6e, it should be noted that there is larger thermal stability in the onshore boundary layer for EXP-WD than for EXP-WM. This is consistent with the enhanced evaporative cooling onshore from precipitation stabilizes the boundary layer. Therefore, it is expected that there will be less turbulent mixing onshore associated with EXP-WD, which can be seen by examining TKE and frictional velocity as shown in Figure 13. First, it should be noted that the offshore frictional velocity for the vortex associated with EXP-WD is consistently lower than EXP-WM. This can be explained by recalling that since the surface drag is a function of wind speed, then the surface stress will be weaker for EXP-WD compared to EXP-WM. In addition, the surface drag coefficient C D (which is a function of environmental stability) decreases as evaporative cooling and dry air work in concert to stabilize the onshore boundary layer. The reduction in wind speed and surface drag coefficient leads to lower surface stress and lower friction velocity. In particular the onshore friction velocity is approximately 20% smaller for EXP-WD than for EXP-WM. Because of this, the surface turbulence must be weaker for EXP-WD as the vortex approaches the coastline. Likewise, by comparing Figure 13 with Figure 7, we note that the TKE is consistently smaller above the surface layer, which suggests that turbulent transport processes will be weaker for EXP-WD than for EXP-WM.
The differences in TKE between EXP-WD and EXP-WM can also be seen in the TKE budget, as shown in Figure 14. Similarly to EXP-WM, the shear production of turbulence is strongest near the surface due to presence of strong vertical shear near the surface (as shown in Figure 14b), and it is primarily balanced by turbulent dissipation (as shown in Figure 14f). However, by comparing Figure 14 with Figure 8, the magnitude of the shear production is smaller for EXP-WD than for EXP-WM. This can be explained by noting that the combination of weaker latent heat flux and the dry continental air stabilizes the onshore boundary layer, which suppresses turbulence within this region. The reduced turbulence leads to reduced vertical momentum transport and reduced shear production of turbulence. The reduction in vertical shear in the onshore boundary layer also implies the turbulent dissipation and the dissipative heating are both smaller for EXP-WD than for EXP-WM. This explains why the surface layer is more stable as the vortex for EXP-WD crosses the coastline. As the vortex continues to move across the continental surface, the decay rate of the vortex associated with EXP-WD is larger than EXP-WM. Similarly to EXP-WM, there is buoyant production of turbulence near the surface and buoyant destruction of turbulence above the surface within the offshore portion of the vortex associated with EXP-WD. However, since the accumulated precipitation rate is weaker for EXP-WD, there is less evaporative cooling associated with EXP-WD, which implies that the buoyant production term is smaller for EXP-WD as shown in Figure 14c. Furthermore, since the azimuthal flow is weaker for EXP-WD, the azimuthal advection of TKE is weaker for EXP-WD.
The most substantial difference between EXP-WD and EXP-WM is found in the moisture fields and moisture budget, which is given in Figure 15. In contrast to EXP-WM where most of the cloud water is found onshore (as shown in Figure 9a,b) during the landfall transition, most of the cloud water is found offshore, as shown in Figure 15a,b. The dominant cause of this can be found in the moisture budget. In contrast to EXP-WM, horizontal and vertical advection of dry air work in concert to reduce the cloud water immediately onshore, as shown in Figure 15e,f. Consequently, the advection of dry air immediately onshore pushes cloud condensational processes largely offshore, as shown in Figure 15d. In addition, the sharp vertical gradient in the microphysical budget term implies that there is evaporative cooling near the surface, which serves to stabilize the near surface air immediately onshore.

4.2. Cool, Moist Continental Air (EXP-CM)

As mentioned in Section 2, EXP-CM corresponds to a cool, moist land surface in which the initial LST is 292 K, and the relative humidity over land is the same as the relative humidity over the open ocean. As shown in Figure 3, the vertical temperature and moisture profile for EXP-CM differs from the open ocean. However, this experiment allows us to examine how the temperature of the continental environment influences the evolution of the TCBL.
Figure 16 shows the evolution of the storm-relative radial flow and azimuthal flow when the vortex is 100 km of the coastline. By comparing Figure 16 with Figure 4, we see that there are important differences in the evolution of the TCBL winds during landfall. Whereas the vortex associated with EXP-WM possesses enhanced storm-relative radial inflow in the front-left quadrant when its center is 100 km from the coastline (as shown in Figure 4a), note that there is enhanced storm-relative inflow towards the entire left section of the vortex associated with EXP-CM when its center is 100 km from the coastline, as shown in Figure 16a. Furthermore, there is significant storm-relative radial outflow towards the front-right quadrant for the vortex associated with EXP-CM in comparison to EXP-WM and EXP-WD. Consequently, there is a very well-defined wavenumber-1 asymmetry in the radial velocity field for EXP-CM. The enhanced radial inflow leads to stronger convergence around the eyewall of the vortex associated with EXP-CM. As the vortex associated with EXP-CM approaches the coastline, radial inflow remains situated to the left of the vortex, as shown in Figure 16b,c.
With regard to the differences in the azimuthal flow between EXP-WM and EXP-CM, it should be noted that the vortex associated with EXP-CM exhibit a more defined maximum in azimuthal flow within the front-right quadrant. Furthermore, there is a noticeable decay in the azimuthal winds as the vortex associated with EXP-CM approaches the coastline (as shown in Figure 16d–f). As discussed in Section 4.1, dry air intrusion can diminish the overall intensity of the vortex. However, the temperature difference between the marine and continental environment has produced a more pronounced difference between offshore and onshore flow in comparison to EXP-WD. As the vortex associated with EXP-CM approaches the coastline, the location of the azimuthal wind maximum shifts from the front-right to the rear, as shown in Figure 16e,f.
The sharp changes in the TCBL kinematic fields are reflected in the surface thermal fields as shown in Figure 17. Because of the enhanced surface inflow and convergence of the vortex associated with EXP-CM in comparison to the vortex associated with EXP-WM, the surface fluxes in the open ocean are stronger than for the vortex associated with EXP-CM. In particular, due to the temperature difference between the marine and continental environment, the sensible heat flux for EXP-CM is approximately 20% greater than that for EXP-WM. This can be explained by noting that as offshore flow wraps around the vortex core, the difference between the sea surface temperature and the near-surface air has increased, leading to larger sensible heat flux as shown in Figure 17e. Similarly, as onshore flow is advected ahead of the vortex, the temperature gradient between the land and the near surface air has increased, which leads to negative sensible heat flux as shown in Figure 17h. Similarly to EXP-WD, the maximum in accumulated precipitation rate is in the rear-right quadrant (as shown in Figure 17c,f).
The temperature differences between the marine and continental environment have important implications regarding the structure of the TCBL. As shown in Figure 18b, the cooler continental airmass establishes a sharp land–sea thermal contrast. As the vortex approaches the coastline, the land–sea thermal contrast induces high θ e air onshore, and low θ e onshore, which establishes a coastal baroclinic zone. This results in enhanced temperature gradients to the left of the vortex, and a thermally asymmetric boundary layer in general. By comparing Figure 18b with Figure 16a, the onshore thermal gradient to the left of the vortex is collocated with the radial inflow. This can be understood by noting that the thermal gradient to the left of the vortex produces a local increase in the pressure gradient between the cold inland environment and the storm environment, which enhances radial inflow in this region. In contrast, there is a weakened temperature gradient to the right of the vortex, which weakens the local pressure gradient in this region. In response to this asymmetric baroclinic forcing, the TC undergoes a gradient adjustment process that generates radial outflow to the right of the vortex.
Furthermore, the establishment of the coastal baroclinic zone also explains the differences in storm speed for EXP-CM. From the perspective of potential vorticity dynamics, the horizontal temperature gradients across the coastal baroclinic zone induce mesoscale PV anomalies, and these PV anomalies create an asymmetric flow that locally accelerates the vortex towards the coast, consistent with previous studies [64,65,66]. On average, the vortex motion for EXP-CM is about 1 m/s greater than the other vortices, and when this applies over a 50–60 h time interval, this leads to a landfall timing approximately 5 h earlier than the vortices associated with EXP-WM and EXP-WD.
The temperature differences between the marine and continental environment also have important implications regarding the thermal stability of the TCBL, as shown in Figure 18. As shown in Figure 18b, offshore flow advects low θ e to the rear of the vortex, which destabilizes the rear of the vortex. For this reason, the thermal stability is substantially lower near the surface for the vortex associated with EXP-CM than for EXP-WM, as shown in Figure 18a. Consequently, there is a deeper thermodynamic mixed layer behind the vortex for EXP-CM than for EXP-WM. In addition, vertical θ e advection transports lower θ e throughout the depth of the TCBL, producing lower θ e through the TCBL in comparison to EXP-WM. The transport of low θ e through the boundary layer and the temperature contrast between the marine and continental environment produces significant θ e gradients onshore to the left of the vortex as shown in Figure 18d,f. As the vortex associated with EXP-CM approaches the coastline, the inflow of cool, moist continental air begins to erode the high θ e inner core such that the equivalent potential temperature of the eye has decreased by 20 K as the vortex travels 100 km towards the coast (see Figure 18b,f). In addition to the advection of low θ e air directly into the core, the substantial drop in θ e within the eye is also caused by reduced surface enthalpy and latent heat fluxes in the onshore portion of the vortex (due to cooler land conditions), rain evaporation below the subcloud layer (which enhances cold pool development), and the loss of deep convection onshore. Each of these processes reduce the overall buoyancy of the storm environment, which also impacts the thermal structure of the TCBL.
As stable air penetrates the core, the stability of the superadiabatic surface layer quickly increases to nearly neutral conditions, as shown in Figure 18e. Consequently, the depth of the thermodynamic mixed layer is deepest to the rear-right quadrant whereas the front-left quadrant is characterized by a very shallow mixed layer. By comparing Figure 18e with Figure 16f, we note that there is a connection between the reduced θ e in the eye and the suppressed frictional convergence. For mature TCs over the open ocean, low-level inflow converges towards the RMW due to the net agradient force, generating vertical motion and mixing associated with the secondary circulation. However, cooler air within the eye raises the central pressure hydrostatically, leading to a weaker pressure gradient across the eye. This reduces the inflow towards the eye, leading to weaker frictional convergence.
The evolution of TKE and friction velocity for the vortex associated with EXP-CM is given in Figure 19, and by comparing Figure 19 to Figure 7, there are notable differences in the turbulence fields. First, it should be noted that the TKE associated with EXP-CM is much stronger than the TKE associated with EXP-WM when the vortex is 100 km from the coastline. This relates to the stronger surface drag (and thus greater mechanical turbulence) associated with EXP-CM, as shown in Figure 19b. Note that the asymmetry in TKE rotates cyclonically with height such that the TKE is maximum in the front-right quadrant near the surface and a maximum in the front-left quadrant near the top of the inflow layer, as shown in Figure 19a. Similarly to EXP-WM, the friction velocity increases onshore as the vortex associated with EXP-CM moves towards the coast. However, the TKE tendency is greater for EXP-CM than for EXP-WM during the landfall transition in which the TKE quickly decreases to the rear of the vortex and increases to the front of the vortex. The differences in TKE tendency can best be explained by examining the TKE budget as shown in Figure 20. Whereas the magnitude of the shear production of turbulence and dissipation are comparable, there are important differences between EXP-WM and EXP-CM when examining the other terms of the TKE budget. By comparing Figure 20c with Figure 8c, the magnitude of the buoyant destruction of TKE for the vortex associated with EXP-CM is larger than the vortex associated with EXP-WM for the onshore portion of the vortex. This is a consequence of onshore flow bringing high θ e into the continental environment which serves to stabilize the onshore section of the vortex. In addition, the buoyant destruction of TKE in the eye reduces buoyancy-driven vertical motion. Thus, the reduced TKE leads to smaller vertical eddy diffusivities, and thus, reduced vertical exchange of heat, momentum, and moisture.
Whereas the advection of TKE by the mean flow was primarily confined to the eyewall for EXP-WM in the offshore section of the vortex (as shown in Figure 8d), advection of TKE by the mean flow is present throughout the entire inner core for the vortex associated with EXP-CM (as shown in Figure 20d). This is consistent with low θ e air penetrating the core of the vortex associated with EXP-CM as discussed previously. Thus, the continental environment with the lowest θ e air produces the strongest azimuthal advection away from the rear of the vortex, which generates the weakest offshore TCBL jet among the three experiments.
The moisture fields and moisture budget for the vortex associated with EXP-CM is given in Figure 21. By comparing Figure 21 with Figure 9, we see that the vortex associated with EXP-CM is characterized by a higher presence of cloud water and cloud fraction than EXP-WM. To explain why this be the case, we note that since the continental environment has a base-state temperature that is 9 K lower than the environment (see Figure 4), the amount of water vapor needed to saturate the continental environment is less than the marine environment. Similarly to EXP-WM, vertical advection of high θ e (as shown in Figure 21f) adds additional moisture content to the onshore region, leading to cloud condensation (as shown in Figure 21f). Notice that vertical and horizontal advection work in concert to add water vapor offshore above the subcloud layer (as shown in Figure 21e), whereas horizontal advection transports water vapor downstream. Below the subcloud layer, turbulent processes transport moisture towards the surface (as shown in Figure 21c) and the azimuthal flow transports moisture towards the surface onshore. As shown in Figure 21d, cloud evaporation dominates the budget below the subcloud layer such that evaporative cooling stabilizes the region.

5. Conclusions

In this study, the evolution of the thermal and moisture fields within the TCBL during the transition to landfall was examined using a full-physics modeling framework. We can summarize the evolution of the TCBL during landfall as follows. As the vortex approaches the coastline, offshore flow wraps around the rear of the vortex, leading to reduced convergence in the rear-left quadrant of the vortex and enhanced convergence in the front-right quadrant of the vortex. The momentum advected by the onshore flow leads to enhanced storm-relative azimuthal flow in the front-right quadrant of the vortex. Thus, the inflow layer depth grows from the rear-left quadrant to the front-right quadrant. The changes in the kinematic structure of the TCBL are accompanied by changes in the thermal structure of the TCBL. As the vortex approaches the coastline, sensible and latent heat fluxes initially increase towards the front-right quadrant associated with the offshore portion of the vortex (based on the location of enhanced surface convergence, and the advection of this high θ e air across the coastline leads to negative sensible and latent heat fluxes associated with the onshore portion of the vortex. Conversely, low θ e is advected offshore to the left of the vortex, leading to a wavenumber-1 structure in θ e . Consequently, the thermal stability of the TCBL develops an asymmetric structure such that the highest thermodynamic TCBL height occurs to the right of the vortex.
When the vortex reaches the coastline, azimuthal and vertical advection by the mean flow leads to enhanced TKE to the front of the vortex, while the rear of the vortex experiences local maxima in sensible and latent heat flux. The enhanced surface fluxes and reduction in thermal stability helps to sustain convection as the vortex moves onshore. TKE budget analysis indicates that TKE is primarily generated by mechanical shear near the surface, which is then transported azimuthally and vertically by the mean flow. Thus, at landfall, TKE is transported from behind the vortex towards the front of the vortex, leading to the weakening of the offshore TKE jet. The increase in TKE by mechanical shear also generates strong turbulent dissipation of TKE by eddy viscosity, which enhances dissipative heating immediately onshore. The advection by the resolved flow onshore and the onshore precipitation leads to cloud formation immediately in front of the vortex, which affects the thermal stability immediately onshore. The sustained convection along with the enhanced friction and convergence immediately onshore may help to explain why there are locally elevated rainfall rates initially after rainfall. However, as the vortex continues to move inland, reduced surface enthalpy fluxes reduce deep convection and overall precipitation rates.
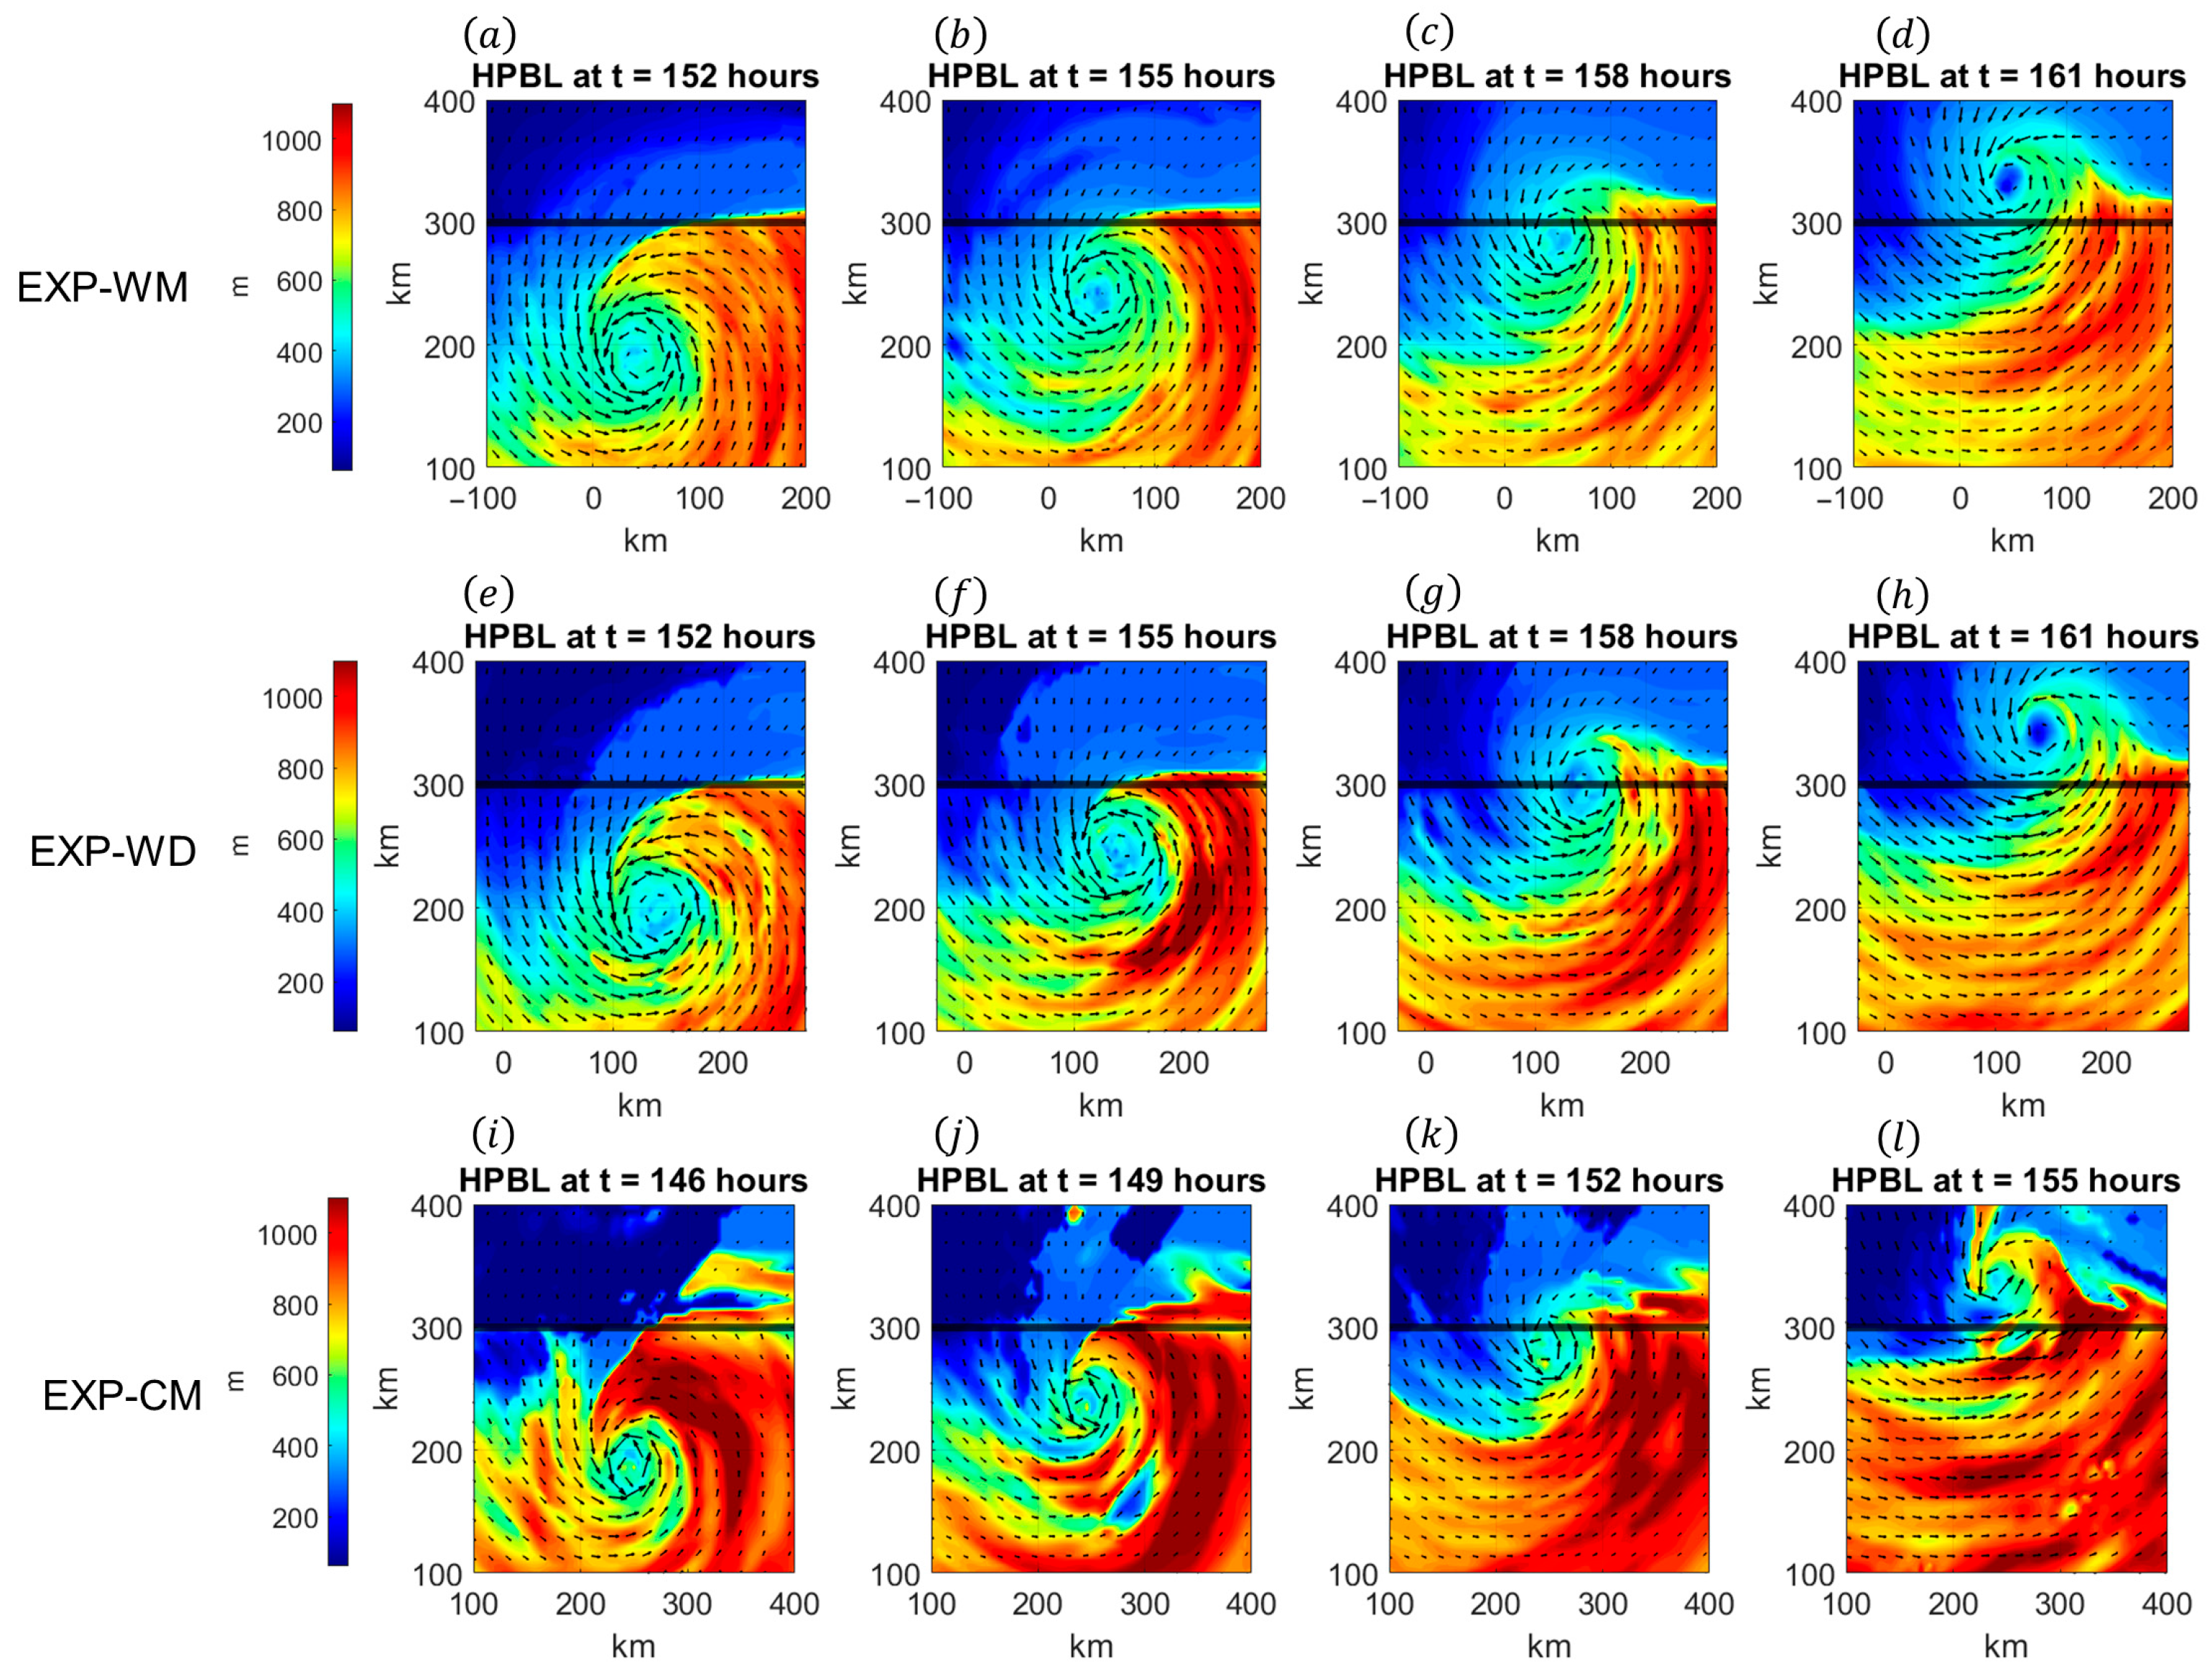
The evolution of the thermodynamic boundary layer height (and the thermodynamic fields within the TCBL in general) during the landfall transition depends upon the contrast between the marine and continental environments. Figure 22 shows the evolution of the thermodynamic boundary layer height based upon three continental environments. For each environment, there are three common features. First, note that the maximum thermodynamic boundary layer height resides to the right of the vortex for each environment (as shown in Figure 22a,e,i). Second, as the vortex approaches the coastline, the maximum thermodynamic boundary layer height shifts towards the rear-right quadrant (as shown in Figure 22b,f,j). Third, the front-left quadrant of the vortex is the most stable region of the vortex as the vortex passes the coastline (as shown in Figure 22d,h,l).
The asymmetry in the TCBL height is related to the interplay between cold pool dynamics and rainfall generation. As shown in Figure 7, there is enhanced TKE to the front and front-left quadrant of the vortex as it makes landfall. This is primarily due to the enhanced horizontal deformation and shear to the left of the storm track immediately at landfall, which increases the mechanical production of turbulence. The enhanced TKE in this region promotes vertical mixing within this region, which lifts moist air more efficiently to the level of free convection and promotes enhanced precipitation. However, enhanced precipitation leads to evaporative cooler below the drier subcloud layer over land, which promotes cold pool formation and enhanced static stability. In contrast, to the right of the storm track, mechanical mixing remains large due to strong deformation and horizontal shear. However, since the rear-right quadrant of the vortex remains over the open ocean, surface enthalpy and moisture fluxes in this section of the vortex prevents cold pool formation, and this warm, moist air is advected to the right of the vortex. For this reason, as shown in Figure 22, there are reduced TCBL heights to the left of the vortex and enhanced TCBL heights to the right of the vortex. Hence, the interplay between cold pool generated by rainfall and mechanical mixing contributes to the east–west asymmetric TCBL height observed in Figure 22.
However, the most pronounced asymmetries in thermodynamic boundary layer height occur when there are large thermal contrasts between the hurricane environment and the continental environment. As shown in Figure 22a–d, a warm, moist continental environment in which the thermal contrast between marine and continental environment is small will have the least asymmetric boundary layer height across the inner core. However, when dry air intrudes upon the vortex (as shown in Figure 22e–h), lower θ e air will be present to the left of the vortex, which enhances the θ e gradient across the vortex. When there is a substantial temperature contrast between the marine and continental environment (as shown in Figure 22i–l), large θ e gradient will develop across the core and to the rear of the vortex. In addition, dry air increases evaporative cooling within the onshore boundary layer, leading to enhanced cold pool development onshore. The stabilization of the onshore boundary layer reduces mechanical mixing and vertical momentum transport within this region. Thus, the presence of dry continental air increases the decay rate of the TC during landfall.
When there are large thermal contrasts between the hurricane environment and the continental environment (such as for experiment EXP-CM), a coastal baroclinic zone is established to the left of the vortex center as the TC approaches the coastline, which establishes a left-right thermal asymmetry across the TCBL. The strong baroclinic zone to the left of the vortex leads to enhanced pressure gradients in this region, which promotes radial inflow and rising motion. In contrast, the weakened thermal contrast to the right of the vortex center leads to weakened pressure gradients in this region. In response to the left-right asymmetry in the thermal gradients, the atmosphere responds through a gradient adjustment process that generates radial outflow in the front-right quadrant of the vortex. Since the radial pressure gradient weakens in the front-right quadrant, the onshore flow to the right of the vortex becomes supergradient, and the atmosphere adjusts to the supergradient flow by developing radial outflow to restore gradient balance. Thus, the gradient adjustment process compensates for the weakened pressure gradients on the front-right quadrant of the vortex by driving radial outflow, which allows the flow to relax toward a new balance consistent with the thermal and pressure fields. The mesoscale response redistributes angular momentum to re-balance the vortex circulation.
The dynamics of the gradient adjustment process is analogous to ageostrophic adjustment during frontogenesis. Within the cold sector of a frontal zone where the thermal gradients are strongest, the enhanced pressure gradient force induces stronger radial inflow and convergence, which balances the thermal gradients. Within the warm sector of the frontal zone, the weaker pressure gradient decelerates the air, leading to divergence away from the frontal boundary. In the case of the TC interacting with a baroclinic zone, the adjustment process occurs azimuthally due to the storm circulation. In this case, the cooler land left of the vortex motion leads to stronger pressure gradients which induces radial inflow and convergence. In contrast, the warmer land right of the vortex motion leads to weaker pressure gradient, which induces radial outflow and divergence. Furthermore, since the radial flow in the front-right quadrant is onshore, the deceleration due to surface friction further reinforces the radial divergence. The vertical scale of this gradient adjustment process primarily depends upon the depth and strength of the baroclinic zone. This helps to explain why the wavenumber-1 asymmetry in radial velocity is much more pronounced for the experiment EXP-CM than the other experiments.
The results from this study indicate that the surface thermodynamic conditions inland significantly influence how the TCBL evolves. Cooler land causes the eye and inner core θ e to drop more rapidly due to reduced surface enthalpy fluxes and increased cooling aloft through entrainment of cooler and dry air. Both effects weaken the pressure gradient force onshore, which reduce inflow and storm intensity. While dry air inland leads to evaporative cooling and strong cold pools, humid land reduces the effect, which permits convection after landfall. Thus, if operational models incorrectly assess the surface thermodynamic conditions (such as assuming dry land versus humid land due to moist soil and swamps), the models may overpredict weakening and underestimate rainfall and wind risk. Furthermore, boundary layer schemes that do not include adjustments for complex coastal and inland environments may misrepresent surface fluxes for landfalling TCs. This suggests that coupled atmosphere-land models with accurate moisture initialization are preferable for landfalling TCs.
The above study focused upon the effects of idealized changes in continental moisture and temperature. However, it is expected that the vertical temperature and moisture distribution will play an important role in the evolution of a TC. Future work will examine the changes in boundary layer evolution under environmental conditions that mimic that coastal conditions of the Atlantic hurricane basin. Furthermore, as mentioned in Section 2, the effects of cloud-radiative forcing were neglected in this study. However, as shown in this study, the distribution of precipitation and cloud cover depends sensitively upon the thermal contrast between the hurricane environment and the continental environment. Furthermore, as shown in this study, the presence of cloud cover and the location of precipitation strongly influence the thermal stability near landfall. It is expected that the role of cloud-radiative forcing will have many important impacts upon the evolution of the TCBL during landfall. Some of these potential impacts are given below:
  • Changes in cloud thickness, cloud water, and temperature affect the radiative fluxes, which feed back into the overall evolution of the storm. Moreover, surface solar fluxes will change the cloud distribution and the land surface properties of the continental region. This work has demonstrated that there are substantial changes in cloud fraction within the TCBL as the vortex approaches the coast, so it is expected that radiative fluxes will affect the general TCBL dynamics during landfall.
  • Radiative cooling at the cloud top promotes enhanced descent outside of the eyewall. Since the continental environment usually differs from the storm environment, this descent can advect lower θ e within the TCBL itself. For a relatively cool continental environment, this can strengthen the coastal baroclinic zone, which affects the future evolution of the vortex as discussed earlier. Furthermore, the vertical advection of low θ e air can lead to a greater dilution of θ e within the eye, which affects the overall decay process.
  • Longwave cooling (which can occur in the evening or during periods of dense cloud cover) can enhance the cold pool that forms immediately following landfall. Thus, the use of full radiation parameterization will capture the increased surface cooling over land (which decreases surface fluxes) and the reduced solar input after landfall. Since radiative cooling affects the thermal stability of the boundary layer, it is expected that radiative cooling will directly influence boundary layer mixing as the TC approaches the coastline.
Future work will examine the role of cloud-radiative forcing and the TC diurnal cycle on the thermal and moisture fields within the TCBL.

Funding

The funding for this work comes from the Citadel through the Lt. Col. James B. Near, Jr., Center for Climate Studies.

Institutional Review Board Statement

Not applicable.

Informed Consent Statement

Not applicable.

Data Availability Statement

The original contributions presented in this study are included in this article. Further inquiries, including the model configuration, can be directed to the corresponding author.

Acknowledgments

The calculations were made on Linux workstations generously provided by The Citadel.

Conflicts of Interest

The author declares no conflicts of interest.

References

  1. Hock, T.F.; Franklin, J.L. The NCAR GPS dropwindsonde. Bull. Am. Meteorol. Soc. 1999, 80, 407–420. [Google Scholar] [CrossRef]
  2. Aberson, S.D.; Montgomery, M.T.; Bell, M.; Black, M. Hurricane Isabel (2003): New insights into the physics of intense storms. Part II: Extreme wind speeds. Bull. Amer. Meteorol. Soc. 2006, 87, 1349–1354. [Google Scholar] [CrossRef]
  3. Kepert, J.D. Observed boundary layer wind structure and balance in the hurricane core. Part II: Hurricane Mitch. J. Atmos. Sci. 2006, 63, 2194–2211. [Google Scholar] [CrossRef]
  4. Zhang, J.A.; Rogers, R.F.; Nolan, D.S.; Marks, J.; Frank, D. On the characteristic height scales of the hurricane boundary layer. Mon. Weather Rev. 2011, 139, 2523–2535. [Google Scholar] [CrossRef]
  5. Zhang, J.A.; Rogers, R.F.; Reasor, P.D.; Uhlhorn, E.W.; Marks, F.D. Asymmetric hurricane boundary layer structure from dropsonde composites in relation to the environmental vertical wind shear. Mon. Weather Rev. 2013, 141, 3968–3984. [Google Scholar] [CrossRef]
  6. Giammanco, I.M.; Schroeder, J.L.; Powell, M.D. GPS dropwindsonde and WSR-88D observations of tropical cyclone vertical wind profiles and their characteristics. Weather Forecast. 2013, 28, 77–99. [Google Scholar] [CrossRef]
  7. Ren, Y.; Zhang, J.A.; Guimond, S.R.; Wang, X. Hurricane boundary layer height relative to storm motion from GPS dropsonde composites. Atmosphere 2019, 10, 339. [Google Scholar] [CrossRef]
  8. Shapiro, L.J. The asymmetric boundary layer flow under a translating hurricane. J. Atmos. Sci. 1983, 40, 1984–1998. [Google Scholar] [CrossRef]
  9. Kepert, J.D.; Wang, Y. The dynamics of boundary layer jets within the tropical cyclone core. Part II: Nonlinear enhancement. J. Atmos. Sci. 2001, 58, 2485–2501. [Google Scholar] [CrossRef]
  10. Williams, G.J., Jr. The effects of vortex structure and vortex translation on the tropical cyclone boundary layer wind field. J. Adv. Model. Earth Syst. 2015, 7, 188–214. [Google Scholar] [CrossRef]
  11. Thomsen, G.L.; Smith, R.K.; Montgomery, M.T. Tropical cyclone flow asymmetries induced by a uniform flow revisited. J. Adv. Model. Earth Syst. 2015, 7, 1265–1284. [Google Scholar] [CrossRef]
  12. Klotz, B.W.; Jiang, H. Examination of surface wind asymmetries in tropical cyclones. Part I: General structure and wind shear impacts. Mon. Weather Rev. 2017, 145, 3989–4009. [Google Scholar] [CrossRef]
  13. Williams, G.J., Jr. Idealized simulations of the boundary layer thermal structure for a landfalling tropical cyclone. Meteorol. Atmos. Phys. 2023, 135, 6. [Google Scholar] [CrossRef]
  14. Ming, J.J.; Zhang, A.; Rogers, R.F. Typhoon kinematic and thermodynamic boundary layer structure from dropsonde composites. J. Geophys. Res. Atmos. 2015, 120, 3158–3172. [Google Scholar] [CrossRef]
  15. Wadler, J.B.; Rogers, R.F.; Reasor, P.D. The relationship between spatial variations in the structure of convective bursts and tropical cyclone intensification as determined by airborne Doppler radar. Mon. Weather Rev. 2018, 146, 761–780. [Google Scholar] [CrossRef]
  16. Wadler, J.B.; Zhang, J.A.; Jaimes, B.; Shay, L.K. Downdrafts and the evolution of boundary layer thermodynamics in Hurricane Earl (2010) before and during rapid intensification. Mon. Weather Rev. 2018, 146, 3545–3565. [Google Scholar] [CrossRef]
  17. Wadler, J.B.; Cione, J.J.; Zhang, J.A.; Kalina, E.A.; Kaplan, J. The effects of environmental wind shear direction on tropical cyclone boundary layer thermodynamics and intensity change from multiple observational datasets. Mon. Weather Rev. 2022, 150, 115–134. [Google Scholar] [CrossRef]
  18. Ahern, K.; Hart, R.E.; Bourassa, M.A. Asymmetric hurricane boundary layer structure during storm decay. Part I: Formation of descending inflow. Mon. Weather Rev. 2021, 149, 3851–3874. [Google Scholar] [CrossRef]
  19. Alland, J.J.; Tang, B.H.; Corbosiero, K.L.; Bryan, G.H. Combined effects of midlevel dry air and vertical wind shear on tropical cyclone development. Part I: Downdraft ventilation. J. Atmos. Sci. 2021, 78, 763–782. [Google Scholar] [CrossRef]
  20. Alland, J.J.; Tang, B.H.; Corbosiero, K.L.; Bryan, G.H. Combined effects of midlevel dry air and vertical wind shear on tropical cyclone development. Part II: Radial ventilation. J. Atmos. Sci. 2021, 78, 783–796. [Google Scholar] [CrossRef]
  21. Alland, J.J.; Davis, C.A. Effects of surface fluxes on ventilation pathways and the intensification of Hurricane Michael (2018). J. Atmos. Sci. 2022, 79, 1211–1229. [Google Scholar] [CrossRef]
  22. Li, Q.; Dai, Y. Revisiting azimuthally asymmetric moist instability in the outer core of sheared tropical cyclones. Mon. Weather Rev. 2020, 148, 1297–1319. [Google Scholar] [CrossRef]
  23. Dai, Y.; Li, Q.; Liu, X.; Wang, L. A Lagrangian trajectory analysis of azimuthally asymmetric equivalent potential temperature in the outer core of sheared tropical cyclones. Adv. Atmos. Sci. 2023, 40, 1689–1706. [Google Scholar] [CrossRef]
  24. Yu, C.; Tang, B.; Fovell, R.G. Tropical cyclone boundary layer asymmetries in a tilt-following perspective. J. Atmos. Sci. 2024, 81, 1543–1563. [Google Scholar] [CrossRef]
  25. Powell, M.D. The transition of the Hurricane Frederic boundary-layer wind field from the open Gulf of Mexico to Landfall. Mon. Weather Rev. 1982, 110, 1912–1932. [Google Scholar] [CrossRef]
  26. Lin, N.; Chavas, D. On hurricane parametric wind and applications in storm surge modeling. J. Geophys. Res. Atmos. 2012, 117, 1–19. [Google Scholar] [CrossRef]
  27. Uhlhorn, E.W.; Black, P.G.; Franklin, J.L.; Goodberlet, M.; Carswell, J.; Goldstein, A.S. Hurricane surface wind measurements from an operational stepped frequency microwave radiometer. Mon. Weather Rev. 2007, 135, 3070–3085. [Google Scholar] [CrossRef]
  28. Wong, M.L.M.; Chan, J.C.L. Modeling the effects of land-sea roughness contrast on tropical cyclone winds. J. Atmos. Sci. 2007, 64, 3249–3264. [Google Scholar] [CrossRef]
  29. Hirth, B.D.; Schroeder, J.L.; Weiss, C.C. Research radar analyses of the internal boundary layer over Cape Canaveral, Florida during the landfall of Hurricane Frances (2004). Weather Forecast. 2012, 27, 1349–1372. [Google Scholar] [CrossRef]
  30. Ming, J.J.; Zhang, J.A.; Rogers, R.F.; Cai, M.F.D. Multiplatform observations of boundary layer structure in the outer rainbands of landfalling typhoons. J. Geophys. Res. Atmos. 2014, 11, 7799–7814. [Google Scholar] [CrossRef]
  31. Alford, A.A.; Zhang, J.A.; Biggerstaf, M.I.; Dodge, P.; Marks, F.D.; Bodine, D.J. Transition of the hurricane boundary layer during the landfall of Hurricane Irene (2011). J. Atmos. Sci. 2020, 77, 3509–3531. [Google Scholar] [CrossRef]
  32. Zhao, Z.; Gao, R.; Zhang, J.A.; Zhu, Y.; Liu, C.; Chan, P.W.; Wan, Q. Observations of boundary layer wind and turbulence of a landfalling tropical cyclone. Sci. Rep. 2022, 12, 11056. [Google Scholar] [CrossRef]
  33. Williams, G.J., Jr. Idealized simulations of the inner core boundary layer structure in a landfalling tropical cyclone. Part I: Kinematic structure. Trop. Cyclone Res. Rev. 2019, 8, 47–67. [Google Scholar] [CrossRef]
  34. Tang, X.; Tan, Z. Boundary-layer wind structure in a landfalling tropical cyclone. Adv. Atmos. Sci. 2006, 23, 737–749. [Google Scholar] [CrossRef]
  35. Chen, Y.; Yau, M.K. Asymmetric structures in a simulated landfalling hurricane. J. Atmos. Sci. 2003, 60, 2294–2312. [Google Scholar] [CrossRef]
  36. Kepert, J.D. The boundary layer dynamics of tropical cyclone rainbands. J. Atmos. Sci. 2018, 75, 3777–3795. [Google Scholar] [CrossRef]
  37. Hlywiak, J.; Nolan, D.S. The evolution of asymmetries in the tropical cyclone boundary layer wind field during landfall. Mon. Weather Rev. 2022, 150, 529–549. [Google Scholar] [CrossRef]
  38. Villarini, G.; Smith, J.A.; Baeck, M.L.; Marchok, R.; Vecchi, G.A. Characterization of rainfall distribution and flooding associated with U.S. landfalling tropical cyclones; Analyses of Hurricanes Frances, Ivan, and Jeanne (2004). J. Geophys. Res. Atmos. 2011, 116, 1–19. [Google Scholar] [CrossRef]
  39. Guzman, O.; Jiang, H. Climatology of tropical cyclone rainfall magnitude at different landfalling stages: An emphasis on after-landfall rain. J. App. Meteorol. Clim. 2023, 62, 801–815. [Google Scholar] [CrossRef]
  40. Wen, G.; Huang, G.; Huang, H.; Liu, C.; Bi, X. Observed rainfall asymmetry of tropical cyclone in the process of making landfall in Guangdon, south China. Int. J. Clim. 2019, 32, 3379–3395. [Google Scholar] [CrossRef]
  41. Schneider, R.; Barnes, G.M. Low-level kinematic, thermodynamic, and reflectivity fields associated with Hurricane Bonnie (1998) at landfall. Mon. Weather Rev. 2005, 133, 3243–3259. [Google Scholar] [CrossRef]
  42. Tuleya, R.E. Tropical storm development and decay: Sensitivity to surface boundary conditions. Mon. Weather Rev. 1994, 122, 291–304. [Google Scholar] [CrossRef]
  43. Shen, W.; Ginis, I.; Tuleya, R.E. A numerical investigation of land surface water on landfalling hurricanes. J. Atmos. Sci. 2002, 59, 789–802. [Google Scholar] [CrossRef]
  44. Kishtawal, C.M.; Niyogi, D.; Kumar, A.; Bozeman, M.L.; Kellner, O. Sensitivity of inland decay of North Atlanta tropical cyclones to soil parameters. Nat. Hazards 2012, 63, 1527–1542. [Google Scholar] [CrossRef]
  45. Hlywiak, J.; Nolan, D.S. The response of the near-surface tropical cyclone wind field to inland surface roughness length and soil moisture during and after landfall. J. Atmos. Sci. 2021, 78, 983–1000. [Google Scholar] [CrossRef]
  46. Bryan, G.H.; Fritsch, J.M. A benchmark simulation for moist non-hydrostatic numerical models. Mon. Weather Rev. 2002, 130, 2917–2928. [Google Scholar] [CrossRef]
  47. Bryan, G.H.; Rotunno, R. The maximum intensity of tropical cyclones in axisymmetric numerical model simulations. Mon. Weather Rev. 2009, 137, 1770–1789. [Google Scholar] [CrossRef]
  48. Nakanishi, M.; Niino, H. An Improved Mellor–Yamada Level-3 Model: Its Numerical Stability and Application to a Regional Prediction of Advection Fog. Bound. Layer Meteorol. 2006, 119, 397–407. [Google Scholar] [CrossRef]
  49. Chen, X. How do planetary boundary layer schemes perform in hurricane conditions: A comparison with large-eddy simulations. J. Adv. Model. Earth Syst. 2022, 14, e2022MS003088. [Google Scholar] [CrossRef]
  50. Fairall, C.W.; Bradley, E.F.; Hare, J.E.; Grachev, A.A. Bulk parameterization of air-sea fuxes: Updates and verifcation for the COARE algorithm. J. Clim. 2003, 16, 571–591. [Google Scholar] [CrossRef]
  51. Donelan, M.A.; Haus, B.K.; Reul, N.; Plant, W.J.; Stiassnie, M.; Graber, H.C.; Brown, O.B.; Saltzman, E.S. On the limiting aerodynamic roughness of the ocean in very strong winds. Geophys. Res. Lett. 2004, 31, L18306. [Google Scholar] [CrossRef]
  52. Bryan, G.H.; Morrison, H. Sensitivity of a simulated squall line to horizontal resolution and parameterization of microphysics. Mon. Weather Rev. 2012, 140, 202–225. [Google Scholar] [CrossRef]
  53. Rotunno, R.; Emanuel, K.A. An air–sea interaction theory for tropical cyclones part II: Evolutionary study using a nonhydrostatic axisymmetric numerical model. J. Atmos. Sci. 1987, 44, 542–561. [Google Scholar] [CrossRef]
  54. Dunion, J.P.; Marron, C.S. A reexamination of the Jordan mean tropical sounding based on awareness of the Saharan air layer: Results from 2002. J. Clim. 2008, 21, 5242–5253. [Google Scholar] [CrossRef]
  55. Bell, M.M.; Montgomery, M.T. Observed structure, evolution, and potential intensity of category 5 Hurricane Isabel (2003) from 12 to 14 September. Mon. Weather Rev. 2008, 136, 2023–2046. [Google Scholar] [CrossRef]
  56. Montgomery, M.T.; Zhang, J.A.; Smith, R.K. An analysis of the observed low-level structure of rapidly intensifying and mature hurricane Earl (2010). Quart. J. R. Meteorol. Soc. 2014, 140, 2132–2146. [Google Scholar] [CrossRef]
  57. Kimball, S.K. A modeling study of hurricane landfall in a dry environment. Mon. Weather Rev. 2006, 134, 1901–1918. [Google Scholar] [CrossRef]
  58. Kimball, S.K. Structure and evolution of rainfall in numerically simulated landfalling hurricanes. Mon. Weather Rev. 2008, 136, 3822–3847. [Google Scholar] [CrossRef]
  59. Shu, S.; Feng, X.; Teng, D. Observed vertical structure of precipitation influenced by dry air for landfalling tropical cyclones over China. J. Geophys. Res. Atmos. 2021, 126, D11. [Google Scholar] [CrossRef]
  60. Shu, S.; Feng, X.; Wang, Y. Essential role of synoptic environment on rainfall distribution of landfalling tropical cyclones over China. J. Geophys. Res. Atmos. 2018, 123, 1–22. [Google Scholar] [CrossRef]
  61. Braun, S.A.; Sippel, J.A.; Nolan, D.S. The impact of dry midlevel air on hurricane intensity in idealized simulations with no mean flow. J. Atmos. Sci. 2012, 69, 236–257. [Google Scholar] [CrossRef]
  62. Zhang, J.A.; Drennan, W.M. An observational study of vertical eddy diffusivity in the hurricane boundary layer. J. Atmos. Sci. 2012, 69, 3223–3236. [Google Scholar] [CrossRef]
  63. Chen, C. Vertical eddy diffusivity in the tropical cyclone boundary layer during landfall. Atmosphere 2022, 13, 982. [Google Scholar] [CrossRef]
  64. Shapiro, L.J.; Franklin, J.L. Potential vorticity anomalies and tropical cyclone motion. Mon. Weather Rev. 1999, 127, 124–131. [Google Scholar] [CrossRef]
  65. Chan, J.C.-L.; Ko, F.M.F.; Lei, Y.M. Relationship between potential vorticity tendency and tropical cyclone motion. J. Atmos. Sci. 2002, 59, 1317–1336. [Google Scholar] [CrossRef]
  66. Wu, L.; Wang, B. A potential vorticity tendency diagnostic approach for tropical cyclone motion. Mon. Weather Rev. 2000, 128, 1899–1911. [Google Scholar] [CrossRef]
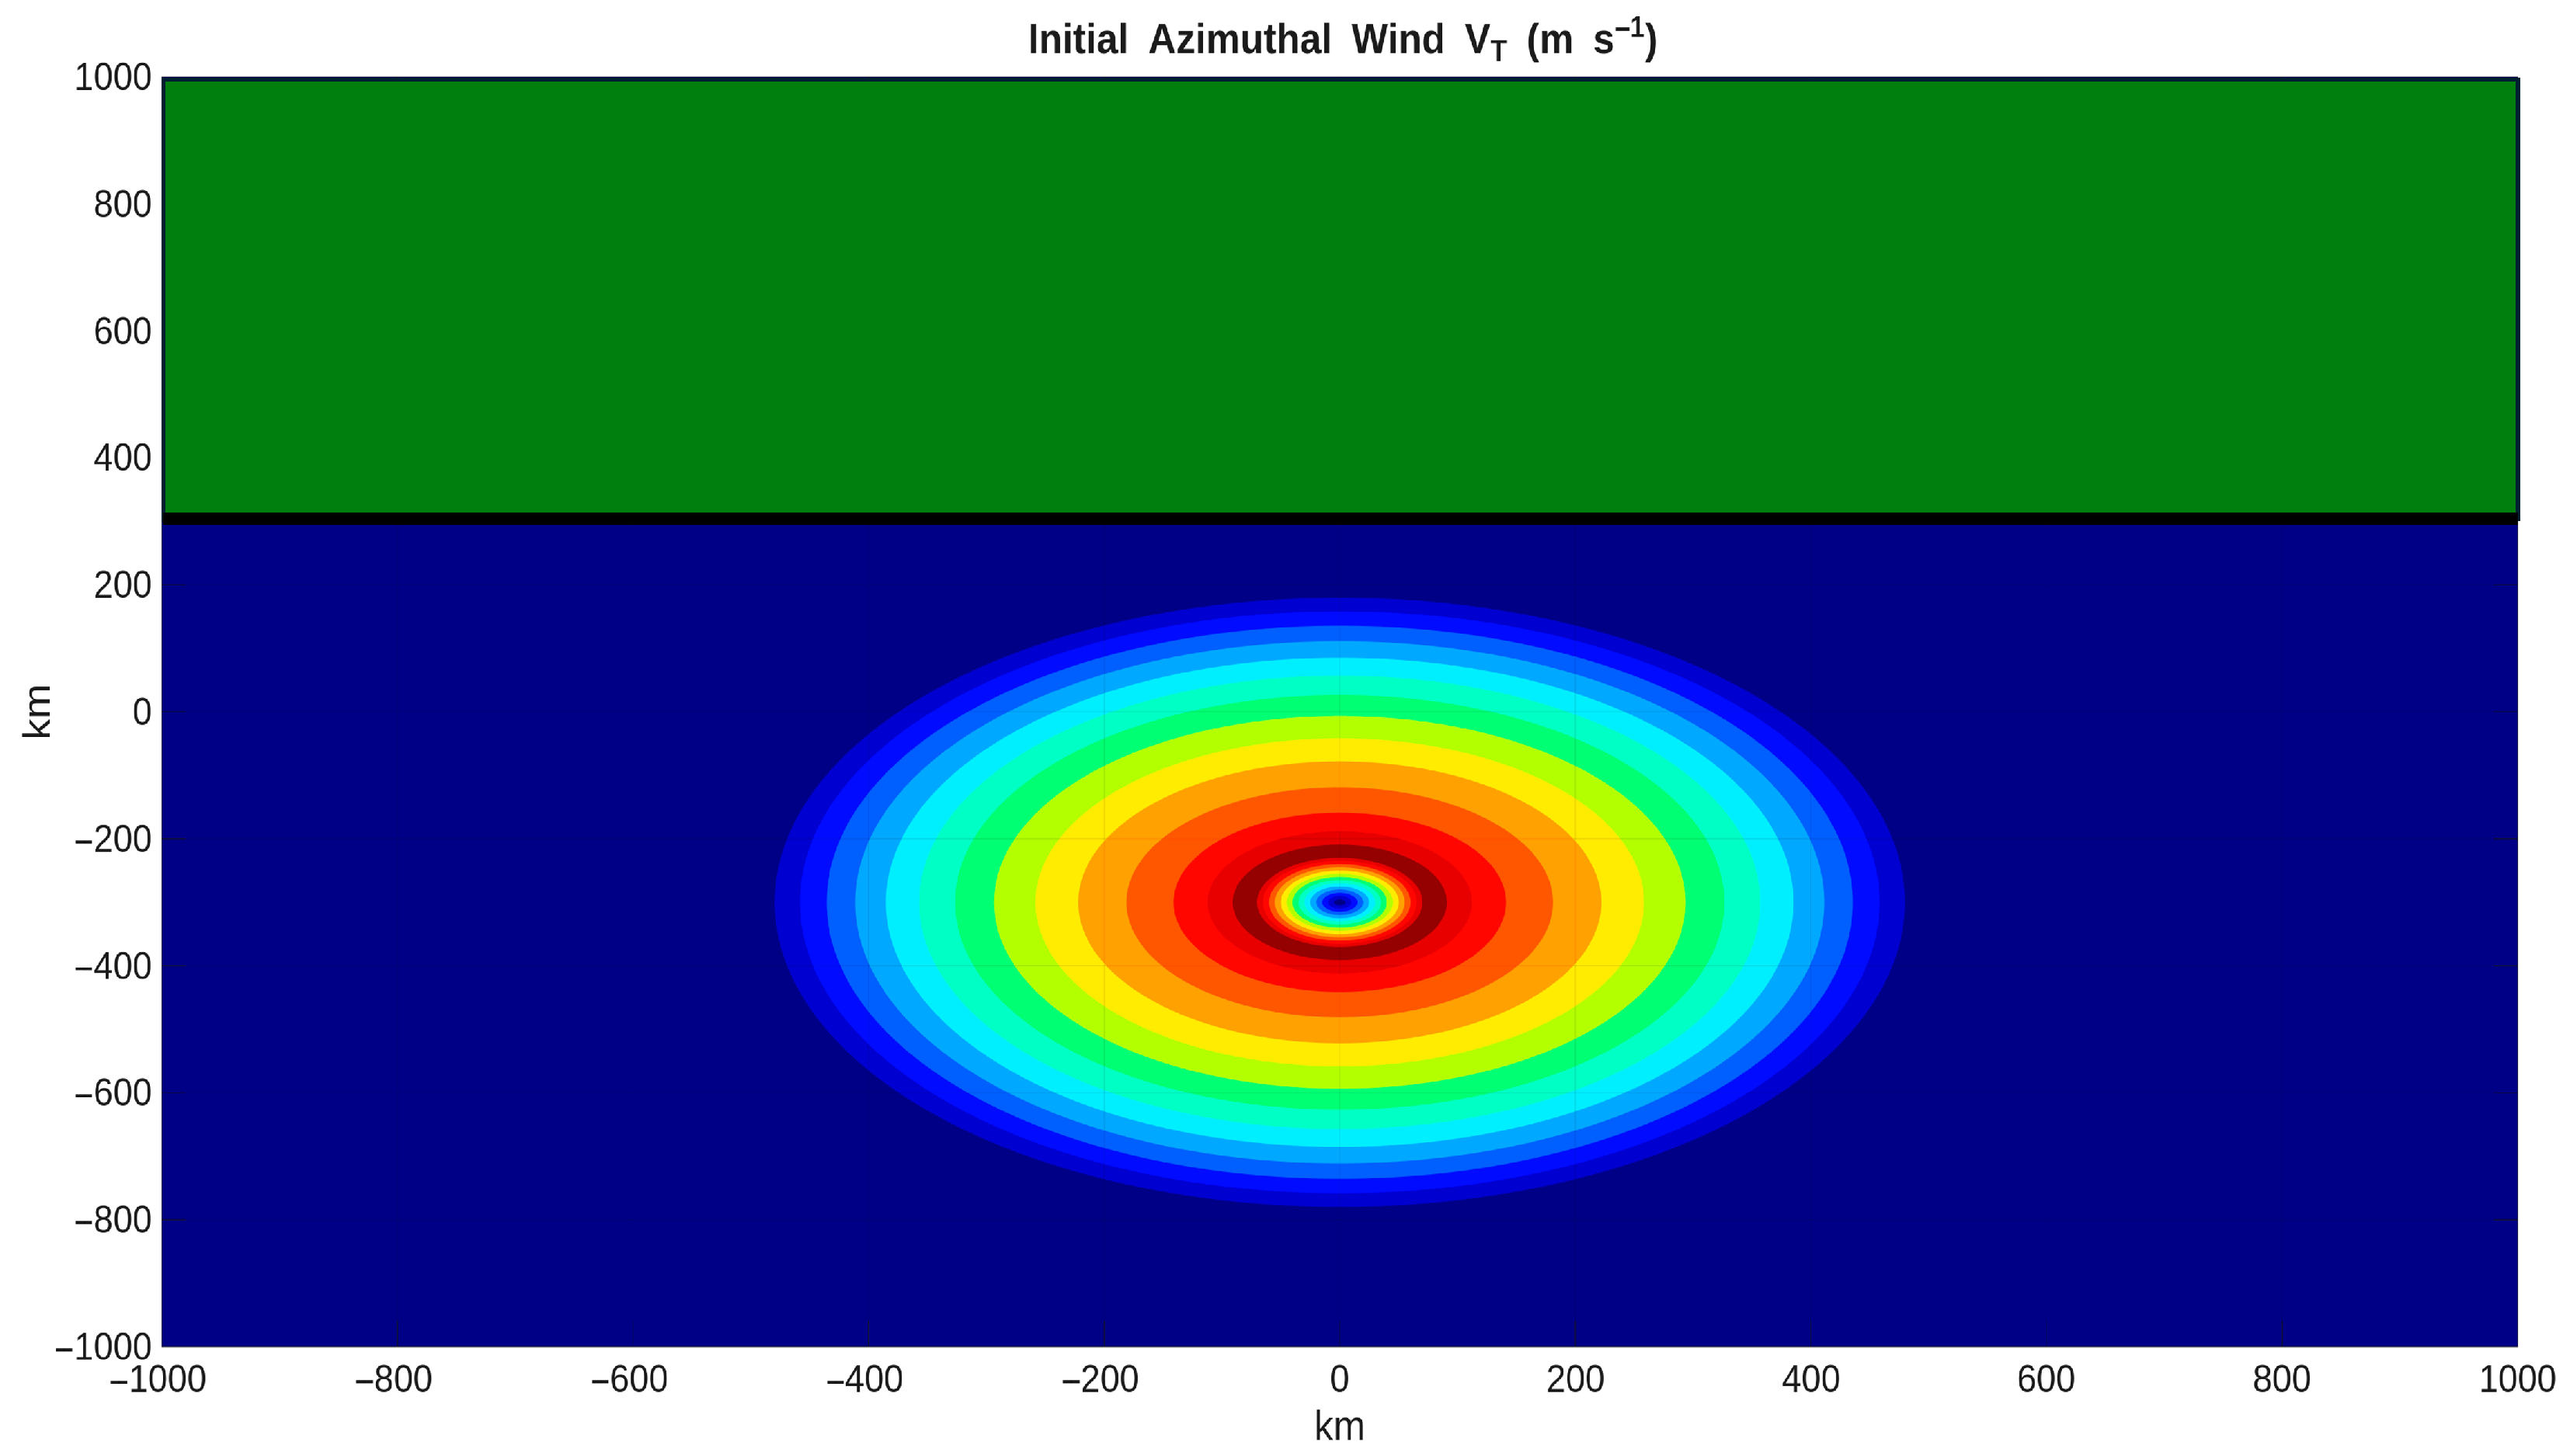
Figure 1. The initial winds associated with the simulated TCs. The solid black line corresponds to the location of the coastline. The ocean is shown in blue, and the land is shown in green.
J 08 00031 g001
Figure 2. The azimuthally averaged radius-height plot of the mean TCBL (a) radial velocity V R (in m s−1), (b) vertical velocity V W (in m s−1), (c) azimuthal velocity V T (in m s−1), (d) equivalent potential temperature θ e (in K), and (e) virtual potential temperature gradient d θ v / d z (in K km−1) at t = 96 h for the model simulations. The black contour in (a) is the depth of the inflow layer, defined by where V R equals 10% of the peak inflow. The black contour in (e) is the diagnosed boundary layer depth from the MYNN-2.5 PBL scheme. For each plot, the radius and height are displayed in km.
J 08 00031 g002
Figure 3. The (a) potential temperature profile in K, (b) water vapor mixing ratio in g kg−1, and (c) the temperature profile in K for the three experiments (see the text and Table 1 for a description of each experiment). The ocean profile is the same for each experiment.
J 08 00031 g003
Figure 4. The storm-relative radial velocity V R (in m s−1) for EXP-WM when (a) the vortex center is 100 km from the coast, (b) when the vortex center is 50 km from the coast, and (c) when the vortex center makes landfall. The storm-relative azimuthal velocity V T (in m s−1) for EXP-WM when (d) the vortex center is 100 km from the coast, (e) when the vortex center is 50 km from the coast, and (f) when the vortex center makes landfall. The black line corresponds to the position of the coastline.
J 08 00031 g004
Figure 5. The surface sensible heat flux (HFX), surface latent heat flux (LFX), and surface precipitation rate (PRATE) for EXP-WM when the vortex center is 100 km from the coast (ac), when the vortex center is 50 km from the coast (df), and when the vortex has made landfall (gi). The vector arrows correspond to the diagnosed 10 m wind at each time. The black line corresponds to the position of the coastline. Note that the heat fluxes are measured in W m−2, and the accumulated precipitation rate is measured in mm hr−1.
J 08 00031 g005
Figure 6. The evolution of the virtual potential temperature gradient d θ v / d z (in K km−1) and the equivalent potential temperature θ e (in K) for EXP-WM when the vortex center is 100 km from the coast (a,b), when the vortex center is 50 km from the coast (c,d), and when the vortex has made landfall (e,f). The solid black line corresponds to the location of the coastline.
J 08 00031 g006
Figure 7. The turbulent kinetic energy (TKE) (in m2 s−2) and friction velocity u for EXP-WM when the vortex center is 100 km from the coast (a,b), when the vortex center is 50 km from the coast (c,d), and when the vortex center reaches the coastline (e,f). The vector arrows correspond to the diagnosed 10 m wind at each time. The black line corresponds to the position of the coastline.
J 08 00031 g007
Figure 8. (a) The turbulent kinetic energy (TKE) (in m2 s−2) for EXP-WM at the surface where the solid black line corresponds to the position of the coastline. (bf) provides the vertical cross-section of the TKE budget along the white dashed line given in (a). Q s h e a r refers to the shear production of TKE, Q b u o y refers to the buoyant production of TKE, Q a d v refers to the advection of TKE by the resolved flow, Q w t refers to the vertical diffusion of TKE by the turbulent eddies, and Q d i s s refers to the dissipation of TKE. The black dashed line in (bf) corresponds to the position of the coastline with respect to the vertical cross-section.
J 08 00031 g008
Figure 9. (a) The cloud water mixing ratio Q c , b l in g kg−1 and (b) the cloud fraction through the same cross-section for EXP-WM defined in Figure 8a. (cf) provides the vertical cross-section of the water vapor mixing ratio budget along the white dashed line given in Figure 8a. Q T p b l refers to cloud water vapor tendency by subgrid-scale vertical fluxes. Q T h a d v refers to horizontal advection of Q c , b l by the resolved flow. Q T m p refers to the production or destruction of cloud water by microphysical processes. Q T v a d v refers to vertical advection of cloud water. The black dashed line in (af) corresponds to the position of the coastline with respect to the vertical cross-section defined as Figure 8a. See [47] for more information regarding the water vapor mixing ratio tendency equation.
J 08 00031 g009
Figure 10. The storm-relative radial velocity V R (in m s−1) for EXP-WD when (a) the vortex center is 100 km from the coast, (b) when the vortex center is 50 km from the coast, and (c) when the vortex center makes landfall. The storm-relative azimuthal velocity V T (in m s−1) for EXP-WD when (d) the vortex center is 100 km from the coast, (e) when the vortex center is 50 km from the coast, and (f) when the vortex center makes landfall. The black line corresponds to the position of the coastline.
J 08 00031 g010
Figure 11. The surface sensible heat flux (HFX), surface latent heat flux (LFX), and surface precipitation rate (PRATE) for EXP-WD when the vortex center is 100 km from the coast (ac), when the vortex center is 50 km from the coast (df), and when the vortex has made landfall (gi). The vector arrows correspond to the diagnosed 10 m wind at each time. The black line corresponds to the position of the coastline. Note that the heat fluxes are measured in W m−2, and the accumulated precipitation rate is measured in mm hr−1.
J 08 00031 g011
Figure 12. The evolution of the virtual potential temperature gradient d θ v / d z (in K km−1) and the equivalent potential temperature θ e (in K) for EXP-WD when the vortex center is 100 km from the coast (a,b), when the vortex center is 50 km from the coast (c,d), and when the vortex has made landfall (e,f). The solid black line corresponds to the location of the coastline.
J 08 00031 g012
Figure 13. The turbulent kinetic energy (TKE) (in m2 s−2) and friction velocity u for EXP-WD when the vortex center is 100 km from the coast (a,b), when the vortex center is 50 km from the coast (c,d), and when the vortex center reaches the coastline (e,f). The vector arrows correspond to the diagnosed 10 m wind at each time. The black line corresponds to the position of the coastline.
J 08 00031 g013
Figure 14. (a) The turbulent kinetic energy (TKE) (in m2 s−2) for EXP-WD at the surface where the solid black line corresponds to the position of the coastline. (bf) provides the vertical cross-section of the TKE budget along the white dashed line given in (a). Q s h e a r refers to the shear production of TKE, Q b u o y refers to the buoyant production of TKE, Q a d v refers to the advection of TKE by the resolved flow, Q w t refers to the vertical diffusion of TKE by the turbulent eddies, and Q d i s s refers to the dissipation of TKE. The black dashed line in (bf) corresponds to the position of the coastline with respect to the vertical cross-section.
J 08 00031 g014
Figure 15. (a) The cloud water mixing ratio Q c , b l in g kg−1 and (b) the cloud fraction through the same cross-section for EXP-WD defined in Figure 14a. (cf) provides the vertical cross-section of the water vapor mixing ratio budget along the white dashed line given in Figure 14a. Q T p b l refers to cloud water vapor tendency by subgrid-scale vertical fluxes. Q T h a d v refers to horizontal advection of Q c , b l by the resolved flow. Q T m p refers to the production or destruction of cloud water by microphysical processes. Q T v a d v refers to vertical advection of cloud water. The black dashed line in (af) corresponds to the position of the coastline with respect to the vertical cross-section defined as Figure 14a. See [47] for more information regarding the water vapor mixing ratio tendency equation.
J 08 00031 g015
Figure 16. The storm-relative radial velocity V R (in m s−1) for EXP-CM when (a) the vortex center is 100 km from the coast, (b) when the vortex center is 50 km from the coast, and (c) when the vortex center makes landfall. The storm-relative azimuthal velocity V T (in m s−1) for EXP-CM when (d) the vortex center is 100 km from the coast, (e) when the vortex center is 50 km from the coast, and (f) when the vortex center makes landfall. The black line corresponds to the position of the coastline.
J 08 00031 g016
Figure 17. The surface sensible heat flux (HFX), surface latent heat flux (LFX), and surface precipitation rate (PRATE) for EXP-CM when the vortex center is 100 km from the coast (ac), when the vortex center is 50 km from the coast (df), and when the vortex has made landfall (gi). The vector arrows correspond to the diagnosed 10 m wind at each time. The black line corresponds to the position of the coastline. Note that the heat fluxes are measured in W m−2, and the accumulated precipitation rate is measured in mm hr−1.
J 08 00031 g017
Figure 18. The evolution of the virtual potential temperature gradient d θ v / d z (in K km−1) and the equivalent potential temperature θ e (in K) for EXP-CM when the vortex center is 100 km from the coast (a,b), when the vortex center is 50 km from the coast (c,d), and when the vortex has made landfall (e,f). The solid black line corresponds to the location of the coastline.
J 08 00031 g018
Figure 19. The turbulent kinetic energy (TKE) (in m2 s−2) and friction velocity u for EXP-CM when the vortex center is 100 km from the coast (a,b), when the vortex center is 50 km from the coast (c,d), and when the vortex center reaches the coastline (e,f). The vector arrows correspond to the diagnosed 10 m wind at each time. The black line corresponds to the position of the coastline.
J 08 00031 g019
Figure 20. (a) The turbulent kinetic energy (TKE) (in m2 s−2) for EXP-CM at the surface where the solid black line corresponds to the position of the coastline. (bf) provides the vertical cross-section of the TKE budget along the white dashed line given in (a). Q s h e a r refers to the shear production of TKE, Q b u o y refers to the buoyant production of TKE, Q a d v refers to the advection of TKE by the resolved flow, Q w t refers to the vertical diffusion of TKE by the turbulent eddies, and Q d i s s refers to the dissipation of TKE. The black dashed line in (bf) corresponds to the position of the coastline with respect to the vertical cross-section.
J 08 00031 g020
Figure 21. (a) The cloud water mixing ratio Q c , b l in g kg−1 and (b) the cloud fraction through the same cross-section for EXP-CM defined in Figure 20a. (cf) provides the vertical cross-section of the water vapor mixing ratio budget along the white dashed line given in Figure 20a. Q T p b l refers to cloud water vapor tendency by subgrid-scale vertical fluxes. Q T h a d v refers to horizontal advection of Q c , b l by the resolved flow. Q T m p refers to the production or destruction of cloud water by microphysical processes. Q T v a d v refers to vertical advection of cloud water. The black dashed line in (af) corresponds to the position of the coastline with respect to the vertical cross-section defined as Figure 20a. See [47] for more information regarding the water vapor mixing ratio tendency equation.
J 08 00031 g021
Figure 22. The diagnosed thermodynamic boundary layer height (HPBL) from the MYNN-2.5 PBL scheme for each experiment: EXP-WM (ad), EXP-WD (eh), and EXP-CM (il). The black line corresponds to the position of the coastline. The vector arrows correspond to the diagnosed 10 m wind at each time.
J 08 00031 g022
Table 1. The set of experiments performed in this study. LST corresponds to the land surface temperature (in Kelvin), θ l a n d corresponds to base-state potential temperature associated with land (K), θ o c e a n corresponds to the base-state potential temperature over the open ocean, R H l a n d corresponds to the base-state relative humidity over land, and R H o c e a n corresponds to the base-state relative humidity over the open ocean.
VortexLST (K) θ l a n d (K) R H l a n d
EXP-WM299 θ o c e a n 2 R H o c e a n
EXP-WD299 θ o c e a n 2 R H o c e a n
EXP-CM292 θ o c e a n 9 R H o c e a n 0.20
Disclaimer/Publisher’s Note: The statements, opinions and data contained in all publications are solely those of the individual author(s) and contributor(s) and not of MDPI and/or the editor(s). MDPI and/or the editor(s) disclaim responsibility for any injury to people or property resulting from any ideas, methods, instructions or products referred to in the content.