

GIS and Spatial Analysis in the Utilization of Residual Biomass for Biofuel Production


Abstract
1. Introduction
Literature Review
2. Data
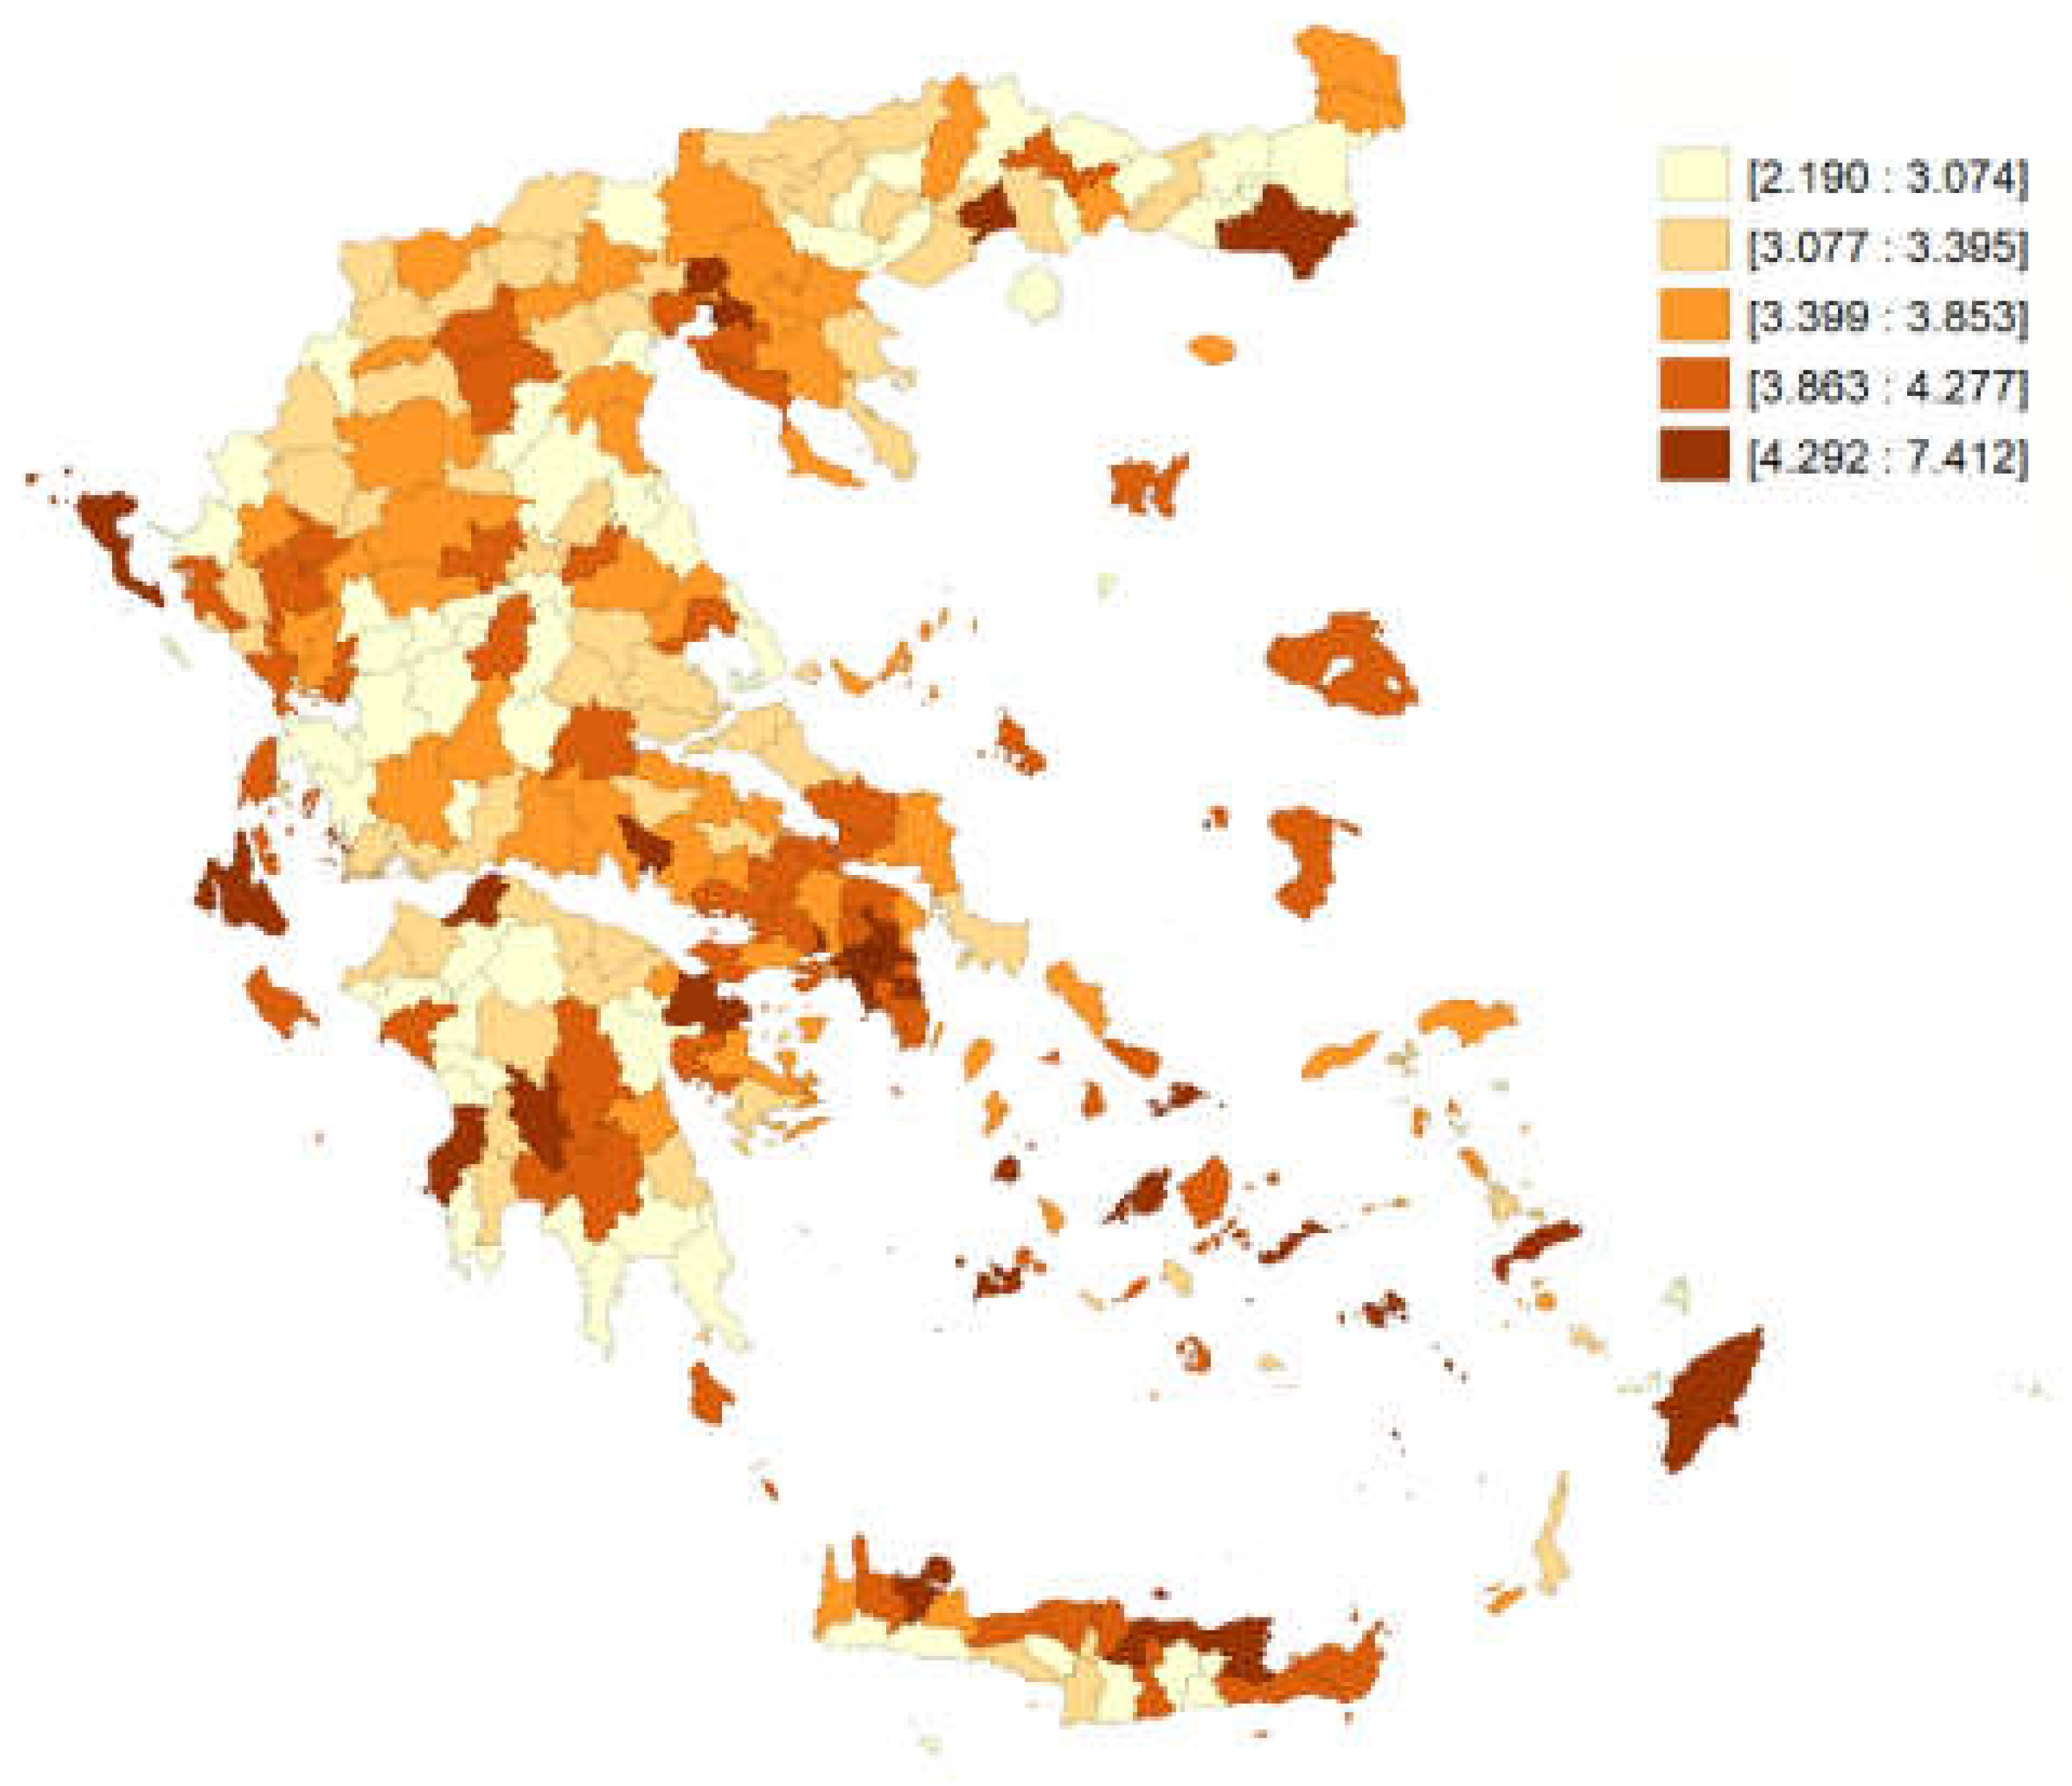
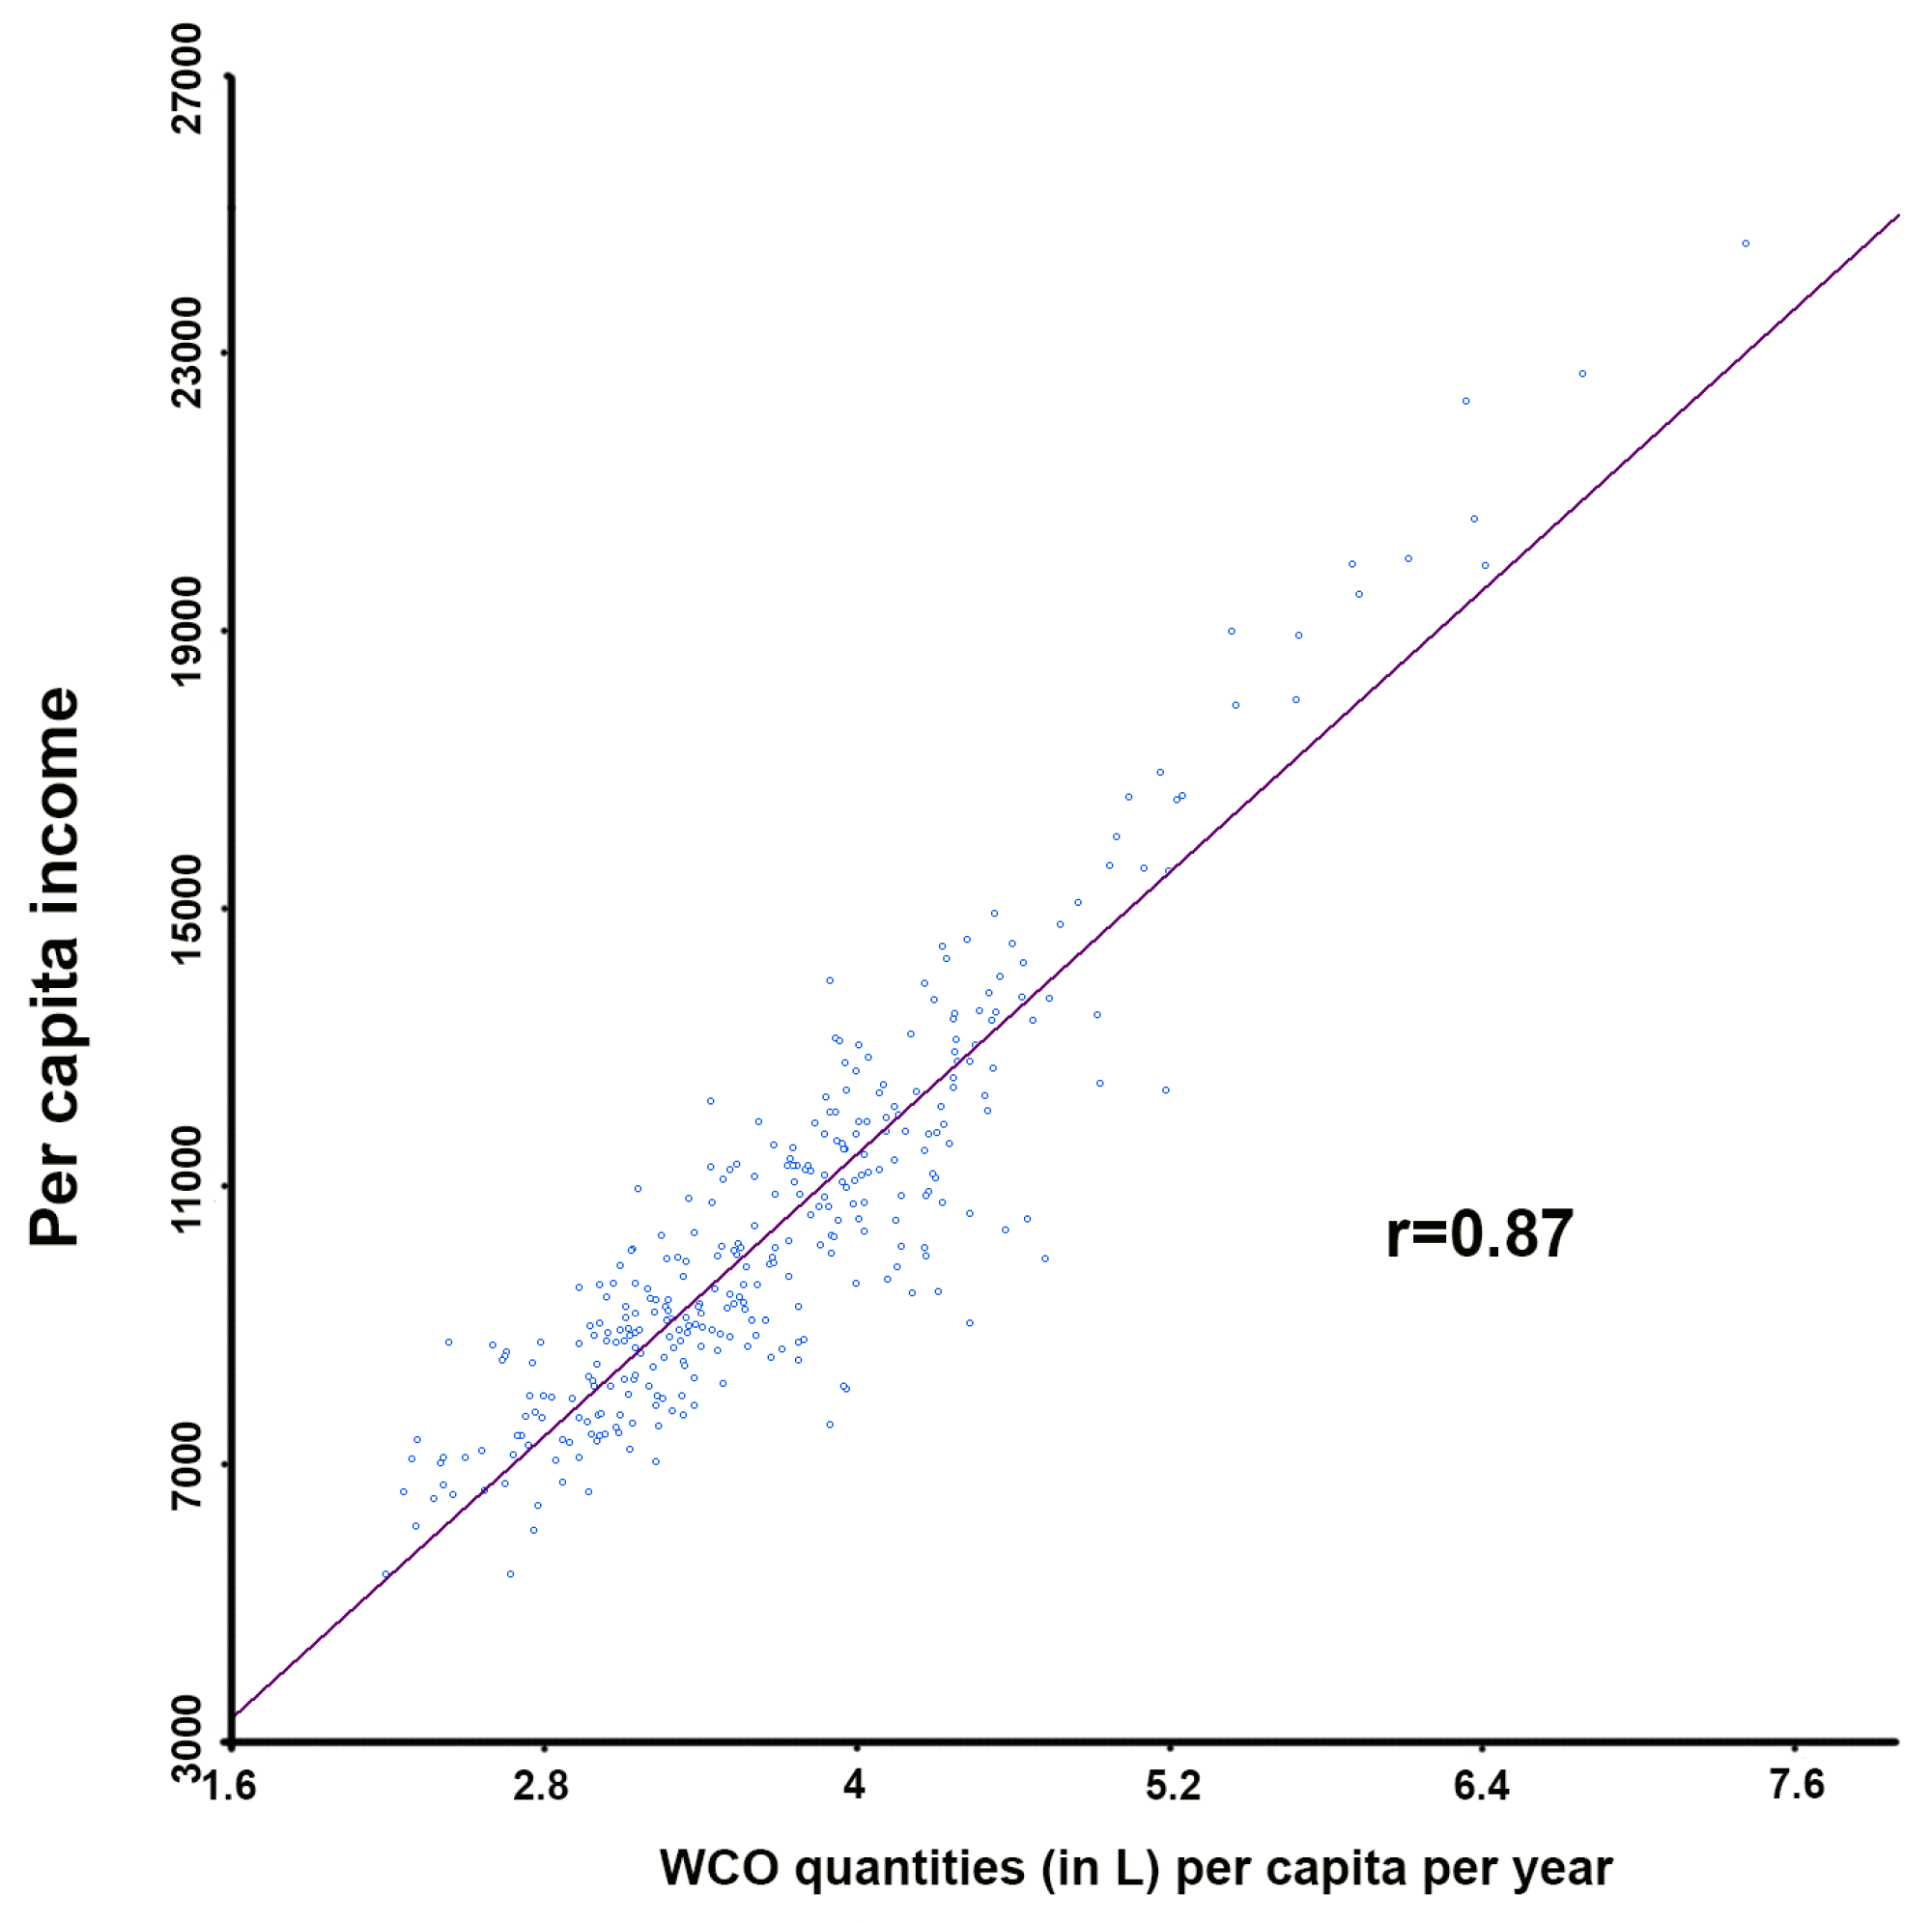
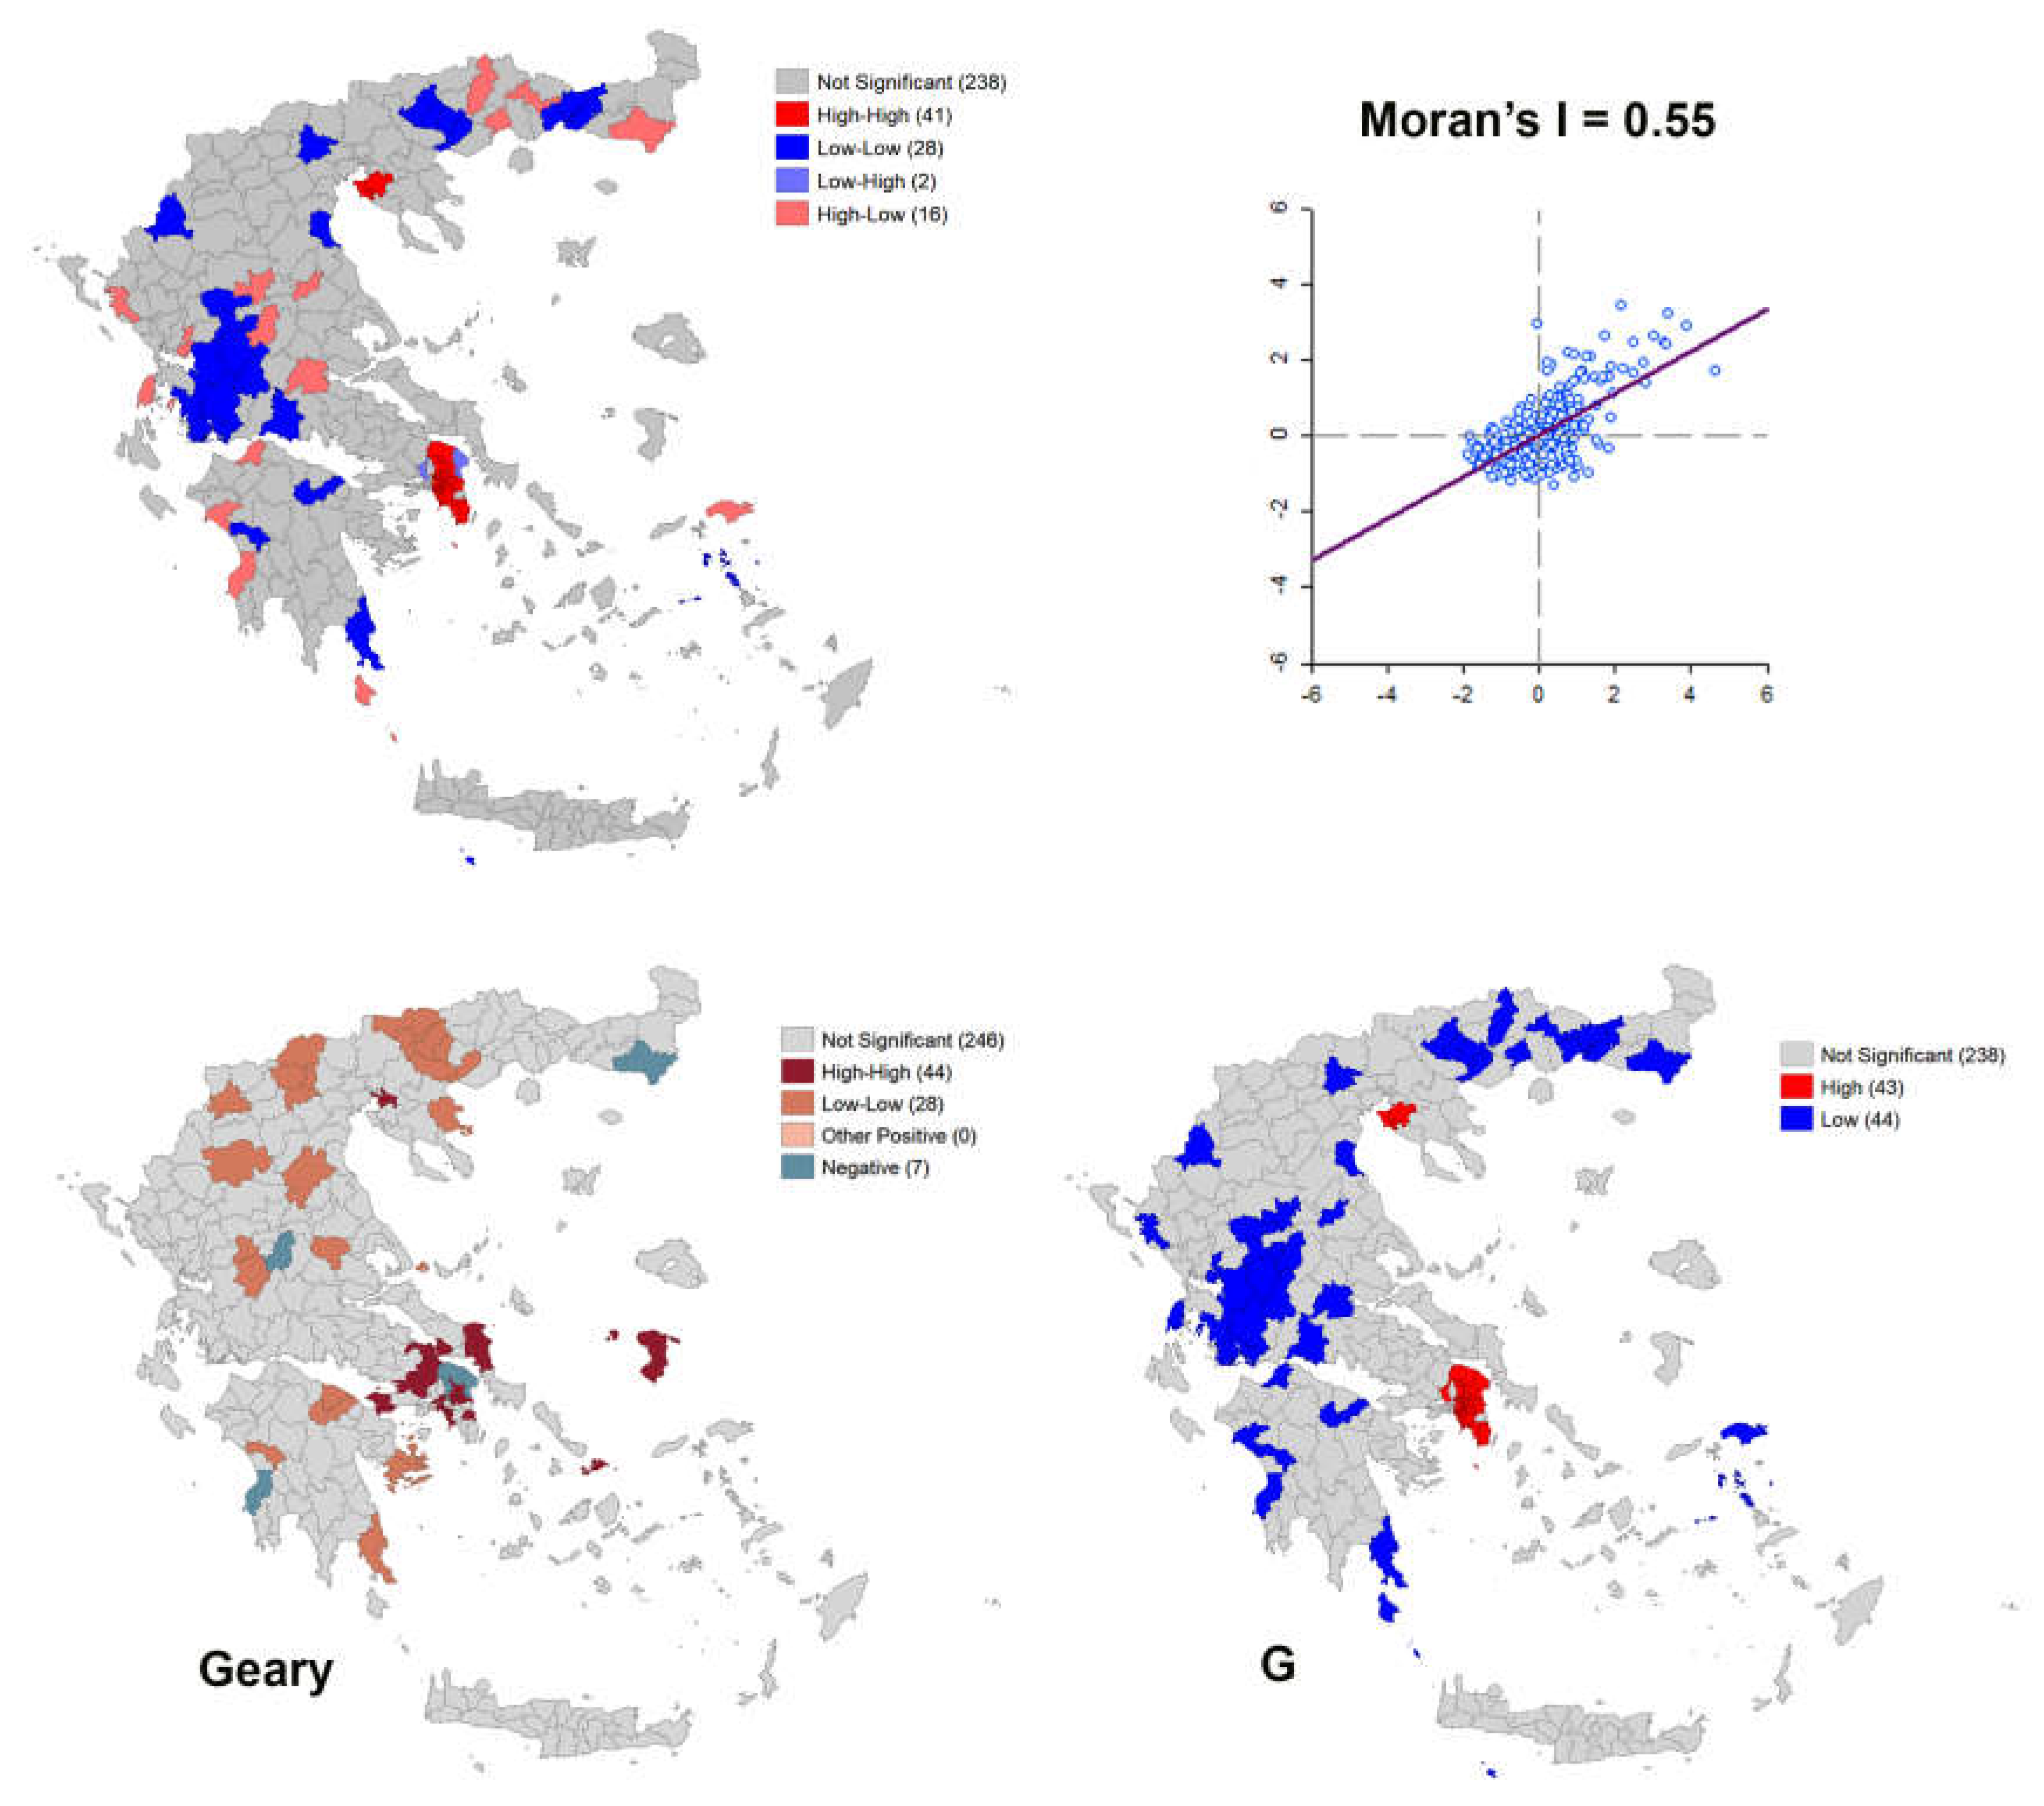
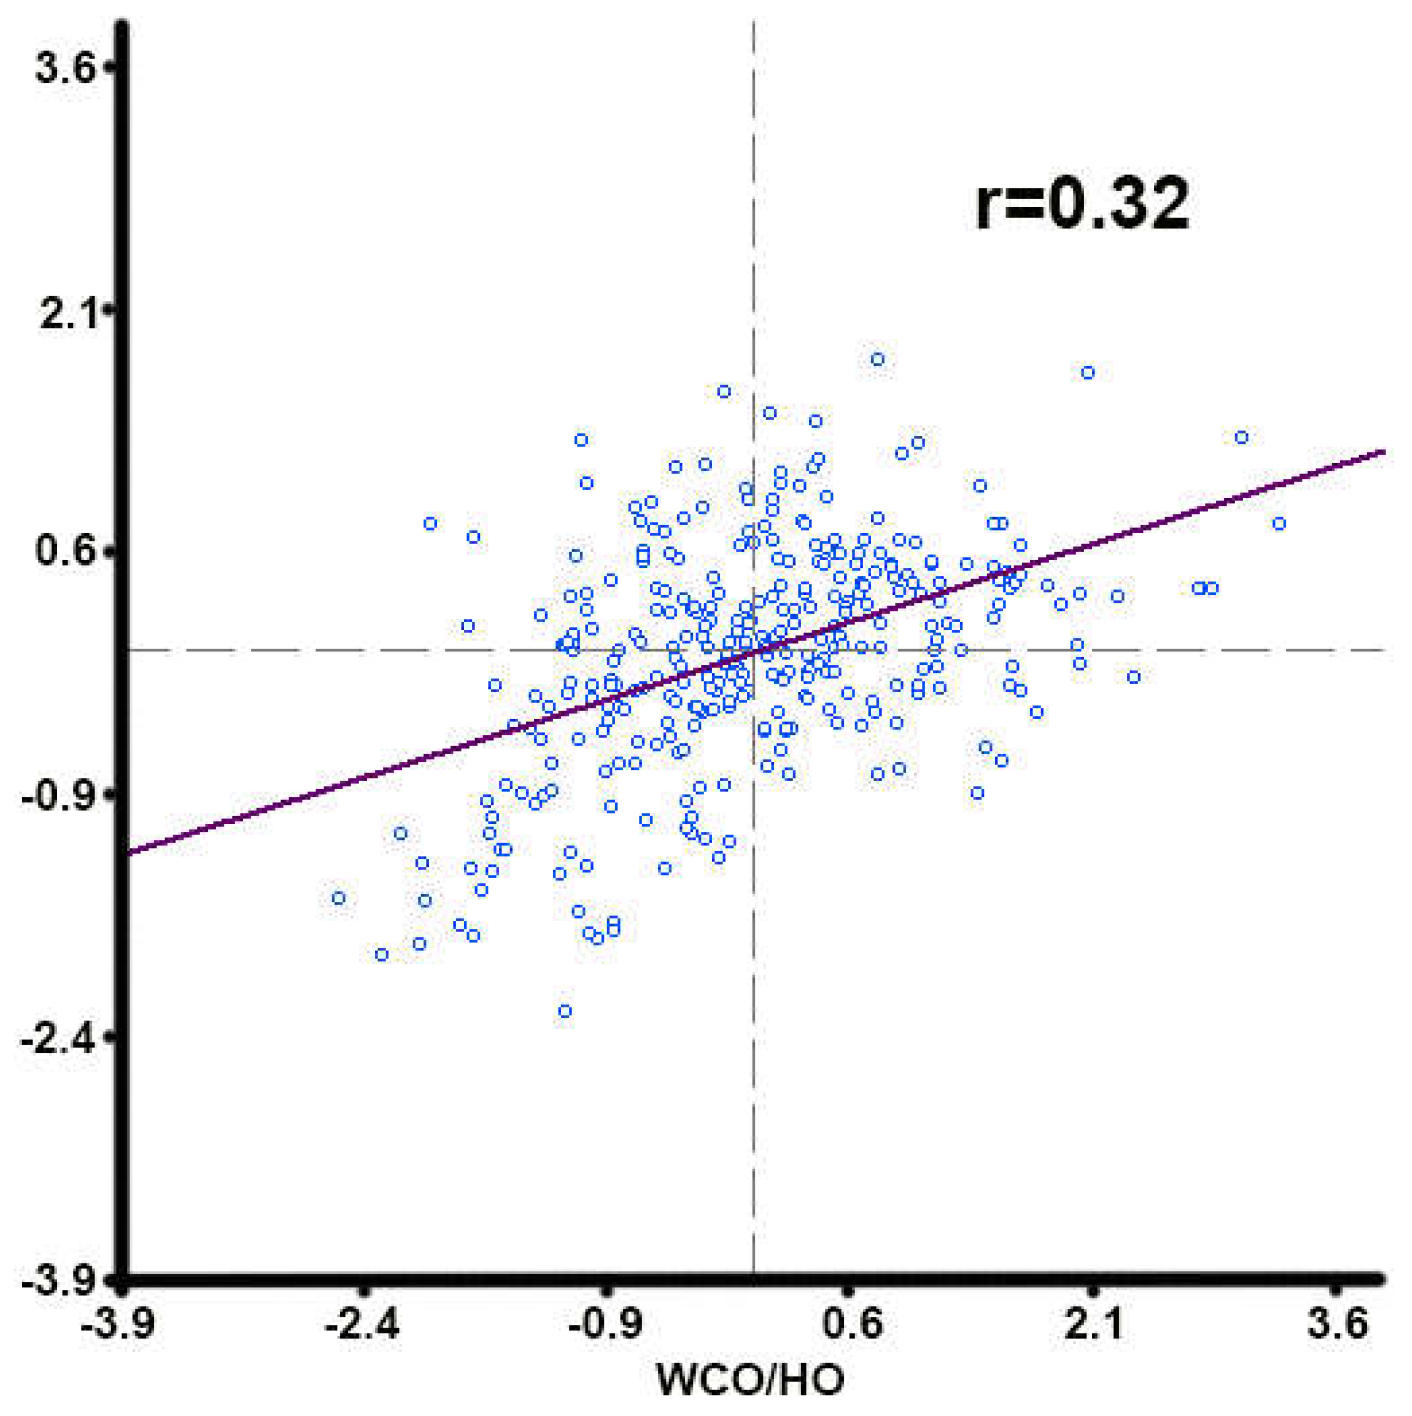
3. Spatial Analysis: Waste Cooking Oils (WCOs) and Household Oils (HOs)
4. Spatial Analysis of Lignocellulosic Biomass (Agricultural/Forest Residues)
5. Discussion, Challenges and Limitations
- 1.
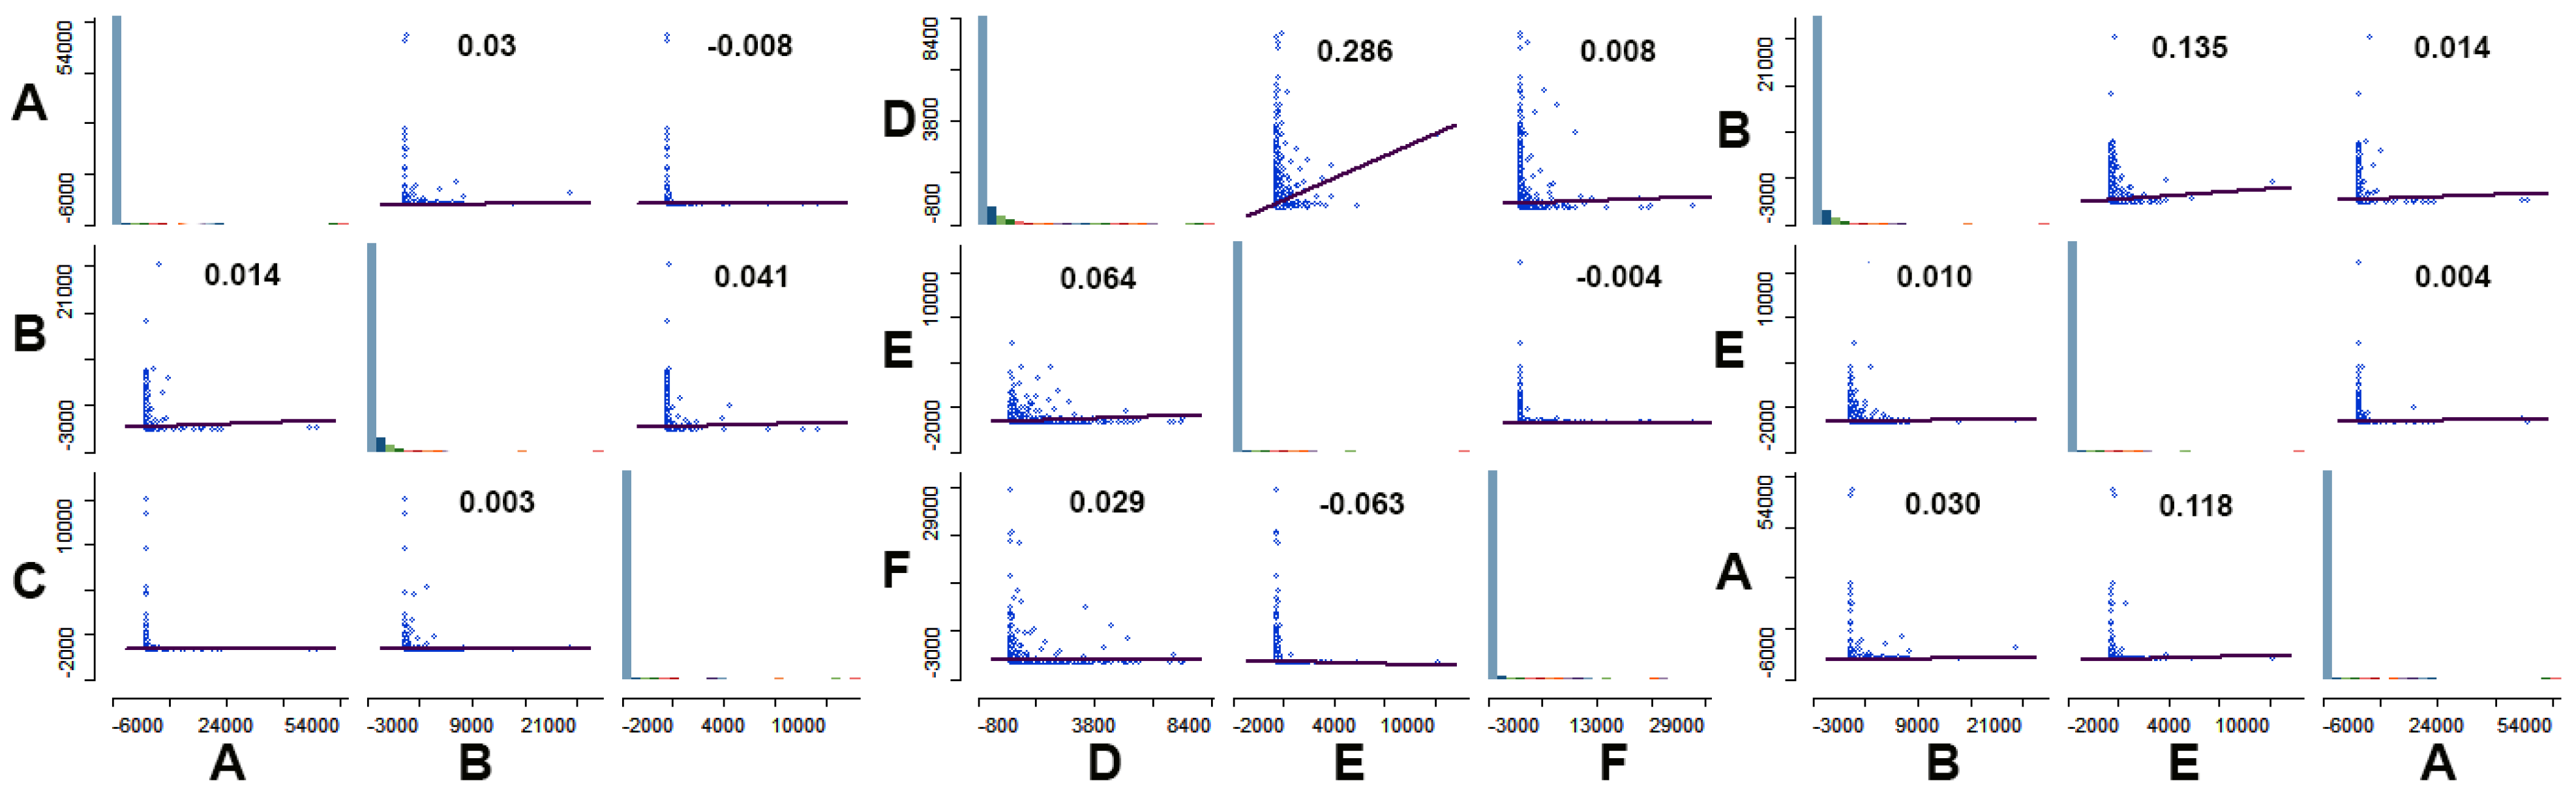
- Since residual raw materials have to be collected at hundreds of thousands of points throughout the country, developing and optimizing one or more of the utilization processes is not the only problem. Equally important is the development and optimization of a collection process. The findings of this study aim to contribute to this objective. It has become clear that the method of spatial correlation can provide a satisfactory picture concerning the high and low concentrations of a quantity as well as the correlation between multiple quantities.
- 2.
- Focusing on WCOs, it was shown that their quantities represent a very important, partially untapped, source of residual raw materials that can be used to produce green diesel in the context of the circular economy. Although the dispersion of frying oils is wide, there is no doubt that their concentration in large cities and tourist areas is higher. This finding suggests a collection process that should be carried out mainly in these areas. Concerning the utilization of residual oils in these areas, the development of small autonomous collection units in each neighborhood and central processing plants in small regional units seems to be reliable. In the first instance, in these areas it will obviously be necessary to carry out a pilot installation of a collection and processing device. This device would receive residual oil in liquid form from households and enterprises. The oils would be then collected in a small settling tank at central treatment plants, heated, stirred and separated from any impurities. The oil would then be fed to a flow reactor, from which the green diesel would be collected and stored. The necessary hydrogen for the process could be obtained through renewable sources (electricity from wind turbines and photovoltaics and the production of hydrogen by electrolysis of water, which is, of course, a much more expensive solution). Thus, the process would be completely green.
- 3.
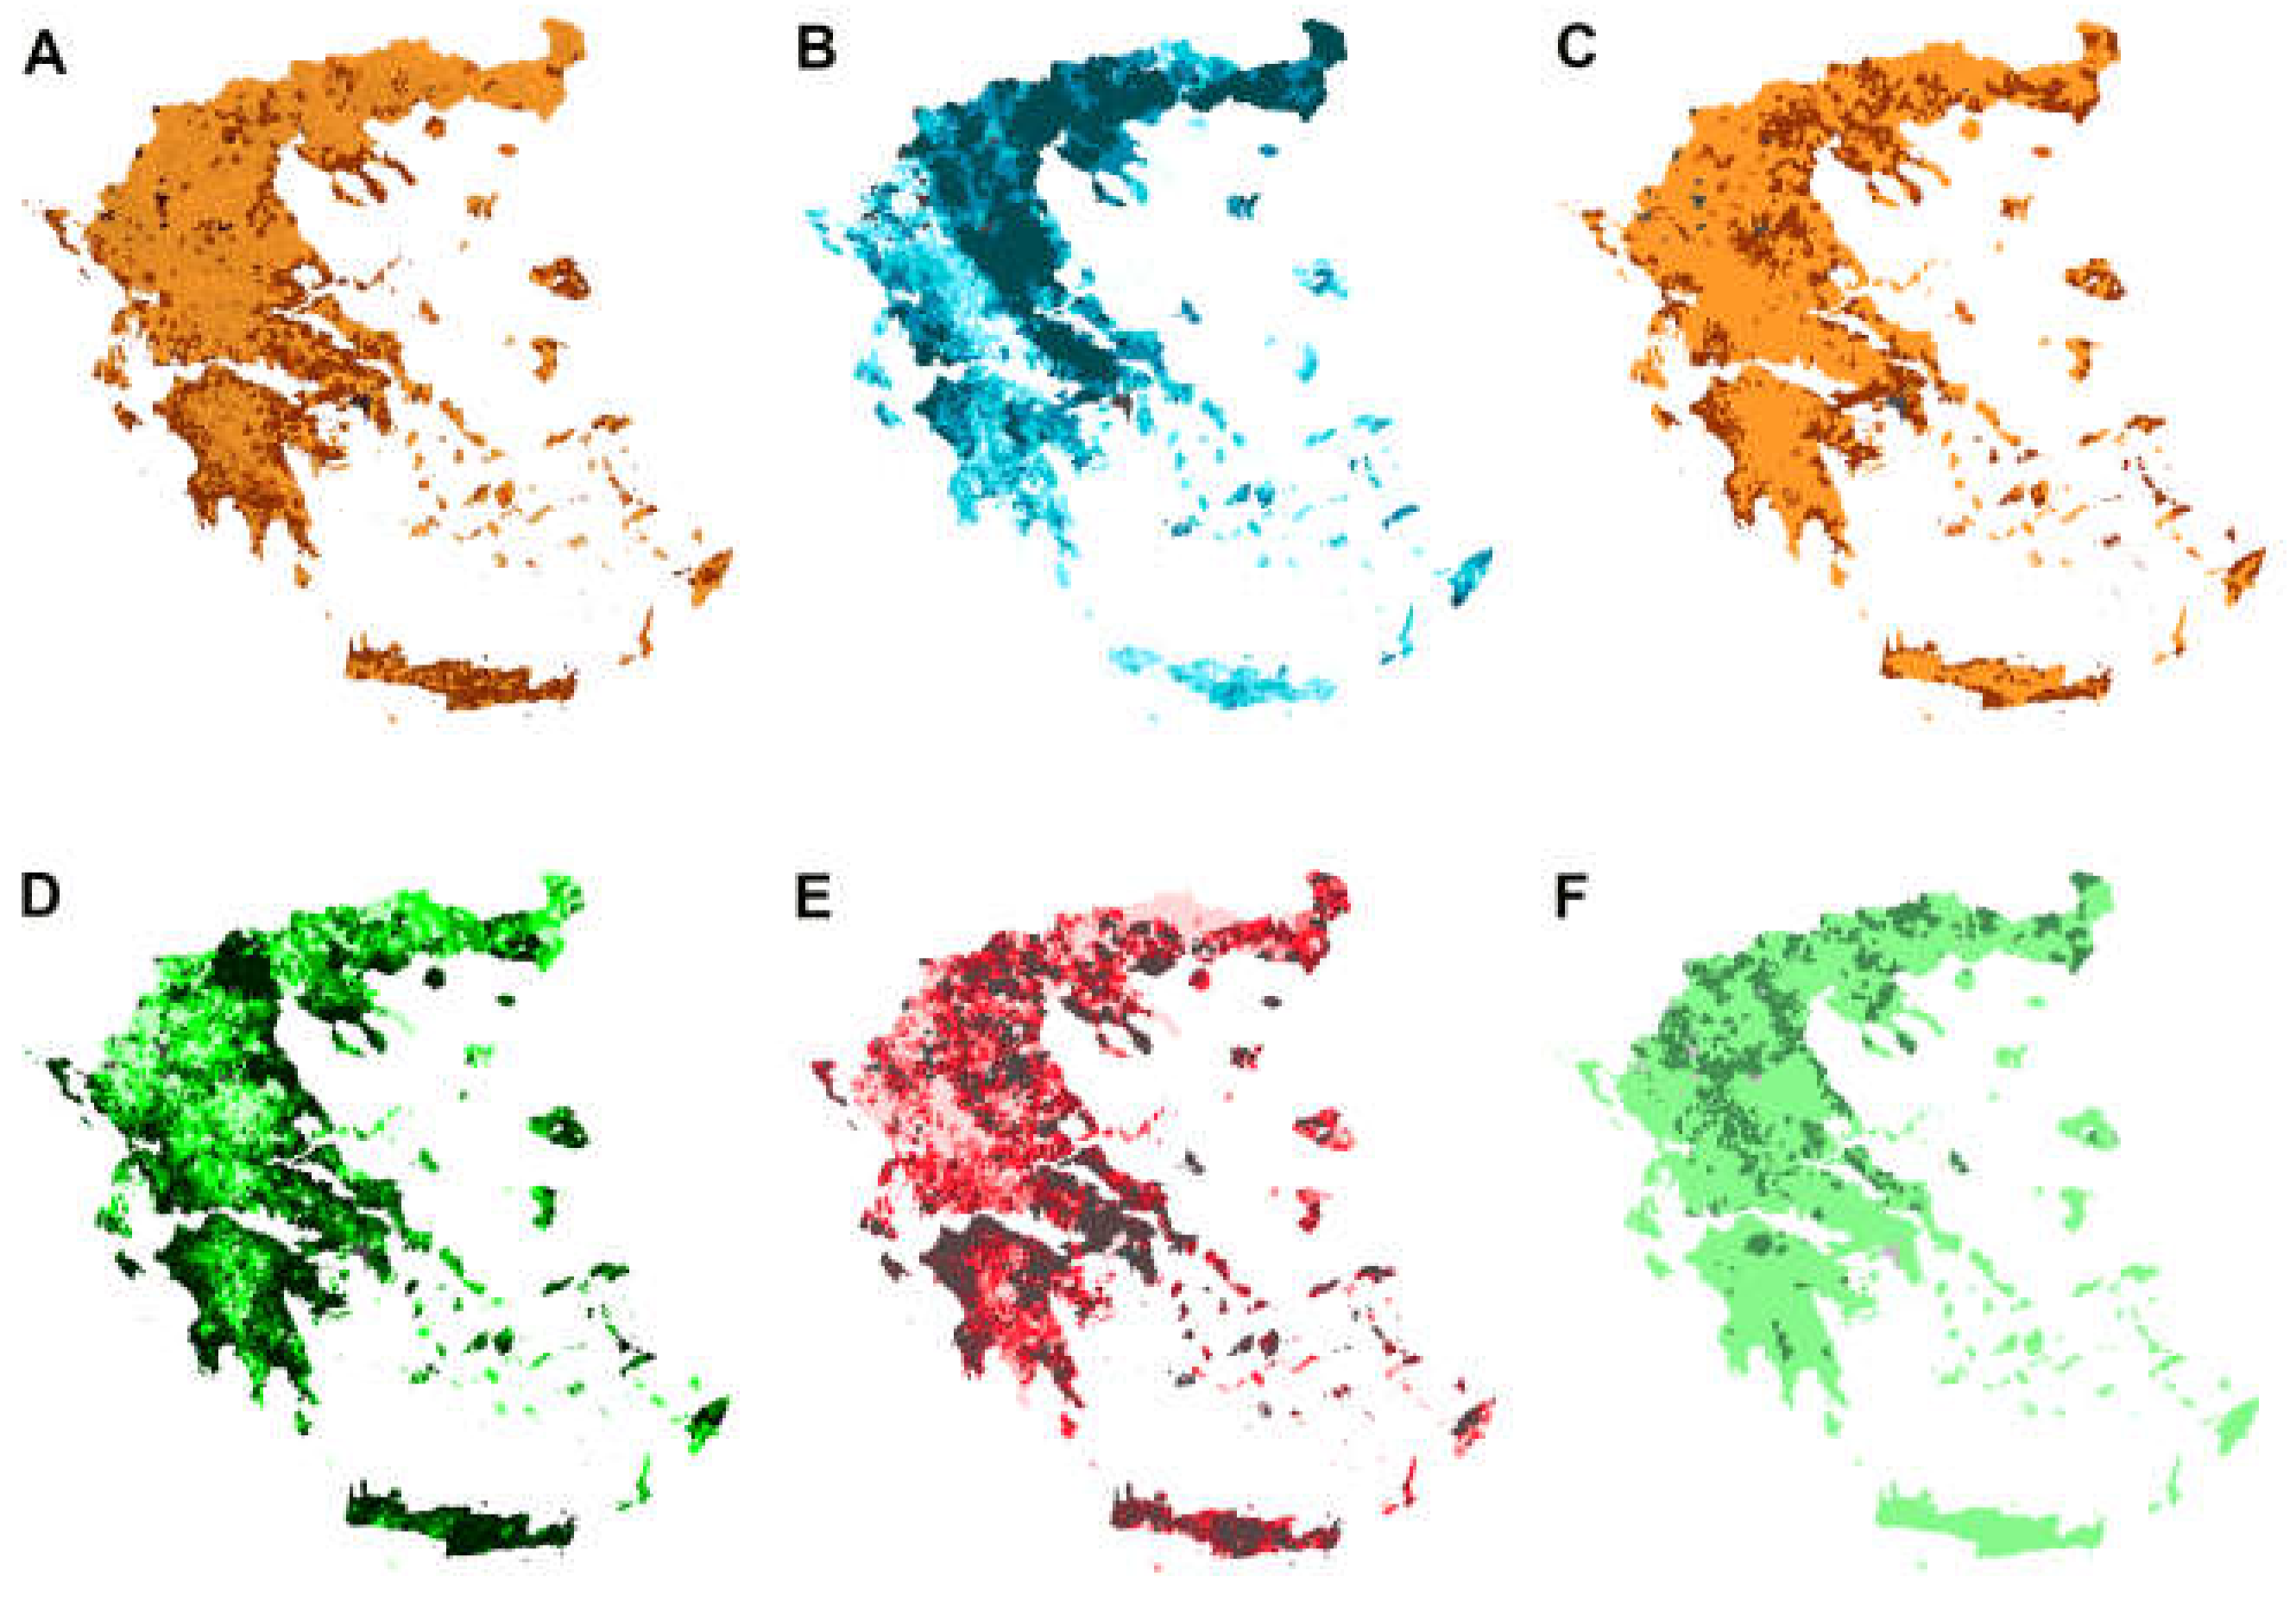
- The investigation of the geographical–spatial distribution of residual lignocellulosic biomass showed the geographical fragmentation and heterogeneity of the distributions. The quantities recorded are significant but widely dispersed, such that the cost of collecting and transporting the biomass to central processing plants could be prohibitive. The “geography” of the problem itself indicates solutions of small mobile collection units in every part of the country. In this context, the lignocellulosic biomass would be collected and converted in situ into bio-oil by rapid pyrolysis carried out in a tanker vehicle. This would transport the produced bio-oil to the nearest oil refineries for the conversion of the bio-oil into biofuels through deoxygenation processes.
- 4.
- The methodology used in this study was applied for the first time to analyze this problem. Despite its originality, it involves several limitations and challenges. One of these is that spatial analysis carries significant constraints when geographical units have unique characteristics. For example, the presence of numerous islands in the Greek case leads to distorted estimates of indicators such as Moran’s I and others in these regions. Additionally, while the methodology provides a general overview of the problem, it cannot accurately determine a future collection and transportation chain, as other methodologies can. These limitations present challenges for the methodology, which will be the subject of future research.
Funding
Institutional Review Board Statement
Informed Consent Statement
Data Availability Statement
Conflicts of Interest
References
- Lycourghiotis, S.; Kordouli, E.; Sygellou, L.; Bourikas, K.; Kordulis, C. Nickel catalysts supported on palygorskite for transformation of waste cooking oils into green diesel. Appl. Catal. B Environ. 2019, 259, 118059. [Google Scholar] [CrossRef]
- Makarouni, D.; Lycourghiotis, S.; Kordouli, E.; Bourikas, K.; Kordulis, C.; Dourtoglou, V. Transformation of limonene into p-cymene over acid activated natural mordenite utilizing atmospheric oxygen as a green oxidant: A novel mechanism. Appl. Catal. B Environ. 2018, 224, 740–750. [Google Scholar] [CrossRef]
- Lycourghiotis, S.; Kordouli, E.; Kordulis, C.; Bourikas, K. Transformation of residual fatty raw materials into third generation green diesel over a nickel catalyst supported on mineral palygorskite. Renew. Energy 2021, 180, 773–786. [Google Scholar] [CrossRef]
- Fani, K.; Lycourghiotis, S.; Bourikas, K.; Kordouli, E. Biodiesel upgrading to renewable diesel over nickel supported on natural mordenite catalysts. Ind. Eng. Chem. Res. 2021, 60, 18695–18706. [Google Scholar] [CrossRef]
- Lycourghiotis, S.; Kordouli, E.; Bourikas, K.; Kordulis, C.; Lycourghiotis, A. The role of promoters in metallic nickel catalysts used for green diesel production: A critical review. Fuel Process. Technol. 2023, 244, 107690. [Google Scholar] [CrossRef]
- Fani, K.; Lycourghiotis, S.; Bourikas, K.; Kordouli, E. Influence of Natural Mordenite Activation Mode on Its Efficiency as Support of Nickel Catalysts for Biodiesel Upgrading to Renewable Diesel. Nanomaterials 2023, 13, 1603. [Google Scholar] [CrossRef]
- Lycourghiotis, S. Trends in renewable energy: An overview. Glob. Nest J. 2022, 24, 505–525. [Google Scholar]
- Crawford, E.P.; Lycourghiotis, S. Increasing the public space ratio (PSR) using GIS. In Proceedings of the 2022 13th International Conference on Information, Intelligence, Systems & Applications (IISA), Corfu, Greece, 18–20 July 2022; pp. 1–5. [Google Scholar]
- Lycourghiotis, S.; Crawford, E.P. Kryteria projektowania sieci dróg rowerowych z wykorzystaniem GIS, niwelacji topograficznej i analizy przestrzennej. Inżynieria Miner. 2024, 1, 247–253. [Google Scholar] [CrossRef]
- Lycourghiotis, S.; Mpelogianni, V.; Groumpos, P.P. Smart cities and intelligent transportation in traditional cities. Ten design principles and one case study. In Proceedings of the 2021 12th International Conference on Information, Intelligence, Systems & Applications (IISA), Chania Crete, Greece, 12–14 July 2021; pp. 1–7. [Google Scholar]
- Bailey, T.C.; Gatrell, A.C. Interactive Spatial Data Analysis; Addison-Wesley Longman: Essex, UK, 1995. [Google Scholar]
- Fischer, M.M.; Wang, J. Spatial Data Analysis: Models, Methods and Techniques; Springer: Berlin/Heidelberg, Germany, 2011. [Google Scholar]
- Miller, H.J. Tobler’s first law and spatial analysis. Ann. Assoc. Am. Geogr. 2004, 94, 284–289. [Google Scholar] [CrossRef]
- Tobler, W.R. A computer movie simulating urban growth in the Detroit region. Econ. Geogr. 1970, 46, 234–240. [Google Scholar] [CrossRef]
- Unwin, D.J. GIS, spatial analysis and spatial statistics. Prog. Hum. Geogr. 1996, 20, 540–551. [Google Scholar] [CrossRef]
- Mondal, A.; Giri, B.K.; Roy, S.K. An integrated sustainable bio-fuel and bio-energy supply chain: A novel approach based on DEMATEL and fuzzy-random robust flexible programming with Me measure. Appl. Energy 2023, 343, 121225. [Google Scholar] [CrossRef]
- Kim, J.; Realff, M.J.; Lee, J.H. Optimal design and global sensitivity analysis of biomass supply chain networks for biofuels under uncertainty. Comput. Chem. Eng. 2011, 35, 1738–1751. [Google Scholar] [CrossRef]
- Huang, Y.; Chen, C.W.; Fan, Y. Multistage optimization of the supply chains of biofuels. Transp. Res. Part E Logist. Transp. Rev. 2010, 46, 820–830. [Google Scholar] [CrossRef]
- Ahmed, W.; Moazzam, M.; Sarkar, B.; Rehman, S.U. Synergic effect of reworking for imperfect quality items with the integration of multi-period delay-in-payment and partial backordering in global supply chains. Engineering 2021, 7, 260–271. [Google Scholar] [CrossRef]
- Babazadeh, R. Optimal design and planning of biodiesel supply chain considering non-edible feedstock. Renew. Sustain. Energy Rev. 2017, 75, 1089–1100. [Google Scholar] [CrossRef]
- Habib, M.S.; Tayyab, M.; Zahoor, S.; Sarkar, B. Management of animal fat-based biodiesel supply chain under the paradigm of sustainability. Energy Convers. Manag. 2020, 225, 113345. [Google Scholar] [CrossRef]
- Kanan, M.; Habib, M.S.; Habib, T.; Zahoor, S.; Gulzar, A.; Raza, H.; Abusaq, Z. A flexible robust possibilistic programming approach for sustainable second-generation biogas supply chain design under multiple uncertainties. Sustainability 2022, 14, 11597. [Google Scholar] [CrossRef]
- Kanan, M.; Habib, M.S.; Shahbaz, A.; Hussain, A.; Habib, T.; Raza, H.; Assaf, R. A grey-fuzzy programming approach towards socio-economic optimization of second-generation biodiesel supply chains. Sustainability 2022, 14, 10169. [Google Scholar] [CrossRef]
- Ghelichi, Z.; Saidi-Mehrabad, M.; Pishvaee, M.S. A stochastic programming approach toward optimal design and planning of an integrated green biodiesel supply chain network under uncertainty: A case study. Energy 2018, 156, 661–687. [Google Scholar] [CrossRef]
- Mirhashemi, M.S.; Mohseni, S.; Hasanzadeh, M.; Pishvaee, M.S. Moringa oleifera biomass-to-biodiesel supply chain design: An opportunity to combat desertification in Iran. J. Clean. Prod. 2018, 203, 313–327. [Google Scholar] [CrossRef]
- Akgul, O.; Shah, N.; Papageorgiou, L.G. An optimisation framework for a hybrid first/second generation bioethanol supply chain. Comput. Chem. Eng. 2012, 42, 101–114. [Google Scholar] [CrossRef]
- Ghaderi, H.; Moini, A.; Pishvaee, M.S. A multi-objective robust possibilistic programming approach to sustainable switchgrass-based bioethanol supply chain network design. J. Clean. Prod. 2018, 179, 368–406. [Google Scholar] [CrossRef]
- Hamelin, L.; Borzęcka, M.; Kozak, M.; Pudełko, R. A spatial approach to bioeconomy: Quantifying the residual biomass potential in the EU-27. Renew. Sustain. Energy Rev. 2019, 100, 127–142. [Google Scholar] [CrossRef]
- ELSTAT. Greece in Numbers; ELSTAT: Athens, Greece, 2019. [Google Scholar]
- Kiritsakis, A.; Markakis, P. Olive oil: A review. In Advances in Food Research; Academic Press: Cambridge, MA, USA, 1988; Volume 31, pp. 453–482. [Google Scholar]
- Kiritsakis, A.K. Flavor components of olive oil—A review. J. Am. Oil Chem. Soc. 1998, 75, 673–681. [Google Scholar] [CrossRef]
- Kiritsakis, A.K. All the Secrets of Olive Oil; Agrotypos: Athens, Greece, 2000. [Google Scholar]
- Available online: http://geodata.gov.gr/dataset/dunamiko-biomazas-apo-sterea-upoleimmata (accessed on 12 February 2024).


| Ref. Nom | Author | Biomass | Application Area | Method/Analysis | Goal of the Study |
|---|---|---|---|---|---|
| [16] | Mondal et al. (2023) | Bio-ethanol | West Bengal, India | Fuzzy Decision Making Trial/Evaluation Laboratory (DEMATEL) | Supply chain optimization |
| [17] | Kim et al. (2011) | Logging residual, grasses | U.S. southeastern region | Monte Carlo simulation | Optimal design of biomass supply chain networks under uncertainty |
| [18] | Huang et al. (2010) | Cotton, rice, corn stover, wheat straw | California, USA | Deterministic flexible programming/spatial analysis | Minimizing the cost of the entire supply chain |
| [19] | Habib (2022) et al. (2022) | Animal fat | Pakistan | AF-BSCND optimization model/RPFP solution | Reducing supply chain costs and risks |
| [20] | Babazadeh (2017) | WCOs, Jatropha seeds | Iran | Deterministic programming | Biofuel supply chain optimization |
| [21] | Habib et al. (2020) | Animal fats | Pakistan | Robust possibilistic chance-constrained programming | Minimization of environmental impact and SC cost |
| [22] | Kanan et al. (2022a) | Animal manure, municipal waste | Punjab, Pakistan | Flexible and possibilistic programming | Decision improvement of the BG-SCND model |
| [23] | Kanan et al. (2022b) | Domestic wastes | Pakistan | Grey-fuzzy programming | Investment to achieve social well-being goals |
| [24] | Ghelichi et al. (2018) | Jatropha Curcas | Iran | Stochastic programming | Supply chain optimization |
| [25] | Mirhashemi et al. (2018) | Moringa oleifera | Iran | Linear programming/CWDEA model | Νew source supply chain design |
| [26] | Akgul et al. (2012) | First-/second-generation biofuels | UK | ε-Constraint method/multi-period model | multi-objective model: impact of carbon tax, economic and environmental performance; trade-off between economic and environmental objectives, etc. |
| [27] | Ghaderi et al. (2018) | Switchgrass | Iran | Possibilistic programming | Economic, environmental and social objectives |
| — | lycourghiotis | WCO and HO, etc. | Greece | G.I.S. and spatial analysis | Optimal spatial solution model: local, regional or national |
| Sources of Biomass | Point Sources | Arable Crops | Greenhouse Crops | Tree Crops | Vineyards | Forests | Sum |
|---|---|---|---|---|---|---|---|
| ×1000 Τ | 459.55 | 1854.17 | 94.45 | 1090.48 | 231.50 | 821.12 | 4551.27 |
| ×1000 ΜJ | 7247.71 | 33,065.18 | 906.69 | 18,932.61 | 4386.84 | 15,994.40 | 80,533.44 |
| % (Tones) | 10.10 | 40.74 | 2.08 | 23.96 | 5.09 | 18.04 | |
| % (MJ) | 9.00 | 41.06 | 1.13 | 23.51 | 5.45 | 19.86 |
Disclaimer/Publisher’s Note: The statements, opinions and data contained in all publications are solely those of the individual author(s) and contributor(s) and not of MDPI and/or the editor(s). MDPI and/or the editor(s) disclaim responsibility for any injury to people or property resulting from any ideas, methods, instructions or products referred to in the content. |
© 2025 by the author. Licensee MDPI, Basel, Switzerland. This article is an open access article distributed under the terms and conditions of the Creative Commons Attribution (CC BY) license (https://creativecommons.org/licenses/by/4.0/).
Share and Cite
Lycourghiotis, S. GIS and Spatial Analysis in the Utilization of Residual Biomass for Biofuel Production. J 2025, 8, 17. https://doi.org/10.3390/j8020017
Lycourghiotis S. GIS and Spatial Analysis in the Utilization of Residual Biomass for Biofuel Production. J. 2025; 8(2):17. https://doi.org/10.3390/j8020017
Chicago/Turabian StyleLycourghiotis, Sotiris. 2025. "GIS and Spatial Analysis in the Utilization of Residual Biomass for Biofuel Production" J 8, no. 2: 17. https://doi.org/10.3390/j8020017
APA StyleLycourghiotis, S. (2025). GIS and Spatial Analysis in the Utilization of Residual Biomass for Biofuel Production. J, 8(2), 17. https://doi.org/10.3390/j8020017