
A Comparative Analysis of Air Quality and Respiratory Health in Under-Five Children from Crude Oil-Impacted Communities


Abstract
1. Introduction
2. Materials and Methods
2.1. Study Area
2.2. Study Design and Sample Size Estimation
2.3. Data Analysis
2.4. Ethical Approval
3. Results
Socio-Demographic Characteristics
4. Discussion
5. Conclusions
Author Contributions
Funding
Institutional Review Board Statement
Informed Consent Statement
Data Availability Statement
Acknowledgments
Conflicts of Interest
Glossary
| NOSDRA | National Oil Spill Detection and Response Agency |
| AAQ | Ambient air quality |
| VOC | Volatile organic compounds |
| PM | Particulate matter |
| WHO | World Health Organization |
| ISIAQ | International Society of Indoor Air Quality and Climate |
| AAP | Ambient air pollution |
| UNICEF | United Nations Children Fund |
| COPD | Chronic obstructive pulmonary disease |
| ANOVA | Analysis of variance |
| TVOC | Total volatile organic compounds |
| CO | Carbon monoxide |
| NO | Nitrogen oxide |
| NOx | Nitrogen oxides |
| CO2 | Carbon iv oxide |
| LCS | Low-cost sensor system |
| ROS | Reactive oxygen species |
| PAHs | Polycyclic aromatic hydrocarbons |
References
- Molaei, I.; Khezri, S.M.; Sekhavatjou, M.S.; Karbassi, A.; Hosseni Alhashemi, A. Health risk assessment of heavy metals, BTEX and polycyclic aromatic hydrocarbons (PAHs) in the workplace in a secondary oil re-refining factory. J. Adv. Environ. Health Res. 2020, 8, 79–94. [Google Scholar]
- Chika, C.; Ndidi, A.F. Illegal Oil Bunkering Sabotage and Vandalism in Niger Delta Area of Nigeria. Acad. J. Curr. Res. 2022, 9, 90–99. [Google Scholar]
- Abereton, P.; Ordinioha, B.; Mensah-Attipoe, J.; Toyinbo, O. Crude oil spills and respiratory health of clean-up workers: A systematic review of literature. Atmosphere 2023, 14, 494. [Google Scholar] [CrossRef]
- Ndimele, P.E. The Political Ecology of Oil and Gas Activities in the Nigerian Aquatic Ecosystem; Academic Press: New York, NY, USA, 2017. [Google Scholar]
- Nwozor, A. Depoliticizing environmental degradation: Revisiting the UNEP environmental assessment of Ogoniland in Nigeria’s Niger Delta region. GeoJournal 2020, 85, 883–900. [Google Scholar] [CrossRef]
- Francis, P.; LaPin, D.A.; Rossiasco, P. Securing Development and Peace in the Niger Delta: A Social Conflict Analysis for Change; Woodrow Wilson International Center for Scholars: Washington, DC, USA, 2011. [Google Scholar]
- Edo, Z.; Clark, E.; Etemike, L. Environmental laws and the politics of environmental enforcement in Nigeria’s oil-rich Niger Delta region. Innovations 2023, 72, 258–272. [Google Scholar]
- Ike, P.; Emaziye, P. An assessment of the trend and projected future values of climatic variables in Niger Delta Region, Nigeria. Asian J. Agric. Sci. 2012, 4, 165–170. [Google Scholar]
- Huynh, B.Q.; Kwong, L.H.; Kiang, M.V.; Chin, E.T.; Mohareb, A.M.; Jumaan, A.O.; Basu, S.; Geldsetzer, P.; Karaki, F.M.; Rehkopf, D.H. Public health impacts of an imminent Red Sea oil spill. Nat. Sustain. 2021, 4, 1084–1091. [Google Scholar] [CrossRef] [PubMed]
- Abereton, P.; Ordinioha, B.; Mensah-Attipoe, J.; Toyinbo, O. A qualitative study on the morbidity experiences of under-five children in oil spill communities. Health Environ. 2023, 4, 198–208. [Google Scholar] [CrossRef]
- Anyanwu, C. A Geospatial Analysis of the Health Impacts of Oil Spills in the Niger Delta Region of Nigeria. Master’s Thesis, Ohio University, Athens, OH, USA, 2019. [Google Scholar]
- Dewulf, J.; Van Langenhove, H.; Wittmann, G. Analysis of volatile organic compounds using gas chromatography. TrAC Trends Anal. Chem. 2002, 21, 637–646. [Google Scholar] [CrossRef]
- Giechaskiel, B.; Clairotte, M. Fourier transform infrared (FTIR) spectroscopy for measurements of vehicle exhaust emissions: A review. Appl. Sci. 2021, 11, 7416. [Google Scholar] [CrossRef]
- Méndez, M.; Merayo, M.G.; Núñez, M. Machine learning algorithms to forecast air quality: A survey. Artif. Intell. Rev. 2023, 56, 10031–10066. [Google Scholar] [CrossRef] [PubMed]
- Gupta, N.S.; Mohta, Y.; Heda, K.; Armaan, R.; Valarmathi, B.; Arulkumaran, G. Prediction of air quality index using machine learning techniques: A comparative analysis. J. Environ. Public Health 2023, 2023, 4916267. [Google Scholar] [CrossRef]
- Li, D.; Zhou, H.; Ren, Z.; Lee, C. Advances in MEMS, Optical MEMS, and Nanophotonics Technologies for Volatile Organic Compound Detection and Applications. Small Sci. 2024, 5, 2400250. [Google Scholar] [CrossRef]
- Janaki, K.; Eapen, M.; Meera, M.M.; Bhendale, M.A.; Arun, S.; Krishnamoorthy, R. Enhancing Environmental Safety: Design and Development of IoT based Air Quality Monitoring System. In Proceedings of the 2024 5th International Conference on Image Processing and Capsule Networks (ICIPCN), Dhulikhel, Nepal, 3–4 July 2024; pp. 845–850. [Google Scholar]
- Stratoulias, D.; Nuthammachot, N.; Dejchanchaiwong, R.; Tekasakul, P.; Carmichael, G.R. Recent Developments in Satellite Remote Sensing for Air Pollution Surveillance in Support of Sustainable Development Goals. Remote Sens. 2024, 16, 2932. [Google Scholar] [CrossRef]
- Tariq, H.; Touati, F.; Crescini, D.; Ben Mnaouer, A. State-of-the-Art Low-Cost Air Quality Sensors, Assemblies, Calibration and Evaluation for Respiration-Associated Diseases: A Systematic Review. Atmosphere 2024, 15, 471. [Google Scholar] [CrossRef]
- World Health Organization. Improving the Capacity of Countries to Report on Air Quality in Cities: Users’ Guide to the Repository of United Nations Tools; World Health Organization: Geneva, Switzerland, 2023. [Google Scholar]
- Awos, A.; Thompson, S.; Adedeji, O.; Zvomuya, F.; Zhang, Q. Monitoring of Air Quality for Particulate Matter (PM2. 5, PM10) and Heavy Metals Proximate to a Cement Factory in Ewekoro, Nigeria. J. Geosci. Environ. Prot. 2024, 12, 152–180. [Google Scholar]
- UNICEF; Rees, N. Clear the Air for Children: The Impact of Air Pollution on Children; UNICEF: New York, NY, USA, 2016. [Google Scholar]
- Schraufnagel, D.E.; Balmes, J.R.; Cowl, C.T.; De Matteis, S.; Jung, S.-H.; Mortimer, K.; Perez-Padilla, R.; Rice, M.B.; Riojas-Rodriguez, H.; Sood, A.; et al. Air pollution and noncommunicable diseases: A review by the Forum of International Respiratory Societies’ Environmental Committee, Part 2: Air pollution and organ systems. Chest 2019, 155, 417–426. [Google Scholar] [CrossRef]
- Schwela, D.H.; Haq, G. Strengths and weaknesses of the WHO global ambient air quality database. Aerosol Air Qual. Res. 2020, 20, 1026–1037. [Google Scholar] [CrossRef]
- Bartington, S.; Avis, W. Prevalence of Health Impacts Related to Exposure to Poor Air Quality Among Children in Low and Lower Middle-Income Countries; Government Social Development Resource: Birmingham, UK, 2020. [Google Scholar]
- Ede, P.N.; Edokpa, D.O. Regional air quality of the Nigeria’s Niger Delta. Open J. Air Pollut. 2015, 4, 7–15. [Google Scholar] [CrossRef]
- D’amato, G.; Liccardi, G.; D’amato, M.; Holgate, S. Environmental risk factors and allergic bronchial asthma. Clin. Exp. Allergy 2005, 35, 1113–1124. [Google Scholar] [CrossRef]
- Chen, R.; Hu, B.; Liu, Y.; Xu, J.; Yang, G.; Xu, D.; Chen, C. Beyond PM2.5: The role of ultrafine particles on adverse health effects of air pollution. Biochim. Biophys. Acta (BBA)-Gen. Subj. 2016, 1860, 2844–2855. [Google Scholar] [CrossRef]
- Ephraim-Emmanuel, B.C.; Ordinioha, B. Exposure and public health effects of polycyclic aromatic hydrocarbon compounds in sub-saharan africa: A systematic review. Int. J. Toxicol. 2021, 40, 250–269. [Google Scholar] [CrossRef] [PubMed]
- Arbex, M.A.; Santos, U.d.P.; Martins, L.C.; Saldiva, P.H.N.; Pereira, L.A.A.; Braga, A.L.F. Air pollution and the respiratory system. J. Bras. Pneumol. 2012, 38, 643–655. [Google Scholar] [CrossRef]
- Sharma, S.B.; Jain, S.; Khirwadkar, P.; Kulkarni, S. The effects of air pollution on the environment and human health. Indian J. Res. Pharm. Biotechnol. 2013, 1, 391–396. [Google Scholar]
- Zock, J.-P.; Rodríguez-Trigo, G.; Rodríguez-Rodríguez, E.; Espinosa, A.; Pozo-Rodríguez, F.; Gómez, F.; Fuster, C.; Castaño-Vinyals, G.; Antó, J.M.; Barberà, J.A. Persistent respiratory symptoms in clean-up workers 5 years after the Prestige oil spill. Occup. Environ. Med. 2012, 69, 508–513. [Google Scholar] [CrossRef] [PubMed]
- Ordinioha, B.; Sawyer, W. Acute health effects of a crude oil spill in a rural community in Bayelsa State, Nigeria. Niger. J. Med. 2010, 19, 140–144. [Google Scholar] [CrossRef] [PubMed]
- Ordinioha, B.; Brisibe, S. The human health implications of crude oil spills in the Niger delta, Nigeria: An interpretation of published studies. Niger. Med. J. 2013, 54, 10–16. [Google Scholar] [CrossRef]
- D’Andrea, M.A.; Reddy, G.K. Health risks associated with crude oil spill exposure. Am. J. Med. 2014, 127, 886.e9–886.e13. [Google Scholar] [CrossRef]
- Elenwo, E.; Akankali, J. The estimation of potential yield of water hyacinth: A tool for environmental management and an economic resource for the Niger Delta region. J. Sustain. Dev. Stud. 2016, 9, 115–137. [Google Scholar]
- Nriagu, J.; Udofia, E.A.; Ekong, I.; Ebuk, G. Health risks associated with oil pollution in the Niger Delta, Nigeria. Int. J. Environ. Res. Public Health 2016, 13, 346. [Google Scholar] [CrossRef]
- Whitley, E.; Ball, J. Statistics review 4: Sample size calculations. Crit. Care 2002, 6, 335–341. [Google Scholar] [CrossRef] [PubMed]
- Afshar-Mohajer, N.; Fox, M.A.; Koehler, K. The human health risk estimation of inhaled oil spill emissions with and without adding dispersant. Sci. Total Environ. 2019, 654, 924–932. [Google Scholar] [CrossRef]
- Avij, P. Laboratory Experimental Demonstration of the Effect of Oceanic Whitecaps in the Transport of Oil and Dispersant Components to the Atmosphere. Ph.D. Thesis, Louisiana State University and Agricultural & Mechanical College, Baton Rouge, LA, USA, 2015. [Google Scholar]
- Solomon, G.M.; Janssen, S. Health effects of the Gulf oil spill. Jama 2010, 304, 1118–1119. [Google Scholar] [CrossRef]
- Osaiyuwu, R.; Ugbebor, J. Air quality assessment of some oil facilities host communities in Rivers State. Niger. J. Technol. 2019, 38, 242–252. [Google Scholar] [CrossRef]
- Gupta, S.K.; Elumalai, S.P. Dependence of urban air pollutants on morning/evening peak hours and seasons. Arch. Environ. Contam. Toxicol. 2019, 76, 572–590. [Google Scholar] [CrossRef] [PubMed]
- Trinh, T.T.; Trinh, T.T.; Le, T.T.; Nguyen, T.D.H.; Tu, B.M. Temperature inversion and air pollution relationship, and its effects on human health in Hanoi City, Vietnam. Environ. Geochem. Health 2019, 41, 929–937. [Google Scholar] [CrossRef] [PubMed]
- Balogun, V.S.; Onokerhoraye, A.G. Climate change vulnerability mapping across ecological zones in Delta State, Niger Delta Region of Nigeria. Clim. Serv. 2022, 27, 100304. [Google Scholar] [CrossRef]
- Ologunorisa, T.E. An assessment of flood vulnerability zones in the Niger Delta, Nigeria. Int. J. Environ. Stud. 2004, 61, 31–38. [Google Scholar] [CrossRef]
- Jung, S.-C.; Kim, K.-M.; Lee, K.-S.; Roh, S.; Jeong, W.-C.; Kwak, S.-J.; Lee, I.-J.; Choi, Y.-H.; Noh, S.R.; Hur, J.-I.; et al. Respiratory effects of the Hebei Spirit oil spill on children in Taean, Korea. Allergy Asthma Immunol. Res. 2013, 5, 365–370. [Google Scholar] [CrossRef]
- Gwack, J.; Lee, J.H.; Kang, Y.A.; Chang, K.-J.; Lee, M.S.; Hong, J.Y. Acute health effects among military personnel participating in the cleanup of the Hebei spirit oil spill, 2007, in taean county, Korea. Osong Public Health Res. Perspect. 2012, 3, 206–212. [Google Scholar] [CrossRef]
- Bashir, M.T. Environmental, public health and socio-economic issues of oil spillage in Niger Delta, Nigeria. Int. J. Eng. Res. Technol. 2021, 10, 62–66. [Google Scholar]
- Gam, K.B.; Engel, L.S.; Kwok, R.K.; Curry, M.D.; Stewart, P.A.; Stenzel, M.R.; McGrath, J.A.; Jackson, W.B.; MY, L.; Sandler, D.P. Association between Deepwater Horizon oil spill response and cleanup work experiences and lung function. Environ. Int. 2018, 121, 695. [Google Scholar] [CrossRef]
- World Health Organization. Ambient Air Pollution: Training for Health Care Providers; World Health Organization: Geneva, Switzerland, 2019. [Google Scholar]
- Kousky, C. Impacts of natural disasters on children. Future Child. 2016, 20, 73–92. [Google Scholar] [CrossRef]
- Noh, S.R.; Kim, J.-A.; Cheong, H.-K.; Ha, M.; Jee, Y.-K.; Park, M.-S.; Choi, K.-H.; Kim, H.; Cho, S.-I.; Choi, K.; et al. Hebei Spirit oil spill and its long-term effect on children’s asthma symptoms. Environ. Pollut. 2019, 248, 286–294. [Google Scholar] [CrossRef]
- Yakubu, O.H. Particle (soot) pollution in Port Harcourt Rivers State, Nigeria—double air pollution burden? Understanding and tackling potential environmental public health impacts. Environments 2017, 5, 2. [Google Scholar] [CrossRef]
- Michel, S.; Busato, F.; Genuneit, J.; Pekkanen, J.; Dalphin, J.C.; Riedler, J.; Mazaleyrat, N.; Weber, J.; Karvonen, A.M.; Hirvonen, M.R. Farm exposure and time trends in early childhood may influence DNA methylation in genes related to asthma and allergy. Allergy 2013, 68, 355–364. [Google Scholar] [CrossRef] [PubMed]
- Osofsky, H.; Hansel, T.C.; Speier, A.; Osofsky, J.; Savage, N. Environmental concerns and quality of life following the Gulf oil spill: Factors contributing to behavioral health. In Proceedings of the SPE Health, Safety, Security, Environment, & Social Responsibility Conference-North America, New Orleans, LA, USA, 18 April 2017; p. D031S015R002. [Google Scholar]
- Zock, J.-P.; Rodríguez-Trigo, G.; Rodríguez-Rodríguez, E.; Souto-Alonso, A.; Espinosa, A.; Pozo-Rodríguez, F.; Gómez, F.P.; Fuster, C.; Castaño-Vinyals, G.; Antó, J.M.; et al. Evaluation of the persistence of functional and biological respiratory health effects in clean-up workers 6 years after the prestige oil spill. Environ. Int. 2014, 62, 72–77. [Google Scholar] [CrossRef]
- Hinde, S.; McKenna, C.; Whyte, S.; Peake, M.; Callister, M.; Rogers, T.; Sculpher, M. Modelling the cost-effectiveness of public awareness campaigns for the early detection of non-small-cell lung cancer. Br. J. Cancer 2015, 113, 135–141. [Google Scholar] [CrossRef]
- Laumbach, R.J.; Cromar, K.R. Personal interventions to reduce exposure to outdoor air pollution. Annu. Rev. Public Health 2022, 43, 293–309. [Google Scholar] [CrossRef]
- Omuta, G. Infrastructure and health care services in the Niger Delta region of Nigeria: A case study of physical amenities in the primary health care system in Delta State. Online J. Health Allied Sci. 2016, 14, 2. [Google Scholar]
- Sedgwick, P. STATISTICAL QUESTION Cross Sectional Studies: Advantages and Disadvantages; BMJ PUBLISHING GROUP BRITISH MED ASSOC HOUSE: London, UK, 2014; p. 348. [Google Scholar]

| Variables | Bodo n = 150 | K-Dere n = 150 | Beeri n = 150 | |||
|---|---|---|---|---|---|---|
| n | % | n | % | N | % | |
| Children | ||||||
| Age | ||||||
| 1 | 15 | 10.00 | 17 | 11.33 | 14 | 9.33 |
| 2 | 24 | 16.00 | 43 | 28.67 | 25 | 16.67 |
| 3 | 58 | 38.67 | 40 | 26.67 | 45 | 30.00 |
| 4 | 53 | 35.33 | 50 | 33.33 | 66 | 44.00 |
| Median (IQR) | 3 (2–4) | 3 (2.5–4) | 3 (2–4) | |||
| Gender | ||||||
| Male | 80 | 53.33 | 87 | 58.00 | 91 | 60.67 |
| Female | 70 | 46.67 | 63 | 42.00 | 59 | 39.33 |
| Number of Siblings | ||||||
| None | 4 | 2.67 | 25 | 16.67 | 3 | 2.00 |
| 1–3 | 98 | 65.33 | 99 | 66.00 | 118 | 78.67 |
| ≥4 | 48 | 32.00 | 26 | 17.33 | 29 | 19.33 |
| Median (IQR) | 2 (2.5–3) | 2 (1.5–3.5) | 3 (2–4) | |||
| Birth Position | ||||||
| First | 23 | 15.33 | 40 | 26.67 | 44 | 29.33 |
| Second | 34 | 22.67 | 42 | 28.00 | 53 | 35.33 |
| Third | 43 | 28.67 | 41 | 27.33 | 26 | 17.33 |
| Fourth | 25 | 16.67 | 13 | 8.67 | 16 | 10.67 |
| Fifth | 17 | 11.33 | 10 | 6.67 | 6 | 4.00 |
| Sixth | 5 | 3.33 | 2 | 1.33 | 5 | 3.33 |
| Seventh | 2 | 1.33 | 2 | 1.33 | 0 | 0.0 |
| Eight | 1 | 0.67 | 1 | 0.67 | 0 | 0.0 |
| Number of years resident in your community | ||||||
| 1 | 15 | 10.00 | 16 | 10.67 | 14 | 9.33 |
| 2 | 30 | 20.00 | 52 | 34.67 | 25 | 16.67 |
| 3 | 58 | 38.67 | 40 | 26.67 | 44 | 29.33 |
| 4 | 47 | 31.33 | 42 | 28.00 | 67 | 44.67 |
| Median (IQR) | 3 (2–4) | 3 (2.5–4) | 3 (2–4) | |||
| Variables | Bodo n = 150 | K-Dere n = 150 | Beeri n = 150 | |||
|---|---|---|---|---|---|---|
| n | % | n | % | n | % | |
| Parent/Guardian | ||||||
| Father’s educational level | ||||||
| None | 6 | 4.00 | 5 | 3.33 | 0 | 0.0 |
| Primary | 31 | 20.67 | 24 | 16.00 | 5 | 3.33 |
| Secondary | 45 | 30.00 | 55 | 36.67 | 80 | 53.33 |
| Tertiary | 28 | 18.67 | 50 | 33.33 | 38 | 25.33 |
| Post-graduate | 40 | 26.67 | 16 | 10.67 | 27 | 18.00 |
| Mother’s educational level | ||||||
| None | 8 | 5.33 | 10 | 6.67 | 0 | 0.0 |
| Primary | 32 | 21.33 | 45 | 30.00 | 11 | 7.33 |
| Secondary | 50 | 33.33 | 40 | 26.67 | 97 | 64.67 |
| Tertiary | 33 | 22.00 | 42 | 28.00 | 12 | 8.00 |
| Post-graduate | 27 | 18.00 | 13 | 8.67 | 30 | 20.00 |
| Father’s occupation | ||||||
| Professional | 38 | 25.33 | 12 | 8.00 | 11 | 7.33 |
| Civil servant | 30 | 20.00 | 38 | 25.33 | 54 | 36.00 |
| Fishing/farming | 59 | 39.33 | 32 | 21.33 | 31 | 20.67 |
| Artisans | 23 | 15.33 | 68 | 45.33 | 54 | 36.00 |
| Mother’s occupation | ||||||
| Professional | 21 | 14.00 | 13 | 8.67 | 6 | 4.00 |
| Civil servant | 47 | 31.33 | 24 | 16.00 | 32 | 21.33 |
| Fishing/farming | 64 | 42.67 | 53 | 35.33 | 49 | 32.67 |
| Artisans | 18 | 12.00 | 59 | 39.33 | 63 | 42.00 |
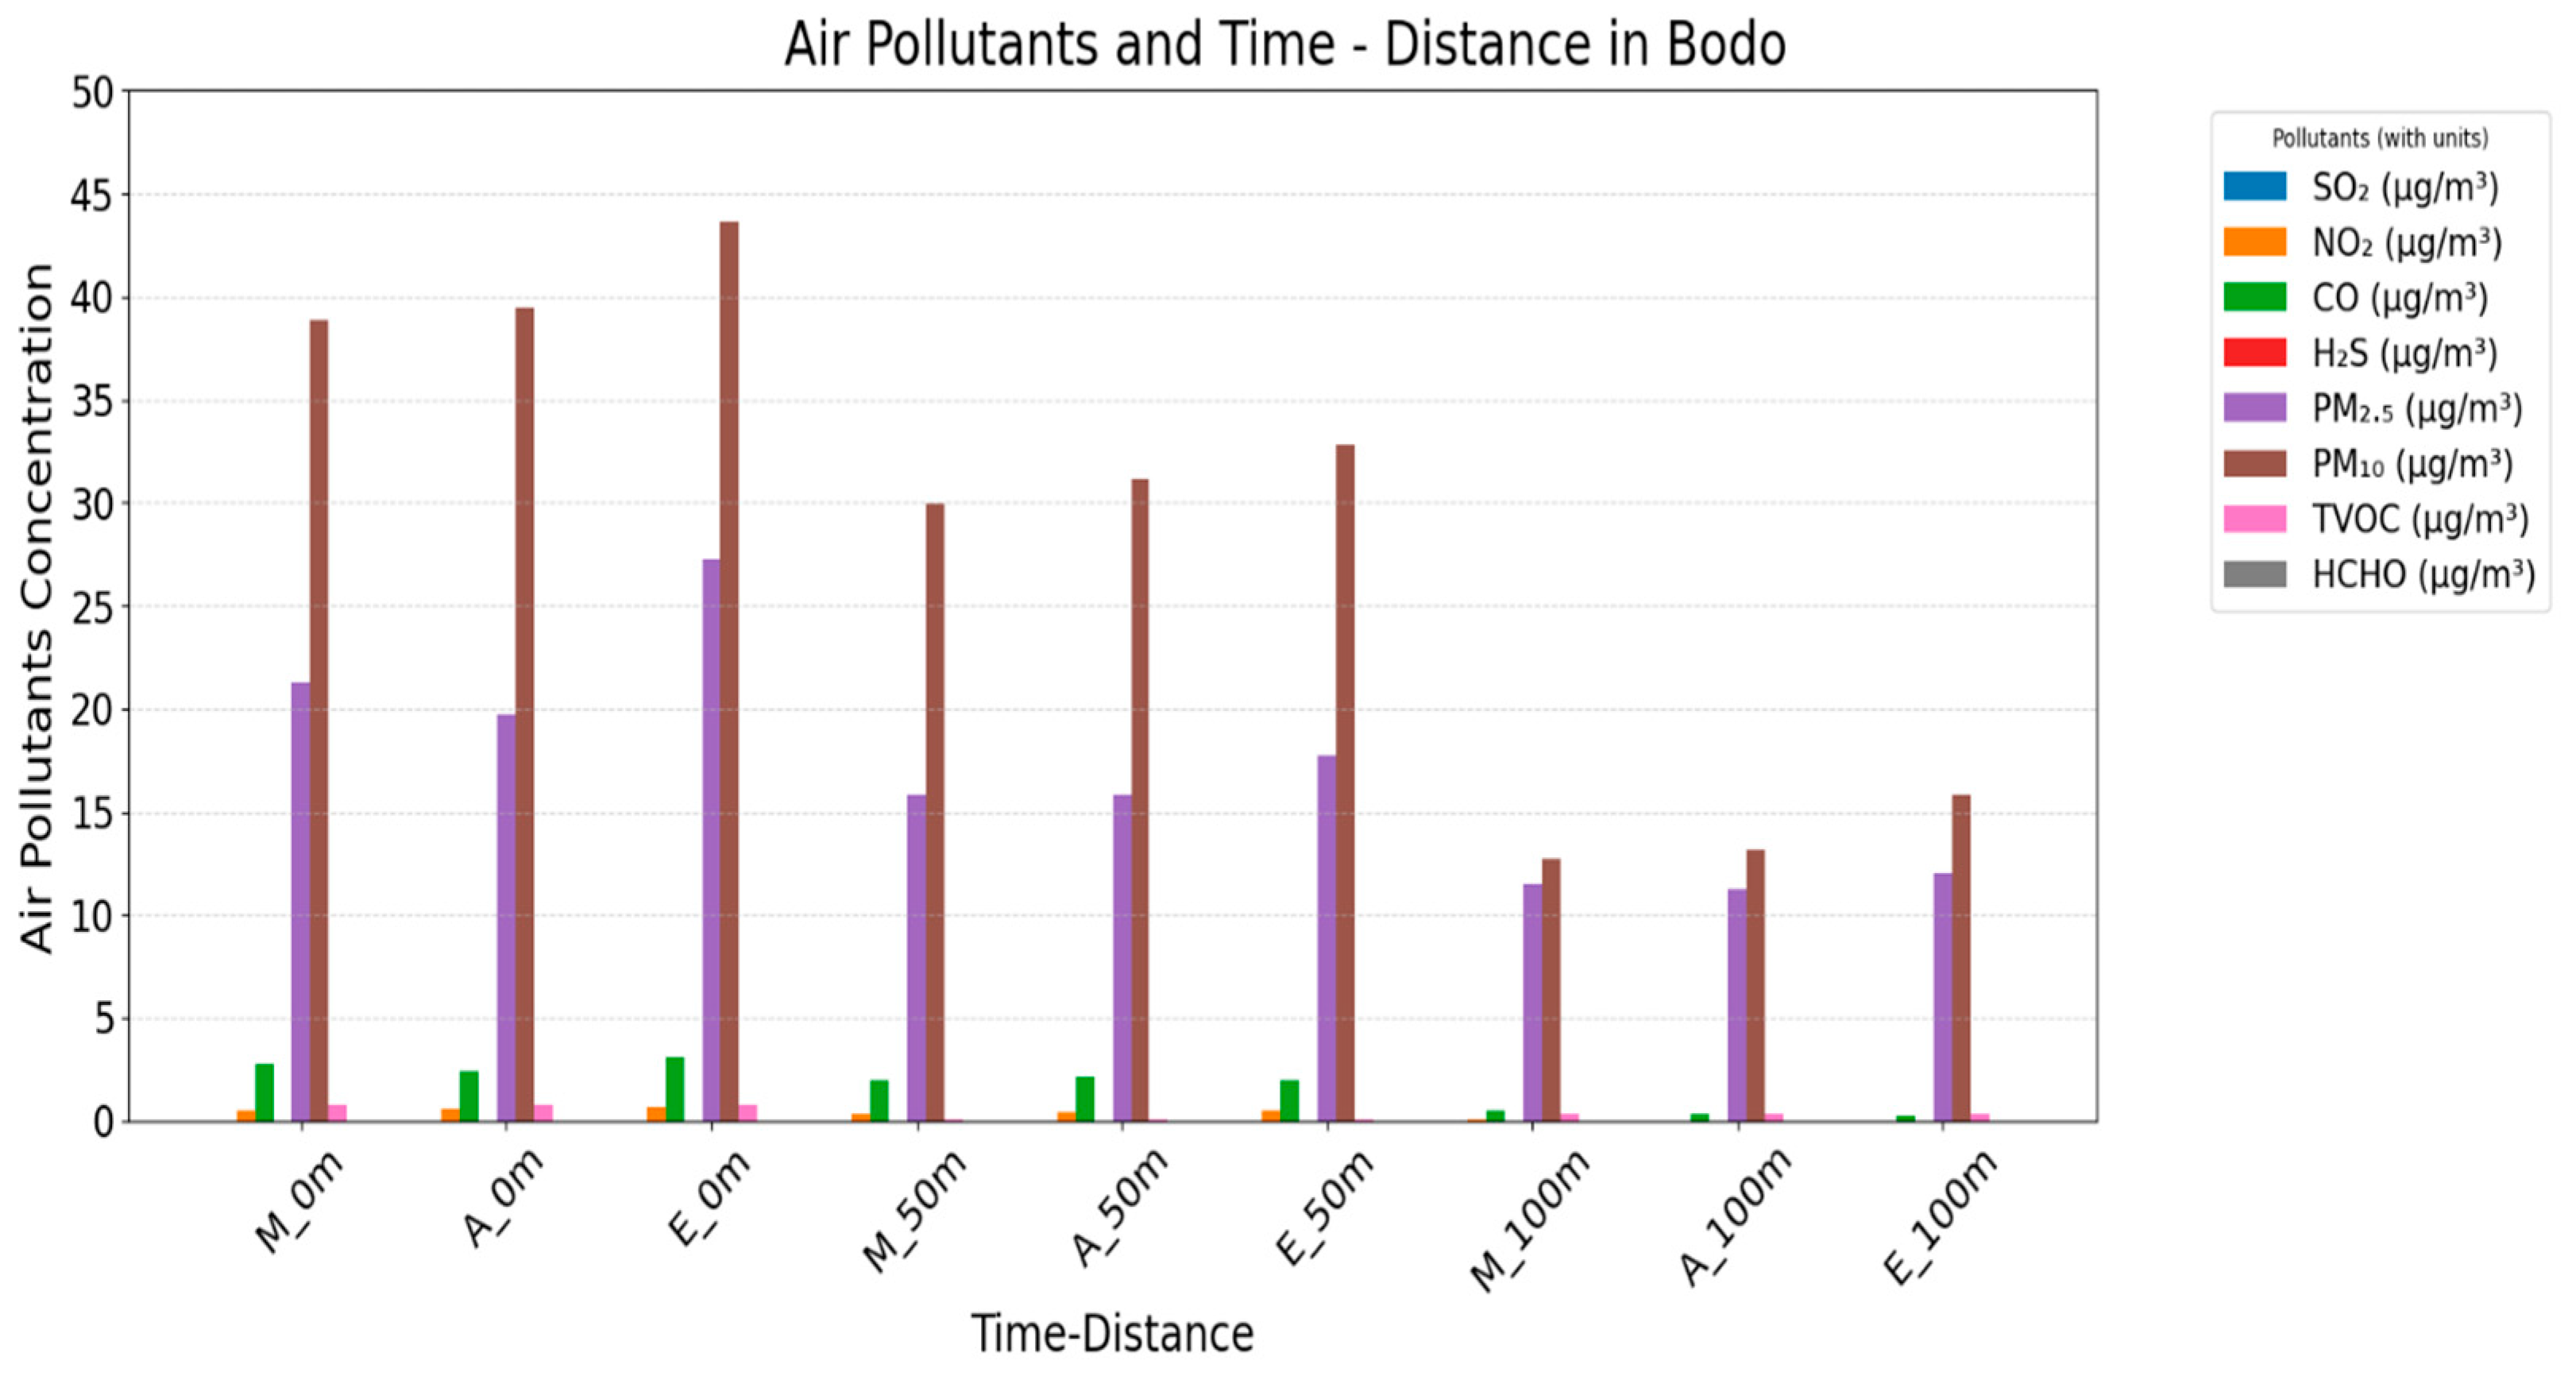
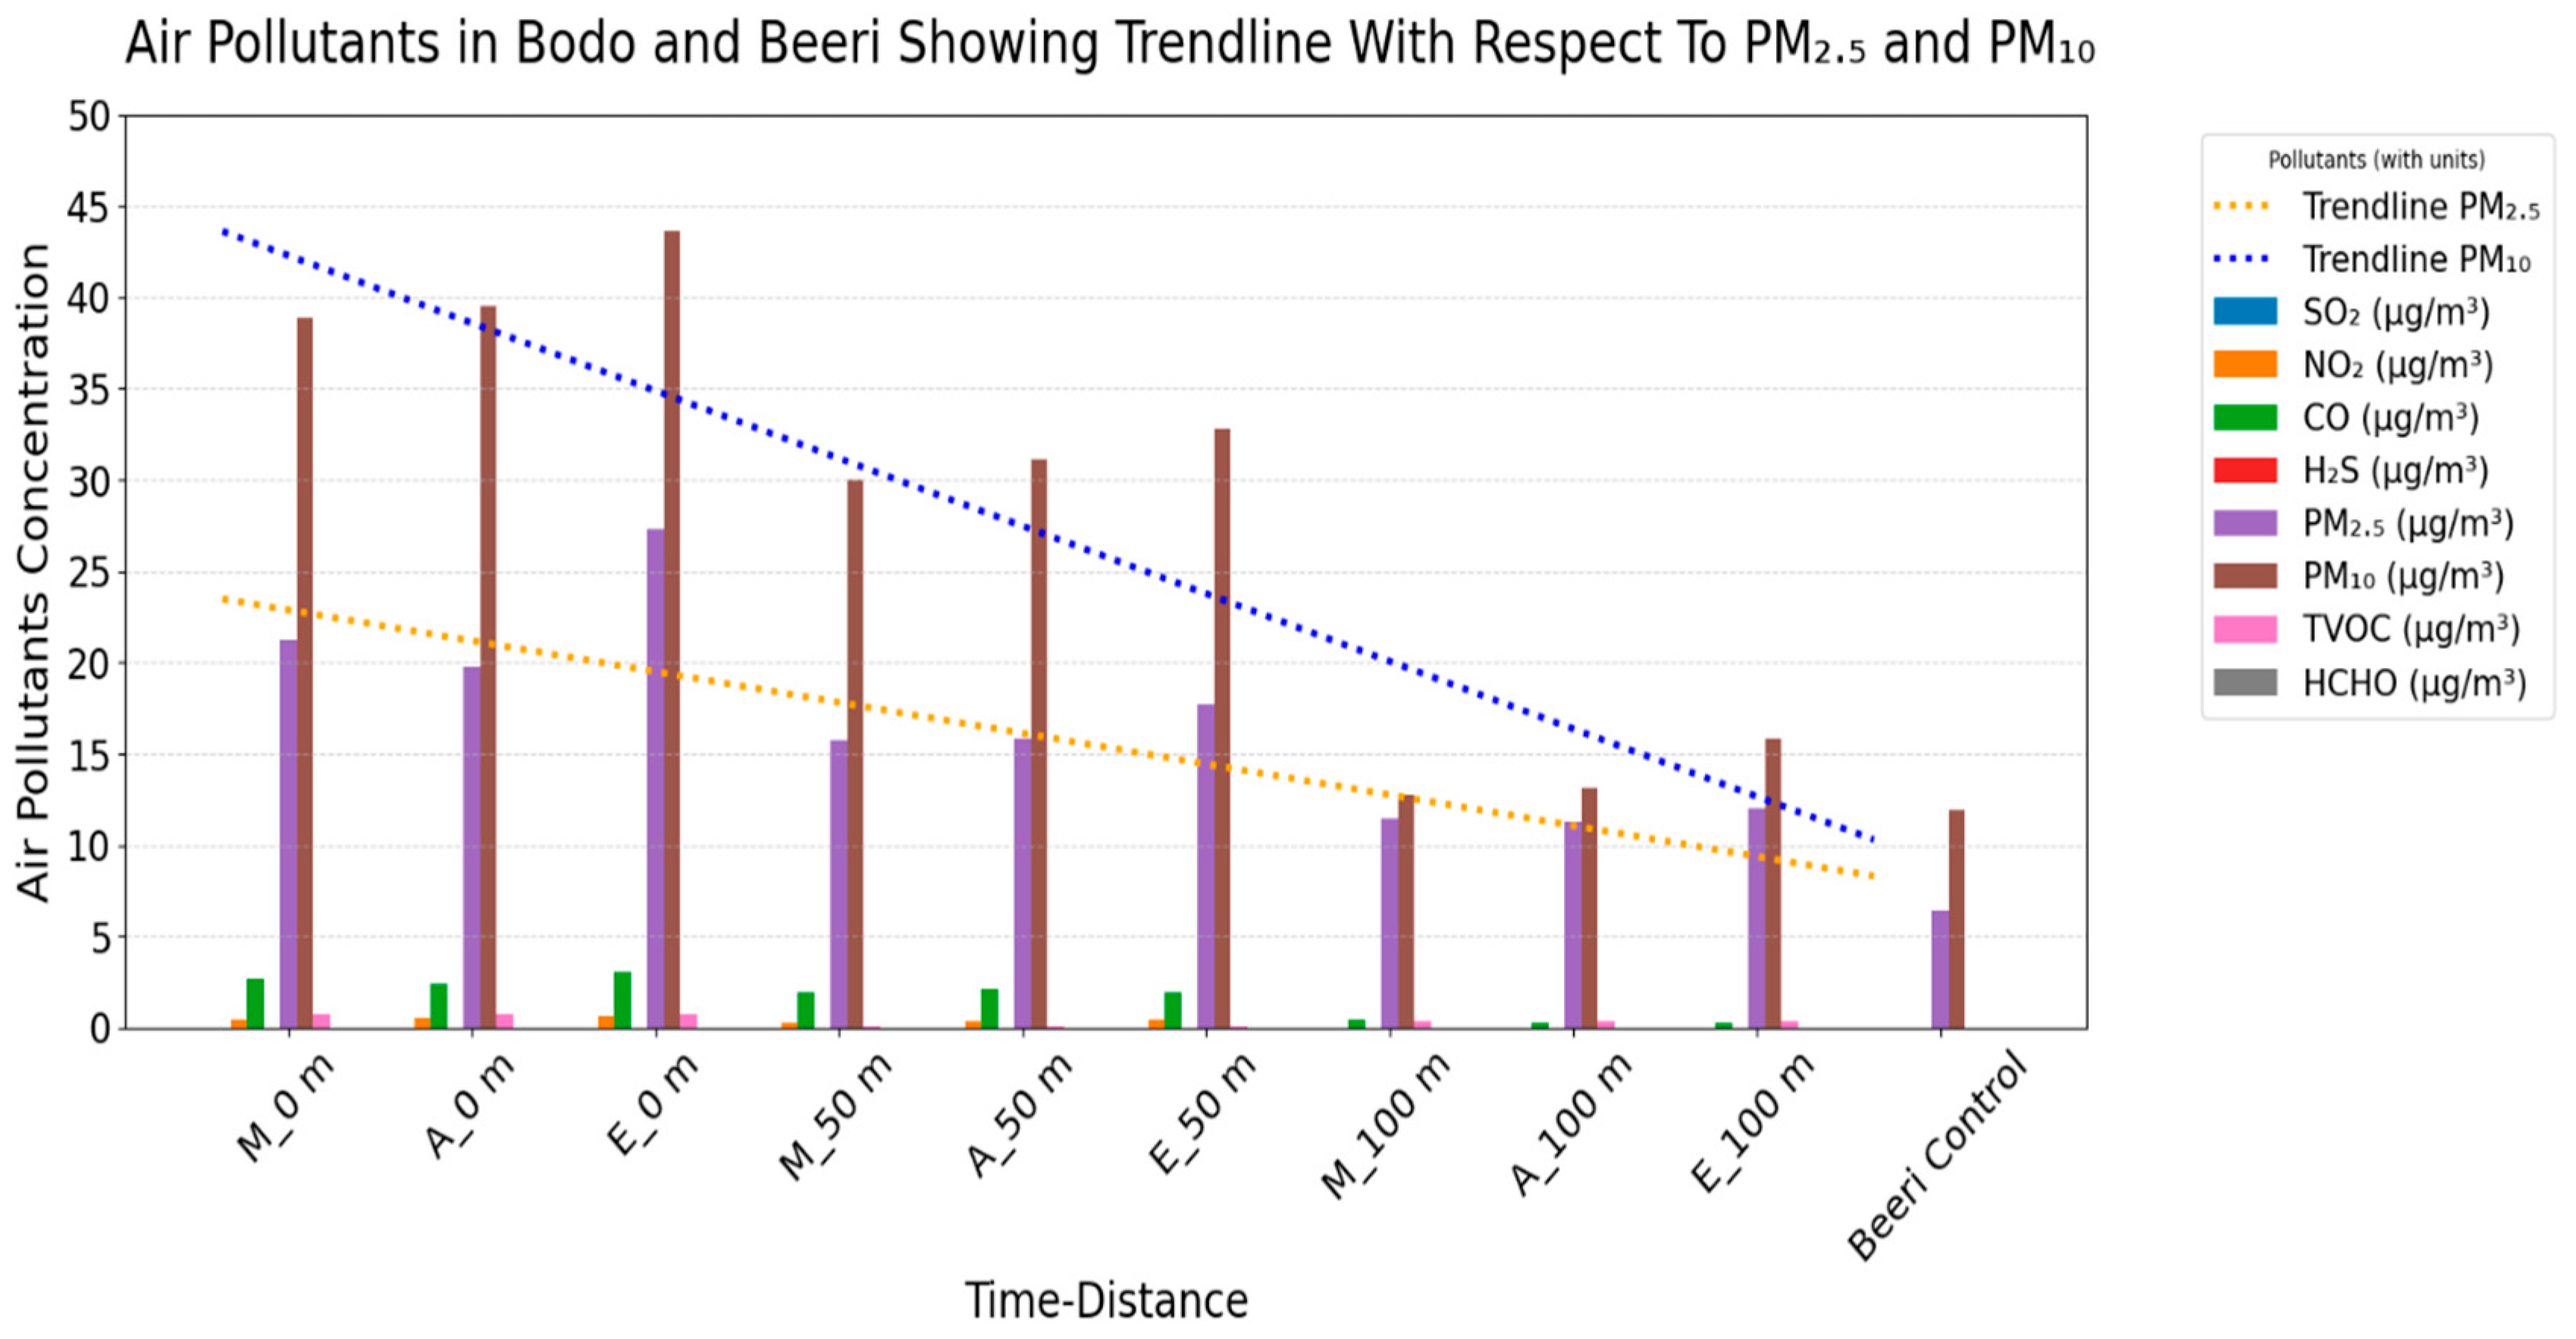
| T-D | T (°C) | R | Noise (dB) | Wind Speed (m/s) | SO2 (µg/m3) | NO2 (µg/m3) | CO (µg/m3) | H2S (µg/m3) | PM2.5 (µg/m3) | PM10 (µg/m3) | TVOC (µg/m3) | HCHO (µg/m3) |
|---|---|---|---|---|---|---|---|---|---|---|---|---|
| M_0 m | 29.50 ± 1.02 | 85.56 ± 3.11 | 68.07 ± 10.85 | 25.76 ± 3.67 | 0.00 ± 00 | 0.47 ± 0.49 | 2.74 ± 1.43 | 0.00 ± 00 | 21.26 ± 6.24 | 38.86 ± 8.37 | 0.76 ± 10.07 | 0.010 ± 0.01 |
| A_0 m | 30.32 ± 1.10 | 84.07 ± 3.11 | 70.48 ± 10.85 | 25.82 ± 3.67 | 0.00 ± 00 | 0.55 ± 0.53 | 2.43 ± 1.58 | 0.00 ± 00 | 19.76 ± 6.18 | 39.50 ± 8.40 | 0.76 ± 10.07 | 0.011 ± 0.01 |
| E_0 m | 29.97 ± 1.24 | 85.16 ± 3.11 | 66.98 ± 10.85 | 25.73 ± 3.67 | 0.00 ± 00 | 0.69 ± 0.49 | 3.09 ± 1.27 | 0.00 ± 00 | 27.26 ± 6.18 | 43.64 ± 8.54 | 0.76 ± 10.07 | 0.012 ± 0.01 |
| M_50 m | 30.79 ± 1.06 | 84.86 ± 3.26 | 66.60 ± 7.27 | 26.05 ± 3.05 | 0.00 ± 00 | 0.29 ± 0.37 | 1.94 ± 1.09 | 0.00 ± 00 | 15.79 ± 5.09 | 29.98 ± 4.60 | 0.05 ± 0.06 | 0.011 ± 0.01 |
| A_50 m | 30.61 ± 0.98 | 84.41 ± 3.26 | 69.01 ± 7.27 | 26.11 ± 3.05 | 0.00 ± 00 | 0.39 ± 0.39 | 2.14 ± 1.38 | 0.00 ± 00 | 15.86 ± 5.16 | 31.12 ± 4.53 | 0.05 ± 0.06 | 0.011 ± 0.00 |
| E_50 m | 30.56 ± 1.13 | 84.66 ± 3.23 | 65.82 ± 7.30 | 25.98 ± 3.08 | 0.00 ± 00 | 0.49 ± 0.38 | 1.95 ± 0.97 | 0.00 ± 00 | 17.71 ± 4.97 | 32.78 ± 4.64 | 0.05 ± 0.06 | 0.011 ± 0.00 |
| M_100 m | 30.57 ± 1.12 | 89.41 ± 1.93 | 73.55 ±4.85 | 25.25 ± 3.12 | 0.00 ± 00 | 0.03 ± 0.13 | 0.49 ± 0.76 | 0.00 ± 00 | 11.49 ± 3.03 | 12.72 ± 5.79 | 0.34 ± 0.49 | 0.007 ± 0.00 |
| A_100 m | 30.48 ± 0.82 | 89.37 ± 1.95 | 74.85 ± 4.90 | 25.25 ± 3.14 | 0.00 ± 00 | 0.01 ± 0.01 | 0.29 ± 0.42 | 0.00 ± 00 | 11.26 ± 2.33 | 13.12 ± 4.82 | 0.35 ± 0.50 | 0.007 ± 0.00 |
| E_100 m | 30.16 ± 1.11 | 89.39 ± 1.95 | 72.55 ± 4.90 | 25.16 ± 3.14 | 0.00 ± 00 | 0.00 ± 0.01 | 0.23 ± 0.35 | 0.00 ± 00 | 12.05 ± 2.20 | 15.83 ± 5.37 | 0.35 ± 0.50 | 0.007 ± 0.00 |
| Beeri-Control | 30.48 ± 0.55 | 82.00 ± 1.33 | 74.81 ± 4.95 | 18.90 ± 1.13 | 0.00 ± 00 | 0.00 ± 00 | 0.00 ± 00 | 0.00 ± 00 | 6.47 ± 4.64 | 11.95 ± 5.49 | 0.00 ± 0.00 | 0.00 ± 0.00 |
| Nat’l Limit | 80 | 80 | 10 | 6969.3 | 20 | 60 | 24.56 | |||||
| WHO Limit | 53 | 40 | 10 | 7 | 0.03 | 5 | 15 | 0–0.05 | 0.814 |
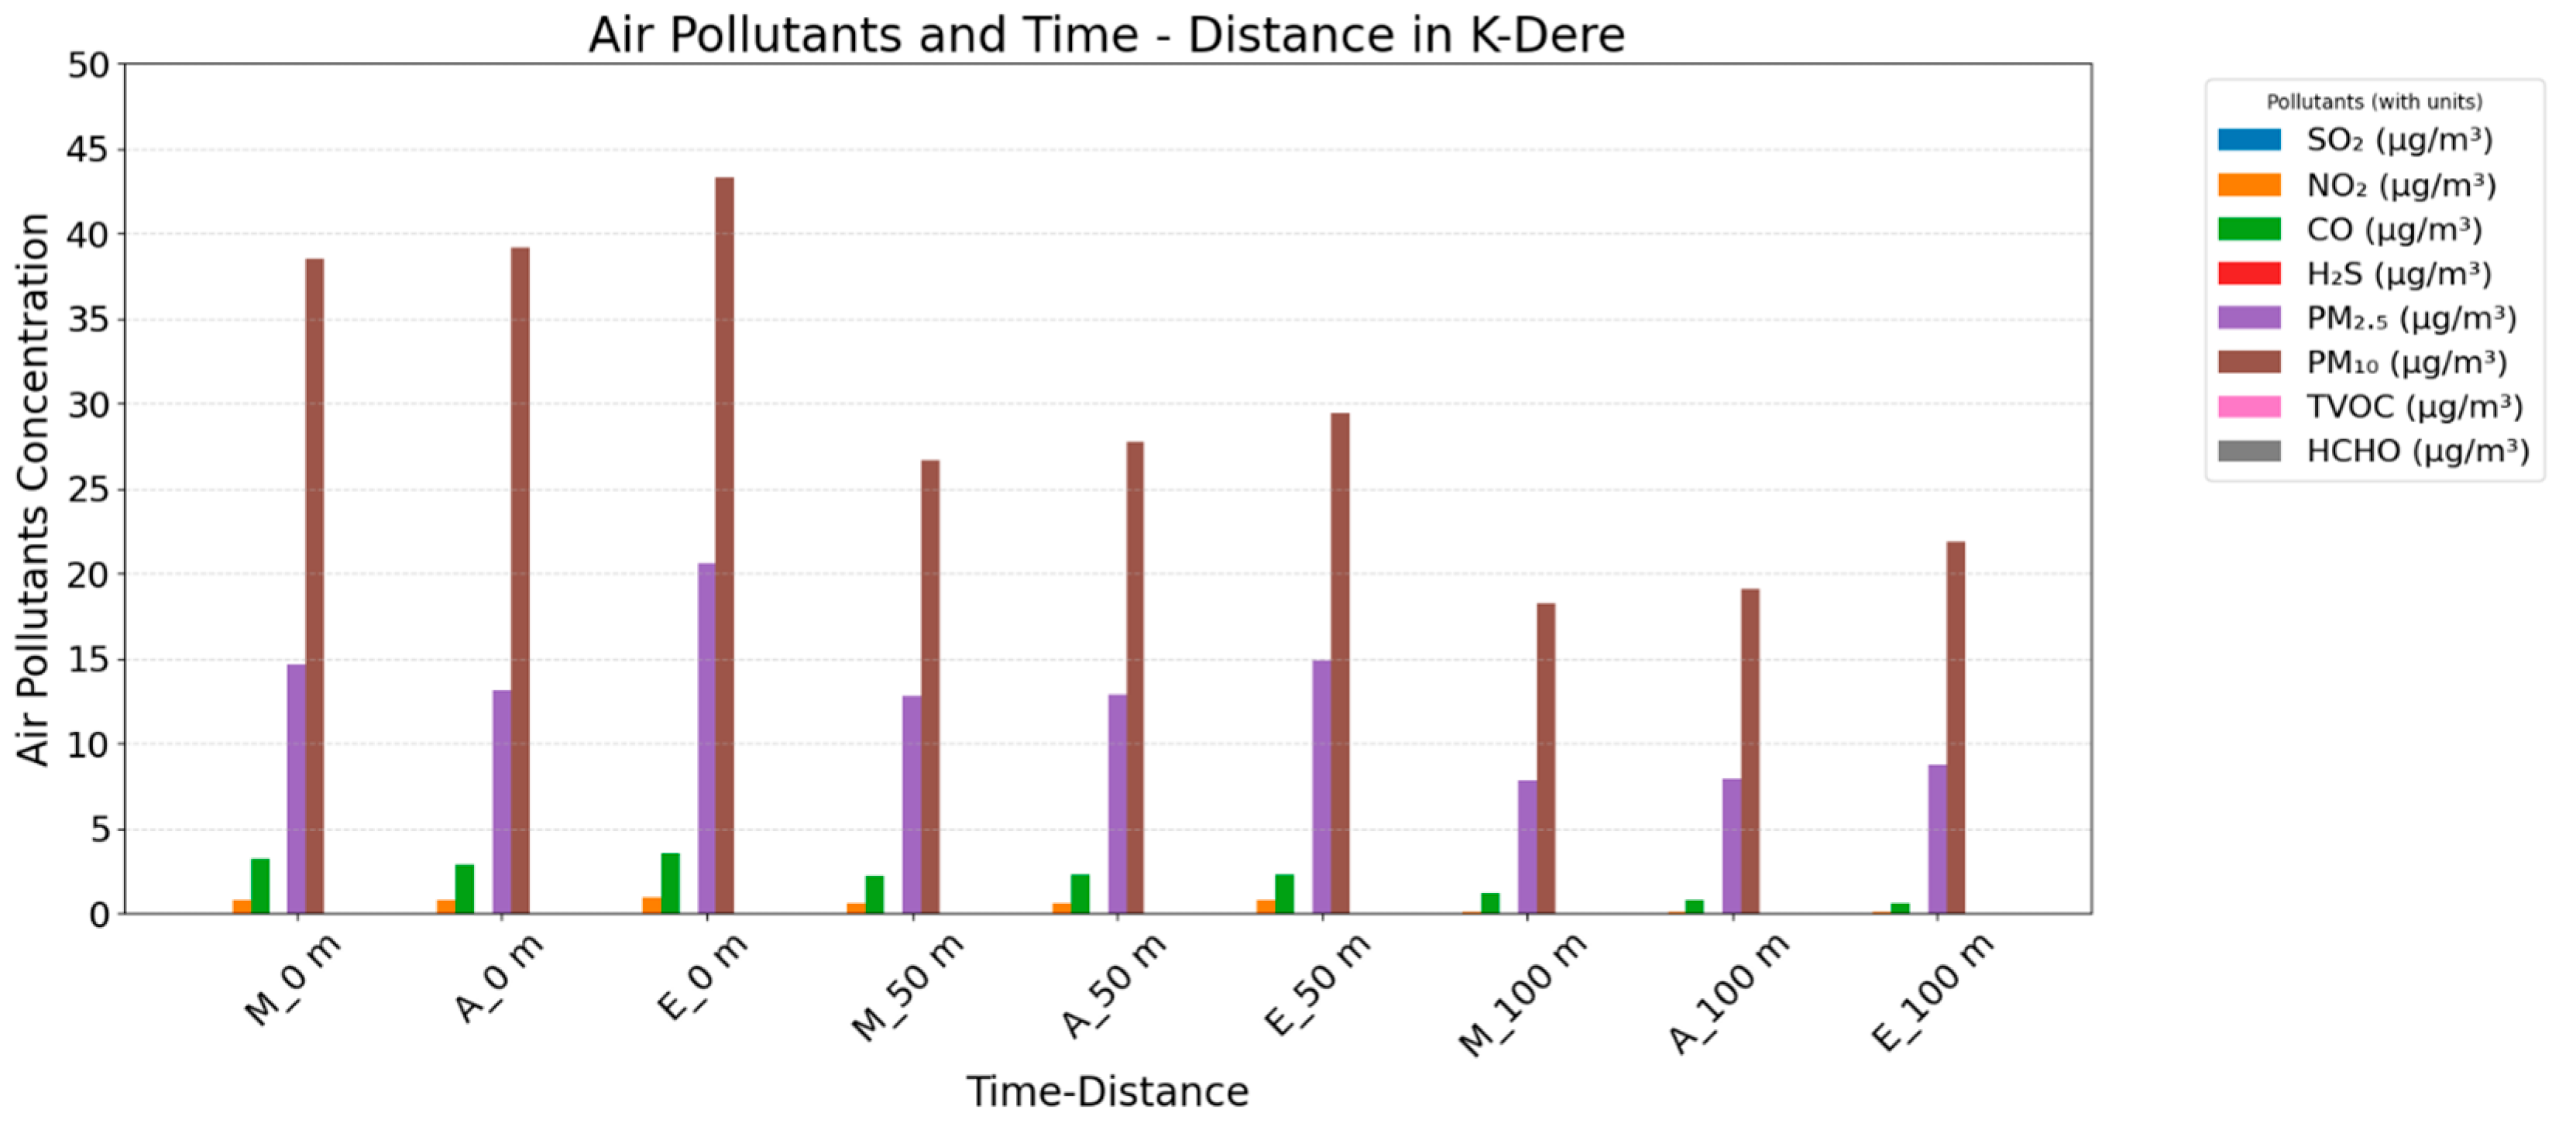
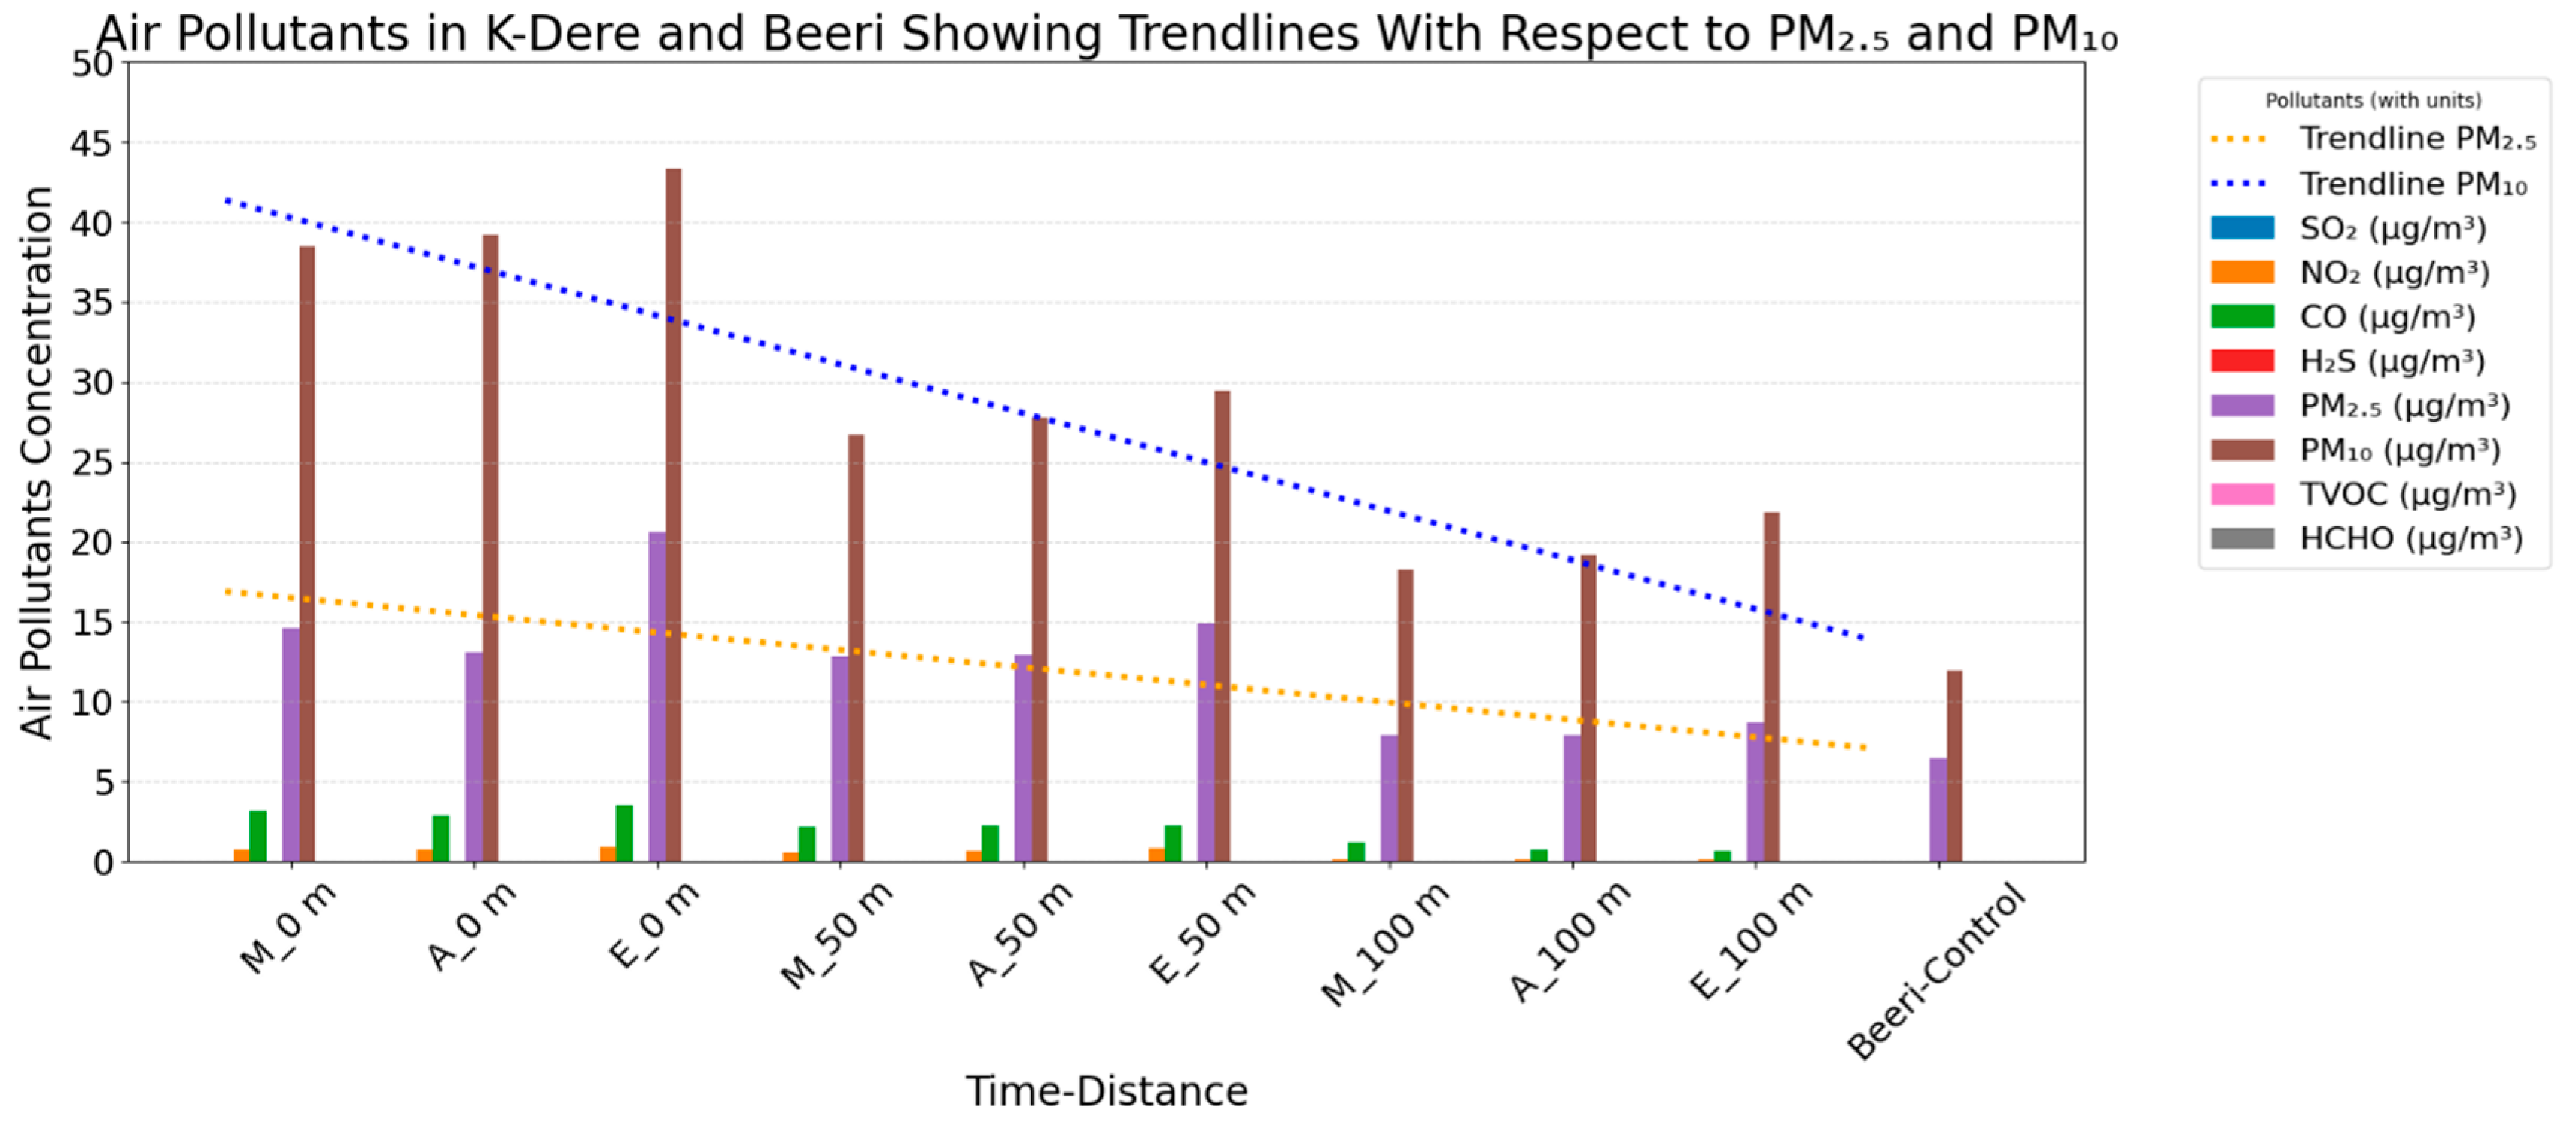
| T-D | T (°C) | R | Noise (dB) | Wind Speed (m/s) | SO2 (µg/m3) | NO2 (µg/m3) | CO (µg/m3) | H2S (µg/m3) | PM2.5 (µg/m3) | PM10 (µg/m3) | TVOC (µg/m3) | HCHO (µg/m3) |
|---|---|---|---|---|---|---|---|---|---|---|---|---|
| M_0 m | 31.50 ± 1.09 | 86.48 ± 3.90 | 55.59 ± 2.13 | 25.78 ± 2.04 | 0.00 ± 00 | 0.73 ± 0.54 | 3.19 ± 1.69 | 0.001 ± 0.00 | 14.60 ± 4.52 | 38.52 ± 15.57 | 0.02 ± 0.15 | 0.004 ± 0.01 |
| A_0 m | 32.32 ± 1.16 | 84.99 ± 3.90 | 58.00 ± 2.13 | 25.84 ± 2.04 | 0.00 ± 00 | 0.76 ± 0.60 | 2.88 ± 1.77 | 0.001 ± 0.00 | 13.10 ± 4.44 | 39.17 ± 15.59 | 0.02 ± 0.02 | 0.005 ± 0.01 |
| E_0 m | 32.04 ± 1.29 | 86.08 ± 3.90 | 54.50 ± 2.13 | 25.75 ± 2.04 | 0.00 ± 00 | 0.89 ± 0.65 | 3.50 ± 1.63 | 0.001 ± 0.00 | 20.60 ± 4.44 | 43.31 ± 15.66 | 0.02 ± 0.02 | 0.006 ± 0.01 |
| M_50 m | 30.98 ± 0.55 | 84.15 ± 3.15 | 50.90 ± 4.46 | 26.09 ± 2.75 | 0.00 ± 00 | 0.58 ± 0.44 | 2.15 ± 0.96 | 0.001 ± 0.00 | 12.79 ± 6.86 | 26.64 ± 10.21 | 0.01 ±0.01 | 0.004 ± 0.01 |
| A_50 m | 31.24 ± 0.99 | 83.70 ± 3.15 | 53.31 ± 4.46 | 26.15 ± 2.75 | 0.00 ± 00 | 0.63 ± 0.52 | 2.27 ± 1.39 | 0.001 ± 0.00 | 12.86 ± 6.91 | 27.79 ± 10.18 | 0.01 ± 0.01 | 0.004 ± 0.01 |
| E_50 m | 30.93 ± 1.03 | 84.05 ± 3.15 | 50.26 ± 4.46 | 26.06 ± 2.75 | 0.00 ± 00 | 0.79 ± 0.58 | 2.26 ± 0.70 | 0.001 ± 0.00 | 14.86 ± 6.80 | 29.43 ± 10.20 | 0.01 ± 0.01 | 0.004 ± 0.01 |
| M_100 m | 30.74 ± 0.59 | 91.69 ± 3.71 | 49.50 ± 6.90 | 25.12 ± 2.91 | 0.00 ± 00 | 0.12 ± 0.15 | 1.16 ± 0.77 | 0.001 ± 0.00 | 7.86 ± 4.27 | 18.26 ± 7.28 | 0.00 ± 0.00 | 0.003 ± 0.00 |
| A_100 m | 31.13 ± 0.94 | 91.64 ± 3.71 | 50.75 ± 6.90 | 45.86 ± 31.64 | 0.00 ± 00 | 0.12 ± 0.15 | 0.74 ± 0.65 | 0.001 ± 0.00 | 7.93 ± 4.26 | 19.12 ± 7.18 | 0.00 ± 0.00 | 0.004 ± 0.00 |
| E_100 m | 30.88 ± 1.16 | 91.66 ± 3.71 | 48.45 ± 6.90 | 25.09 ± 2.91 | 0.00 ± 00 | 0.11 ± 0.15 | 0.61 ± 0.61 | 0.001 ± 0.00 | 8.71 ± 4.19 | 21.83 ± 7.54 | 0.00 ± 0.00 | 0.004 ± 0.00 |
| Beeri-Control | 30.48 ± 0.55 | 82.00 ± 1.33 | 74.81 ± 4.95 | 18.90 ± 1.13 | 0.00 ± 00 | 0.00 ± 0.00 | 0.00 ± 0.00 | 0.00 ± 0.00 | 6.47 ± 4.64 | 11.95 ± 5.49 | 0.00 ± 0.00 | 0.00 ± 0.00 |
| Nat’l Limit | 80 | 80 | 10 | 6969.3 | 20 | 60 | 24.56 | |||||
| WHO Limit | 53 | 40 | 10 | 7 | 0.03 | 5 | 15 | 0–0.05 | 0.814 |
| Time_Distance | PM2.5 | p-Value 95%CI | PM10 | p-Value (95%CI) | TVOC | p-Value (95%CI) | |
|---|---|---|---|---|---|---|---|
| Beeri (less oil impacted area) | Bodo, morning_0 m | −14.796 * (0.893) | 0.000 (−17.95 to −11.65) | −30.040 * (1.628) | 0.000 (−35.78 to −24.30) | −0.741 * (0.097) | <0.001 (−1.040 to −0.481) |
| Bodo afternoon_0 m | −13.296 * (0.893) | 0.001 (−16.45 to −10.15) | −30.683 * (1.628) | 0.001 (−36.43 to −24.94) | −0.742 * (0.097) | 0.001 (−1.042 to −0.482) | |
| Bodo, evening_0 m | −20.796 * (0.893) | 0.001 (−23.95 to −17.65) | −34.826 * (1.628) | 0.001 (−40.57 to −29.08) | −0.743 * (0.097) | 0.001 (−1.042 to −0.483) | |
| Bodo, morning_50 m | −9.320 * (0.893) | 0.001 (−12.47 to −6.17) | −21.159 * (1.628) | 0.001 (−26.90 to −15.42) | −0.033 (0.097) | 1.000 (−0.332 to 0.227) | |
| Bodo, afternoon_50 m | −9.392 * (0.893) | 0.001 (−12.54 to −6.24) | −22.302 * (1.628) | 0.001 (−28.05 to −16.56) | −0.033 (0.097) | 1.000 (−0.333 to 0.227) | |
| Bodo, evening_50 m | −11.392 * (0.893) | 0.001 (−14.54 to −8.24) | −23.945 * (1.628) | 0.001 (−29.69 to −18.20) | −0.034 (0.097) | 1.000 (−0.333 to 0.226) | |
| Bodo, morning_100 m | −4.725 * (0.893) | 0.000 (−7.88 to −1.57) | −3.445 | 0.828 (−9.19 to 2.30) | −0.328 (0.097) | 0.002 (−0.627 to −0.068) | |
| Bodo, afternoon_100 m | −4.796 * (0.893) | 0.001 (−7.95 to −1.65) | −4.302 | 0.449 (−10.05 to 1.44) | −0.328 (0.097) | 0.002 (−0.627 to −0.068) | |
| Bodo, evening_100 m | −5.582 * (0.893) | 0.001 (−8.73 to −2.43) | −7.017 * (1.628) | 0.003 (−12.76 to −1.27) | −0.328 (0.097) | 0.002 (−0.627 to −0.068) |
| Time_Distance | PM2.5 | p-Value (95%CI) | PM10 | p-Value (95%CI) | TVOC | p-Value (95%CI) | |
|---|---|---|---|---|---|---|---|
| Beeri (less oil-impacted area) | K-Dere, morning_0 m | −8.130 * (0.893) | 0.001 (−11.28 to −4.98) | −29.707 * (1.628) | 0.001 (−35.45 to −23.96) | −0.001 (0.097) | 1.000 (−0.299 to 0.260) |
| K-Dere afternoon_0 m | −6.630 * (0.893) | 0.001 (−9.78 to −3.48) | −30.350 * (1.628) | 0.001 (−36.09 to −24.61) | −0.001 (0.097) | 1.000 (−0.300 to 0.259) | |
| K-Dere, evening_0 m | −14.30 * (0.893) | 0.001 (−17.28 to −10.98) | −34.493 * (1.628) | 0.001 (−40.24 to −28.75) | 0.008 (0.097) | 1.000 (−0.300 to 0.259) | |
| K-Dere, morning_50 m | −6.320 * (0.893) | 0.001 (−9.47 to −3.17) | −17.826 * (1.628) | 0.001 (−23.57 to −12.08) | 0.008 (0.097) | 1.000 (−0.291 to 0.268) | |
| K-Dere, afternoon_50 m | −6.392 * (0.893) | 0.001 (−9.54 to −3.24) | −18.969 * (1.628) | 0.001 (−24.71 to −13.22) | 0.007 (0.097) | 1.000 (−0.291 to 0.268) | |
| K-Dere, evening_50 m | −8.392 * (0.893) | 0.001 (−11.54 to −5.24) | −20.612 * (1.628) | 0.001 (−26.36 to −14.87) | 0.007 (0.097) | 1.000 (−0.292 to 0.267) | |
| K-Dere, morning_100 m | −1392 (0.893) | 0.989 (−4.54 to 1.76) | −9.445 * (1.628) | 0.001 (−15.19 to −3.70) | 0.018 (0.097) | 1.000 (−0.281 to 0.278) | |
| K-Dere, afternoon_100 m | −1.463 (0.893) | 0.982 (−4.61 to 1.69) | −10.302 * (1.628) | 0.001 (−16.05 to −4.56) | 0.019 (0.097) | 1.000 (−0.281 to 0.279) | |
| K-Dere, evening_100 m | −2.249 (0.893) | 0.545 (−5.40 to 0.90) | −13.017 * (1.628) | 0.001 (−18.76 to −7.27) | 0.019 (0.097) | 1.000 (−0.281 to 0.279) |
| Variables | Bodo n = 150 | Beeri n = 150 | χ2 (p-Value) | Odds Ratio (OR) (95%CI) | p-Value | ||
|---|---|---|---|---|---|---|---|
| n | % | n | % | ||||
| Cough | |||||||
| Yes | 113 | 75.33 | 82 | 54.67 | 14.08 (0.001) * | 2.53 | 0.001 * |
| No | 37 | 24.67 | 68 | 45.33 | (1.55–4.13) | ||
| Coughing at night | |||||||
| Yes | 96 | 64.00 | 42 | 28.00 | 39.13 (0.001) * | 4.57 | 0.001 * |
| No | 54 | 36.00 | 108 | 72.00 | (2.81–7.44) | ||
| Chest pain when coughing | |||||||
| Yes | 55 | 36.67 | 27 | 18.00 | 13.16 (0.001) * | 2.64 | 0.002 * |
| No | 95 | 63.33 | 123 | 82.00 | (1.55–4.49) | ||
| Difficulty in breathing/fast breathing | |||||||
| Yes | 95 | 63.33 | 33 | 22.00 | 54.19 (0.001) * | 6.32 | 0.001 * |
| No | 55 | 36.67 | 117 | 78.00 | (3.81–10.67) | ||
| Persistent stuffy (blocked) nostrils | |||||||
| Yes | 107 | 71.33 | 32 | 21.33 | 79.65 (0.001) * | 9.18 | 0.001 * |
| No | 43 | 28.67 | 118 | 78.67 | (5.41–15.54) | ||
| Itchy nostrils | |||||||
| Yes | 117 | 78.00 | 30 | 20.00 | 94.08 (0.001) * | 14.18 | 0.001 * |
| No | 33 | 22.00 | 120 | 80.00 | (8.13–24.73) | ||
| Frequent sneezing | |||||||
| Yes | 115 | 76.67 | 35 | 23.33 | 85.33 (0.001) * | 10.79 | 0.001 * |
| No | 35 | 23.33 | 115 | 76.67 | (6.32–18.44) | ||
| Fever | |||||||
| Yes | 81 | 54.00 | 95 | 63.33 | 2.69 (0.101) | 0.68 | 0.101 |
| No | 69 | 46.00 | 55 | 36.67 | (0.43–1.08) | ||
| Itchy throat | |||||||
| Yes | 78 | 52.00 | 26 | 17.33 | 39.79 (0.001) * | 5.17 | 0.001 * |
| No | 72 | 48.00 | 124 | 82.67 | (3.04–8.78) | ||
| Itching of the eyes | |||||||
| Yes | 118 | 78.67 | 30 | 20.00 | 103.27 (0.001) * | 14.75 | 0.001 * |
| No | 32 | 21.33 | 120 | 80.00 | (8.43–25.80) | ||
| Whistling sound from the chest | |||||||
| Yes | 52 | 34.67 | 29 | 19.33 | 8.95 (0.003) * | 2.21 | 0.001 * |
| No | 98 | 65.33 | 121 | 80.67 | (1.31–3.75) | ||
| Fast breathing even at rest | |||||||
| Yes | 77 | 51.33 | 26 | 17.33 | 38.46 (0.001) * | 5.03 | 0.001 * |
| No | 73 | 48.67 | 124 | 82.67 | (2.96–8.54) | ||
| Ear pain | |||||||
| Yes | 64 | 42.67 | 26 | 17.33 | 22.92 (0.001) * | 0.04 | 0.001 * |
| No | 86 | 57.33 | 124 | 82.67 | (0.02–0.067) | ||
| Sleep disturbance due to troubled breathing | |||||||
| Yes | 77 | 51.33 | 24 | 16.00 | 41.93 (0.001) * | 5.54 | 0.001 * |
| No | 73 | 48.67 | 126 | 84.00 | (3.22–9.52) | ||
| Variables | K-Dere n = 150 | Beeri n = 150 | χ2 (p-Value) | Odds Ratio (OR) (95%CI) | p-Value | ||
|---|---|---|---|---|---|---|---|
| n | % | n | % | ||||
| Cough | |||||||
| Yes | 110 | 73.33 | 82 | 54.67 | 11.34 (0.001) * | 2.28 | 0.001 * |
| No | 40 | 26.67 | 68 | 45.33 | (1.40–3.70) | ||
| Coughing at night | |||||||
| Yes | 102 | 68.00 | 42 | 28.00 | 48.07 (0.001) * | 5.54 | 0.001 * |
| No | 48 | 32.00 | 108 | 72.00 | (3.33–8.96) | ||
| Chest pain when coughing | |||||||
| Yes | 61 | 40.67 | 27 | 18.00 | 18.58 (0.001) * | 3.12 | 0.001 * |
| No | 89 | 59.33 | 123 | 82.00 | (1.84–5.29) | ||
| Difficulty in breathing/fast breathing | |||||||
| Yes | 102 | 68.00 | 33 | 22.00 | 64.12 (0.001) * | 7.53 | 0.001 * |
| No | 48 | 32.00 | 117 | 78.00 | (4.49–12.63) | ||
| Persistent stuffy (blocked) nostrils | |||||||
| Yes | 119 | 79.33 | 32 | 21.33 | 100.92 (0.001) * | 14.16 | 0.001 * |
| No | 31 | 20.67 | 118 | 78.67 | (8.16–24.67) | ||
| Itchy nostrils | |||||||
| Yes | 124 | 82.67 | 30 | 20.00 | 117.89 (0.001) * | 19.08 | 0.001 * |
| No | 26 | 17.33 | 120 | 80.00 | (10.66–34.14) | ||
| Frequent sneezing | |||||||
| Yes | 103 | 68.67 | 35 | 23.33 | 62.05 (0.001) * | 7.20 | 0.001 * |
| No | 47 | 31.33 | 115 | 76.67 | (4.32–12.02) | ||
| Fever | |||||||
| Yes | 91 | 60.67 | 95 | 63.33 | 0.22 (0.634) | 0.89 | 0.721 |
| No | 59 | 39.33 | 55 | 36.67 | (0.56–1.42) | ||
| Itchy throat | |||||||
| Yes | 96 | 64.00 | 26 | 17.33 | 67.69 (0.001) * | 8.47 | 0.001 * |
| No | 54 | 36.00 | 124 | 82.67 | (4.98–14.53) | ||
| Itching of the eyes | |||||||
| Yes | 110 | 73.33 | 30 | 20.00 | 85.71 (0.001) * | 11.0 | 0.001 * |
| No | 40 | 26.67 | 120 | 80.00 | (6.41–18.87) | ||
| Whistling sound from the chest | |||||||
| Yes | 59 | 39.33 | 29 | 19.33 | 14.47 (0.003) * | 2.71 | 0.001 * |
| No | 91 | 60.67 | 121 | 80.67 | (1.60–4.55) | ||
| Fast breathing even at rest | |||||||
| Yes | 72 | 48.00 | 26 | 17.33 | 32.06 (0.001) * | 4.40 | 0.001 * |
| No | 78 | 52.00 | 124 | 82.67 | (2.59–7.48) | ||
| Ear pain | |||||||
| Yes | 68 | 45.33 | 26 | 17.33 | 27.32 (0.001) * | 3.90 | 0.001 * |
| No | 82 | 54.67 | 124 | 82.67 | (2.33–6.71) | ||
| Sleep disturbance due to troubled breathing | |||||||
| Yes | 79 | 52.67 | 24 | 16.00 | 44.72 (0.001) * | 5.84 | 0.001 * |
| No | 71 | 47.33 | 126 | 84.00 | (3.39–10.04) | ||
Disclaimer/Publisher’s Note: The statements, opinions and data contained in all publications are solely those of the individual author(s) and contributor(s) and not of MDPI and/or the editor(s). MDPI and/or the editor(s) disclaim responsibility for any injury to people or property resulting from any ideas, methods, instructions or products referred to in the content. |
© 2025 by the authors. Licensee MDPI, Basel, Switzerland. This article is an open access article distributed under the terms and conditions of the Creative Commons Attribution (CC BY) license (https://creativecommons.org/licenses/by/4.0/).
Share and Cite
Abereton, P.; Ordinioha, B.; Mensah-Attipoe, J.; Toyinbo, O. A Comparative Analysis of Air Quality and Respiratory Health in Under-Five Children from Crude Oil-Impacted Communities. J 2025, 8, 16. https://doi.org/10.3390/j8020016
Abereton P, Ordinioha B, Mensah-Attipoe J, Toyinbo O. A Comparative Analysis of Air Quality and Respiratory Health in Under-Five Children from Crude Oil-Impacted Communities. J. 2025; 8(2):16. https://doi.org/10.3390/j8020016
Chicago/Turabian StyleAbereton, Pearl, Best Ordinioha, Jacob Mensah-Attipoe, and Oluyemi Toyinbo. 2025. "A Comparative Analysis of Air Quality and Respiratory Health in Under-Five Children from Crude Oil-Impacted Communities" J 8, no. 2: 16. https://doi.org/10.3390/j8020016
APA StyleAbereton, P., Ordinioha, B., Mensah-Attipoe, J., & Toyinbo, O. (2025). A Comparative Analysis of Air Quality and Respiratory Health in Under-Five Children from Crude Oil-Impacted Communities. J, 8(2), 16. https://doi.org/10.3390/j8020016