Article

First Assessment of the Thryssa vitrirostris (Engraulidae) Beach Seine Fishery in Northeastern Mozambique

by
Bonifácio Manuessa
1,2,
Eurico Morais
3,
Teresa Cerveira Borges
1,
Maria Alexandra Teodósio
1 and
Francisco Leitão
1,*
1
Centro de Ciências do Mar, Universidade do Algarve, Campus de Gambelas, 8005-139 Faro, Portugal
2
Universidade do Algarve, Campus de Gambelas, 8005-139 Faro, Portugal
3
Instituto Nacional de Investigação Pesqueira (IIP)—Delegação da Zambézia, Maputo CP 4603, Mozambique
*
Author to whom correspondence should be addressed.
J 2018, 1(1), 116-132; https://doi.org/10.3390/j1010012
Submission received: 20 September 2018 / Revised: 9 October 2018 / Accepted: 11 October 2018 / Published: 15 October 2018
(This article belongs to the Special Issue Feature Papers for J-Multidisciplinary Scientific Journal)

Abstract

:
Monthly length-frequency data, from 2009 to 2014, was used to estimate the growth parameters, mortality, and spawning season, and to assess the exploitation status of Thryssa vitrirostris (Engraulidae) fisheries in Pebane. The von Bertalanffy asymptotic length (L) and growth rate (K) were 25.1 cm (standard length) and 0.41 per year (standard length), respectively. Two proxy recruitment peaks were found: the first peak of recruitment occurs from April to July, and the second recruitment peak from September to October. The total estimated mortality rates (Z), natural mortality (M), and fishing mortality (F) were Z = 1.31, M = 0.92, and F = 0.39. For the beach seine gear, the size at first catch of T. vitrirostris was Lc25 = 4.43 cm. The 50% retention size of the catch was Lc50 = 5.39 cm. The retention probability analyses revealed a large rate of juvenile fishing mortality (54.2%). The estimated exploitation rate (0.30) was below the maximum exploitation rate (0.48), and above the optimal sustainable exploitation rate (E50 = 0.28), evidencing a sustainable fishery. However, under such an exploitation regime, it is advised that a continuously monitoring-survey of T. vitrirostris is maintained. An increase in migration of fishermen has been recently recorded in Pebane, due to its rich fisheries, which can increase the fishing effort and the risk of overexploitation if management measures (such as mesh size increase) are not taken in advance.

1. Introduction

The Mozambique’s fisheries are divided in three subsectors: industrial, artisanal, and subsistence. The artisanal and subsistence fisheries contribute to the large amount of landings, and more than 2/3 of landings in the economic exclusive zone [1]. Small-scale and subsistence small-medium pelagic fisheries have a major socio-economic role for coastal communities, comprising an important direct protein food source [2]. The small-scale and subsistence fishing takes place both from shore and from canoes and dhow-type planked boats, mostly propelled by sails [3]), and they almost exclusively target the nearshore waters, up to 40 m depth or less [4]. Doherty et al. [5] reconstructed Mozambique catches and estimated them to be between 55,000 and 64,000 t/year in 1950s, and between 120,000 and 130,000 t/year by the late 2000s. According to the National Institute of Fisheries Research (IIP) statistics, on average, the annual catch for the period of 2003–2006 of small-scale fishes was around 40,000 t/year [6,7]). Given the great potential available in terms of small pelagic fish, it is believed that this estimated value is only what has been reported by the fisheries authorities, since most of them are not reported [1]. In fact, Mozambique has a history of high under-reporting of catches, mainly due to the illegal, unreported, and undeclared (IUU) catches from the artisanal and subsistence fishing sector. Artisanal fishermen often fish during the closed season, and in protected areas when it is not allowed [8]. In the country, there are around 120,000 fishers and 658 small-scale coastal landing sites. National fish stocks are under great pressure, and many fisheries show signs of overexploitation and the shallow coastal waters are severely overfished [1].
Most marine species, including small pelagic fish, are distributed along to the Sofala bank, characterized by an extensive and wide shallow continental shelf with a high marine biodiversity [9]. In Sofala bank, the Engraulidae catches are very abundant, and Thryssa vitrirostris is considered a particularly important fishery resource [6]. Based on spatial factors, seasonal catch rate, and demographic data from the beach-seine fishery, it is considered that the large fishery of the species in Mozambique occurs in the Sofala bank region. The core of the exploitable population is determined in Pebane, and the species seems to migrate towards the coast at the onset of the rainy season (November–February), and then northwards [6]. T. vitrirostris is a small pelagic fish that belongs to the Engraulidae family, inhabiting coastal and estuarine waters [10] and forming large schools or shoals at depths ranging from 0 to 50 m (www.fishbase.org, 9 January 2018). It distributes throughout the Indian Ocean, Madagascar and the coast of Africa from the Alfredo port to the north of the Persian Gulf, and along the coast of Pakistan and India ([11], www.fishbase.org, 9 January 2018).
According to [5,12], T. vitrirostris represents the largest source of income for most of the population that lives along the coast, as well as for the country’s economy, providing crucial social benefits to these communities. The few studies carried out in Mozambique related to this species have reported greater representation in artisanal catches, as well as in terms of bycatch in industrial and semi-industrial demersal shrimp fisheries, which represent the most frequent and most important fisheries in Mozambique, and so this aspect make this species an important source of animal protein for coastal communities, playing an important role for the diet and local economy [7,13,14].
The few studies focused on T. vitrirostris in Mozambique are: (i) the study of [14,15], which is based on data that has been collected through scientific cruises to address aspects of the biology of the species in general; (ii) the study of [16], which addresses aspects relating to temporal distribution, growth, and the reproductive biology of T. vitrirostris on Zalala beach; (iii) and lastly, the study developed by [6] that addresses the distribution and biology of T. vitrirostris and other Engraulidae along the coast of Sofala bank, western Indian ocean. This latter study is one of the main references currently, in terms of information about this species, namely concerning the analysis of the influence of fishing mortality (F), on the dynamics of the explored stock along the Sofala bank. Nevertheless, due to continuously inconsistent time series records, such as demographic data, most studies that assess T. vitrirostris are based on short-term and/or episodic data. T. vitrirostris fishing activity is socio-economically important and it assures daily livelihood incomes and food. The monthly length frequency data obtained between 2009 and 2014 by the Institute of Fisheries Research were used to determine the biological growth parameters, mortality rates, and recruitment season, and to assess the fishery exploitation status of T. vitrirostris.

2. Results

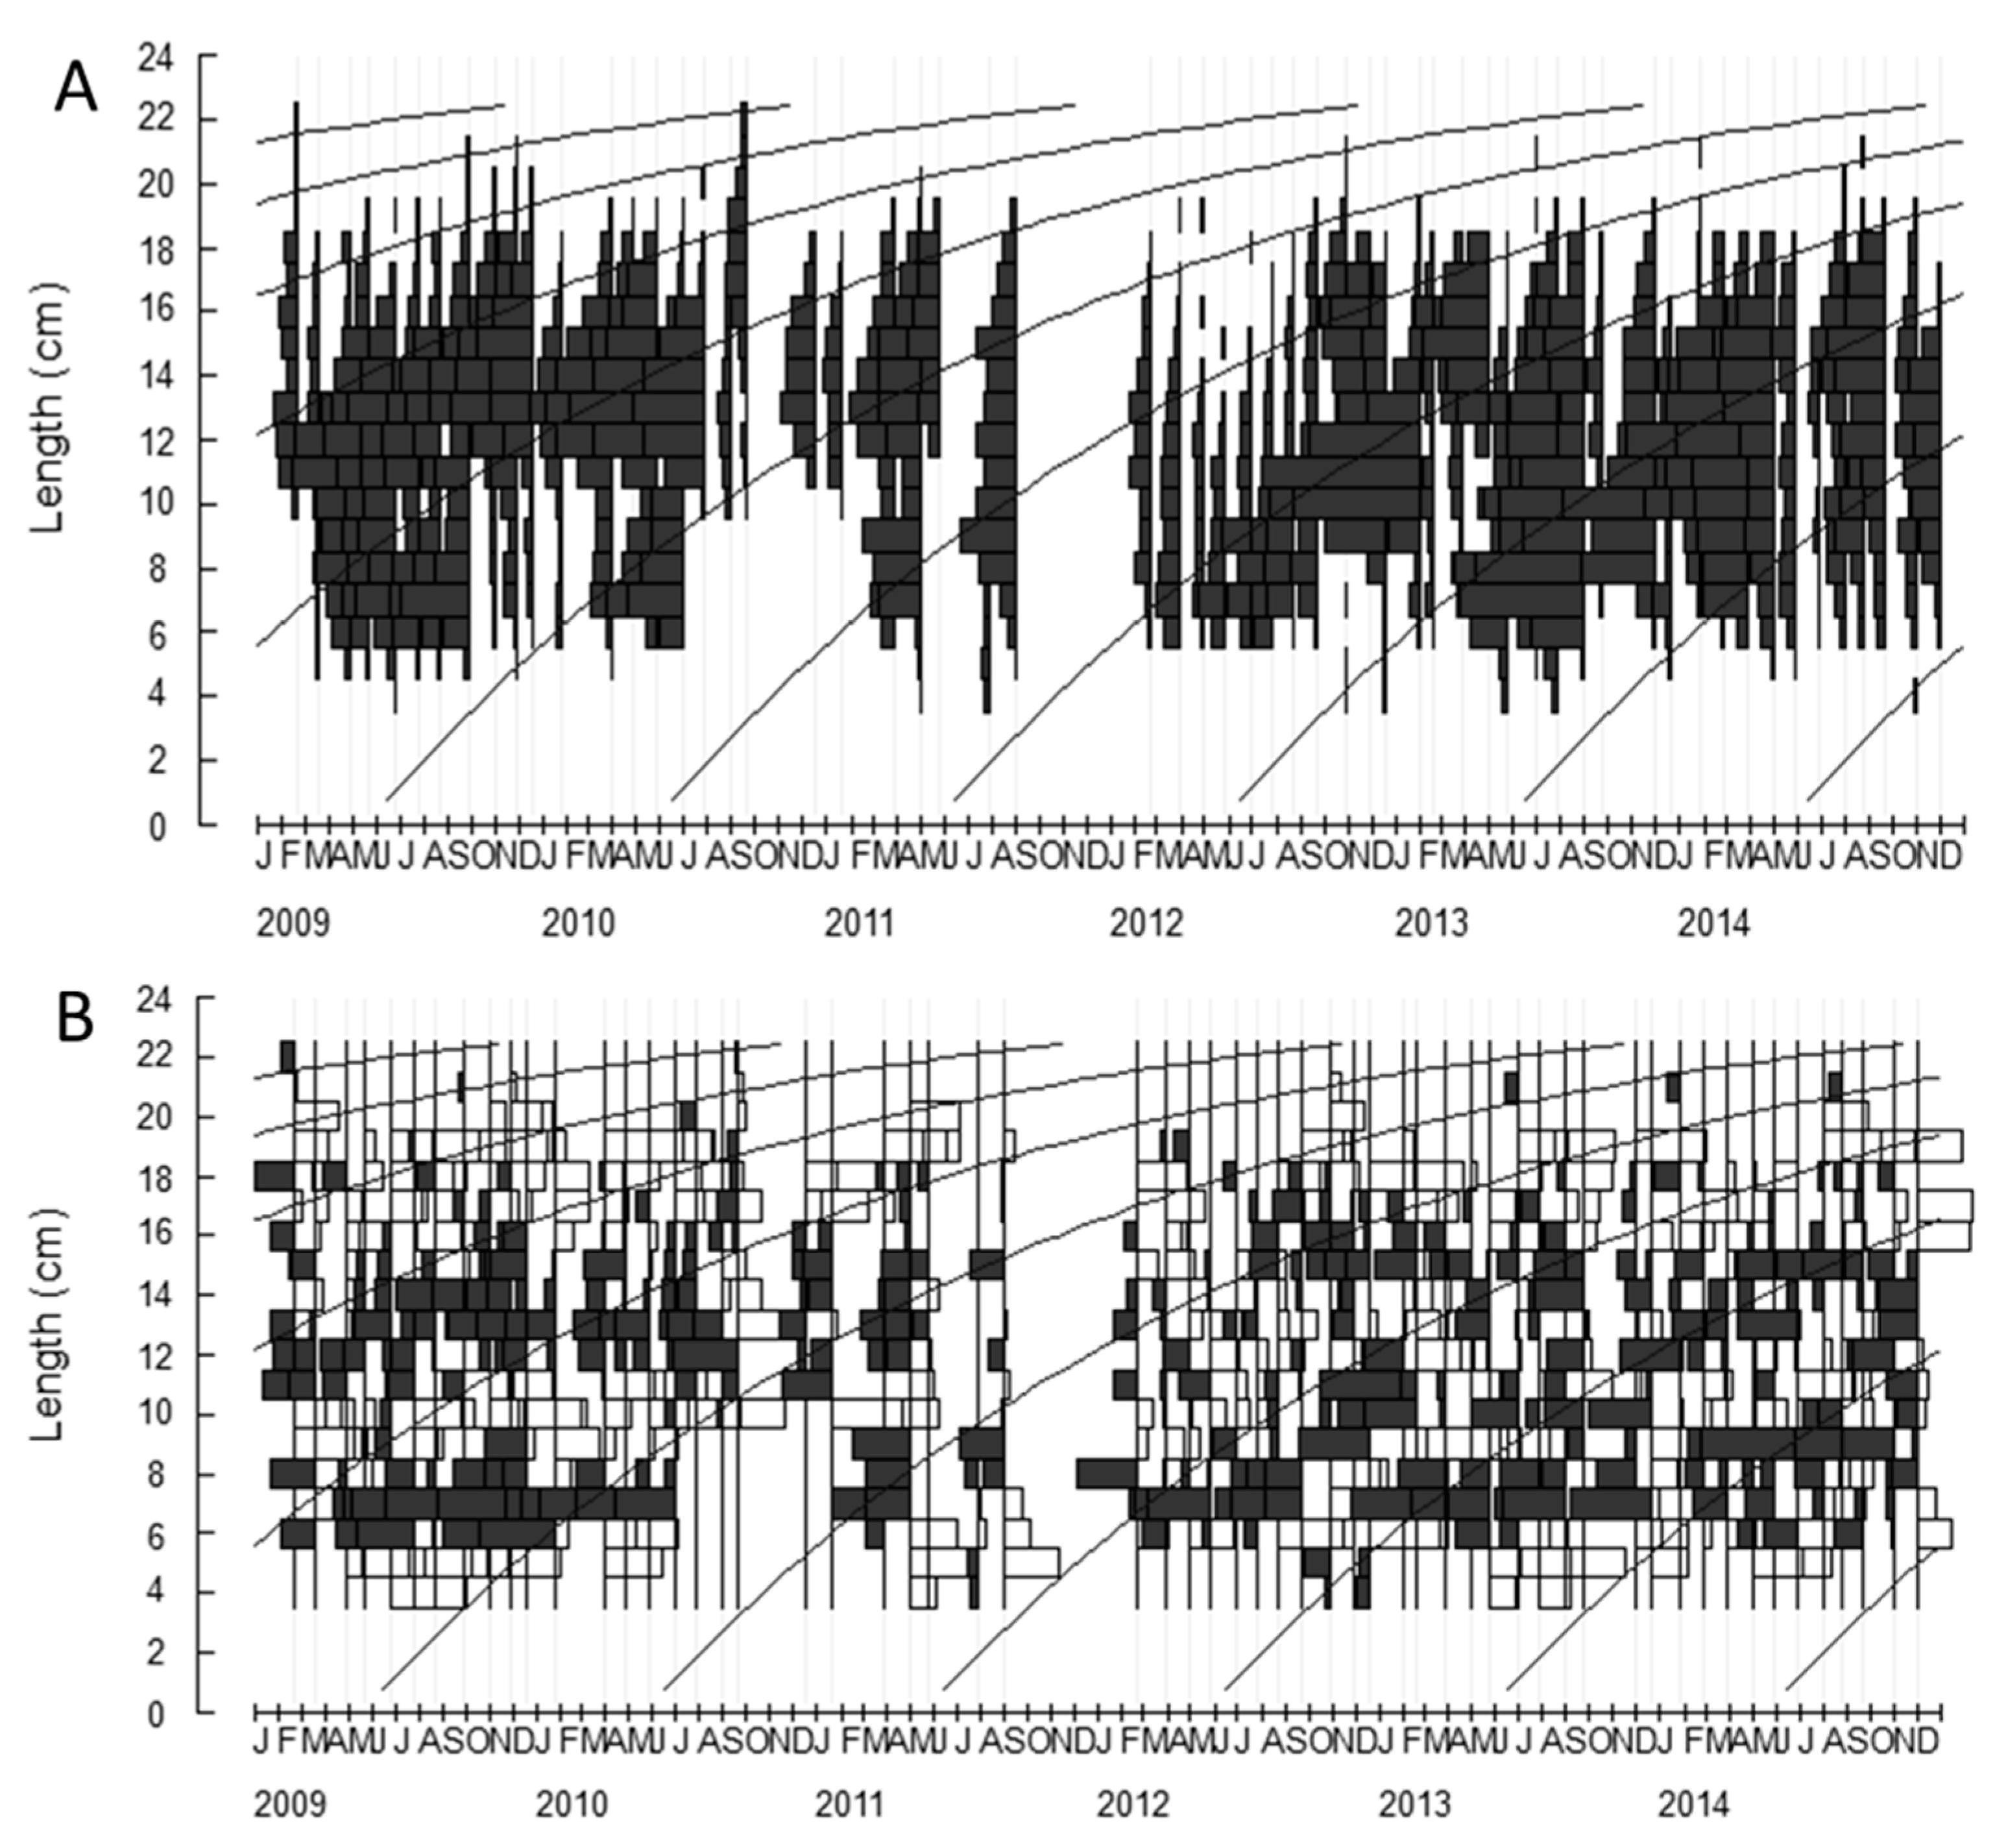
2.1. Growth Parameters

The minimum and maximum length-classes were 4 and 25 cm. The asymptotic length (L) values required to seed the Von Bertalanffy Plot (VBP) estimated by the different techniques are given in Table 1.
The L, used for “seed” in the VBF equation, was estimated in Electronic Length-Frequency Analysis (ELEFAN) using the response surface routine. As given in the Table 1, the estimated (L) was L = 25.1 cm. The instantaneous growth rate (K) was K = 0.41 year−1 (goodness of fit: Rn = 0.15). The monthly von Bertalanffy growth curve of T. vitrirostris was superimposed over the normal length frequency histograms and over the restructured length frequency histograms (Figure 1).
The analyses of the VBF histogram revealed several cohorts along the year. Overall, six cohorts were observed across years (Figure 2). The length-classes between 12 and 15 cm comprised most of the catches (32.52%), with the length-modal class set at 13 cm (Figure 2).

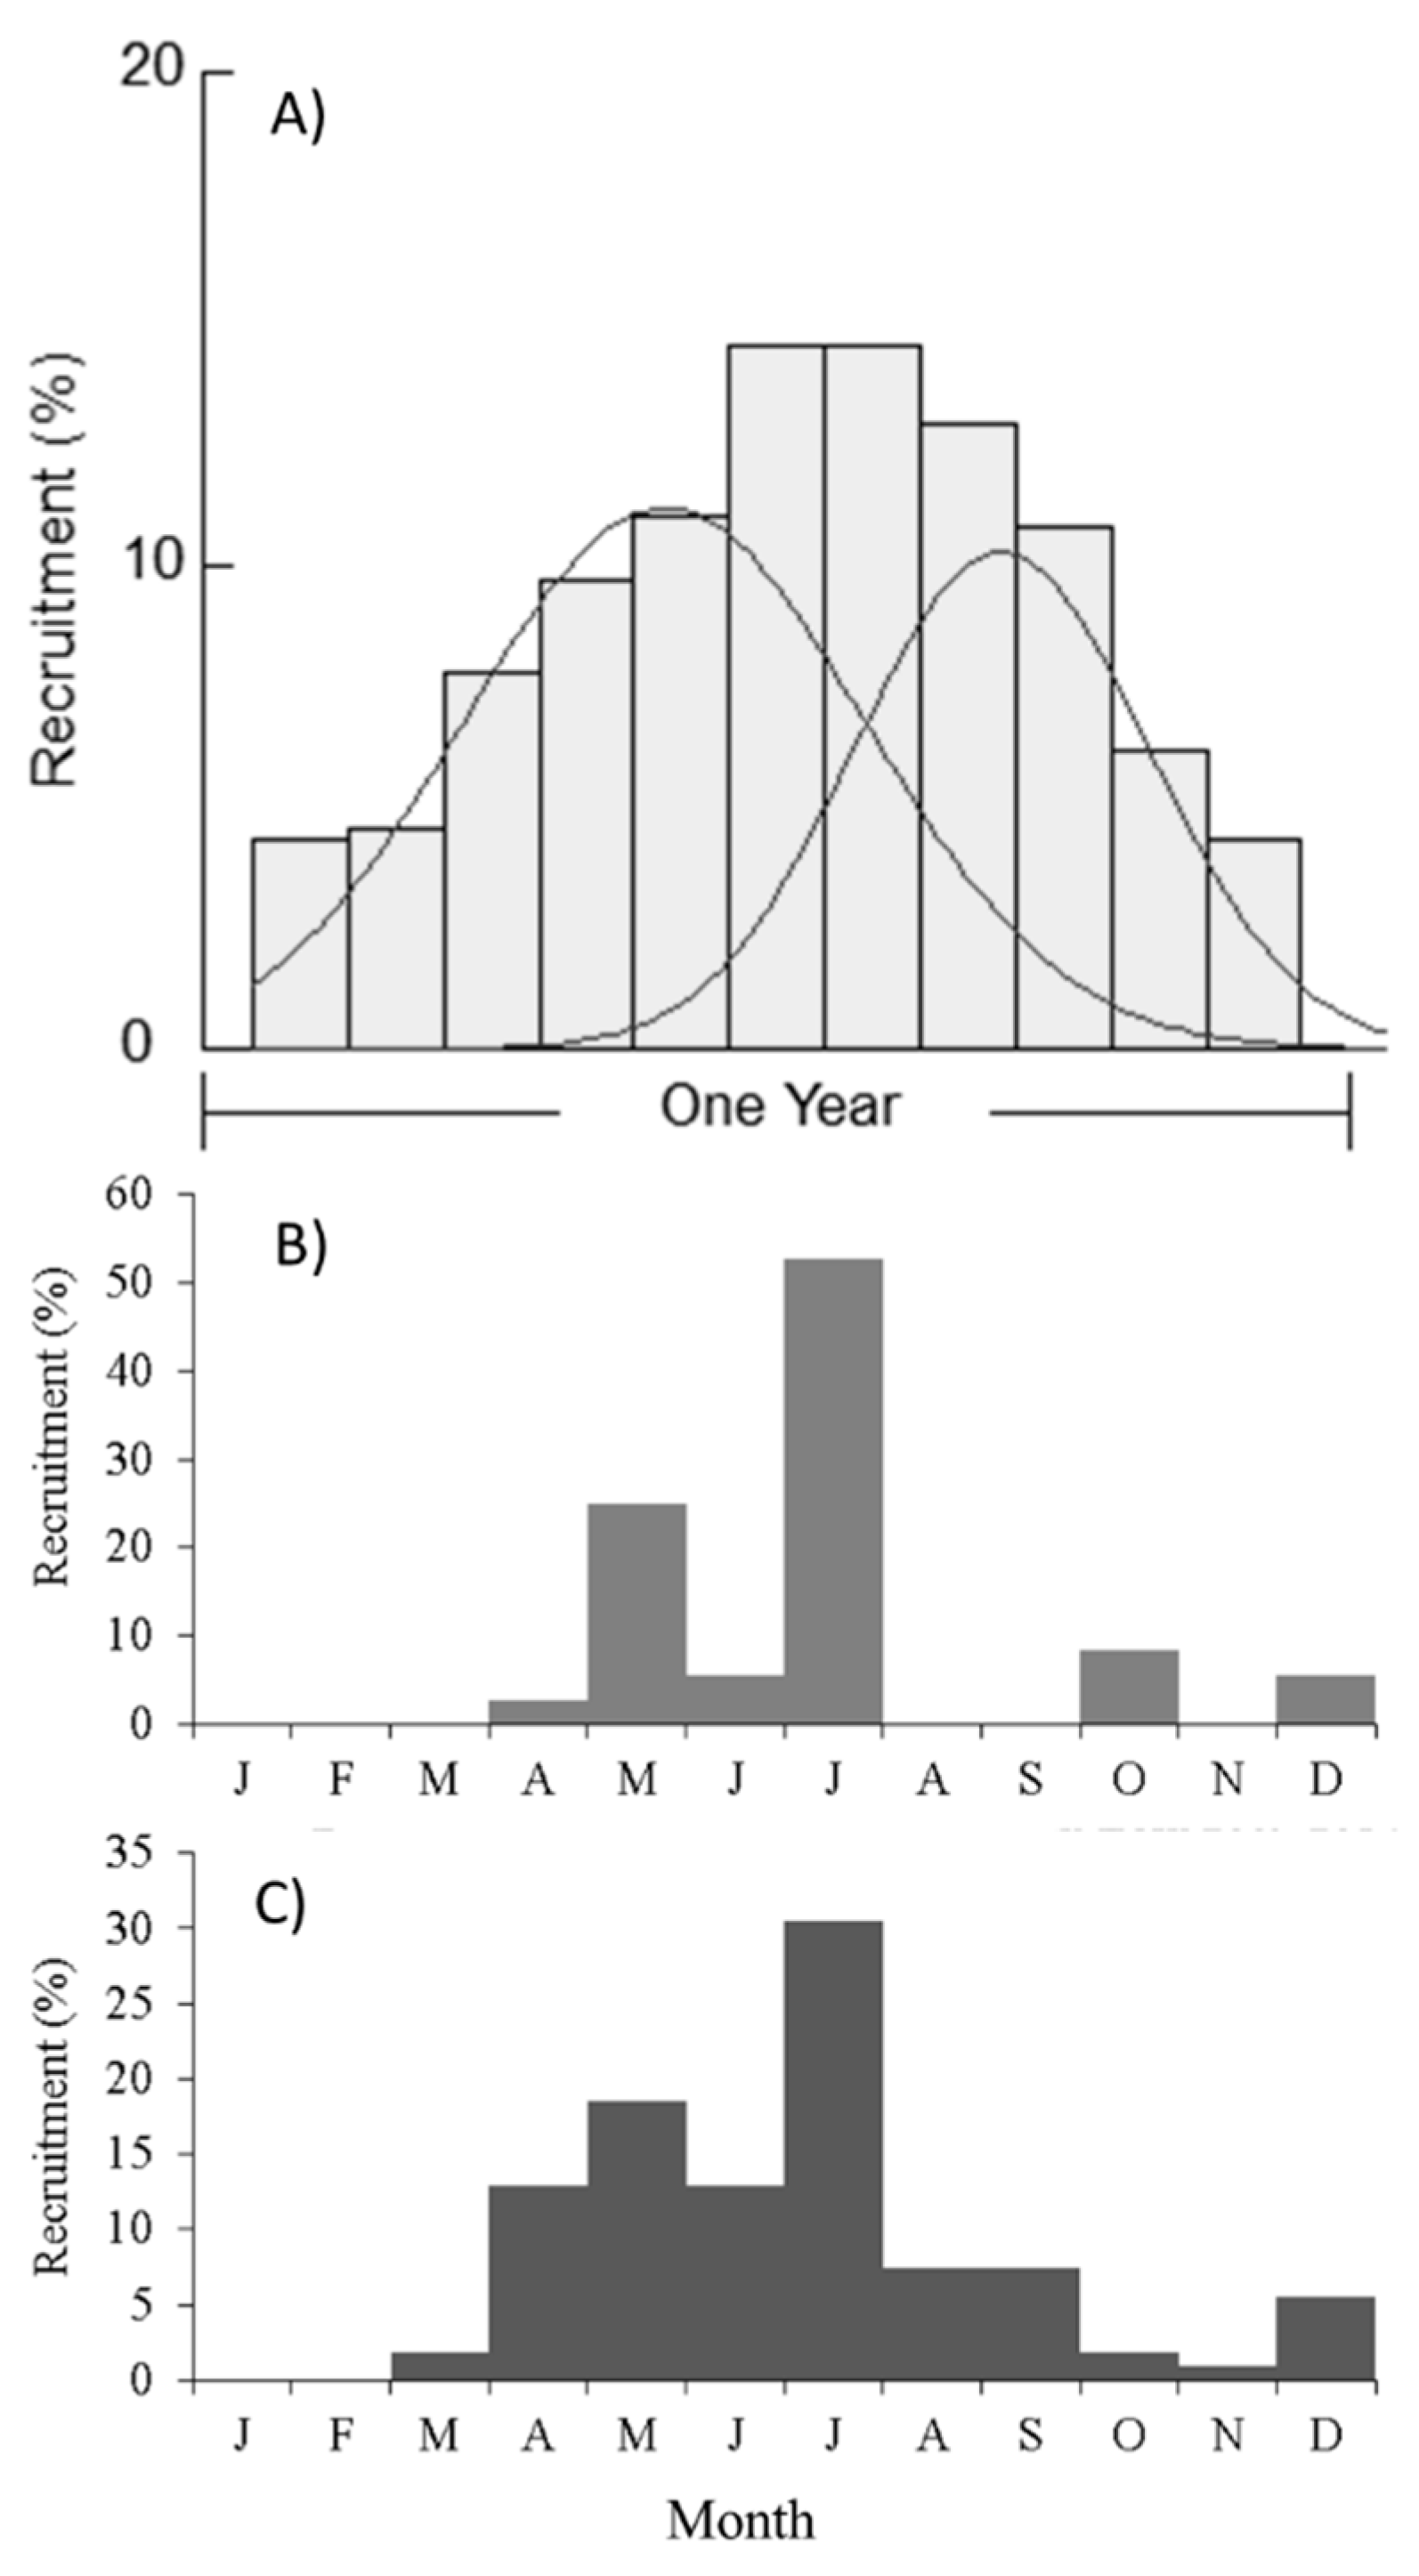
2.2. Recruitment Patterns

According to the recruitment pattern analyses, the species had two peaks of recruitment over the year. The analyses of the recruitment pattern (Figure 3A), together with length frequency histogram observations (black slices in Figure 1B) revealed that the first peak of recruitment occurred from April to July, and the second recruitment peak from August to October. The analyses of the percentage of recruits of young of the year (4 and 5 cm) revealed a peak in May and in June (Figure 3B,C).

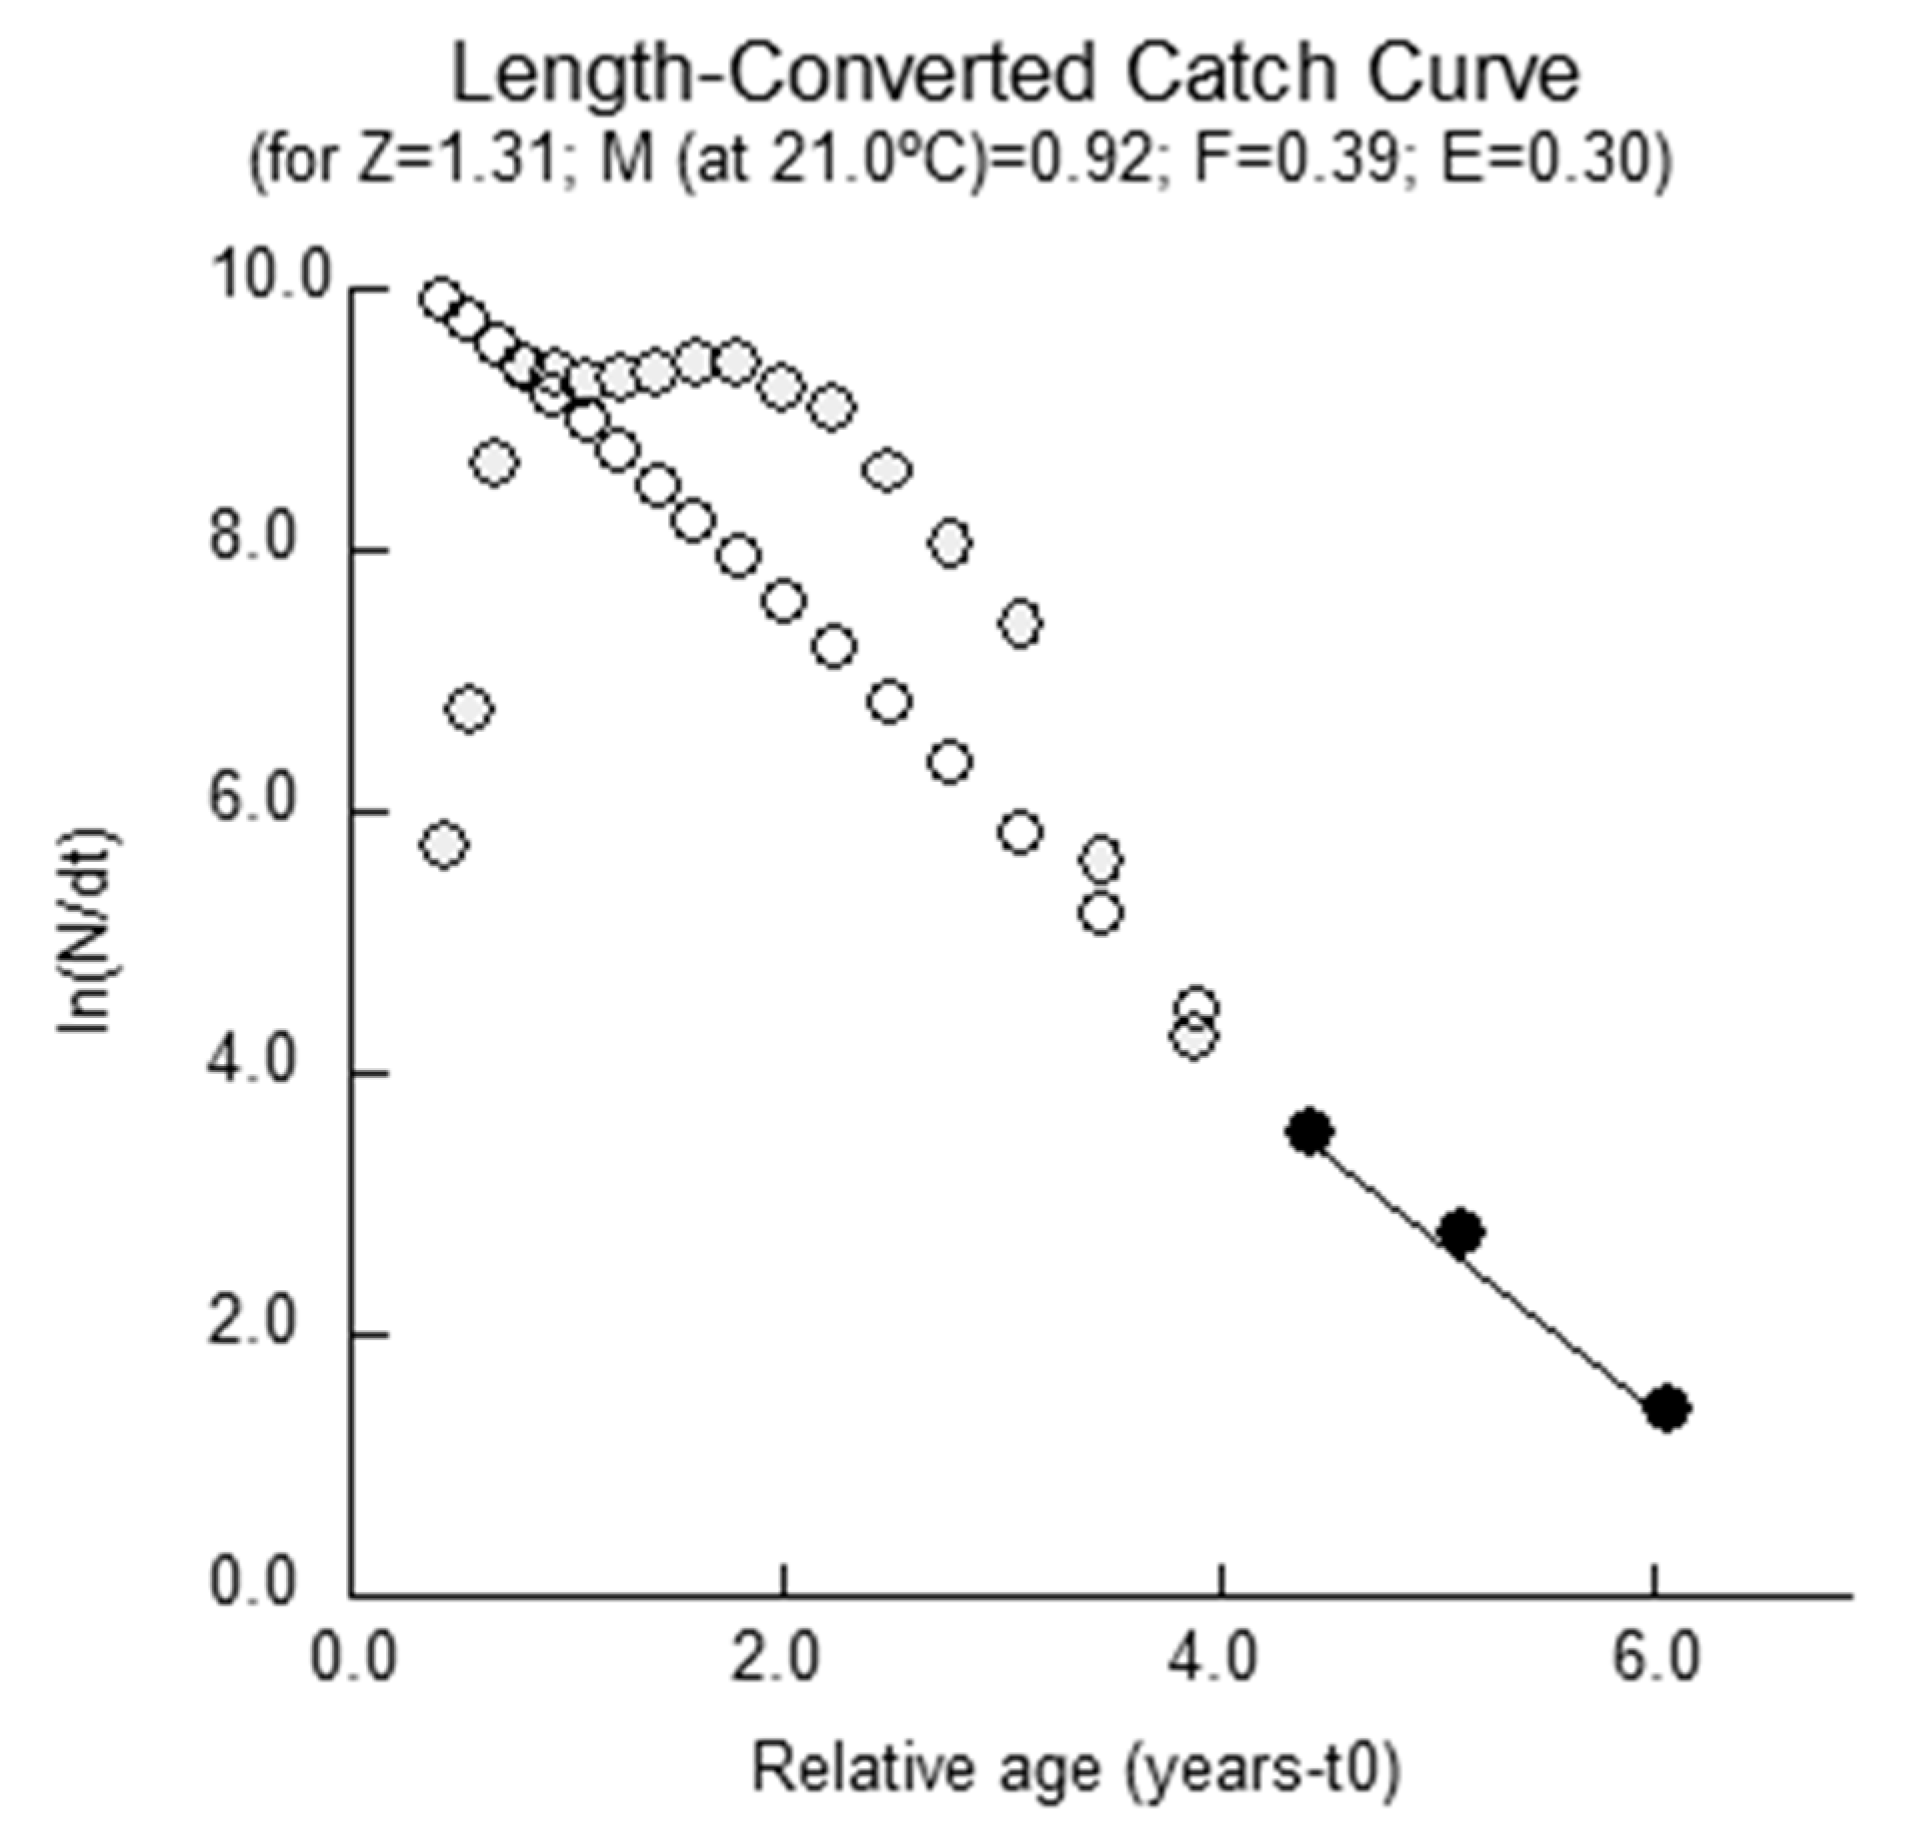
2.3. Mortality Parameters

The instantaneous total mortality (Z) rate, determined with the length-converted catch curve, estimated a mortality rate of Z = 1.31 year−1 (Figure 4). The current fishing exploitation rate estimated (Eest.), derived from the analysis of mortality rates, was Eest. = 0.30. The estimated instantaneous natural mortality (M) coefficient was M = 0.92. The determination of the instantaneous fishing mortality coefficient (F) was F = 0.39.

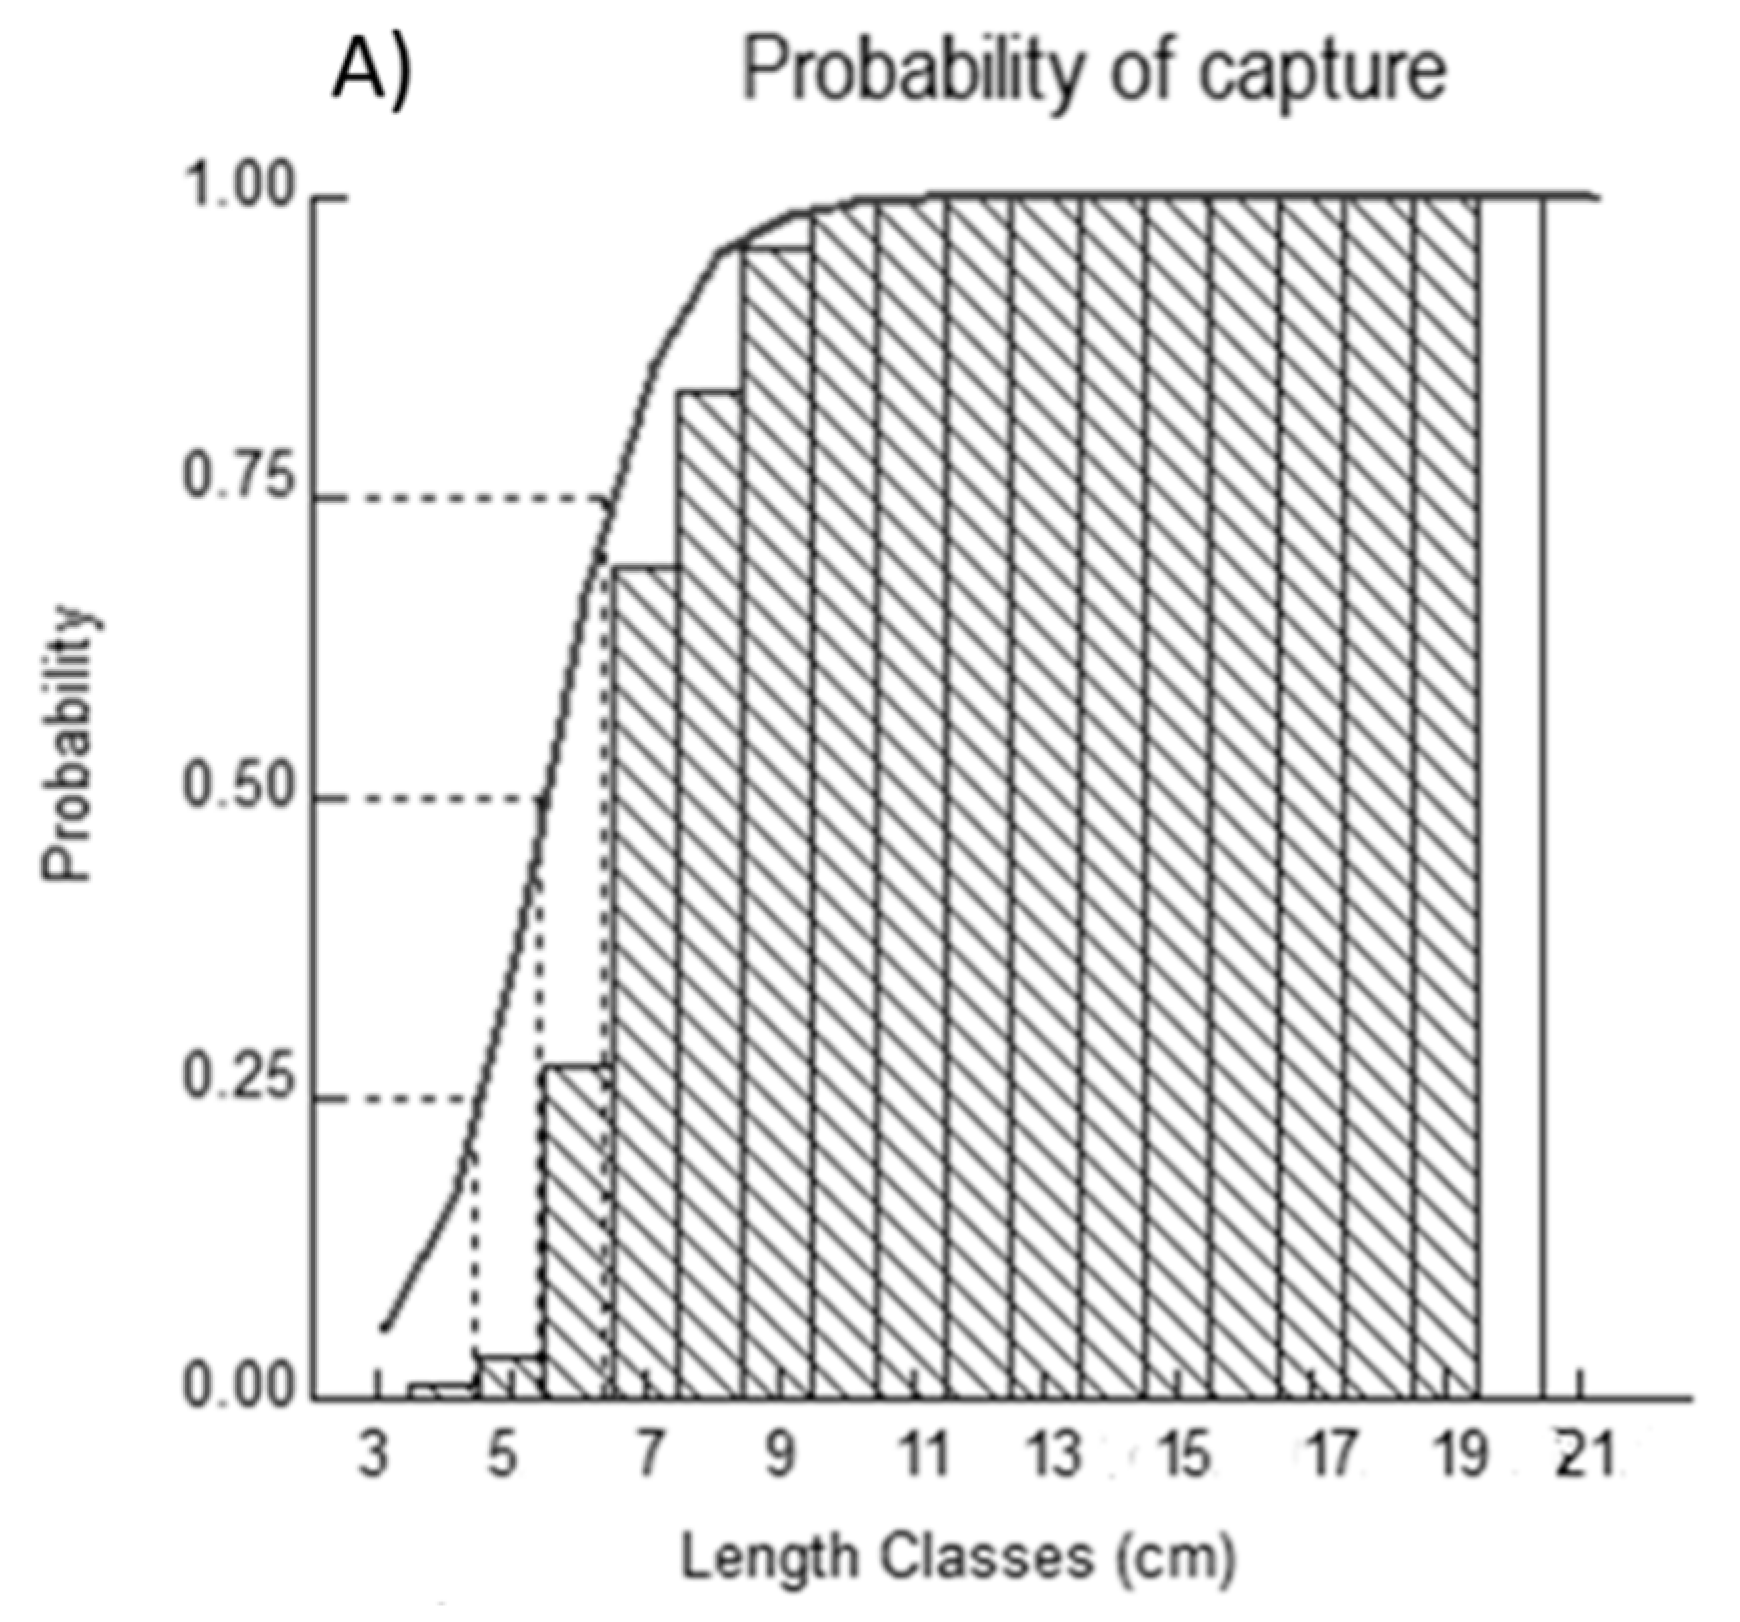
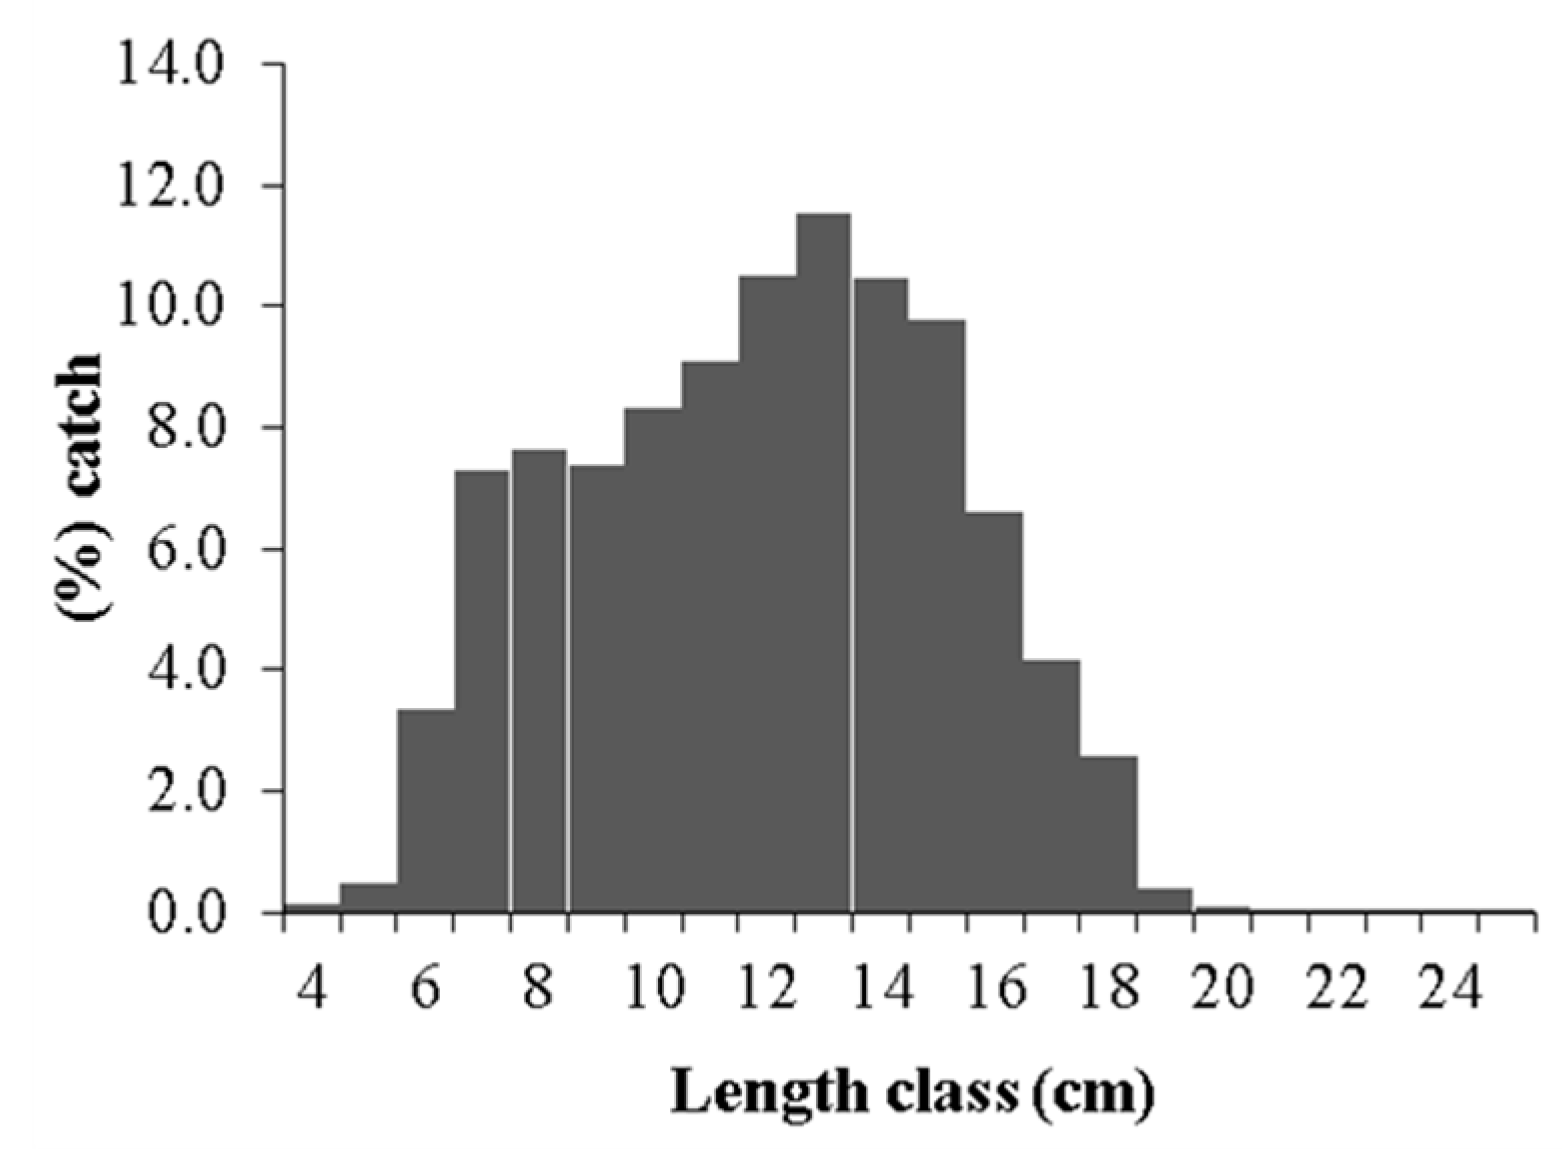
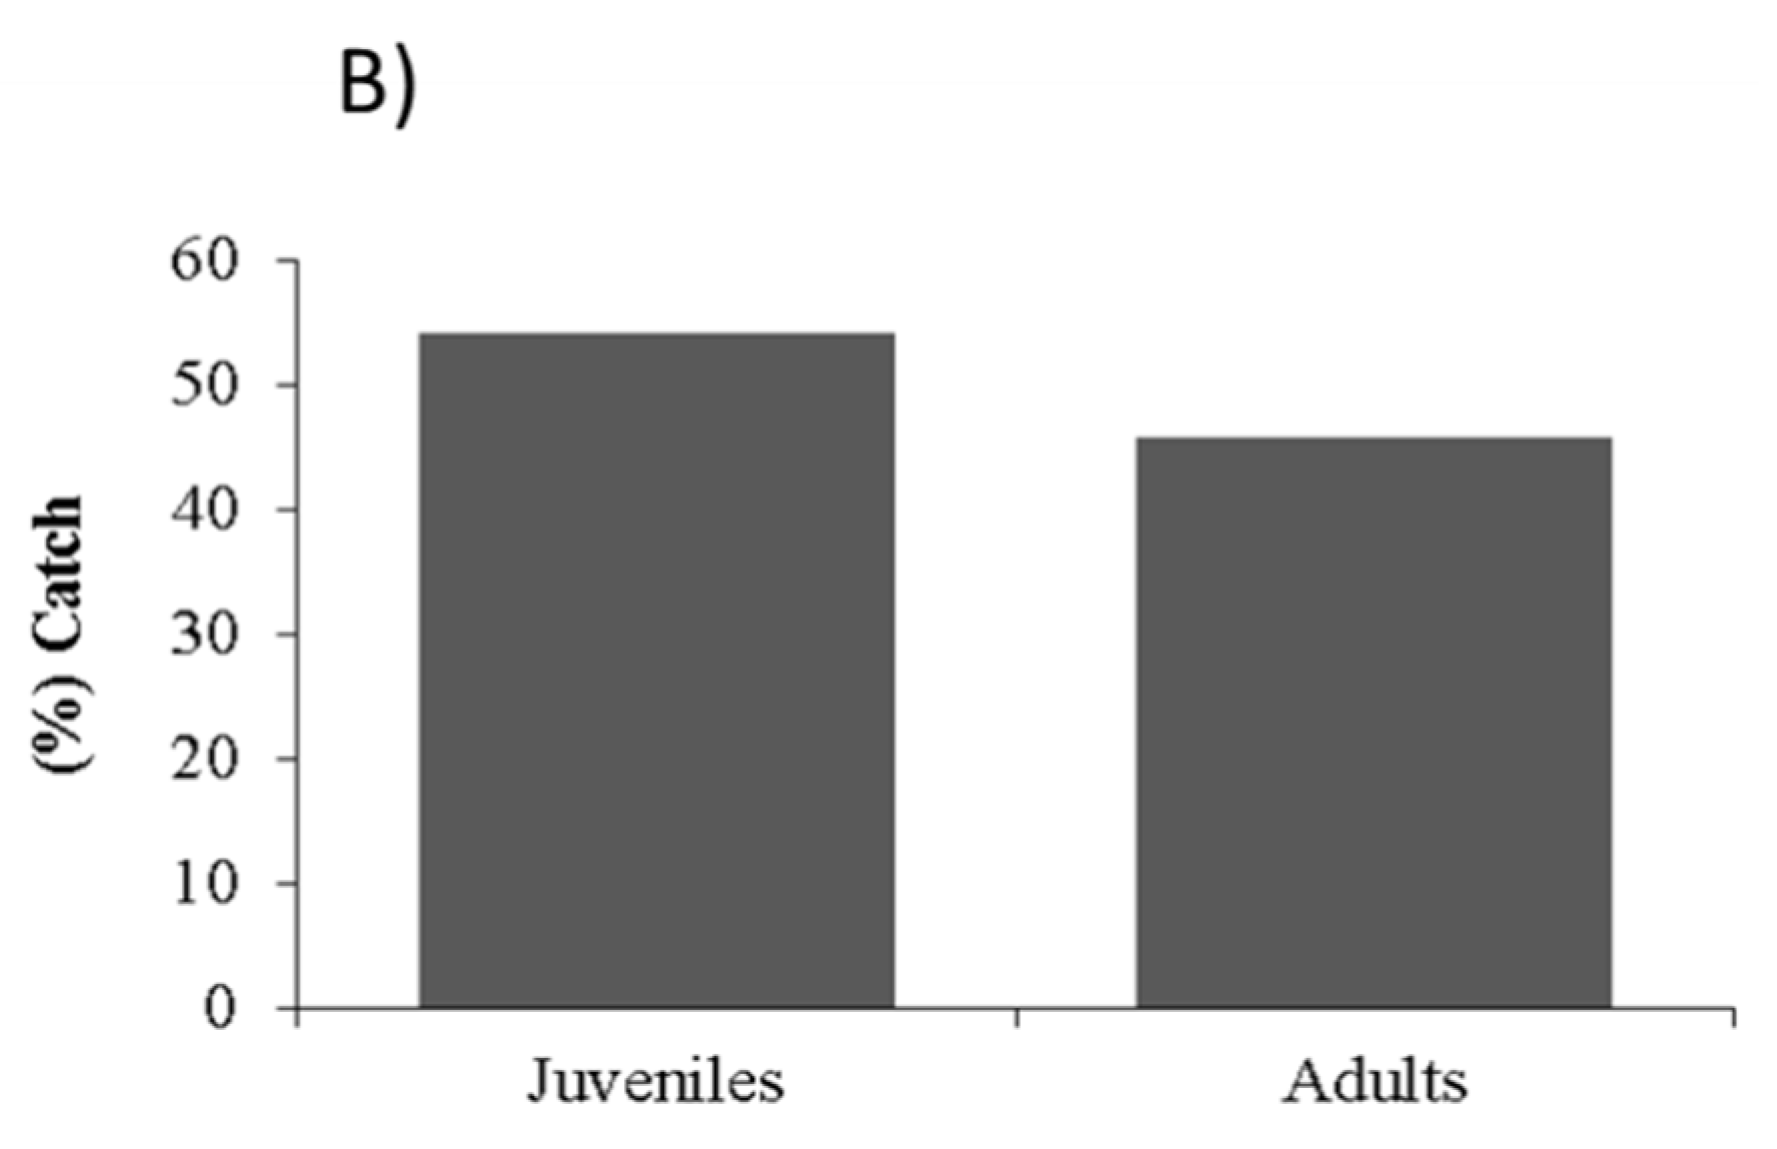
2.4. Probabilities of Capture

The length at the first catch (Lc25) and the length at which the probably of 50% (Lc50) and 75% (Lc75) of individuals are captured by gear, determined through the cumulative probability of capture, (Figure 5) were the following: Lc25 = 4.43 cm, Lc50 = 5.93 cm, and Lc75 = 6.35 cm. The percentage of juveniles (length-classes < 13 cm) comprised 54.2% of the catches, while adults were 45.2%. No statistically significant differences in yearly percentage in number average, were observed (t-test: t = 0.95; df = 5; p = 0.384) between juveniles and adults.

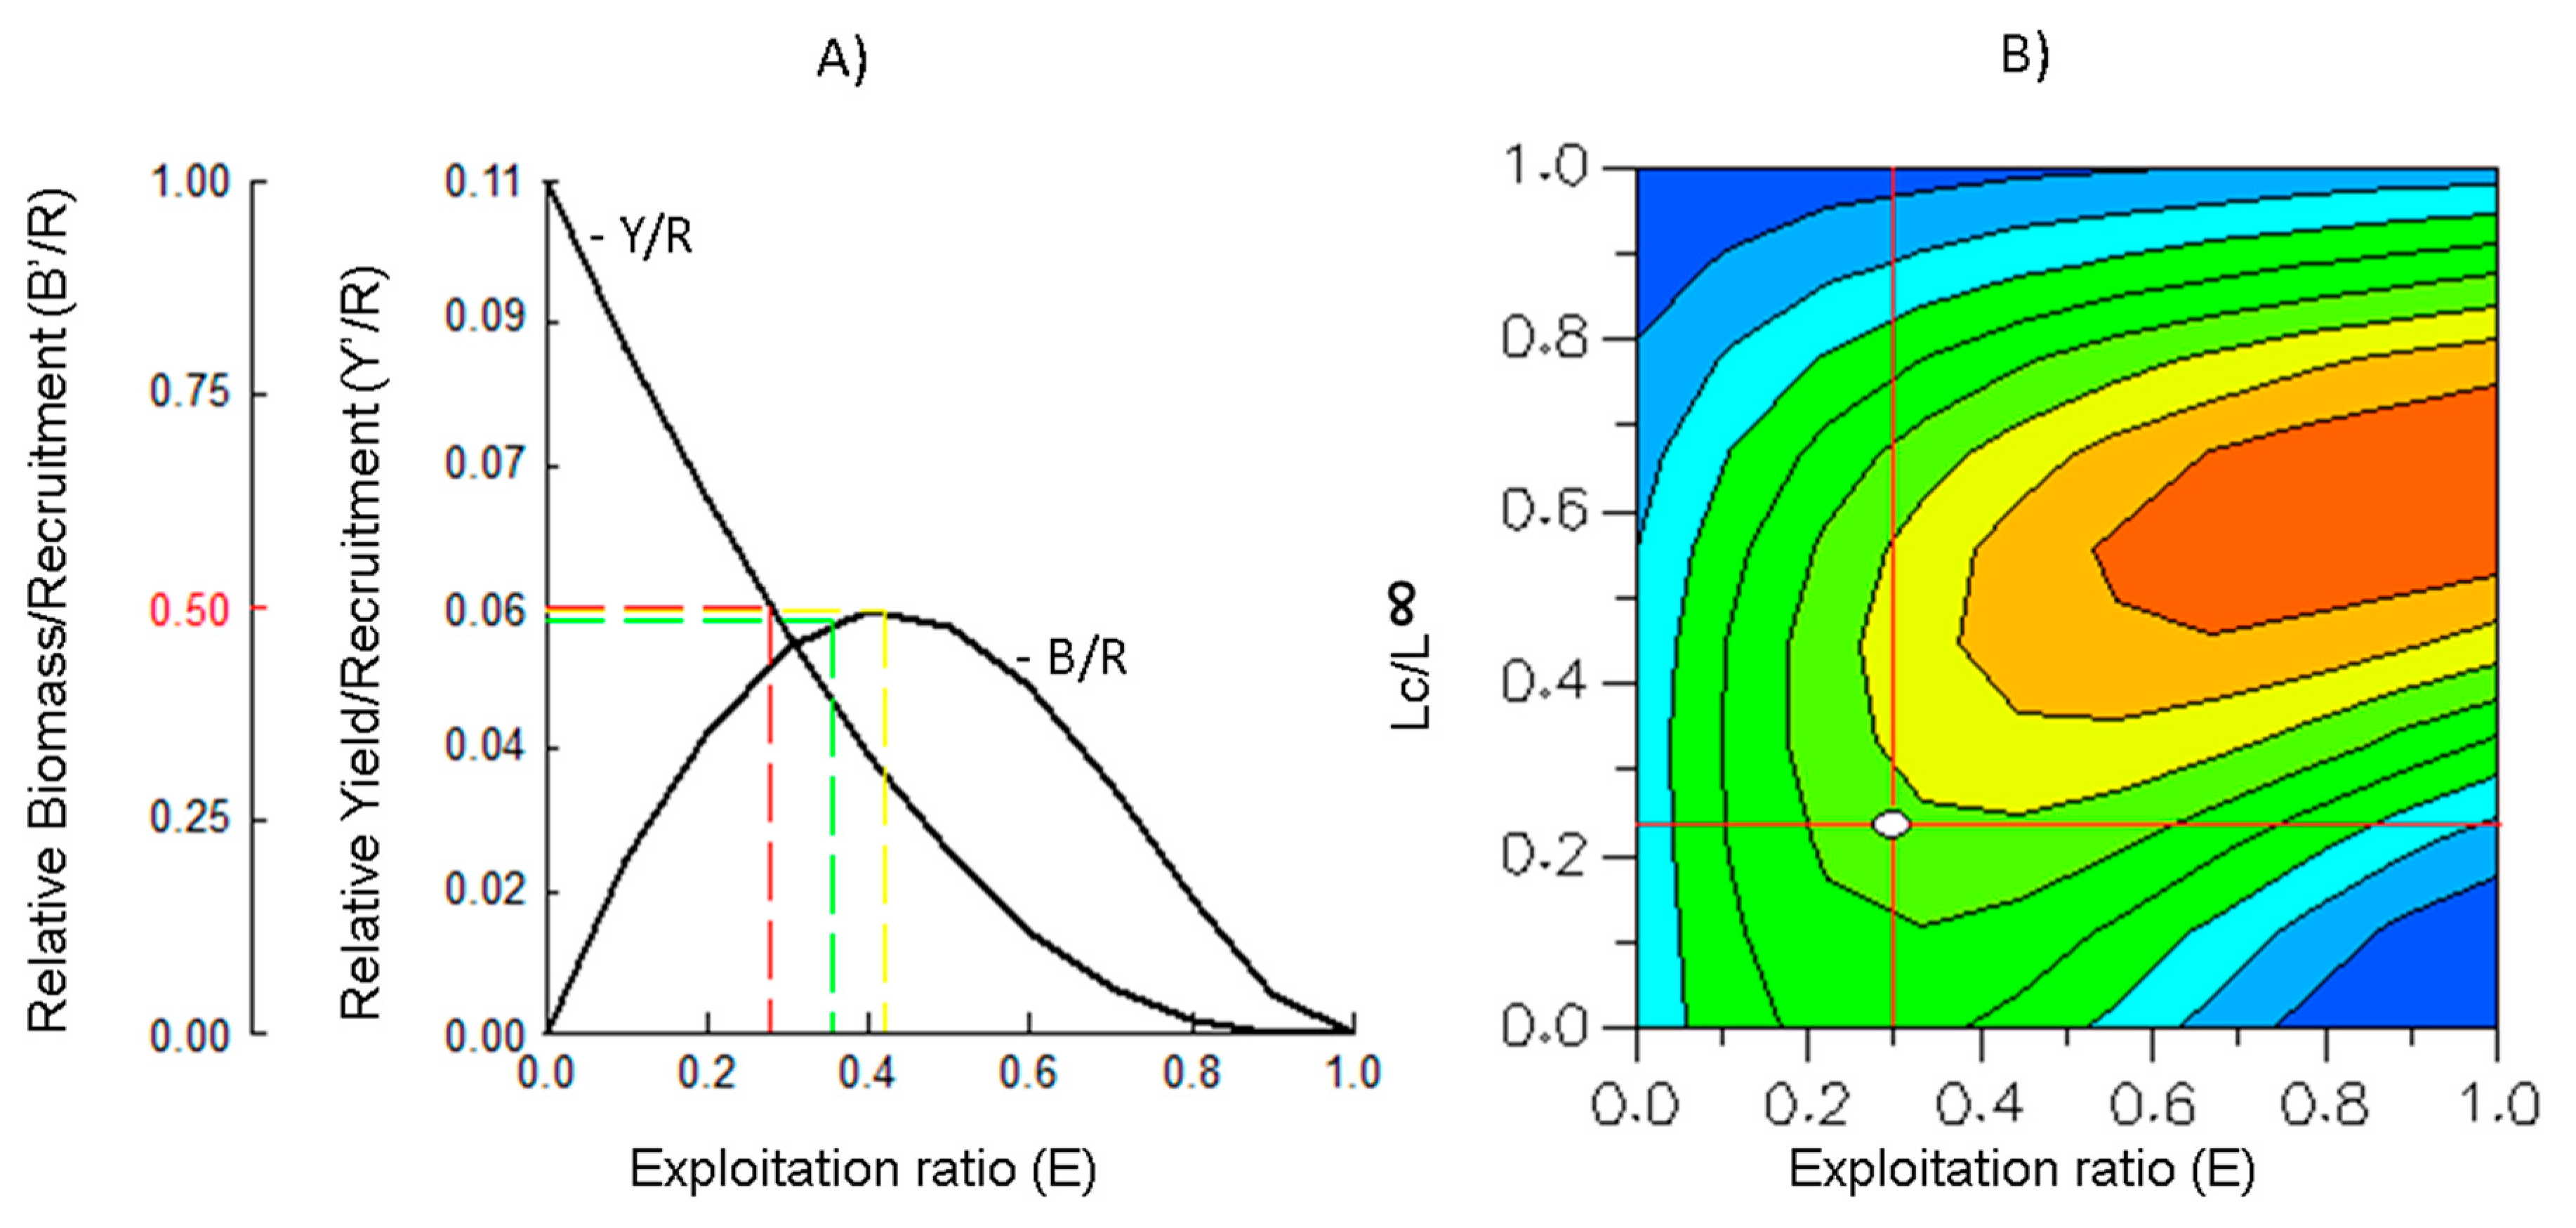
2.5. Relative Yield per Recruit (Y’/R) and Relative Biomass per Recruit (B’/R)

As fishing exploitation increased relative yield per recruit (Y’/R) decreased (Figure 6). The Beverton and Holt relative yield per recruit (model Figure 6) estimated: E10 = 0.40, E50 = 0.28, Emax. = 0.48 (Figure 6A).

2.6. Yield Isopleths

The estimated Lc/L ratio for the currently estimated exploitation regime (Eest.) was Lc/L = 0.24.

3. Discussion

The Mozambique coast is subject to intense fishing pressure by artisanal fishing [1]. Generally, no scientific information is available to support fishery management or ecosystem ecological-based management, with consequent socio-economic and biodiversity impacts. This increases the impact of a rise in poverty, under the current scenario of an increase in population along estuarine and coastal areas [17]. The analysis of length-frequency data is a reliable way to obtaining information regarding fishery status in tropical areas, and in underdeveloped poor countries where continuously monitoring programs often fail. Therefore, this study can contribute to support fishery management and sustainability of one of the most important small-pelagic subsistence/artisanal coastal fisheries, and consequently quality of life (socioeconomic) in the region. To the authors’ knowledge, the monthly time-series used in this study was one of the largest datasets available for Thryssa vitrirostris (Engraulidae) for stock status assessment. As no discards were observed, we considered that the landings were representative of total catches.
To obtain a reliable estimate of growth and biological parameters of the population, the suitability of length-frequency data must be ascertained. The raw length-frequency data should exhibit peaks with apparent shifts in modal length over time [18,19]. As revealed by yearly length-frequency monthly plots, the data met these criteria. The estimated growth parameters (L = 25.1 cm; K = 0.41) differed from those found in a nearby beach at Zalala (L = 22.26; K = 0.44; [19]), and in grouped data of Sofala bank (L =19; K = 0.66; [6]), with the asymptotic length being markedly higher, while the growth rate was lower. According to [20,21], the asymptotic length (L) was basically influenced by food availability and population density, while the growth rate (K) was a parameter that was dependent on genetic and physiological factors, which can vary according to environmental fluctuations.
Environmental conditions, and namely, sea surface temperature (SST) can affect fish growth and recruitment, namely in small pelagic species [15,22,23]). According to [24], oceanographic conditions, such as SST, upwelling, current regimes, and wind conditions at Pebane and nearby areas (present study) were similar to environmental conditions recorded in other fisheries studies in the region [19,24]. Thus, biological parameter differences (L and K) estimated among studies should not be related to putative environmental causes.
Previous studies on the biology of T. vitrirostris [19,24] were based on episodic length frequency data collected through discontinuous years and/or areas. In the present study, the observed maximum length-class sampled was 25 cm, which was close to the L estimations. Thus, we believe that the growth parameter estimated in the present work, using continuous monthly surveys, can contribute to enhancing the knowledge of the species biology and support Mozambique fisheries managers. The L value estimated corresponded to an increase in previous maximum L off 2.5 cm in northeastern Mozambique [6,19]. However, comparing to [13], the L herein estimated was 0.7 cm below the L value estimated in the Maputo region (Southeaster Mozambique). According to [21], the asymptotic growth (L) and growth rate (K) parameters were inversely related, which means that the greater the asymptotic growth (L), the lower the growth rate (K), and the higher the growth rate (K), the smaller the asymptotic growth. Overall the L value was higher than in other studies conducted in northeastern Mozambique, while the growth rate value (K) was lower [7,19]. The scientific cruise of [13] was conducted with a pelagic trawl. The range of the length-size in [25] did not include length classes below 8 cm, nor higher than 22 cm. The size of the trawl mesh was not mentioned in the report, although we can assume (as standard in a scientific survey) that a small mesh size was used in the cod end. Thus, it is a little speculative to debate whether the growth parameter differences among studies are due to fishing gear, since gear selectivity and fish size retained are linked. However, environmental conditions were conservative. Therefore, we cannot exclude the probability that gear or fishing technique differences could explain the regional differences in parameter estimations.
The estimated mortality rates in northeastern Mozambique (Z = 1.31, M = 0.92 and F = 0.39) were also different from those found by [26] (Z = 2.30, M = 1, and M = 1.5), with the M value depending on the method used by the authors, respectively. Consequently, fishing mortality (F) estimated based on the difference between F = Z − M would be 1 and 0.8 for each M value estimated by [26]. Therefore, it can be questioned why growth rate (K) and mortality rates in the present study are lower than recorded elsewhere in other close areas (for instance, mortality rate values were almost at half, compared to similar studies). The observed differences may be associated with the methods that were used to analyze the size-classes frequency data and the range size of the length across studies. For instance, [26] estimated mortality using Monte Carlos simulations (to cope with scarce data), while in the present work, a six year monthly size-class time-series dataset was used. Another reason can be also linked to the data acquisition areas/surveys. [26] sampled offshore areas and pooled demographic information (inshore and offshore) for the estimation of biological parameters and stock assessment models, including mortality rate. Nevertheless, the observed maximum length found by these authors and [19] were lower than those found in this study. In fact, the demography differences found among studies are considerable, with modal length-class values of the present study being higher comparatively to former studies. Therefore, new estimates of mortality achieved are more accurate, because the monthly data have captured a more complete population size distribution.
VBF analysis clear showed several cohorts over the year. In fact, the monthly modal progression analysis represented by histograms reveals a clear upward trend in the growth of the observed cohorts. This is related to the growth rate profile in tropical areas, which is continuous throughout the year, whilst in temperate areas, the growth rate shows a seasonal trend [27,28,29]. According to [26], the main spawning activity of T. vitrirostris extends from November to January, and July to August. However, latter study does not cover all of the months in the year. In the present study, the recruitment analysis based on species demography matches the results obtained by [26] regarding the species recruitment season. The recruitment analysis showed two clear proxies recruitment peaks: the first peak of recruitment occurs from April to July, and the second recruitment peak from September to October. The ontogeny period of small pelagic larvae species is considered to be short [30], with the warm temperatures contributing to reduce the larvae stage duration [31]. Considering a lag among spawning periods, larvae growth, and the fishing recruitment of young of the year fish (length-classes of 4–5 cm), a time lag of 1.5 to 2.5 months between spawning and fish gear recruitment can be determined.
The natural mortality rate (M) was higher than the fishing mortality (F), when it was partly expected to be the opposite trend if the schooling social behavior of species that form groups, making them more vulnerable to fishing mortality, was accounted for. However, natural mortality is related to the biological characteristics of the species [32]. Small pelagic fish species usually present a fast growth and a relatively short life cycle and higher natural mortality. The tropical fish tend to have high natural mortality rates (M) in relation to fishing mortality (F), with the natural mortality (M) not evidencing any relationship with the asymptotic size (L) or the growth rate (K) [27,33]. This can be related to the fact that, unlike fishing mortality, natural mortality is associated with predation and diseases, two factors that are not related to the age of individuals [33].
The probability of capture analysis recorded a standard selectivity logistic curve for purse seine fisheries. In fact, more than 50% of undersized fish are retained above the 6 cm size-class. Considering the size of first maturity is 13 cm [26], our results showed a large juvenile mortality for beach seine gear. The percentage of juvenile fish in catch (size-classes) comprises 54.2% of the catches. According to the current fishing legislation the allowable minimum mesh size to beach seining net used to capture this species is 30 mm. For this mesh size the estimated first capture length was Lc = 4.43 cm and the retention size of 50% of the capture is Lc50 = 5.39 cm. Thus, the mesh size used may be inadvisable to exploit the resource if we consider that the first maturation size is 13 cm, which is much larger than the size of the Lc50, indicating that it is necessary to adapt the biology of the species (maturity size) to the selectivity of the fishing gear.
The estimated fishing exploitation rate value (Eest. = 0.30) was below the Emax. value (Emax. = 0.48) but above the optimal exploitation rate value (E50 = 0.28). This means that the exploitation pressure is above the value of E under which the stock has been reduced to 50% of its unexploited biomass. According to [32,33], a fishing stock is considered to be at a sustainable exploitation level when the exploitation rate does not exceed 50% (E50), the point at which natural mortality (M) and fishing mortality (F) are at equilibrium. Recent studies confirmed significant increases in the number of fishing gear and fishermen into Zambézia Province, Pebane, due to higher fishing yields expected to be obtained in this area [6]. So, some concerns arise from the future of T. vitrirostris artisanal fishing exploitation regimes in Sofala bank, namely in Pebane, an area where species forms a single demographic population and where the core of the exploitable population is found [6].
Along Mozambique coastal fishing communities, T. vitrirostris is captured with beach seine, and no discards occurs. Thus landings are representative of the catch. The fishing gear has low selectivity, as shown by the analysis of the capture probability. It is generally recognized that in areas where food security is poor, fisheries tend to be overexploited and too high a proportion of juveniles are caught, placing populations at risk. Yet T. vitrirostris population seems healthy and sustainably produces recruits and catches. Such results are related with fishing exploitation regime. However, considering the Eest. = 0.3 and Lc/L = 0.24 values, the production rate falls in a exploitation regime that requires some concern on the part of the fishery managers [34], namely, continuously monitoring of the fishery to ensure maintained fishing mortality rate at a steady state. Another concern is the amount of catches under small mesh sizes that can increase the risk of overexploitation [34]. If fishing managers considered maintaining the fishing exploitation rate as it stands (Emax. > Eest. > E50), an increase in mesh size can be enforced in advance as a precaution management approach aiming directly at reduce fishing mortality. In several parts of the world, small pelagic species under continuous stock assessment and enforced regulations have been reported to be at biological risk, due to high exploitation levels [26,35]. Taken together, and considering the socio-economic importance of T. vitrirostris, the currently exploitation regime might require the implementation of management measures to avoid biomass reduction to unsustainable levels. At the current exploitation stage, it is essential to continue with monitoring surveys and evaluate the risk associated with fishing effort increases as fishing precautionary approaches.

4. Materials and Methods
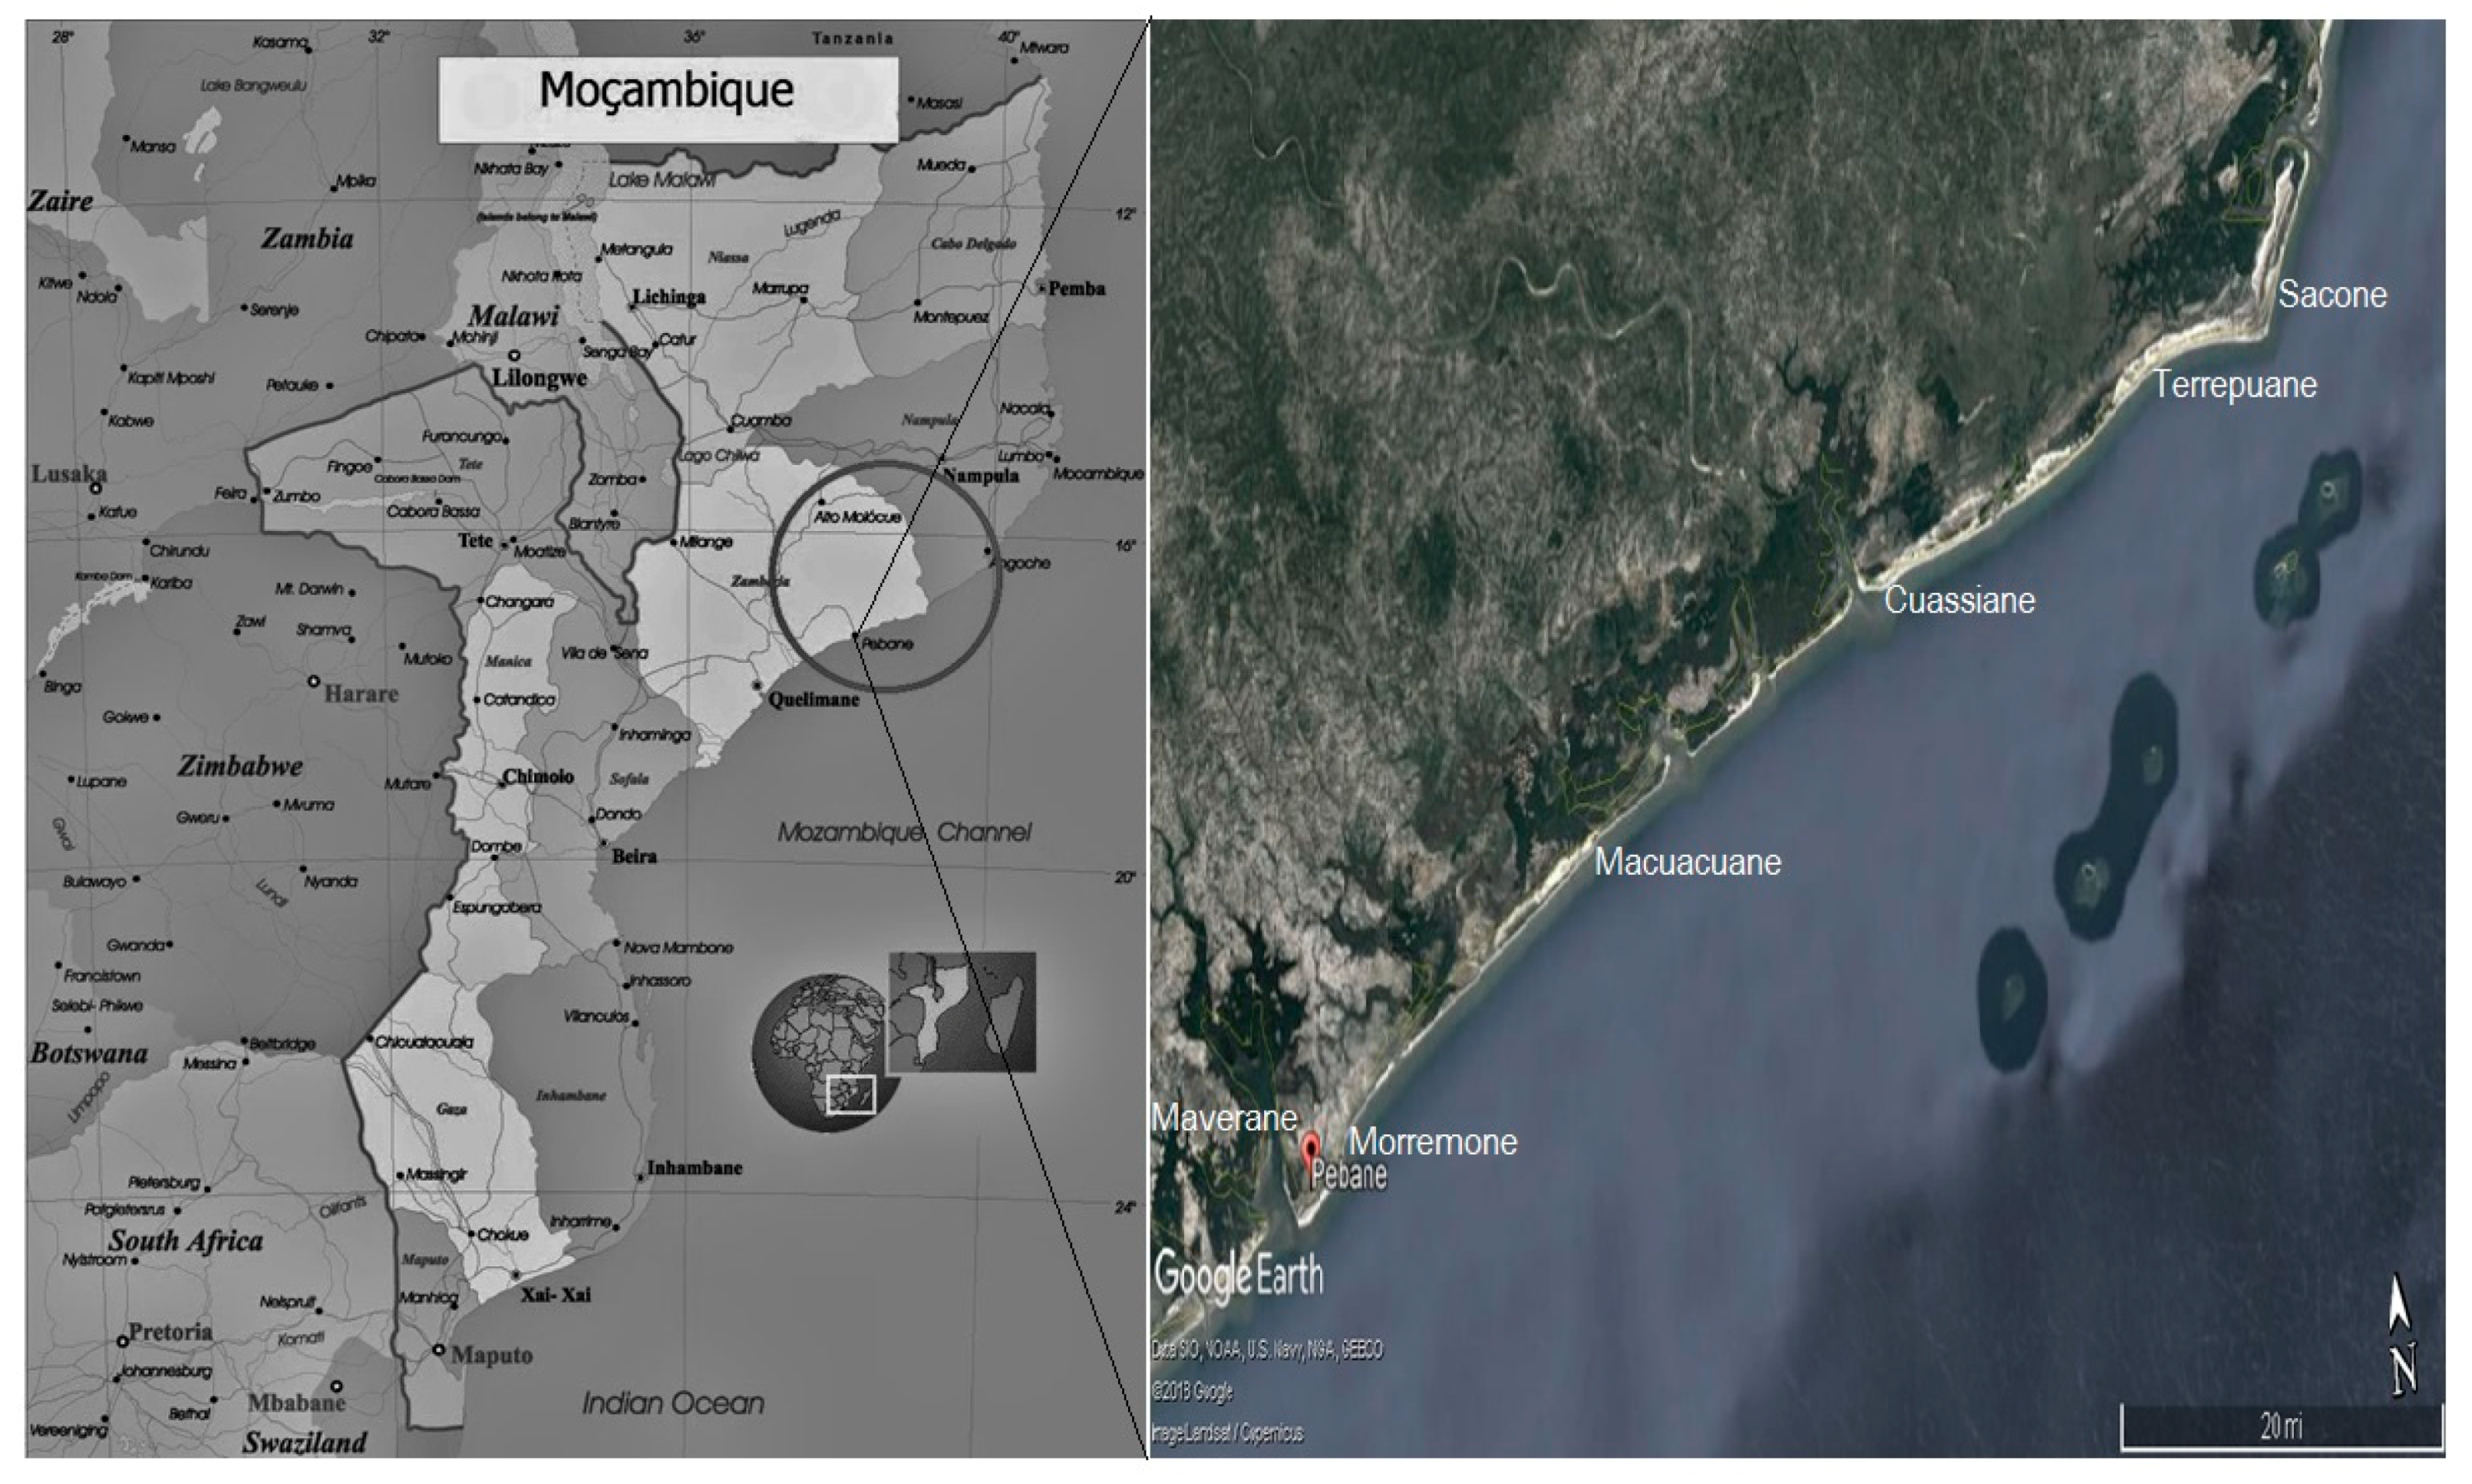
4.1. Study Area

The Mozambique Channel is located between Madagascar and the African continent (11−27° S). The coastline of Mozambique extends over 2700 km in length, and it is oriented from north to south. The study area has located to the north of the Sofala bank, in Pebane (Figure 7). The continental shelf in the northern region of Mozambique is shallow and narrow, and it extends only a few kilometers offshore until the 200 m isobath that is found close to the coast [23]. Along the central region (Pebane region) the Mozambican coast is characterized by a wide continental shelf with the 200 m isobath much further offshore [23]. The climate in the region is tropical humid, with two seasons throughout the year; the summer-hot and rainy season, which varies from November to April, and the winter-dry and cold period, which varies from May to September [36]. Over the coast, the equatorial current flows from the north, and it follows towards the south forming cyclonic and anticyclonic vortices [36,37]. The tides are semi-diurnal with a diurnal inequality and the amplitude pattern does not exceed 4 m [37]. The data for the study was obtained along Pebane fishing villages/communities. The sampling sites include several estuarine (Molocue–Cuassiane; Malaua) and coastal fishing villages (Morremone; Maverane, Macuacuane; Cuassiane; Therrepuane; Sacone).

4.2. Data Collection

Monthly size frequency data was obtained by the technicians of Instituto Nacional de Investigação Pesqueira (IIP-Mozambique). Due to the lack of fisheries statistics on the species, the main fishing centers and/or fishing villages in Pebane (N = 8) were initially randomly chosen and visited on a monthly basis from February 2009 to November 2014 (six years). The data acquired during the monthly field sampling surveys in all communities over mentioned were stored in the PESCART database, used by the [38]. The sampling process targeted fishes that had been caught by beach seine, an artisanal fishery, which was the main gear used by local fishermen. From the beach seine catches, a sample of Thryssa vitrirostris was measured, and the individual total length recorded (measured from the upper jaw to the tip of the caudal fin), allowing a size frequency distribution by length-classes to be obtained. Data was grouped into 1 cm length-classes rounded to the nearest mm. The sampling of the specimens was conducted in the beach, and fish were afterwards commercialized. All fishes caught in beach seine were used size-independently for food consumption. Therefore, the technicians did not need to consider sampling before discards, as landings were equivalent to the total catch. Samples of Thryssa spp. from within a single catch were randomly collected.
The size of the gear varied from 100 to 600 m in length. In the central part between the ends, the gear varied from 6 to 20 m in height, depending on the total length; the height of the net varied from 2 to 10 m. Overall, the difference between height of the center and height at the ends of the net, allowed for the formation of a catch bag or bag, where the captured fish was retained. Currently the mesh size fixed in the regulation of this fishery was 3 cm. The modus operandi was the following: (i) the net is thrown into the sea with the help of a canoe at one end, while the other end is secured or otherwise held by one of the crew members of the canoe that lies on the ground; (ii) the launching of the net must follow the orientation of an arc towards the margin with a certain distance between the cables, in the sense of having a considerable opening; (iii) the opening of the network is related to the slope of the beach where it operates; this means that the greater the slope of the area, the greater the difference.

4.3. Data Analysis

T. vitrirostris monthly length-frequency data were analyzed using the computational package FISAT II, FAO-ICLARM Stock Assessment Tools [39]. The monthly size data were analyzed to determine important life history parameters that would inform the biology and exploitation status of T. vitrirostris.

4.3.1. Growth Parameters

The T. vitrirostris growth parameters were estimated by means of ELEFAN (Electronic Length Frequency Analysis) [40]. This method allowed the growth curves from fish length-frequency data to be followed, sequentially arranged in time. The method allowed an objective estimation of growth parameters whenever representatively samples were available from a fish population. The method was suited both to the analysis of species growth in tropical (such as Quelimane area, in Northeastern Mozambique) and temperate stocks [40]. With ELEFAN I, data were reconstructed to generate “peaks” and “troughs”, and the best statistical estimation of the growth parameters (K and L) was selected based on the Rn value, that measure the goodness of fit (the higher Rn, the better the fitting). The distribution of length frequencies in histograms was adjusted and analyzed, based on the seasonal growth curves of von Bertalanffy, since this technique serves to adjust the observed mean length at age for different combined cohorts.
The asymptotic growth (L) and growth rate (K) were estimated from the seasonal equation of von Bertalanffy, developed by [41], and later modified by Somers [26,27] as the following:
L t =   L ( 1 e k [ ( t to ) + CK [ 2 π sin [ 2 π ( t ts ) ] ] )
where: Lt—is the length at time t, L—asymptotic length, K—growth rate, t—time, to—the age at zero length, C—amplitude of growth oscillations, ts—the time between birth and onset of the first growth oscillations.
According to the von Bertalanffy function (VBF), fish grow (length in time Lt) on average towards the asymptotic length (L) at an instantaneous growth rate (K) [42]. This means that growth is based on the modal displacement in time sequences of the length samples [31,43]. There are several techniques that are available, that were tested to estimate the L required for the “seed” L in the VBF Equation (1) when the K-Scan procedure is used:
(i)
The Powell–Wetherall plot method was used to obtain an initial estimate of (L = 27.11 cm). This method takes into consideration the distribution of length frequency, pooled against the midlength [26,44], allowing for verification of the behavior or variation of the individual sizes in relation to L. The mathematical model of this method is described below:
Lmiddle – L′ = a + b·L′
Lmiddle—is the mean length of all fish (≥L′) and was calculated as:
L middle = L L 1 + Z K
L′ is the cutoff length, the length that once reached, the individual has maximum probability of being caught by fishing, L = −a/b and Z/K = −(1 + b)/b.
(ii)
L required for “seed” L in VBF Equation (1) was determined based on the maximum length ratio observed (Lmax./0.95) in the original length frequency data (maximum observed length-class = 25 cm) according to [45].
(iii)
At last, the L value from length frequency data was estimated using the response value routine in ELEFAN. Using the latter approach (iii), and removing the two higher length-classes, that showed an irregular distribution (frequency occurrence very low), we were able to get a good fit for the VBF growth Equation (1) and for both mortality rates and catch plot curves.

4.3.2. Growth Parameters (L) and Model Selection

According to previous works, the asymptotic length of the species ranged between 19 [6,7] and 25.8 cm [15]. Raw data showed a maximum length-class of 25 cm. Therefore, initially the L was estimated considering all length-classes, from 4 to 25 cm. The L values estimated using (i), (ii), and (iii) allowed for a good adjustment of the VBF growth Equation (1). L values estimated using in (i) and (ii) with all length-classes did not perform well for subsequent analyses, namely, the length converted-catch curves and the mortality rates estimations. This can be related with the low frequency of occurrence and the low number of individuals, for large length-class size distribution [39,43]. In fact, data exploitation analyses reveal that the two higher-length classes (24 and 25 cm) showed an irregular distribution (frequency occurrence that was very low). By removing the 24 and 25 cm length classes, it was possible to achieve a good adjustment of the VBF growth equation (Rn and r-coefficient of correlation), and both mortality rates and catch plot goodness of fit in all analyses. Taken together, the best model or the best estimated L value (statistical fit) necessary to seed the VBF equation to carry out subsequent analyses, was the one estimated by the response value routine in ELEFAN excluding 24–25 length-classes (Table 1).

4.3.3. Recruitment Patterns

The species recruitment patterns were estimated, allowing for the reconstruction of recruitment pulses from a time series of length-frequency data; determine the number of pulses per year and the relative strength of each pulse. The recruitment pattern was estimated based on the back projection of the restructured length frequency data estimated by the VBF [46]. There were two recruitment pulses in data (such as preliminary observed in histogram plots). Therefore, the composite data was decomposed using the approach implemented in NORMSEP. In this case, starting estimates of the mean (in months) were automatically estimated above by the ELEFAN routine. The average yearly percentage of adults and juveniles were compared by the t-test paired sample test after an arcsine of square root transformation, as advised for percentage data [47].

4.3.4. Mortality Parameters

Natural Mortality

The natural instantaneous mortality rate (M) was estimated based on the empirical model suggested by [48], incorporated in the FISAT II tool [43,49] as the following:
Log M = −0.0066 − 0.279 log L + 0.6543 log K + 0.4634 log T (°C)
where: L and K are the parameters obtained from ELEFAN I, and T (°C) is the mean yearly surface water temperature in the study area (average SST = 21 °C, www.fishbase.org studies; [11]). This model takes into account the instantaneous mortality rate, and is very suitable model for small pelagic fish [27,43].

Total Mortality

The instantaneous total mortality rate (Z) was estimated using the length-converted catch curve method, and the respective analysis was based on the middle length of the individual in the catch, as shown by the following expression:
N t = N i e zt
Ni is the initial number of fish in length class i, and Nt is the number at time t (t is the age corresponding to the mid-length class i). Z with seasonality was then computed from the regression equation. The instantaneous fishing mortality (F) coefficient was estimated as:
F = Z − M
Length-converted catch curves are built around assumptions that are similar to those involved in age-structured catch curves, and they require as an input the growth parameter estimations obtained from the previous routines. Therefore, the input parameters required were L, K, and to, and also the identification of the smallest length class that is recruited (L′). The best model can be selected based on statistical values of length-converted catch curves regression analyses. By selecting or deselecting the first and last data observed points, regression analyses are computed automatically, and based on the goodness of fit, the best model can be selected. The extrapolated or selected points will be used to approximate the probability of capture of length-converted catch curves (for details see: [48]).

4.4. Probabilities of Capture

The probability of the individuals being captured from the moment they reach the reference cohort length was estimated using the length-converted catch curve, in order to assess the degree of vulnerability of the recruits to fishing, and to the exploitation process in general. On the other hand, since this species shows a fast growth, we used the same length frequency data to identify possible recruitment peaks throughout the year. The length at first catch (Lc) was determined from the logistic curve adjusted to the cumulative probability of capture at each size class. This can be applied also to identify the fishing regime [27,50]. For T. vitrirostris, Lc was estimated for cumulative probabilities of capture of 25, 50, and 75% (Lc25, Lc50 and Lc75). The size values for 25, 50, and 75% of capture (Lc25, Lc50, and Lc75) were estimated from the logistic curve adjusted to the cumulative probability of capture of T. vitrirostris [43].

4.5. Relative Yield per Recruit (Y’/R) and Relative Biomass per Recruit (B’/R)

The estimation of relative yield and relative biomass per recruit allows for the prediction of changes in Lc, and in the rate of exploitation (Ec) [27,49].
The stock exploitation rate (E) of T. vitrirostris, was analyzed through relative yield and relative biomass per recruit using the [32], as shown by Equations (7) and (8), respectively:
Y R = E · U M / K { 1   3 U ( 1 + m ) + 3 U 2 ( 1 + 2 m ) +   U 3 ( 1 + 3 m ) }
where:
U = 1 − (Lc/L)—the growth to be completed after entry into the exploitation phase;
m = (1 − E)/(M/K) = (K/Z), and
E = F/Z, the exploitation rate, i.e., the fraction of mortality of the T. vitrirostris caused by the fishery,
F—the instantaneous fishing mortality coefficient, and Lc is the length at first capture.
The relative biomass per recruit (B’/R) was estimated as follows:
B R = ( Y / R ) / F
This model allows an estimate of: (i) the optimum yield (E10), the exploitation rate at which the marginal increase of the relative yield-per-recruit is 1/10th of its value at E = ¨0; (ii) the optimum sustainable yield (E50), or the yield for the reduction of 50% of the stock or value of E under which the stock has been reduced to 50% of its unexploited biomass, and (iii) the maximum sustainable yield (MSY or Emax.), which is the exploitation rate that produces the maximum yield.

4.6. Yield Isopleths

Population parameters—growth, mortality, age at recruitment, can be used to explain and understand the history of the fishery, and to predict its future, namely, to predict the effect of changes in the pattern of fishing due to any proposed conservation or regulatory measure. In stock assessment, fish availability can be estimated in terms of the yield of a single year-class of fish throughout its life, which will be (considering a steady state situation) the same as the yield in one year from all year-classes present in the fishery. The life span of a species can be divided into relatively short periods, and therefore the number of fish alive, the number caught, the number of fish dying due to natural) causes, and the number or yield in the weight of fish surviving to the beginning of the next period can be calculated. The yield contours were plotted to identify the impact on the yield of changes in the maximum sustainable yield (Emax.) and the critical length ratio Lc/L [42].

Author Contributions

Data curation, E.M.; Formal analysis, B.M. and F.L.; Investigation, B.M. and M.A.T.; Methodology, T.C.B; Project administration, F.L.; Resources, B.M.; Supervision, F.L.; Validation, T.C.B. and M.A.T.; Writing—review & editing, F.L.

Funding

Francisco Leitão holds a scholarship from Fundação para a Ciência e Tecnologia (SFRH/BPD/108949/2015). FL was also supported by FCT—Foundation for Science and Technology through project UID/Multi/04326/2013. This work was supported by Project BIOFISH-QoL: Integrative approach for enhance quality of live in fishing communities of the ‘Bons Sinais’ estuary (Mozambique).

Conflicts of Interest

The funders had no role in the design of the study; in the collection, analyses, or interpretation of data; in the writing of the manuscript, and in the decision to publish the results.

References

  1. Jacquet, J.; Fox, H.; Motta, H.; Ngusaru, A.; Zeller, D. Few data but many fish: Marine small-scale fisheries catches for Mozambique. Afr. J. Mar. Sci. 2010, 32, 197–206. [Google Scholar] [CrossRef]
  2. Halare, A.I. Relação entre Parâmetros ambientais e distribuição temporal de dois pequenos peixes pelágicos Decapterus russelli (Rüpelli, 1930) e Amblygaster sirm (Walbaum, 1792) na Baia de Inhambane. Revista Moçambicana de Investigação Pesqueira 2012, 31, 2–22. [Google Scholar]
  3. Morgado, F.; Farooq, H.; Silva, I.M.; Soares, A. Artes de Pesca Artesanal e Peixes De Interesse Comercial Da Baia de Pemba; Afrontamento, Ediçoes, Ed.; Departamento de Biologia, Universidade de Aveiro: Aveiro, Portugal, 2015. [Google Scholar]
  4. United Nations Environment Programme (UNEP). Eastern Africa Atlas of Coastal Resources: Tanzania; United Nations Environment Programme (UNEP): Nairobi, Kenya, 2001. [Google Scholar]
  5. Doherty, B.; McBride, M.M.; Brito, A.J.; Le Manache, F.; Sousa, L.; Chauca, I.; Zeller, D. Marine fisheries in Mozambique: Catches updated to 2010 and taxonomic disaggregation. In Fisheries Catches Reconstruction in the Western Indian Ocean, 1950–2010; Le Manache, L., Pauly, D., Eds.; Fisheries Centre Research Report; Fisheries Centre, University of British Columbia: Vancouver, BC, Canada, 2015; Volume 23, pp. 67–82. [Google Scholar]
  6. Mualeque, D.; Santos, J. Biology, fisheries and distribution of Thryssa vitrirostris (Gilchrist &Thompson 1908) and other Engraulidae along the coast of the Sofala Bank, western Indian Ocean. Afr. J. Mar. Sci. 2011, 33, 127–137. [Google Scholar]
  7. Mualeque, D.O. Distribuição e Biologia de Ocar de Cristal (Thryssa Vitrirostris) nos Distritos de Angoche e Moma. Master’s Thesis, Universidade Apolitécnica, Maputo, Mozambique, 2008; p. 83. [Google Scholar]
  8. Sjösted, M.; Sundström, A. Overfishing in Southern Africa: A Comparative Account of Regime Effectiveness and National Capacities. J. Comp. Policy Anal. 2013, 15, 415–431. [Google Scholar] [CrossRef]
  9. Sætre, R.; de Paula e Silva, R. The Marine Fish Resources of Mozambique; Reports on surveys with the R/V Dr Fridtjof Nansen; Geological-Geophysical Atlas of the Indian Ocean (Bergen); Serviço de Investigações Pesqueiras: Maputo, Mozambique; Institute of Marine Research: Bergen, Norway, 1979; p. 134. [Google Scholar]
  10. Fischer, W.; Sousa, I.; Silva, C.; De Freitas, A.; Poutiers, J.M.; Schneider, W.; Borges, T.C.; Féral, J.P.; Massinga, A. Guia de Campo das Espécies Comerciais Marinhas e de Águas Salobras de Moçambique; Fichas FAO de Identificação de Espécies para Actividades de Pesca; FAO: Rome, Italy, 1990. [Google Scholar]
  11. FishBase. World Wide Web Electronic Publication. 2018. Available online: www.fishbase.org (accessed on 2 June 2018).
  12. Johnsen, E.; Krakstad, J.O.; Ostrowski, M.; Serigstad, B.; Strømme, T.; Alvheim, O.; Olsen, M.; Zaera, D.; André, E.R.; Dias, N.; et al. Surveys Of The Living Marine Resources Of Mozambique: Ecosystem Survey and Special Studies. 27 September–21 December 2007; Institute of Marine Research: Bergen, Norway, 2008. [Google Scholar]
  13. Sousa, M.I. Relatório do cruzeiro realizado no Banco de Sofala pelo navio “Pantikapey” de 7-23/Junho/1981: Peixes pelágicos e fauna acompanhante de Carapau e Cavala. Revista de Investigaçāo Pesqueira 1983, 4, 33–66. [Google Scholar]
  14. Gislason, H.; Sousa, M.I. Biology, stock size and catch of Small Pelagic Fish along the cost of Mozambique. Revista Moçambicana de Investigação Pesqueira 1985, 13, 27–81. [Google Scholar]
  15. Sousa, M.I.; Gjøsaeter, J. A revision of growth parameters of some commercially exploited fishes from Mozambique. Revista de Investigação Pesqueira 1987, 16, 19–40. [Google Scholar]
  16. Whitehead, P.J.; Nelson, G.J.; Wongratana, T. An Annotated and Illustrated Catalogue of the Herrings, Sardines, Pilchards, Sprats, Shads, Anchovies and Wolf-Herrings; Clupeoid Fishes of the World (Suborder Clupeoidei); FAO Fisheries Synopsis; FAO: Rome, Italy, 1988; p. 283. [Google Scholar]
  17. Wolf, M. A proposed method for standardization of the selection of class interval for length-frequency analysis. Fishbyte 1989, 7, 5. [Google Scholar]
  18. Hilbron, R.; Walters, C.J. Quantitative Fisheries Stock Assessment: Choice, Dynamics, and Uncertainty; Chapman & Hall: New York, NY, USA, 1992. [Google Scholar]
  19. Mandara, A.W.; Halare, A.I. Distribuição Temporal, Crescimento e Biologia Reprodutiva da Thryssa vitrirostris (Gilchrist and Thompson, 1908) na Praia de Zalala. Bachelor’s Thesis, Universidade Eduardo Mondlane, Maputo, Mozambique, 2010; p. 43. [Google Scholar]
  20. Pauly, D.; Pullin, R.S.V. Hatching time and spherical, pelagic, marine fish eggs in response to temperature and egg size. Environ. Biol. Fishes 1988, 22, 261–271. [Google Scholar] [CrossRef]
  21. Pepin, P. Effect of temperature and size on development, mortality, and survival rates of the pelagic early life history stages of marine fish. Can. J. Fish. Aquat. Sci. 1991, 48, 503–518. [Google Scholar] [CrossRef]
  22. Leitão, F.; Alms, V.; Erzini, K. A multi-model approach to evaluate the role of environmental variability and fishing pressure in sardine fisheries. J. Mar. Syst. 2014, 139, 128–138. [Google Scholar] [CrossRef] [Green Version]
  23. Malauene, B.S. Shelf Edge Upwelling Off Northern Mozambique. Master’s Thesis, University of Cape Town, Cape Town, South Africa, 2010; p. 102. [Google Scholar]
  24. Santos, R. Fisheries in Angoche, Moma and Pebane: A Preliminary Description; WWF: Maputo, Mozambique, 2007. [Google Scholar]
  25. Pauly, D. Tropical fishes: Patterns and propensities. J. Fish Biol. 1998, 53, 1–17. [Google Scholar]
  26. Enin, U.I. First estimates of growth mortality and recruitment parameters of Macrobrachium macrobrachium Herklots 1985 in the cross River estuary. Dana 1995, 11, 29–38. [Google Scholar]
  27. Etim, L.; Sankare, Y. Growth and mortality, recruitment and yield of the fresh-water shrimp, Macrobrachium vollenhovenii, Herklots 1851 (Crustacea, Palaemonidae) in the Fahe reservoir, Côte d’Ivoire, West Africa. Fish. Res. 1998, 38, 211–223. [Google Scholar] [CrossRef]
  28. Costalago, D.; Potter, P.; Paula, P.; Strydom, N.A. Influence of environmental variables on the larval stages of anchovy, Engraulis encrasicolus, and sardine, Sardinops sagax, in Algoa Bay, South Africa. Environ. Biol. Fish 2018, 101, 225–236. [Google Scholar] [CrossRef]
  29. Houde, E.D.; Zastrow, C.E. Ecosystem- and taxon-specific dynamic and Energetics properties of larval Fish assemblages. Bull. Mar. Sci. 1993, 53, 290–335. [Google Scholar]
  30. Ismen, A. Growth, mortality and yield per recruit model of picarel (Spicara smaris L.) on the eastern Turkish Black Sea coast. Fish. Res. 1995, 22, 299–308. [Google Scholar] [CrossRef]
  31. Silva, J.P.C.; Santos, R.S.; Costa, M.R.; Araujo, F.G. Parâmetros de crescimento e mortalidade de Eucinostomus Argenteus (Baird & Girard, 1854) capturados no manguezal de guaratiba, Baía de Sepetiba, Rio de Janeiro. Boletim do Instituto de Pesca 2014, 40, 657–667. [Google Scholar]
  32. Beverton, R.J.H.; Holt, S.J. Manual of Methods for Fish Stock Assessment—Part 2: Tables of Yield Function. FAO Fisheries Technical Paper; FAO: Rome, Italy, 1966; Volume 38, pp. 7–29. [Google Scholar]
  33. Beverton, R.J.H.; Holt, S.J. On the Dynamics of Exploited Fish Populations; Fishery Investigation: London, UK, 1957; Volume 2, pp. 1–533. [Google Scholar]
  34. Pauly, D.; Soriano, M.I. Some pratical extensions to Beverton and Holt’s relative yiel-per-recruit model. In The First Asian Fisheries Forum; Maclean, J.L., Dizon, L.B., Hosillos, L.V., Eds.; Asiam Fisheries Society: Manila, Philippines, 1986; pp. 491–495. [Google Scholar]
  35. International Council for the Expoloration of the Sea (ICES). Report of the Working Group on Southern Horse Mackerel, Anchovy and Sardine (WGHANSA), 24–29 June 2017, Bilbao, Spain; ICES CM 2017/ACOM: 17; ICES: Copenhagen, Denmark, 2017; p. 602. [Google Scholar]
  36. Souto, M. Governação e Crescimento Partilhado das Pescas no Sudoeste do Oceano Índico em Moçambique (SWIOFish); Quadro de Gestão ambiental e Social (QGAS); Ministerio das Pescas: Maputo, Mozambique, 2014. [Google Scholar]
  37. Hoguane, A.M. Perfil Diagnóstico da Zona Costeira de Moçambique. Revista de Gestão Costeira Integrada 2007, 7, 69–82. [Google Scholar] [CrossRef]
  38. Instituto Nacional De Investigação Pesqueira (IIP). Manual do Amostrador da Pesca Artesanal; National Institute of Fisheries Research (IIP): Maputo, Mozambique, 2006. [Google Scholar]
  39. Gayanilo, F.C., Jr.; Sparre, P.; Pauly, D. FAO-ICLARM Stock Assessment Tools II (FiSAT II): User’s Guide; FAO Computerized Information Series (Fisheries); FAO: Rome, Italy, 2005; No. 8. [Google Scholar]
  40. Pauly, D.; David, N. Elefan—I, a Basic Program for the Objective Extraction of Growth Parameters from Length-Frequency Data. Meeresforschung 1981, 28, 205–211. [Google Scholar]
  41. Pauly, D.; Gaschuètz, G. A Simple Method for Fitting Oscillating Length Growth Data with a Program for Pocket Calculators; 1979/G/24; ICES Demersal Fish Committee: Copenhagen, Denmark, 1979. [Google Scholar]
  42. Amponsah, S.K.K.; Danson, P.K.; Nunoo, F.K.E. Fishing regime, growth, mortality and exploitation rates of Scomber Japonicus (Houttuyn, 1782) from catches landed along the eastern coastline of Ghana. Int. J. Fish. Aquat. Res. 2016, 1, 5–10. [Google Scholar]
  43. Gayanilo, F.C., Jr.; Pauly, D. Fisat: FAO-ICLARM Stock Assessment Tools, Reference Manual; FAO Computerized Information Series Fisheries; FAO: Rome, Italy, 1997; pp. 41–47. [Google Scholar]
  44. Pauly, D. A simple method for estimating the food consumption of fish populations from growth data and food conversion experiments. Fish. Bull. 1986, 84, 827–842. [Google Scholar]
  45. Pauly, D. Some Simple Methods for the Assessment of Tropical Fish Stocks; FAO Fisheries Technical Paper; FAO: Rome, Italy, 1983; Volume 234, pp. 1–52. [Google Scholar]
  46. Pauly, D. A Review of the ELEFAN System for Analysis of Length-Frequency Data in Fish and Aquatic Invertebrates; International Center for Living Aquatic Resources Management: Manila, Philippines; Kuwait Institute for Scientific Research: Safat, Kuwait, 1987; pp. 7–34. [Google Scholar]
  47. Zar, J.H. Biostatistical Analysis, 3rd ed.; Prentice-Hall, Inc.: Upper Saddle River, NJ, USA, 1996; 662p. [Google Scholar]
  48. Pauly, D. On the interrelationships between natural mortality, growth parameters, and mean environmental temperature in 175 fish stocks. ICES J. Mar. Sci. 1980, 39, 175–192. [Google Scholar] [CrossRef]
  49. Peixer, J.; Catella, A.C.; Petrere, M., Jr. Yield per recruit of the pacu Piaractus mesopotamicus (Holmberg, 1887) in the pantanal of Mato Grosso do Sul, Brazil. Braz. J. Biol. 2007, 67, 561–567. [Google Scholar] [CrossRef] [PubMed]
  50. Dinh, Q.M. Population Dynamics of Boleophthalmus bodarti in the Mekong Delta Vietnan. J. Anim. Plant Sci. 2017, 27, 603–610. [Google Scholar]
Figure 1. Monthly von Bertalanffy growth curve of Thryssa vitrirostris superimposed over the normal length frequency histograms (A) and superimposed over the restructured length frequency (LF) histograms (B). LF (A) allows for the covering of the life span of several cohorts, and reconstructs an average cohort, while reconstructed LF (B) allows for study of temporal fluctuations of the recruitment.
J 01 00012 g001
Figure 2. Percentage of catches of Thryssa vitrirostris per length-classes.
J 01 00012 g002
Figure 3. Monthly recruitment pattern of Thryssa vitrirostris by the year (A), monthly percentage of 4 cm of length class registered along the years (B), monthly percentage of 5 cm of length class registered along the years (C).
J 01 00012 g003
Figure 4. Length converted catch curves applied to length frequencies data of Thryssa vitrirostris. The slope of the right descending arm (black dots) of the curve allow the estimation of total mortality (Z). White dots (expected values) are the expected number of fish, and grey dots (empirical data) the numbers of fish actually sampled (observed).
J 01 00012 g004
Figure 5. Probability of capture to each size class of Thryssa vitrirostris obtained from the length-converted probability catch curve (A) and percentage of juveniles (length-class < 13 cm) and adults (B) for the six year period (2009–2014).
J 01 00012 g005aJ 01 00012 g005b
Figure 6. Beverton and Holt’s relative yield per recruit and average biomass per recruit models for Thryssa vitrirostris (A): E10—green line; E50—optimum sustainable yield, redline, and the (Emax.—maximum sustainable yield, yellow line. Yield isopleths plot (B) with exploitation rate variability across the critical length ratio, Lc/L.
J 01 00012 g006
Figure 7. Location of study area (Adapted from Google Maps).
J 01 00012 g007
Table 1. Summary of the stock assessment parameters for all models tested: L = Asymptotic length (cm); K = Growth rate; Rn = Goodness of fit; Z/K = The ratio of total mortality to growth rate; Z = Total mortality; M = Natural mortality; F = Fishing mortality (cm); Eest. = Estimated exploitation rate; Emax. = Maximum Sustainable Exploitation rate; M/K = ratio of natural mortality to growth rate; Lc/L = ratio of middle-length to asymptotic length; r = coefficient of correlation.
MethodL
(cm)
K
(cm)
RnZ/KZ
(year1)
M
(year1)
F
(year1)
Eest.
(year1)
Emax.
(year1)
M/KLc/L r
Powell Wetheral (4–25 cm)27.110.340.171.140.640.79−0.15−0.240.412.300.15−0.95
Powell Wetheral (4–23 cm)21.712.200.123.165.122.872.250.440.481.300.34−0.95
Maximum length (4–25 cm)26.250.370.167.000.620.85−0.23−0.370.422.300.16−0.72
Maximum length (4–23 cm)24.150.450.143.161.120.990.140.120.482.200.24−0.95
Response Surface (4–25 cm)28.200.310.177.000.650.74−0.09−0.140.420.030.15−0.72
Response Surface (4–23 cm)25.100.410.153.161.310.920.390.300.482.200.24−0.95

