Article

A Bench-Scale Demonstration of Direct Air Capture Using an Enhanced Electrochemical System

1
Institute for Decarbonization and Energy Advancement, University of Kentucky, Lexington, KY 40507, USA
2
Electric Power Research Institute, Palo Alto, CA 94304, USA
3
PPL Corporation, Allentown, PA 18101, USA
4
Department of Mechanical and Aerospace Engineering, University of Kentucky, Lexington, KY 40506, USA
*
Authors to whom correspondence should be addressed.
Clean Technol. 2025, 7(2), 50; https://doi.org/10.3390/cleantechnol7020050
Submission received: 7 April 2025 / Revised: 18 May 2025 / Accepted: 10 June 2025 / Published: 16 June 2025

Abstract

The bench-scale demonstration of the UKy-IDEA process for direct air capture (DAC) technology combines solvent-aided CO2 capture with electrochemical regeneration (ER) through a pH swing process, enabling efficient CO2 capture and simultaneous solvent regeneration, producing high-purity hydrogen as a valuable co-product. The system shows stable performance with over 90% CO2 capture efficiency and approximately 80% CO2 recovery, handling ambient air at 280 L/min. During testing, the unit captured 1 kg of CO2 over 100 h, with a concentrated CO2 output purity of around 70%. Operating efficiently at low voltage (<3 V), the system supports flexible and remote operation without AC/DC converters when using intermittent renewable energy. Techno-economic analysis (TEA) and Life Cycle Assessment (LCA) highlight its minimized required footprint and cost-effectiveness. Marketable hydrogen offsets capture costs, and compatibility with renewable DC power enhances appeal. Hydrogen production displacing CO2 produced via electrolysis achieves 0.94 kg CO2 abated per kg CO2 captured. The project would be economic, with USD 26 per ton of CO2 from the federal 45Q tax credit for carbon utilization, and USD 5 to USD 12 per kg for H2.

1. Introduction

Direct air capture (DAC) has been proposed as a potentially useful mitigation pathway to limit global warming to 1.5 °C above preindustrial levels [1,2,3,4,5,6,7]. Unlike conventional carbon capture technologies targeting point sources, DAC systems enable carbon removal even in sectors where emissions are difficult to abate. DAC is also one of a few technologies with the potential to not just reduce emissions but actually reverse the accumulation of carbon dioxide in the atmosphere. DAC plays an essential role in achieving net-zero or net-negative emissions. Transitioning to a sustainable carbon cycle requires a range of technologies, from large-scale carbon capture plants to numerous small and distributed carbon capture units. Modular DAC units powered by renewable electricity hold promise for reducing the global accumulation of ambient carbon dioxide in the atmosphere. However, DAC encounters a significant challenge due to the low concentration of CO2 in the ambient atmosphere, in the range of four hundred parts per million (ppm), necessitating the treatment of large volumes of air to extract each mole of CO2, which comes at high capital and operating costs, particularly for air handling and sorbent regeneration. Recent techno-economic analyses suggest that scaling DAC will require both cost and energy use to decline significantly over time [8,9,10]. The effective DAC energy consumption must be low enough for both economic and environmental viability. Therefore, DAC technologies should have fast adsorption kinetics, low regeneration energy requirements, physical and chemical stability, optimal CO2 uptake and selectivity in the presence of atmospheric air constituents, and efficient integration with renewable energy sources [11].
As a result, materials with robust CO2-binding capacity are preferred for effective capture, narrowing down solvent/sorbent options mostly to alkaline/amines or hierarchically porous materials such as metal–organic frameworks or zeolites [10,11,12,13]. Yet conventional thermal solvent regeneration suffers from high energy consumption, water loss, and the degradation of active components [14]. In response to these limitations, electrochemically mediated DAC could be an alternative regeneration strategy that leverages electricity—especially from renewable sources—for sorbent regeneration at lower temperatures and higher efficiencies [15,16]. Electrochemical DAC systems can conveniently regenerate alkaline sorbents, such as hydroxides or carbonates, without the high-temperature swing required in traditional systems, potentially reducing the system’s total energy footprint and simplifying heat integration. Recent advances in electrochemical DAC, such as the Faradaic electro-swing process [17], H2-recycling electrochemical system [18], redox-active quinone-based [19], phenazine-based [20], and neutral red-based [21] systems, and bipolar-membrane-enabled separation [22], where the regeneration energy could be about one third of that in the thermal-swing method [23], highlight growing research interest in this field.
The University of Kentucky Institute for Decarbonization and Energy Advancement (UK IDEA) has developed an intensified process for capturing CO2 from ambient air. This process combines solvent-based CO2 capture for a superior gas–liquid reaction interfacial area with electrochemically mediated solvent regeneration, enabling simultaneous CO2 capture and solvent regeneration. The technology features only two primary units—a regenerator and an absorber —while producing high-purity hydrogen as a valuable co-product. This hydrogen can be sold, used as energy storage, or utilized for the depolarization of the DAC system during grid peak demand, allowing for flexible operation. Powered directly by DC electricity, the technology can seamlessly integrate with intermittent renewable energy sources like solar or wind without the need for AC/DC converters, enabling remote operation. This deployment marks considerable progress toward further scale-up and is verified through assessing the electrochemically regenerated solvent system for DAC with hydrogen co-generation at the bench scale.
Utilizing a membrane instead of traditional packed-bed or spray tower absorbers in solvent-based approaches offers several advantages. It reduces the size of the absorber unit, improves process control, and mitigates issues related to drying packing surfaces due to liquid malfunction. This technology has attracted substantial research interest and has proven commercially successful across various gas–liquid applications. Commercially available gas–liquid contactors feature hollow fiber membranes crafted from hydrophobic polymeric materials like polytetrafluorethylene (PTFE), polyvinylidene fluoride (PVDF), polypropylene (PP), and polysulfone (PSF) [24,25,26,27,28]. These membranes offer operational flexibility, independent gas and liquid flow, a high surface-area-to-volume ratio, compact size, and straightforward scalability for carbon capture applications. Typically, the membrane material in a membrane contactor is hydrophobic, and its pore size is in the range of micrometers. The membrane contactor often encounters wetting issues during long-term operation due to the breakthrough of the hydrophobic layer. In this technology, air distributor- and spray-based gas–liquid contactors offer advantages in DAC applications by improving process efficiency and enhancing CO2 absorption. These systems ensure fine dispersion of the solvent, maximizing the gas–liquid interfacial area and improving mass transfer efficiency. Unlike traditional membrane-based approaches, the air distributor and spray system avoid long-term wetting issues while maintaining stable operation.
Integrating capture with electrochemical enrichment/regeneration distinguishes the process from other approaches, such as thermal-swing or moisture-swing methods. By addressing complexities inherent in DAC systems, the technology showcases (1) facile CO2 capture at a low gas-side pressure drop through an intensified absorber with in situ regenerated hydroxide as the capture solvent, (2) a multifunctional electrochemical regenerator for hydroxide regeneration, CO2 concentration, and hydrogen production at less than 3 volts, and (3) stable DAC performance, achieving over 90% capture efficiency at the realistic cubic feet per minutes (CFM)-scale flow rate of the feed air [29].
Integrated into a DAC demonstrator capable of removing 300 g of CO2 per day with minimal energy input during regeneration, the UK-IDEA process demonstrates chemical and physical stability over extended operation periods. CO2 is stripped selectively with 90% capture efficiency from the air feed at a flow rate of 17 m3 h−1 per module with a low pressure loss of 0.43 psi. The completion of this bench-scale demonstration facilitates techno-economic analysis (TEA) and Life Cycle Assessment (LCA), demonstrating the potential of the proposed electrochemical aqueous process as a substantive DAC option. When integrated with renewable energy resources, at a large scale of 49,000-ton CO2 capture per year, the cost could be below USD 185 per ton of CO2 if the credit for replacing hydrogen production from other methods such as steam methane reforming and electrolysis is considered. These analyses identified no obvious concerns for bench-scale operation and did not show barriers to building UK IDEA’s carbon capture and solvent regeneration system at a larger scale [29]. This technology enables a pathway for modular, renewable-powered DAC systems, especially in remote or distributed applications. To the authors’ knowledge, such an absorber–electrochemical integrated process for direct air capture has not been previously reported.

2. Experimental Section

2.1. Materials

Potassium bicarbonate (ACS reagent, ≥99%), potassium carbonate (ACS reagent, ≥98%), and potassium hydroxide (KOH, 85%) were purchased from Sigma-Aldrich, St. Louis, MO, USA. Solvay Aquivion® PFSA membranes based on the short-side-chain perfluorosulfonic acid ionomer, E98-15S (EW = 980 g/eq, 150 μm nominal thickness), were ordered from Fuel Cell Store, Bryan, TX, USA. DSA mesh electrodes were ordered from De Nora, Milan, Italy.

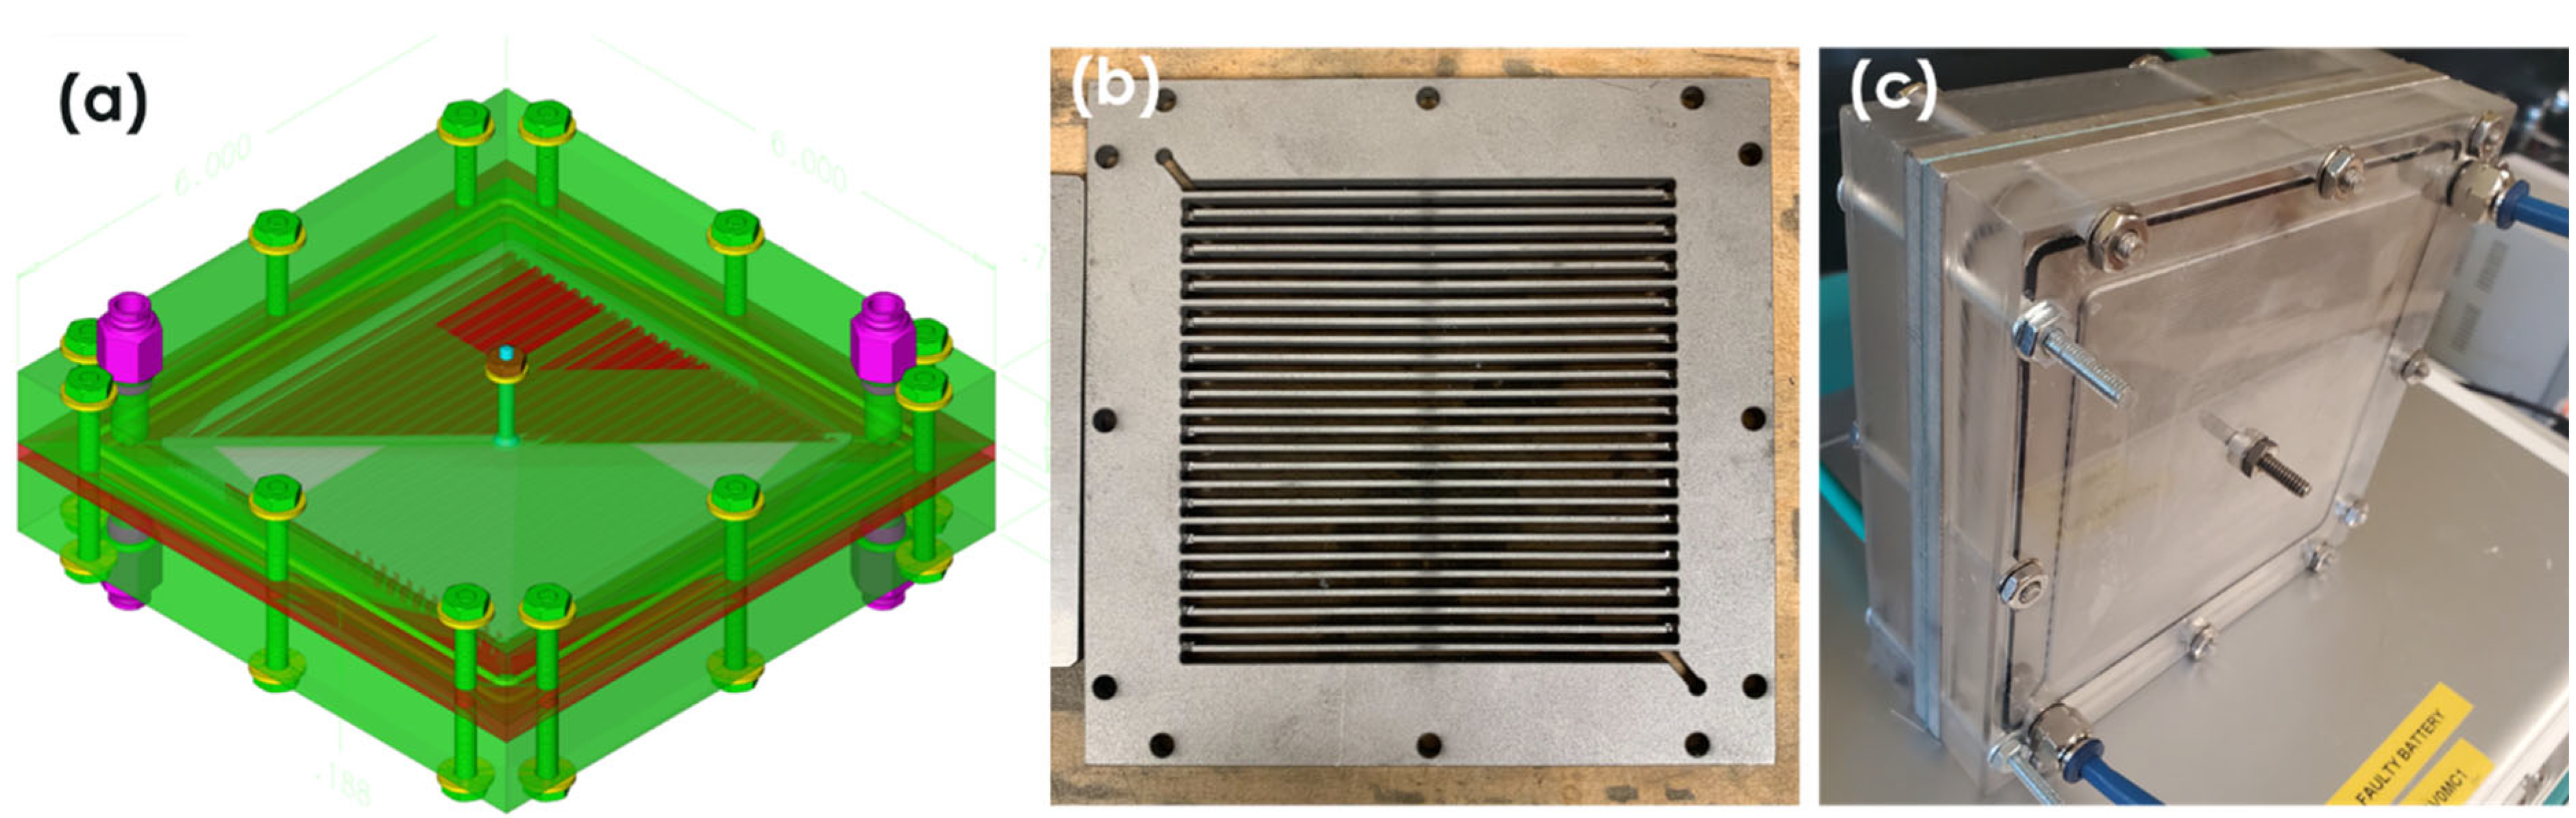
2.2. Fabrication of Electrochemical Regenerator

A typical electrochemical regenerator (ER), as shown in Figure 1, was fabricated to support integration with the absorber (MA) by leveraging the experience gained from designing and testing a smaller-solvent ER at UKy IDEA. The ER was built by the machine shop at the Department of Mechanical and Aerospace Engineering, University of Kentucky. The typical ER consisted of two compartments, i.e., an anode chamber and a cathode chamber, enclosed by two stainless-steel endplates (27 cm × 27 cm × 1.3 cm). A DSA® electrode (Ru/Ir-coated titanium mesh electrode) or Pt-Ti mesh (21 cm × 21 cm) was used as the anode, and a thin titanium plate was used as the current collector. Another thin titanium plate served as the current collector on the cathode. An AquivionTM E98-15S cation-exchange membrane (CEM) (25 cm × 25 cm) was sandwiched between two serpentine flow-field plates made of titanium (27 cm × 27 cm × 0.7 cm), which was integrated between the anode and cathode compartments. Titanium was employed as both the cathode and anode material to minimize the corrosion during solvent reconditioning under the strong pH swing environments at the anode. The cell flow fields included multiple vertical channels, with a spacing of 7 mm between each channel to support high-velocity flow to improve mass transfer, rather than a simple open channel. The cationic ion-exchange membrane, coupled with a 500 μm thick firm gasket, was embedded between the two electrodes to prevent an electrical short circuit. The membrane (or electrode) area exposed to the solvent was ~441 cm2. The membrane–electrode assembly paired with the two titanium current collectors was tightly compressed between two 13 mm thick stainless-steel plates to ensure leakage-free operation. The electrochemical regenerator demonstrated leak-free operation at a 1GPM liquid circulation rate.

2.3. Integration of Absorber and Electrochemical Regenerator

Figure 2 shows the scheme of the integrated system. Ambient air is first fed into the DAC MA, where air comes in contact with the KOH solution flowing in a counterflow configuration. All influent air flows from the top of the absorber to the bottom, while solution is pumped from the bottom to the top. Both outlets are returned to the drum gas–liquid separator, where the liquid droplets mix further with the air. Depending on the requirement, additional internal liquid spray or air could be introduced directly into the gas–liquid separator drum for performance improvement. The KOH solution reacts with CO2 from the inlet air to form a potassium carbonate (K2CO3) solution in the absorber. The carbonate solution is then sent to the ER to release the CO2 and O2 gas mixture and regenerate the KOH solvent, while producing H2 as a co-product. A Vaisala CARBOCAP® hand-held carbon dioxide meter (GM70) was attached at the end of the drum gas–liquid separator to measure CO2 concentration at the exhaust of absorption. During testing, the solutions’ carbonate speciation was analyzed with an alkalinity titrator (Metrohm 888 Titrando) for correlation with the capture efficiency.
The ER can be conveniently scaled up to match absorber capacity by connecting more cells in parallel, as shown in Figure 2. Hydrogen generated by one cell can be separated or fed into another cell’s anode chamber for depolarization, reducing cell voltage during electricity peak demand or as needed. The system uses two circulation loops for the anode and cathode compartments. Each loop directs the cell outlet into a one-liter bottle where produced CO2/O2 (or H2) gas separates, and the liquid stream flows back into the cell. The CO2-rich alkaline absorbent influent mixes with the anode solution in the bottle before entering the anode compartment. The catholyte exits as effluent at a controlled flow rate to the absorber. Water vapor from heating the anode solution condenses with an ice bath and is pumped to the cathode bottle.
Multiple peristaltic pumps manage the system: one doses influent to the anode bottle from the absorber (3–10 mL/min), two for the circulation loops (1000 mL/min), one for effluent from the cathode bottle to the absorbent (3–10 mL/min), and one for pumping condensed water to the cathode. Released gases are removed via overhead N2 purge or vacuum through membrane contactors (followed by N2 dilution), with the gas flow rate controlled by a mass flow meter to provide a measurement within the range of the sensor. CO2 concentrations are analyzed using a Vernier Go Direct® CO2 gas sensor (Vernier, Beaverton, OR, USA). The flow rate of each pump is optimized so that the lowest ER voltage and the highest CO2 release rate are achieved. A DC power supply applies a constant current (10–20 A) to the cell, and the nominal operating current density is 35 mA/cm2. Two pH electrodes measure anode and cathode pH, and a Graphtec transmitter records the potential difference across compartments and pH values. Ion concentrations in the influent, anolyte, and catholyte solutions are measured by alkalinity titration for carbonate speciation.
The MA and ER can operate in continuous or intermittent (sawtooth) mode. In continuous mode, the influent solution is constantly dosed into the anode circulation loop from the absorber, with the absorber capturing CO2 until the system reaches a steady state. This ensures that the hydroxide consumed by the capture reaction with CO2 is equivalent to the hydroxide regenerated by the ER. The continuous mode provides a way to investigate parameters such as the dosing rate from the absorber to the anode and the fresh KOH flow rate into the absorber from the cathode. The main purpose is to test the entire system at a steady state for an extended period. In intermittent mode, the influent solution is fed intermittently into the anode circulation loop, with no solution pumped out of the cathode bottle to the absorber tank until one cycle is complete. The cycle typically swings between pH 10.2 to 9.5 for the anode side, with absorbent solution pH and composition determined by equilibrium with 415 ppm CO2 under atmospheric pressure, demonstrating the pH swing more clearly.

3. Results and Discussion

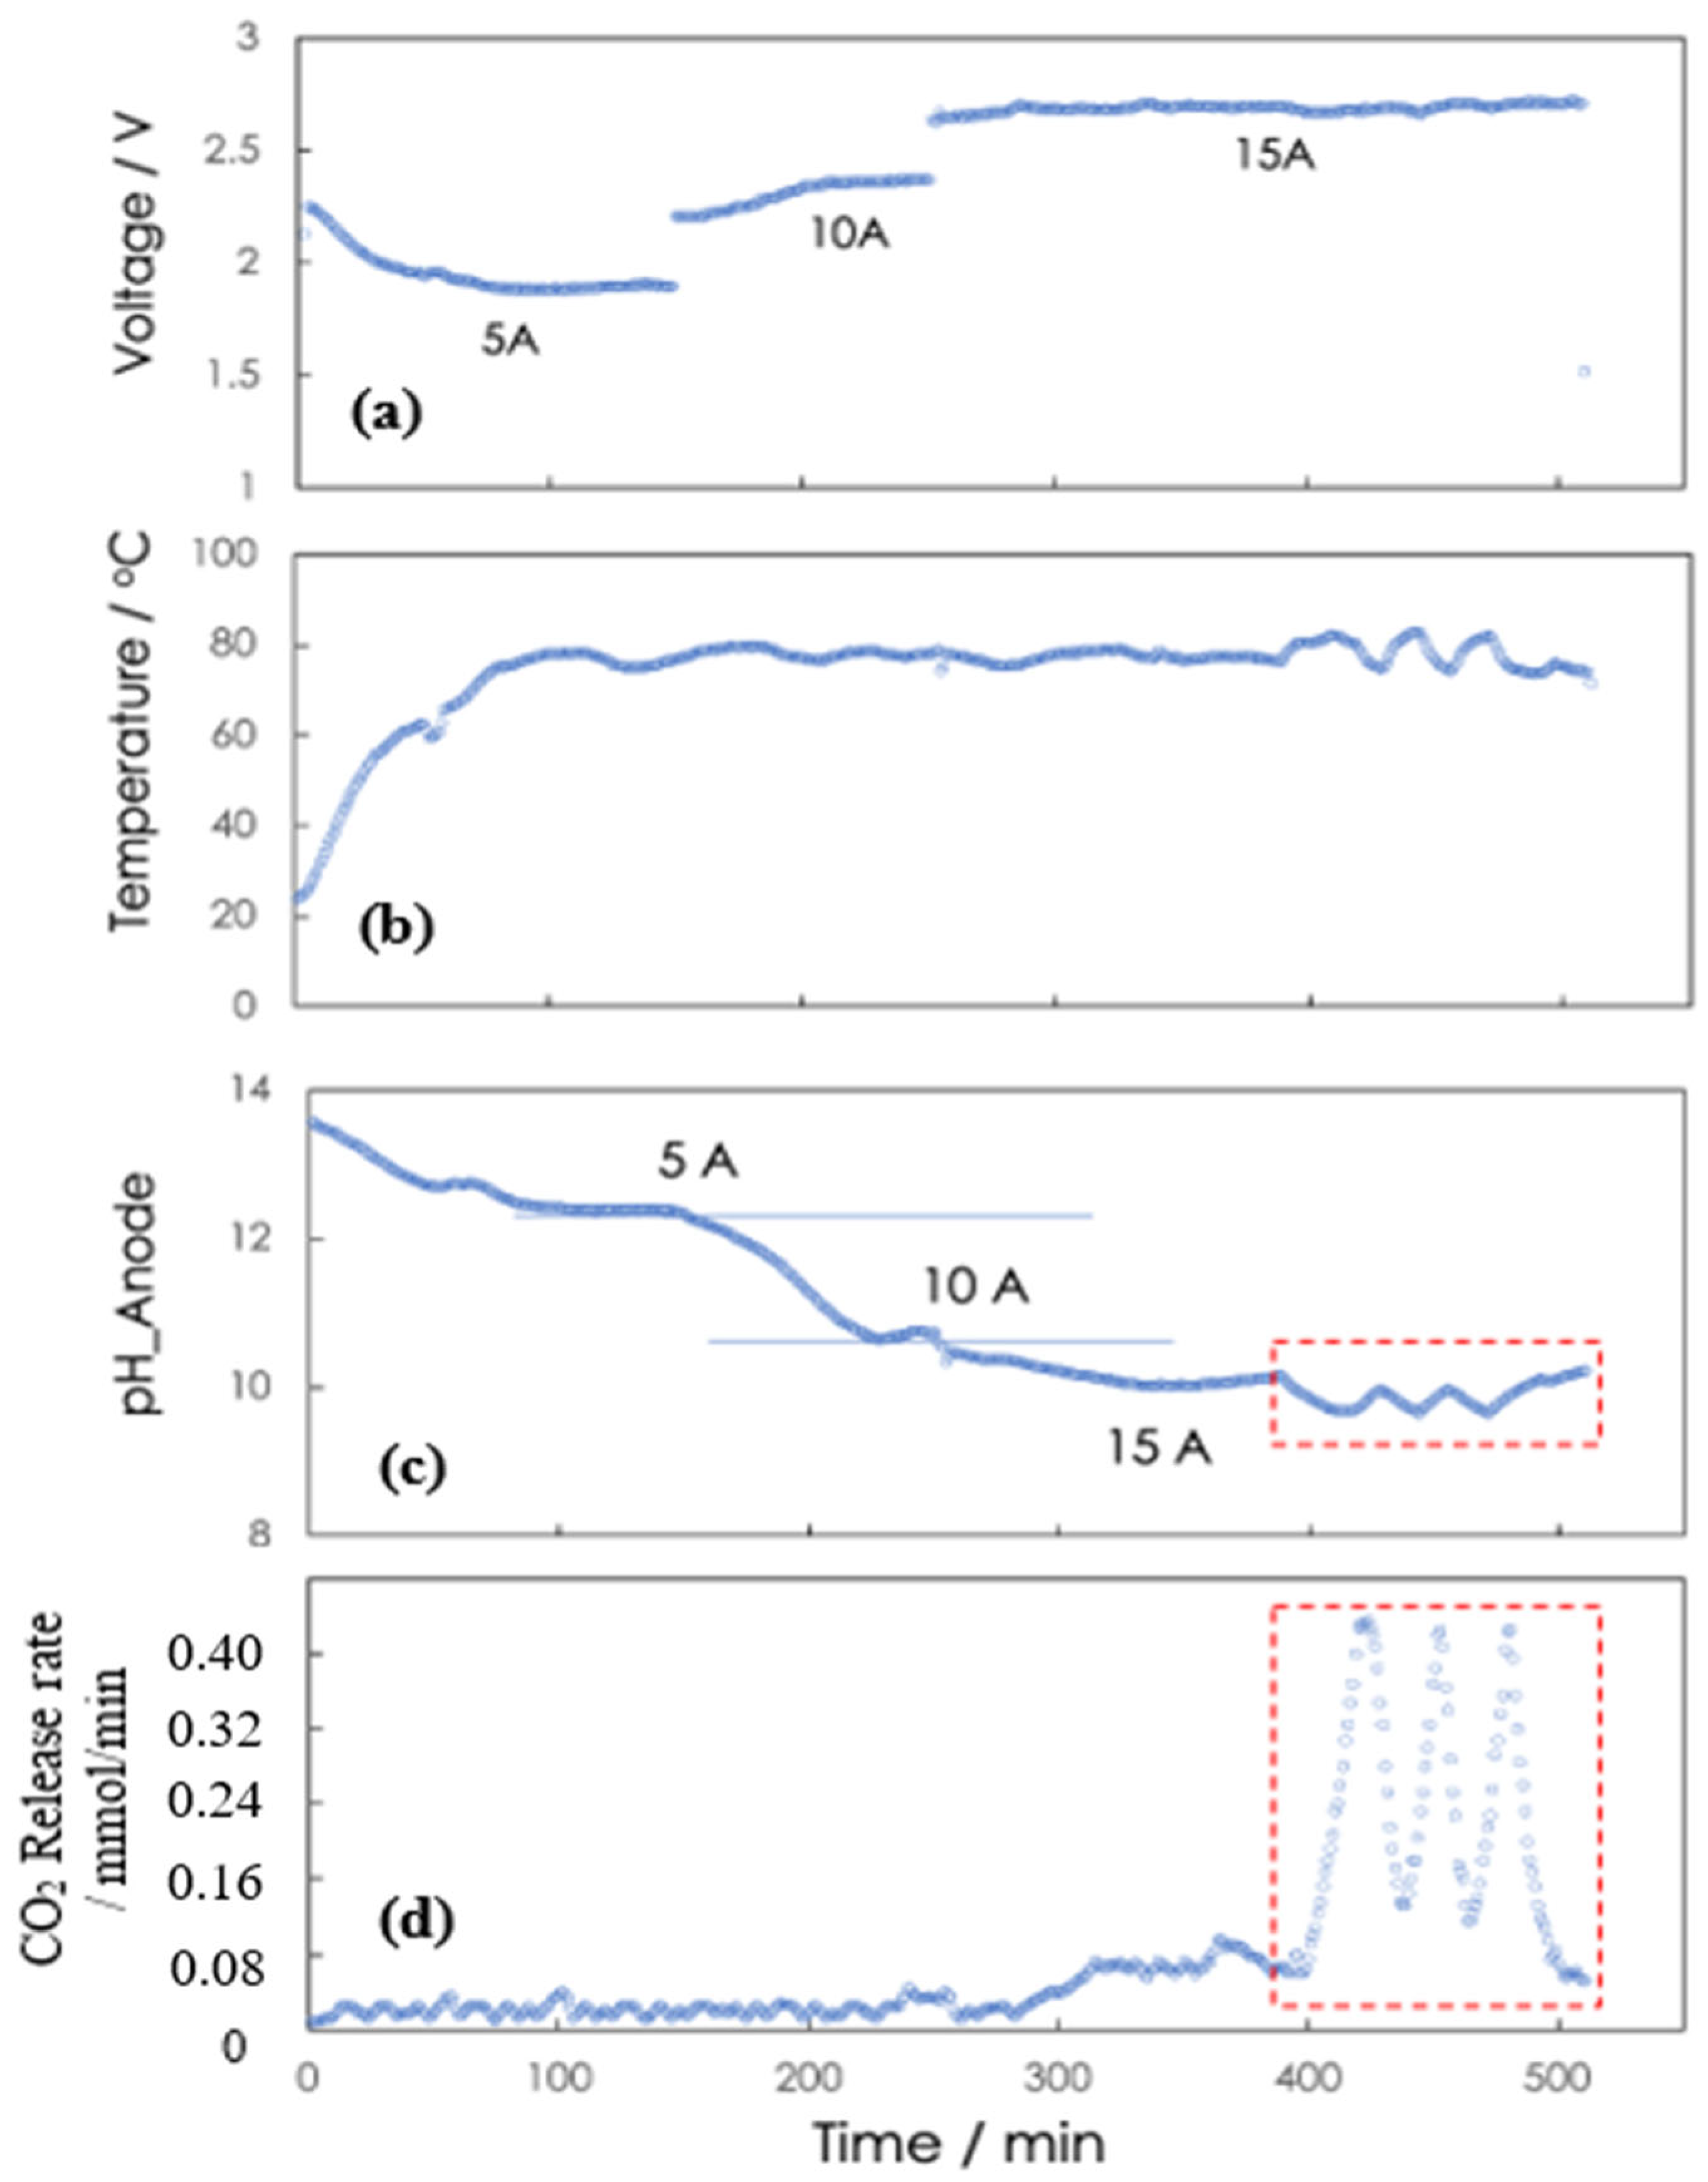
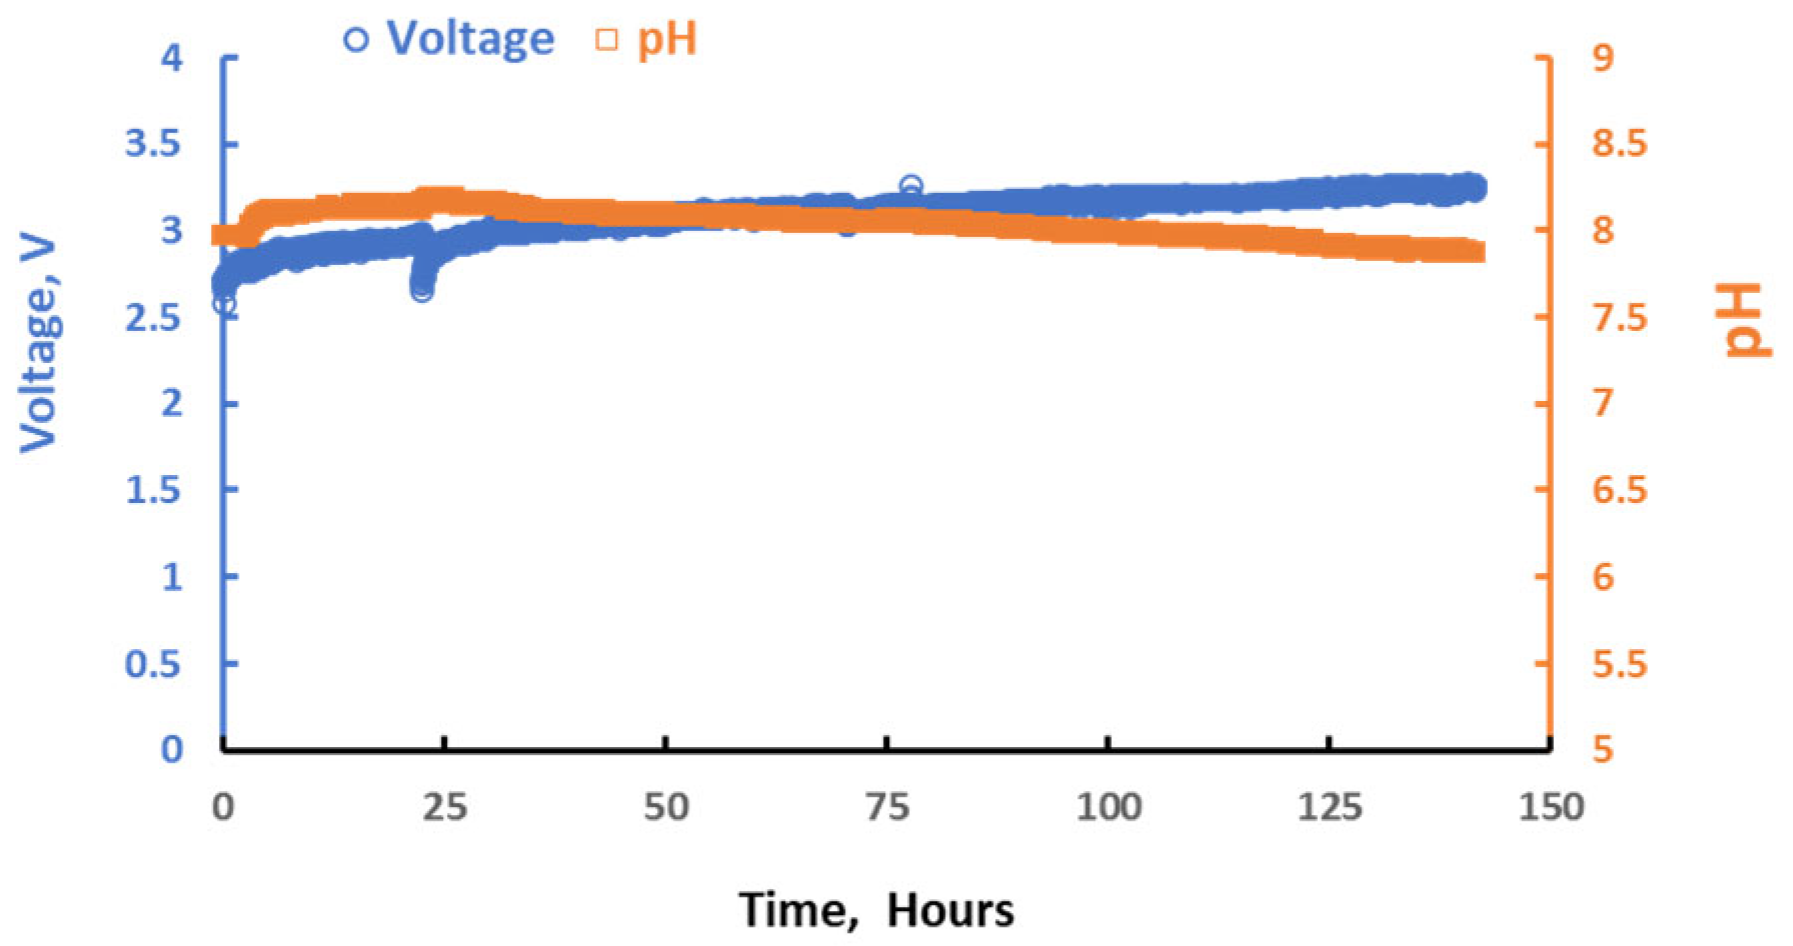
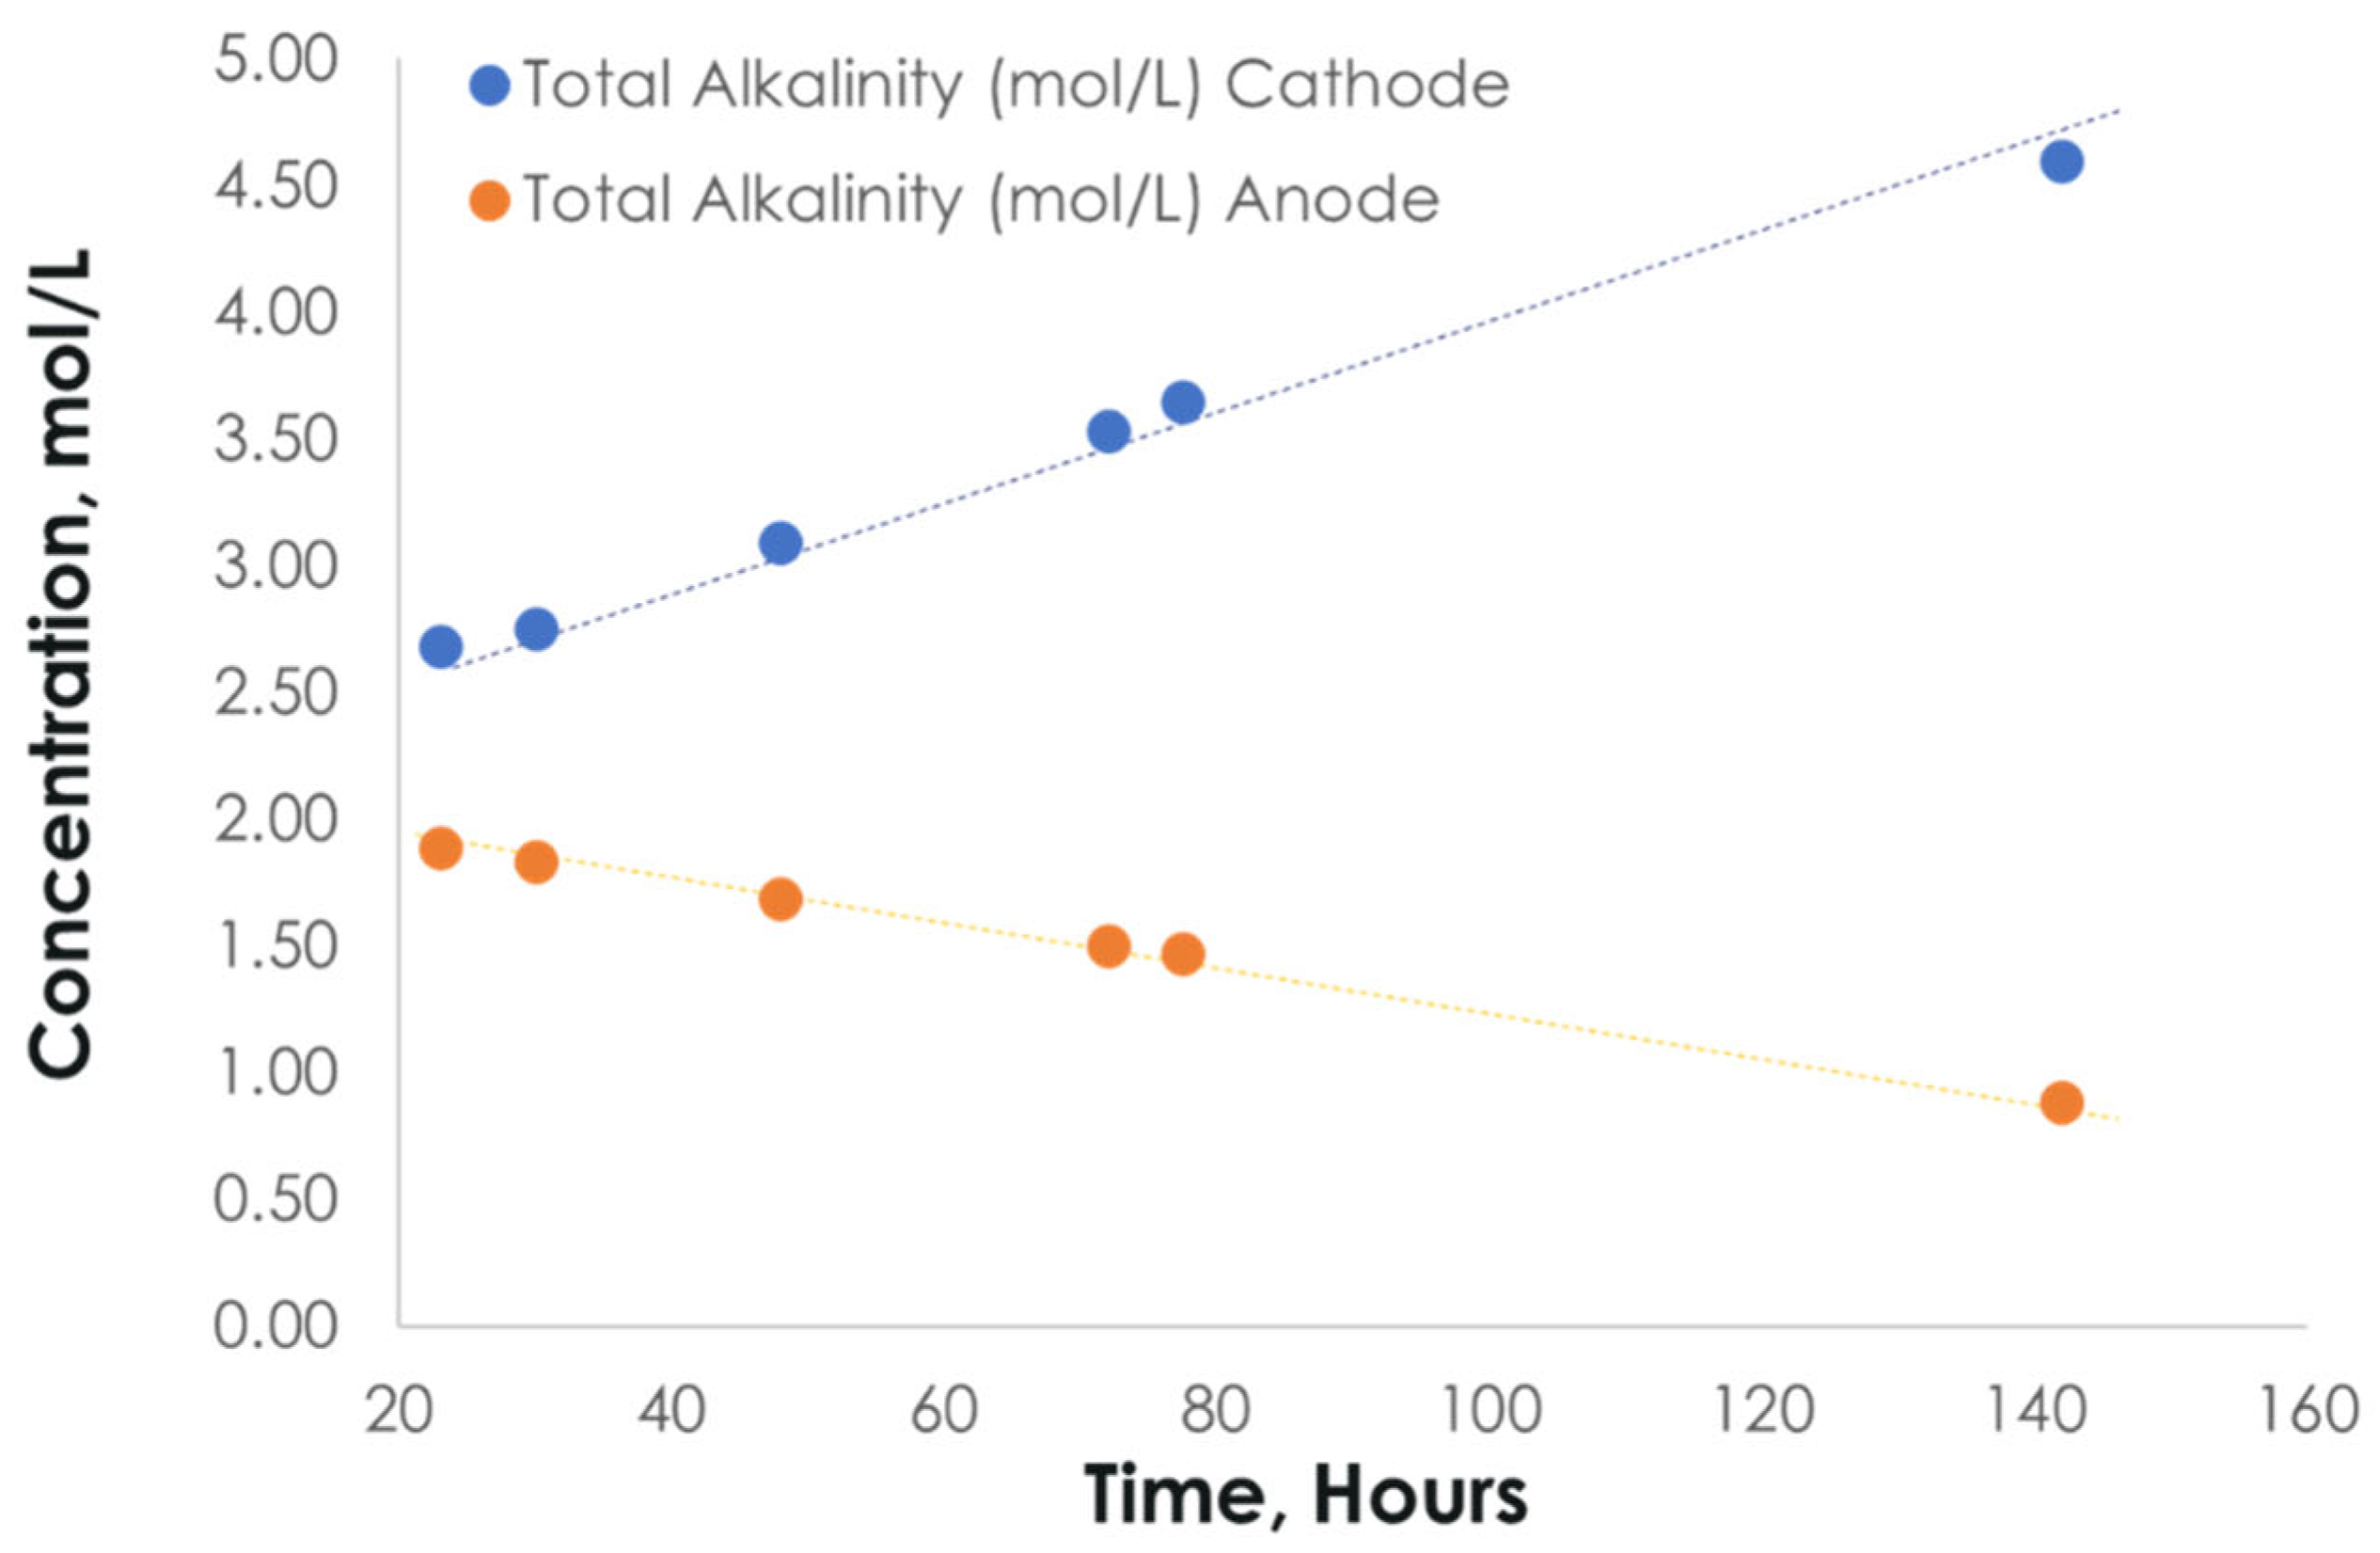
3.1. Operation of the Electrochemical Regenerator

Under normal operation, water electrolysis is composed of the hydrogen evolution reaction (HER, 2H2O + electrons = H2 + 2OH) as the cathode reaction and the oxygen evolution reaction (OER, 2H2O = O2 + 4H+ + electrons) as the anode reaction. The K2CO3 from the MA is fed to the anode side, while the KOH is the electrolyte in the cathode. K+ ions are transported via the cation-exchange membrane to the cathode to keep electroneutrality with OH, while CO32− or HCO3 reacts with protons generated at the anode to form dissolved CO2. Typically, with the decreasing pH of the anolyte solution due to these protons, carbonate/bicarbonate ions are converted to carbonic acid (Equations (1) and (2)) [29]. When there is saturated carbonic acid ( H 2 CO 3 , including dissolved CO2) for a desired gaseous CO2 partial pressure, a further pH decrease leads to the desorption of CO2 gas (Equation (3)) for a targeted CO2 delivery rate. The oversaturation point is determined by the CO2 release flow rate and electrolyte flow rate through the anode chamber. Meanwhile, KOH is regenerated in the cathode as a DAC absorbent as reported by Shu et al. [18,30]. Figure 3 demonstrates the relationship between such pH swing and CO2 release by the intermittent or sawtooth operation of the ER cell. It shows the polarization (voltage and current), pH, temperature, and CO2 release performance with time during continuous and sawtooth operation from 5 to 15 Amps. Applying current to the ER produces hydroxide in the cathode and proton in the anode while overcoming the charge (ion and electron) transport and reaction kinetics impedances that increase the voltage requirement beyond the thermoneutral (Enthalpy) voltage of 1.48 V (1.23 V, Gibbs thermodynamic potential). As shown in Figure 3a, the stabilized voltages at 5, 10, and 15 Amps were approximately 1.9, 2.4, and 2.7 V, respectively, corresponding to over-voltages of 0.7, 1.2, and 1.5 V relative to the thermodynamic minimum of the water-split reaction. Figure 3b shows the ER temperature. In continuous mode, the temperature is stable compared to in intermittent mode, where the temperature fluctuates with the fresh solution feed into the anode during the on/off cycle as anticipated. Figure 3c,d show the CO2 release performance corresponding to its pH at the anode. At 5, 10, and 15 Amps, the effluent anode pHs were 12.4, 10.7, and 10.1, respectively, for a constant liquid flow rate to the anode chamber. CO2 evolution is observed at pH 10.1, where there is sufficient driving force to overcome the gaseous CO2 partial pressure at the system operating pressure and where the solvent is bicarbonate-rich relative to carbonate, i.e., pH < pKa2~10.33. Leveraging the scale of the ER, a sawtooth operation was performed on the anode in batch mode for straightforward operation. The anode starts in continuous open-loop mode when its pH reaches the minimum setpoint, e.g., 9, and starts in intermittent closed-loop mode when its pH reaches the maximum setpoint, e.g., 10.2. Figure 3c shows the anode pH response for CO2 release with continuous mode operating before 400 min and with intermittent mode operating after 400 min, with pH control between pH 10.2 ↔ pH 9.5 and between pH 10.2 ↔ pH 9, resulting in a sawtooth-like pH wave. The cathode’s pH was maintained at a pH of 14 and above, the maximum resolution of the probe. Figure 3d shows the CO2 release performance at the anode. At 5 and 10 Amps with continuous mode, the resulting pH of ~11 was insufficient for facile CO2 liberation for a given liquid flow rate, while at 15 Amps, a slow release of 0.05 mmol/min was observed. However, with intermittent mode and anode pH control between pH 10.2 ↔ pH 9.0, the maximal CO2 release rate of 0.4 mmol/min was observed. The sawtooth pH waveform is a result of the intermittent operation mode. In this mode, the flow from the absorber to the anode chamber is periodically stopped, meaning that the anolyte volume remains fixed during each cycle. As a result, the pH decreases more rapidly compared to continuous operation. After a certain period, the flow is resumed, causing the pH to rise again. Repeating this cycle produces the characteristic sawtooth pattern in the pH profile. In order to have a higher release rate, anode pHs lower than current values will be needed due to the carbonate equilibria between the anolyte and CO2. The equilibrium condition changes with different K+ concentrations, dosing flow rates, and electrical current inputs.
HCO 3 CO 3 2 + H + pK a 2 = 10.33
H 2 CO 3 HCO 3 + H + p K a 1 = 6.35
CO 2 + H 2 O H 2 CO 3

3.2. Selection of Electrode Catalysts

Alkaline electrolysis faces challenges due to the sluggish oxygen evolution reaction (OER) at the anode, which requires higher energy due to its four-electron nature. Ruthenium (Ru) oxide and iridium (Ir) oxide are efficient OER catalysts, but their drawbacks include excessive cost and low stability. To address these issues, a dimensionally stable anode (DSA®) coated with IrO2 on a Ti mesh has been purchased and deployed, demonstrating high performance with low catalyst loading and increased utilization, making it a promising solution to enhance OER catalysis efficiency [31,32,33]. Figure 4 compares polarization (voltage vs. current density) performance for the DSA® and Platinum–titanium (Pt-Ti) mesh electrodes. The ohmic correction in Figure 4b uses the slopes of the corresponding lines in Figure 4a as the specific ohmic resistance. DSA® had superior performance to Pt-Ti during polarization testing under flow conditions with a KOH and K2CO3 electrolyte, saving > 0.5 V in applied potential at current densities up to 100 mA/cm2. The ERs were evaluated under two solvent conditions, including (a) 6M KOH as both the anolyte and catholyte and (b) 0.2M KOH + 1.1 M K2CO3 as a hypothetical highly conductive catholyte and 2M KHCO3 as the anolyte. The two test conditions demonstrated the effect on ER voltage of the change in alkalinity, including the different speciation of carbon with HCO3 as the target at the anode for CO2 recovery and a OH-rich solvent at the cathode for capture in the absorber.
Stability testing of the DSA® ER at 35 mA/cm2 with 2M KHCO3 as the anolyte and 3M KOH as the catholyte achieved ~3 V for 140 h with the anode pH maintained. Testing was conducted at room temperature in recirculating batch-mode operation. The alkalinity of the anolyte and catholyte was periodically assessed to track the expected alkalinity swing. Figure 5 shows that the voltage and anode pH remained stable during ongoing testing for 140 h. The nominal voltage was 3V at a current density of 35 mA/cm2, and the anode pH was stable at ~8, consistent with the expected alkalinity-to-carbon ratio of ~1. Figure 6 confirms potassium transport from the anode to the cathode and alkalinity swing during operation, where the anolyte alkalinity decreased but the catholyte increased during the test.

3.3. Integration of MA and ER

During operation, the integrated system achieved a carbon capture efficiency of about 90% from 10 cfm of air for over one hundred accumulated hours (on in the day and off at night) while operating at a voltage below 3.5 V, as shown in Figure 7. Solvent regeneration was accomplished at an operating current of 15 A, and carbon recovery (i.e., the fraction of captured CO2 recovered as a concentrate at the anode) of ~80% was maintained (Figure 8), consistent with previously demonstrated electrochemical CO2 concentration systems [34]. A potassium transport efficiency exceeding 85% was also achieved when the system operated in intermittent mode, i.e., allowing for the slow accumulation of carbon in the anolyte. The integrated system consistently achieved near-equivalent carbon capture and recovery rates using an alkaline solution with a concentration of approximately 3.0 M as the capture solvent. The absorber pH was maintained between 12.9 and 13.6, while the anode pH was controlled between 9.5 and 9.0, as in Figure 7a. The capture efficiency of the MA is between 85% and 95% based on the trendline in Figure 7b. The dips are due to MA pump malfunction. The voltage is nominally stable over the time as in Figure 7c. The performance evaluation revealed a particularly satisfactory level of stability in the system with no evidence of capacity loss. Fluctuations in the observed output were due to the range of process parameters evaluated. Figure 8 shows the accumulative CO2 during the whole operation. Based on the ratio of trendline equations’ slopes for capture and release, the carbon recovery rate was 80%. However, 100% recovery will be achieved in large-scale continuous application. Figure 9a shows that the regenerator energy consumption can be related to the alkalinity feeding rate if current is constant and the value is between 300 and 850 kJ/mol. The alkalinity feeding rate and carbon recovery ratio show a negative correlation, as evident in Figure 9b.

3.4. TEA and LCA of IDEA Process

The IDEA technology for DAC is designed to operate solely on electricity for the adsorption and regeneration phases. This bench-scale demonstration was assessed using TEA and LCA. In the TEA/LCA analysis, traditional low-pressure drop packing for the absorbent was considered, along with the inclusion of cryogenic CO2/O2 separation. Cost estimations for operation were calculated for energy use per tonne of CO2 captured for four different scenarios with different sources of electricity: (1) current U.S. grid mix at 546 kg CO2 e/MWh; (2) 2050 U.S. grid mix (EIA-AEO) at 434 kg CO2 e/MWh; (3) fossil power with CCS at 220 kg CO2 e/MWh; and (4) 100% renewables at 23 kg CO2 e/MWh. The cheapest cost of electricity that will be required to drive the process will be from renewables. The techno-economic analysis (TEA) estimates the cost of CO2 captured for the UKy-IDEA process in two scenarios: a 3500 tonnes of CO2 per year (tpy) capture case and fourteen-time scale-up to a 49,000 tpy capture case. The aim of the TEA was to estimate both capital and operating costs for the UKy-IDEA DAC process, including CO2 separation and H2 production. According to the capital cost analysis, the total plant cost (TPC) is USD 16 million. The main contributors to the capital cost are ER and CO2 purification, which account for 25% and 24% of the TPC, respectively. Additionally, the air contactor or CO2 absorber accounts for 8% of the TPC. In a process capturing 86% of CO2 in the air, producing 3500 tonnes per year of pure CO2 and 235 tonnes per year of H2 gas, the power requirement is 2.32 MMe. The ER constitutes the larger portion of the power requirement, accounting for 73% of the total power requirement. When converted into monetary currency, the cost of CO2 capture, including CO2 transportation, is USD 1112 per tonne of CO2. With a scale factor of fourteen, the cost of CO2 capture can be further reduced to USD 680 per tonne of CO2 without factoring in the revenue from the sale of H2 gas. Table 1 lists the costs of CO2 abated per tonne of CO2 captured for each of the four electricity scenarios, the three hydrogen credit scenarios, and both scales analyzed in the TEA. The ‘N/A’ entries indicate that no abatement is possible under those scenarios, either with no hydrogen production or with intensive emission. Hydrogen cost targets as low as USD 1/kg have been proposed, while current electrolysis hydrogen often fetches prices around USD 10/kg. For each case, 67 kg of H2 is produced per tonne of CO2 captured in the UKy DAC + H2 process. This results in an additional credit of USD 67–USD 670 per tonne of CO2 captured. Additionally, the DAC provisions in section 45Q of the U.S. federal tax code provide a pathway to an additional USD 185 per tonne of CO2 captured. Together, this represents additional value streams between USD 252 and USD 855 per tonne of CO2 captured. The impact of these H2 prices on the cost of CO2 abated is shown in Figure 10.
The Life Cycle Assessment (LCA) of the DAC system with hydrogen production aims to compare its environmental impacts to those of systems producing comparable products. Integrating the production of H2 with CO2 plays a major role in mitigating hard-to-abate emissions [35]. A range of factors such as hydrogen production, safety standard compliance, and the system’s development stage (Technology Readiness Level 3) are addressed in the assessment. This study utilizes the Tool for Reduction and Assessment of Chemicals and Other Environmental Impacts (TRACI) 2.1 method, combined with the latest global warming potential (GWP) factors from the Intergovernmental Panel on Climate Change (IPCC) Fifth Assessment Report. The assessment includes different electricity carbon intensity and hydrogen production scenarios to understand the overall impact of the DAC + H2 system. Three hydrogen accounting methods were employed: (1) accounting for the H2 product by displacing H2 production from steam methane reforming (SMR), (2) accounting for the H2 product by replacing H2 production from electrolysis, and (3) claiming no benefit from the co-production of hydrogen. These approaches align with current LCA methodologies for DAC systems [36,37]. Depending strongly on the energy source, the climate benefits of DAC could vary significantly. Over the range of energy supply scenarios evaluated, the displacement of an alternate hydrogen production method had a significant impact, as shown in Table 2. Negative values indicate an overall net reduction in atmospheric CO2 concentration, while positive values indicate a net increase in atmospheric CO2. The results show that the overall process impact can be positive or negative depending on the scenarios and hydrogen accounting method. For example, under the current U.S. grid mix, the net impact of the proposed DAC + H2 system ranges from an increase of 1.39 kg CO2 emitted per kg of CO2 captured and permanently sequestered if no credit for hydrogen generation is taken to an increase of 0.22 kg CO2 abated in the case where hydrogen production displaces CO2 produced via electrolysis. Conversely, under renewable energy sources, there is an overall net abatement of 0.83 kg CO2 emitted per kg of CO2 captured and permanently sequestered if no credit for hydrogen generation is taken, and 0.94 kg CO2 abated in the case where hydrogen production displaces CO2 produced via electrolysis. These results are consistent with prior studies highlighting that DAC’s climate performance is strongly dependent on the carbon intensity of its energy inputs and system boundary assumptions [38,39]. This study emphasizes the need for project-specific analysis to determine the true impact of a specific DAC installation, as the overall process impact can vary significantly across scenarios and hydrogen accounting methods.

4. Conclusions

The UKy IDEA process brings the advantages of (1) reducing the footprint of the treatment process by integrating capture and regeneration into two-unit operations, (2) eliminating the requirement for large thermal input and providing a cost-effective process, (3) producing hydrogen as a valuable product to offset the cost of capturing CO2 and (4) seamless compatibility with renewable DC electricity generation like solar or wind for standalone remote operation. The demonstrator showed stable CO2 recovery at ~80% over 100 h. The capacity to manage ambient air and high feed flow rates up to 17 m3 h−1 per module were observed. A major advantage of the IDEA module is its relative stability in ambient air, making it suitable for standalone deployment in remote areas, and its DC electrical power adaptation, which can be completely satisfied with renewable energy sources. The findings produced by this bench-scale demonstrator have guided the development of a larger 5 kg CO2 h−1 viable-scale production unit. The design and construction of this full-scale IDEA unit will prioritize reducing component and assembly costs for mass production. The data produced through the unit will facilitate the adjustment of operational parameters in the field to provide accurate and practicable measures of productivity at a larger scale. The results will further confirm the high performance of our technologies shown in this paper and provide precise capital and operational cost projections for commercial deployment.

Author Contributions

Conceptualization, J.W., X.G., A.O. and K.L.; Methodology, J.W., A.O. and K.L.; Software, A.B.; Validation, J.W., X.G., A.O. and K.L.; Formal analysis, J.W., X.G., A.B., A.O. and K.L.; Investigation, J.W., X.G., A.B., A.O. and T.C.; Resources, X.G., A.P. and K.L.; Data curation, K.L.; Writing—original draft, J.W.; Writing—review & editing, X.G., A.B., A.O., T.C., A.P. and K.L.; Visualization, J.W.; Supervision, J.W., A.O. and K.L.; Project administration, J.W., X.G., A.O., A.P. and K.L.; Funding acquisition, A.O., A.P. and K.L. All authors have read and agreed to the published version of the manuscript.

Funding

This research was funded by the U.S. Department of Energy, National Energy Technology Laboratory, grant number [DE-FE0032125 and No. DE-FE0032255].

Institutional Review Board Statement

Not Applicable.

Informed Consent Statement

Not Applicable.

Data Availability Statement

The raw data supporting the conclusions of this article will be made available by the authors on request.

Acknowledgments

The support of the PPL Corporation is gratefully acknowledged. Floyd Taylor provided much help in designing and constructing the electrochemical cells in the Department of Mechanical and Aerospace Engineering at the University of Kentucky. Steve Summers and Matthew Burton helped to wire pumps and with absorber module modifications. Kianna Marquez from Electric Power Research Institute (EPRI), Gabrielle Farrell, Megan Hellendall, and Babul Patel from NexantECA prepared the TEA and LCA.

Conflicts of Interest

The authors declare that they have no known competing financial interests or personal relationships that could have appeared to influence the work reported in this paper.

References

  1. Fasihi, M.; Efimova, O.; Breyer, C. Techno-economic assessment of CO2 direct air capture plants. J. Cleaner Prod. 2019, 224, 957. [Google Scholar] [CrossRef]
  2. Sholl, D.S.; Lively, R.P. Seven chemical separations to change the world. Nature 2016, 532, 435. [Google Scholar] [CrossRef] [PubMed]
  3. Sanz-Pe, E.S.; Murdock, C.R.; Didas, S.A.; Jones, C.W. Direct capture of CO2 from ambient air. Chem. Rev. 2016, 116, 11840. [Google Scholar] [CrossRef] [PubMed]
  4. Holmes, G.; Nold, K.; Walsh, T.; Heidel, K.; Henderson, M.A.; Ritchie, J.; Klavins, P.; Singh, A.; Keith, D.W. Outdoor prototype results for direct atmospheric capture of carbon dioxide. Energy Procedia 2013, 37, 6079. [Google Scholar] [CrossRef]
  5. Kulkarni, A.R.; Sholl, D.S. Analysis of equilibrium-based TSA processes for direct capture of CO2 from air. Ind. Eng. Chem. Res. 2012, 51, 8631. [Google Scholar] [CrossRef]
  6. Socolow, R.; Desmond, M.; Aines, R.; Blackstock, J.; Bolland, O.; Kaarsberg, T.; Lewis, N.; Mazzotti, M.; Pfeffer, A.; Sawyer, K. Direct Air Capture of CO2 with Chemicals: A Technology Assessment for the APS Panel on Public Affairs; American Physical Society: College Park, MD, USA, 2011. [Google Scholar]
  7. Lackner, K.S.; Ziock, H.-J.; Grimes, P. Carbon Dioxide Extraction from Air: Is It an Option? Technical Report LA-UR-99–583; Los Alamos National Laboratory: Los Alamos, NM, USA, 1999. [Google Scholar]
  8. Sievert, K.; Schmidt, T.S.; Steffen, B. Considering technology characteristics to project future costs of direct air capture. Joule 2024, 8, 979. [Google Scholar] [CrossRef]
  9. Rosen, N.; Welter, A.; Schwankl, M.; Plumeré, N.; Staudt, J.; Burger, J. Assessment of the potential of electrochemical steps in direct air capture through techno-economic analysis. Energy Fuels 2024, 38, 15469. [Google Scholar] [CrossRef]
  10. Sodiq, A.; Abdullatif, Y.; Aissa, B.; Ostovar, A.; Nassar, N.; El-Naas, M.; Amhamed, A. A review on progress made in direct air capture of CO2. Environ. Technol. Innov. 2023, 29, 102991. [Google Scholar] [CrossRef]
  11. McQueen, N.; Gomes, K.V.; McCormick, C.; Blumanthal, K.; Pisciotta, M.; Wilcox, J. A review of direct air capture (DAC): Scaling up commercial technologies and innovating for the future. Prog. Energy 2021, 3, 032001. [Google Scholar] [CrossRef]
  12. Sadiq, M.M.; Batten, M.P.; Mulet, X.; Freeman, C.; Konstas, K.; Mardel, J.I.; Tanner, J.; Ng, D.; Wang, X.; Howard, S.; et al. A pilot-scale demonstration of mobile direct air capture using metal-organic frameworks. Adv. Sustain. Syst. 2020, 4, 2000101. [Google Scholar] [CrossRef]
  13. Keith, D.W.; Holmes, G.; Angelo, D.S.; Heidel, K. A process for capturing CO2 from the atmosphere. Joule 2018, 2, 1573. [Google Scholar] [CrossRef]
  14. Liu, P.; Liu, H.; Li, K.; Fan, Z.; Lu, Q.; Sun, B.; Hu, L.; Yin, L.; Wang, X.; Liu, L. Recent advances in integrating solvent-based CO2 capture with electrochemical regeneration process: A review. Fuel 2025, 385, 133943. [Google Scholar] [CrossRef]
  15. Sun, K.; Tebyetekerwa, M.; Zhang, H.; Zeng, X.; Wang, Z.; Ru, T.E.; Zhang, X. Electrode, electrolyte, and membrane materials for electrochemical CO2 capture. Adv. Energy Mater. 2024, 14, 2400625. [Google Scholar] [CrossRef]
  16. Pei, Y.; Zhang, B.; Lu, Y. Carbon capture and utilization via electrochemistry, what’s next? Next Nanotechnol. 2023, 3, 100020. [Google Scholar] [CrossRef]
  17. Voskian, S.; Hatton, T.A. Faradaic electro-swing reactive adsorption for CO2 capture. Energy Environ. Sci. 2019, 12, 3530. [Google Scholar] [CrossRef]
  18. Shu, Q.; Sin, C.S.; Tedesco, M.; Hamelers, H.V.M.; Kuntke, P. Optimization of an electrochemical direct air capture process with decreased CO2 desorption pressure and addition of background electrolyte. Chem. Eng. J. 2023, 470, 144251. [Google Scholar] [CrossRef]
  19. Amini, K.; Cochard, T.; Jing, Y.; Sosa, J.D.; Xi, D.; Alberts, M.; Emanuel, M.S.; Kerr, E.F.; Gordon, R.G.; Aziz, M.J. In situ techniques for aqueous quinone-mediated electrochemical carbon capture and release. Nat. Chem. Eng. 2024, 1, 774. [Google Scholar] [CrossRef]
  20. Jin, S.; Wu, M.; Jing, Y.; Gordon, R.G.; Aziz, M.J. Low energy carbon capture via electrochemically induced pH swing with electrochemical rebalancing. Nat. Commun. 2022, 13, 2140. [Google Scholar] [CrossRef]
  21. Seo, H.; Hatton, T.A. Electrochemical direct air capture of CO2 using neutral red as reversible redox-active material. Nat. Commun. 2023, 14, 313. [Google Scholar] [CrossRef]
  22. Khoiruddin, K.; Wenten, I.G.; Siagian, U.W.R. Advancements in bipolar membrane electrodialysis techniques for carbon capture. Langmuir 2024, 40, 9362. [Google Scholar] [CrossRef]
  23. An, K.; Li, K.; Yang, C.-M.; Brechtl, J.; Nawaz, K. A comprehensive review on regeneration strategies for direct air capture. J. CO2 Util. 2023, 76, 102587. [Google Scholar] [CrossRef]
  24. Rivero, J.R.; Panagakos, G.; Lieber, A.; Hornbostel, K. Hollow fiber membrane contactors for post-combustion carbon capture: A review of modeling approaches. Membranes 2020, 10, 382. [Google Scholar] [CrossRef] [PubMed]
  25. Bazhenov, S.D.; Bildyukevich, A.V.; Volkov, A.V. Gas-liquid hollow fiber membrane contactors for different applications. Fibers 2018, 6, 76. [Google Scholar] [CrossRef]
  26. Nogalska, A.; Trojanowska, A.; Garcia-Valls, R. Membrane contactors for CO2 capture processes—Critical review. Phys. Sci. Rev. 2017, 2, 20170059. [Google Scholar] [CrossRef]
  27. Dindore, V.Y.; Brilman, D.W.F.; Feron, P.H.M.; Versteeg, G.F. CO2 absorption at elevated pressures using a hollow fibre membrane contactor. J. Membr. Sci. 2004, 235, 99. [Google Scholar] [CrossRef]
  28. Gabelman, A.; Hwang, S.T. Hollow fiber membrane contactors. J. Membr. Sci. 1999, 159, 61. [Google Scholar] [CrossRef]
  29. Wang, J.; Gao, X.; Omosebi, A.; Liu, K. Electrochemically Regenerated Solvent for Direct Air Capture with Co-Generation of Hydrogen at Bench-Scale. DOE Report: DOE-UKIDEA-32125-1; 2024, the U.S. Department of Energy Office of Scientific and Technical Information. Available online: https://www.osti.gov/biblio/2349461 (accessed on 9 June 2025).
  30. Shu, Q.; Legrand, L.; Kuntke, P.; Tedesco, M.; Hamelers, H.V.M. Electrochemical regeneration of spent alkaline absorbent from direct air capture. Environ. Sci. Technol. 2020, 54, 8990. [Google Scholar] [CrossRef]
  31. Park, J.E.; Lee, H.; Oh, S.; Kang, S.Y.; Choi, I.; Cho, Y.; Sung, Y. Electrodeposited mesh-type dimensionally stable anode for oxygen evolution reaction in acidic and alkaline media. Chem. Eng. Sci. 2019, 206, 424. [Google Scholar] [CrossRef]
  32. Trasatti, S. Physical electrochemistry of ceramic oxides. Electrochim. Acta 1991, 36, 225. [Google Scholar] [CrossRef]
  33. Zeng, K.; Zhang, D. Recent progress in alkaline water electrolysis for hydrogen production and applications. Prog. Energy Combust. Sci. 2010, 36, 307. [Google Scholar] [CrossRef]
  34. Lin, M.; Ehret, C.; Hamelers, H.V.M.; Heijne, A.T.; Kuntke, P. Energy efficient carbon capture through electrochemical pH swing regeneration of amine solution. ACS Sustain. Chem. Eng. 2024, 12, 7309. [Google Scholar] [CrossRef] [PubMed]
  35. Bouaboula, H.; Belmabkhout, Y.; Zaabout, A. Integrated CO2 capture and green hydrogen production: A promising approach for energy and cost reductions. Chem. Eng. J. 2025, 509, 161361. [Google Scholar] [CrossRef]
  36. Deutz, S.; Bardow, A. Life-cycle assessment of an industrial direct air capture process based on temperature–vacuum swing adsorption. Nat. Energy 2021, 6, 203. [Google Scholar] [CrossRef]
  37. Realmonte, G.; Drouet, L.; Gambhir, A.; Tavoni, M.; Longden, T.; Smith, S.M.; Glynn, J.R. An inter-model assessment of the role of direct air capture in deep mitigation pathways. Nat. Commun. 2019, 10, 3277. [Google Scholar] [CrossRef]
  38. Shin, W.J.; Lee, Y.; Yu, Y.; Ko, M.; Lee, C.; Song, H.H. Comparative life cycle greenhouse gas analysis of clean hydrogen pathways: Assessing domestic production and overseas import in South Korea. J. Clean. Prod. 2023, 425, 138907. [Google Scholar] [CrossRef]
  39. Terlouw, T.; Treyer, K.; Bauer, C.; Mazzotti, M. Life cycle assessment of direct air carbon capture and storage with low-carbon energy sources. Environ. Sci. Technol. 2021, 55, 11397. [Google Scholar] [CrossRef]
Figure 1. Scale-up Inconel flow ER showing (a) 3-D rendering, (b) plate view with the serpentine flow channel, and (c) assembled cell.
Cleantechnol 07 00050 g001
Figure 2. Integrated system of absorber and electrochemical regenerator.
Cleantechnol 07 00050 g002
Figure 3. Voltage and current (a), temperature (b), pH (c), and carbon dioxide release (d) response during the continuous and sawtooth operation of the electrochemical regenerator at 5 to 15 Amps. (The sawtooth response was highlighted within the red box).
Cleantechnol 07 00050 g003
Figure 4. Polarization performance of electrochemical regenerators configured with DSA® and Pt-Ti mesh electrodes under alkaline conditions (a) and after ohmic correction (b).
Cleantechnol 07 00050 g004
Figure 5. Stability testing of DSA® ER at 35 mA/cm2 with 2M KHCO3 as anolyte and 3M KOH as catholyte.
Cleantechnol 07 00050 g005
Figure 6. Alkalinity testing of anolyte and catholyte during extended operation at 35 mA/cm2 with 2M KHCO3 as starting anolyte and 3M KOH as starting catholyte.
Cleantechnol 07 00050 g006
Figure 7. pH (a), capture efficiency (b), and voltage (c) response during the long-term continuous operation of the integrated system at 15 Amps. (The red line in (b) shows the trend of the efficiency).
Cleantechnol 07 00050 g007
Figure 8. CO2 accumulative response for capture in MA and release in ER during long-term continuous operation of integrated system at 15 Amps.
Cleantechnol 07 00050 g008
Figure 9. Energy consumption (a) and carbon recovery ratio (b) over the ratio of current/(F × alkalinity feeding rate) where F is the Faraday constant (96,485 Cmol−1).
Cleantechnol 07 00050 g009
Figure 10. The cost of CO2 abated using credit from displacing H2 electrolysis.
Cleantechnol 07 00050 g010
Table 1. Costs of CO2 abated in different electricity, H2 credit, and TEA scale scenarios *.
TEA Scale Electricity/Hydrogen Credit Scenario
Current U.S. Grid Mix
No H2 CreditH2 SMR CreditH2 Electrolysis Credit
1XN/AN/A5032
14XN/AN/A3090
2050 U.S. Grid Mix
No H2 CreditH2 SMR CreditH2 Electrolysis Credit
1XN/AN/A3443
14XN/AN/A2115
Fossil Power with CCS
No H2 CreditH2 SMR CreditH2 Electrolysis Credit
1X136618111600
14X8391112983
Renewables
No H2 CreditH2 SMR CreditH2 Electrolysis Credit
1X13408181188
14X823502730
* Units are USD per tonne CO2 captured.
Table 2. Kg CO2e GWP impact per kg CO2 captured.
Electricity ScenarioHydrogen Credit Scenario
DAC with No H2DAC with H2DAC with H2
CreditSMR CreditElectrolysis Credit
Current U.S. Grid Mix1.3940.862−0.220
2050 U.S. Grid Mix1.0780.546−0.321
Fossil Power with CCS−0.081−0.614−0.695
Renewables−0.830−1.362−0.935
Disclaimer/Publisher’s Note: The statements, opinions and data contained in all publications are solely those of the individual author(s) and contributor(s) and not of MDPI and/or the editor(s). MDPI and/or the editor(s) disclaim responsibility for any injury to people or property resulting from any ideas, methods, instructions or products referred to in the content.

