Abstract
This study investigates the drying behavior and rheological properties of dehydrated sewage sludge from various wastewater treatment plants in the Liege region (Belgium). Emphasizing the characterization of key parameters to enhance sludge management strategies, a series of experiments were conducted, including total solid content (TSC) determination, volatile solid content (VSC) analysis, texture profile analysis (TPA), penetrometry, and oscillatory rheology tests. Results showed no significant trends between specific evaporation capacity and the analyzed variables, cohesiveness, TSC, VSC, hardness, yield, and flow point. However, a clear trend indicated that higher G′ values are associated with improved drying rates. This aligns with the existing literature, suggesting that the viscoelastic properties of sludge, represented by G′, could potentially predict drying performance. A strong correlation between G′ and cohesiveness was also observed, recommending the use of G′ as the primary parameter due to the standardization and reliability of rheological tests. Despite the limited sample size, the study provides a valuable starting point for future research. Further investigations with larger sample sizes and controlled laboratory conditions are recommended to validate these findings and establish ranges within which the studied properties can be useful for future calculations and analyses. These efforts will contribute to optimizing sludge drying processes and promoting sustainable wastewater treatment practices.
1. Introduction
Wastewater treatment plants (WWTPs) consist of a series of well-defined stages involving physical, chemical, and microbiological operations to eliminate contaminants. These operations produce sewage sludge (SS), a complex mixture comprising microorganisms, traces of inorganic matter, and occasional pollutants derived from human activity. SS composition is variable and depends on the treatment used, the origin of waste water, the localization of WWTP, and the water content or the total solid content (TSC) of SS itself, among others variables [1].
The increasing production of sewage sludge presents a significant challenge both domestically and industrially, reflecting the rapid growth and urbanization of global society. As more populations and industrial sectors connect to wastewater treatment systems, the amount of sludge generated is rising exponentially. For instance, in Europe, sewage sludge production reached approximately 12 million tons in 2022, doubling since 1995 [2]. This trend poses considerable challenges in terms of management and final disposal of sludge, especially within the context of increasingly stringent environmental legislation. Current regulations impose rigorous limits on emissions and the quality of treated waste, compelling wastewater treatment plants to adopt more efficient and sustainable management practices [3].
Throughout its treatment, SS transitions from a Newtonian liquid to a dry solid. Initially behaving as a Newtonian liquid with a TSC of 0.5 to 1% during pretreatment phases, it becomes a highly viscous non-Newtonian liquid with a TSC between 1 and 5% [4,5,6]. Following mechanical dewatering, SS is transformed into a mud-like substance also known as dehydrated sewage sludge (DSS), with a TSC of 20 to 30% [7,8,9,10,11], eventually drying into a granular solid during thermal treatment, with a TSC higher than 95% [12,13,14].
Drying, a critical post-dewatering step, addresses numerous challenges and represents the most energy-intensive and sometimes the most expensive operation in SS management [15]. The composition of DSS, including moisture, volatile content, particle distribution, surface area, porosity, and structure, varies based on its origin, significantly affecting the efficiency of the drying process [16]. For example, DSS with higher volatile solid content dries slowly and shows reduced evaporation capacity, while DSS with lower initial moisture content dries more efficiently and yields a better-quality product. Moreover, the rheological and textural behavior of DSS is crucial as changes in structure affect the drying rate [17,18,19,20]. Some authors have found that it is possible to predict the drying behavior of the DSS by understanding and knowing its hydro-textural characteristics, as well as the dewatering and shrinkage aptitude [21]. As a consequence, many authors have studied how the viscoelastic and textural properties of DSS behave and change with the dewatering conditions, as well as the addition of substance (flocculants and coagulants), in order to predict, optimize, and control DSS management including its drying [16,22,23,24].
This study explores the variability of textural properties and their influence on DSS drying behavior, alongside the historical factors associated with DSS origins and treatment processes, providing a holistic understanding of DSS mechanical properties and drying behavior, using real processed samples of DSS. Moreover, this study provides a valuable starting point for identifying the best way to measure the texture of DSS and the ranges for some textural properties such as hardness, cohesiveness, adhesiveness, and storage modulus (G′). A strong correlation was identified between G′ and cohesiveness, and a clear trend was observed suggesting that higher G′ values are associated with better drying rates, aligning this study with the existing literature, indicating that the viscoelastic properties of sludge, as represented by G′, could describe or predict drying performance.
2. Materials and Methods
2.1. Dehydrated Sludge Samples
DSS samples were collected from five WWTPs around the city of Liège, Belgium: Embourg (S1), Lantin (S2), Grosses-Battes (S3), Sclessin (S4), and Oupeye (S5). Each sample was stored at 4 °C throughout the experimental period to prevent biochemical activity and loss of integrity. The geographical layout of these WWTPs is illustrated in Figure 1.
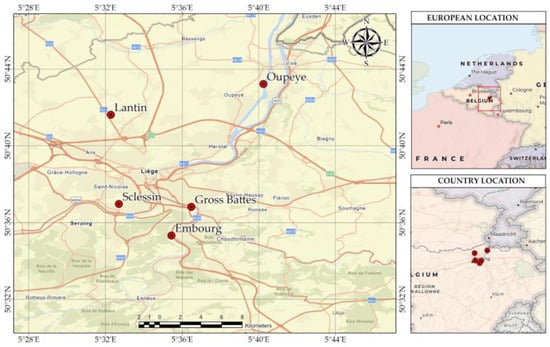
Figure 1.
Map of localization of Liege WWTPs considered in the study.
2.2. Total Solid Content and Loss on Ignition
TSC and loss on ignition, which reflects the volatile solid content (VSC), were determined following the standard methodologies [25]. This involved drying the samples at 105 °C until a constant mass was achieved, followed by calcination at 550 °C for 2 h to quantify the organic matter content through weight loss.
2.3. Penetrometry, Texture Profile Analysis, and Oscillatory Rheology
Penetration and texture profile analysis (TPA) tests were performed using a universal traction machine of LS1penetrometer (AMETEK Lloyd Instruments, West Sussex, England) equipped with a 10 N probe and a 30 mm diameter spherical geometry probe for penetration tests, and a flat circular head (diameter = 60 mm) for TPA. The rheological behavior was evaluated using an MCR302e modular rheometer equipped (Anton Paar, Graz, Austria) with a 50 mm diameter serrated parallel plate geometry, controlled by Rhocompass 1.30 software. All measurements were carried out at a controlled temperature of 20 °C to prevent moisture evaporation from the samples and ensure consistency [14,26].
2.3.1. Penetration Test
DSS samples weighing 60 g were placed in an aluminum capsule and penetrated to a depth of 15 mm at a constant speed of 1 mm/s [20]. This setup simulates the practical conditions that DSS might encounter in handling and processing.
2.3.2. Texture Profile Analysis Test
Samples were molded into cylinders measuring 18 mm in diameter and 30 mm in height. The samples were subjected to a dual-round compression test using a flat circular head with a diameter of 60 mm. The compression was performed to achieve 30% of the original sample height at a constant speed of 1 mm/s. This testing protocol is crucial for evaluating how the material behaves under pressure, providing valuable data on its hardness, cohesiveness, and adhesiveness. These properties are essential for understanding the structural integrity and processing suitability of DSS [11,27].
2.3.3. Oscillatory Rheology Test: Amplitude Sweep Test
The tests were carried out in a controlled environment, with a logarithmic shear strain ramp from 0.01 to 1000% at a constant angular frequency of 1 Hz. To maintain consistency in sample conditions, a pre-shearing process was instituted for 1 min at a shear rate of 0.05% and frequency of 1 Hz, followed by a 10-minute rest period before measurements. This procedure ensures minimal structural changes, thus providing reliable and repeatable results [14,26].
2.4. Convective Drying Tests
Drying experiments were performed in a specially designed micro-drier, capable of handling small individual samples ranging from 0.5 to 5 g. The test followed controlled conditions with an air temperature of 90 °C, airflow velocity of 2 m/s, and ambient humidity maintained at approximately 0.005 kg water per kg of dry.
The dryer is illustrated in Figure 2 and consists of two main components: the air conditioning and feeding system, and the drying chamber. Compressed air is supplied from the laboratory network, with its flowrate regulated by a pneumatic valve connected to a mass flowmeter. The air can be humidified by introducing steam from a generator, heated to the desired temperature via a heating channel, and subsequently directed into the drying chamber.
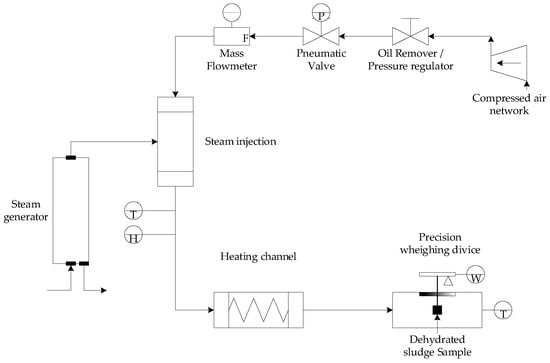
Figure 2.
Micro-dryer unit adapted from [28].
Within the drying chamber, the sludge extrudate is placed on a supporting grid attached to a precision balance (BP 150, Sartorius, Göttingen, Germany) with an accuracy of 0.001 g. This setup ensures uniform drying across the entire external surface of the sample. The balance is connected to a PC, which records the mass every five seconds.
The drying exchange surface and volume of sludge samples were measured using the methodology developed by A. Léonard (2002) [28]. During the experiments, the samples were periodically removed from the dryer chamber and placed about 2 min into a Skyscan-1074 X-ray scanner (Skyscan, Ghent, Belgium) in order to obtain images of several cross-sections. This procedure was repeated approximately ten times without affecting the drying kinetics. The obtained images, with a pixel size of 41 μm, were reconstructed using the Skyscan/NRecon V1.7.4.2 software. Matlab 2024® software was subsequently used to determinate the average equivalent diameter [mm] and average height [mm] and finally calculate the surface area of the sample. The obtained data were used to generate the Krischer’s curve of DSS drying.
Figure 3 shows from left to right the raw images obtained from tomography, a transversal cut obtained from NRecon, and finally a processed black and white image from Matlab 2024® software.
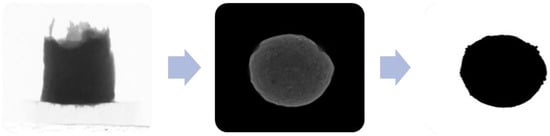
Figure 3.
Sequence of DSS image reconstruction.
3. Results and Discussion
3.1. General Differences in Treatment Process
It is essential to highlight the differences in the treatment process between the various stations. As previously mentioned, the origin has a significant impact on DSS rheology, texture, and consequently, on the drying behavior. To understand these differences, we relied on surveys conducted with WWTP supervisors, although unfortunately we were unable to obtain detailed responses.
Table 1 summarizes the key characteristics of the WWTPs considered in this study, which could potentially influence the behavior and properties of the samples. The table does not show significant differences in the types of treatments employed, but there could be substantial variations in the techniques or equipment used. However, the available data indicate differences in capacity and commissioning years, which could have a noticeable impact on the results. In Table 1, symbols  and ✘ mean if the treatment is done or not in each WWTP respectively.
and ✘ mean if the treatment is done or not in each WWTP respectively.
Table 1.
Highlights of the WWTPs considered in the study.
From Table 1, we obtained six samples in total, four being sludge not subjected to liming and two subjected to it, with S3 being the only sample that we have before and after liming.
3.2. Samples Differences
TSC allows us to identify valuable characteristics of the material, such as the minimum achievable sample mass following the process of conductive drying and the initial moisture content or humidity of the sample. As shown in Table 2, the TSC for the five stations ranges between 14 and 25%. TSC also provides insights into the effectiveness of the plant’s dewatering system. For instance, Grosses-Battes (S3/SL3) and Lantin (S2) appear to have less effective mechanical dewatering systems compared to Embourg (S1) and Oupeye (S5). The literature indicates that there is no universally superior mechanical dewatering system; the choice of equipment depends on multiple factors such as desired final dryness, cost, compatibility, and productivity. The results suggest that it is most relevant to compare samples with similar TSC, such as S2–S3 and S4–S5.
Table 2.
TSC and VSC of DSS samples.
Most importantly, the impact of lime on reducing sludge humidity is evident when comparing the TSC of S3 and SL3. Liming is a widely practiced method worldwide because it increases TSC, reduces the VSC, making DSS more stable and easier to store. When performed correctly, this process also facilitates the drying of the sludge [29,30,31].
VSC represents the organic components of the sludge, usually valorized for agricultural applications. Higher volatile solid content in sludge enhances its effectiveness for agricultural uses. The data indicate, as expected, that samples subjected to liming have a lower content of volatile solids (less than 40%) compared to those that were not limed, which had a VSC greater than 60%, classifying them as organic sludge. According to the VSC, samples can be classified into two groups: mostly organic (S1, S2, S3, and S5) and mostly inorganic (S3L and S4).
3.3. Penetration Test Results
The penetration test, as described in the methodology, consists of a two-phase cycle: compression (loading) and decompression (unloading). This test is critical for evaluating the mechanical properties of the dehydrated sewage sludge (DSS) samples [20,32]. Figure 4 shows the standard penetration curve obtained in this type of experiment, and the mean values of adhesiveness and cohesiveness are shown in Table 3.
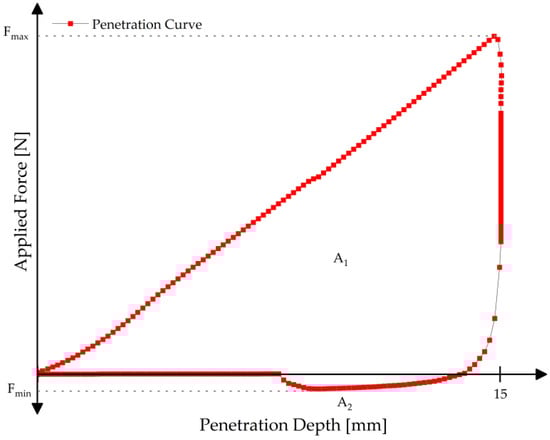
Figure 4.
Standard force–depth curve obtained from penetration test.
Table 3.
Penetration results.
From Figure 4, it is possible to calculate the following variables.
- Firmness/Hardness [N]: Defined as the maximum positive peak force during the compression test (Fmax), representing the force required for the probe to penetrate the sample to its maximum depth. Fmax is commonly associated with the sample’s firmness or hardness.
- Compression Work [mJ/Nmm]: Represented by the positive area under the curve up to Fmax (A1), corresponding to the work carried out by the probe during the compression test on the sample.
- Adhesive Force [N]: Defined as the minimum negative peak force during the separation of the sample from the probe (Fmin). A larger negative value of Fmin indicates a more adhesive material.
- Adhesiveness/Stickiness [mJ/Nmm]: Reflected by the negative area under the curve (A2), representing the work required to detach the probe from the sample. This parameter is linked to the sample’s adhesiveness, stickiness, or tackiness index, indicating the energy required to separate the sample from surfaces.
- Rigidity [N/mm]: Represented by the initial slope of the positive part of the penetration curve, which is related to the rigidity of the sludge sample.
- Cohesive Load [kPa]: Defined as the maximum load value recorded when the probe penetrates the sample, reflecting the sample’s cohesiveness.
In this study, only the values of adhesiveness and cohesiveness will be calculated, as previous publications have identified these parameters as the most important in terms of sludge drying, handling, and treatment [33,34].
The results indicate notable differences in the mechanical properties of the samples:
- Cohesiveness [kPa]: Sample S2 exhibited the highest cohesiveness (56 kPa), suggesting a denser and more resilient structure compared to other samples, indicating a greater ability to withstand deformation. Sample S3 showed the lowest cohesiveness (15 kPa), indicating a softer material. Interestingly, the limed sample SL3 showed slight improvements in cohesiveness (27 kPa) compared to its limed counterpart, suggesting that liming could improve the mechanical properties of DSS.
- Adhesiveness [N]: There were appreciable differences in adhesiveness among the samples. Sample S1 showed the highest adhesiveness (1.113 N), indicating a higher tendency to stick to surfaces, while sample S3L had the lowest adhesiveness (0.113 N), followed by S4 (0.166 N), suggesting that liming can reduce the pasty behavior of DSS.
3.4. Texture Profile Analysis (TPA) Results
The TPA tests were conducted to evaluate the textural properties of the dehydrated sewage sludge (DSS) samples. The TPA compression tests involved two rounds of compression, achieving 30% compression of the sample height. This testing protocol is crucial for evaluating the material’s response to deformation and its mechanical stability [34]. Figure 5 shows the standard force–time curve obtained from a TPA test, and the average values of adhesiveness cohesiveness and hardness obtained by TPA are shown in Table 4.
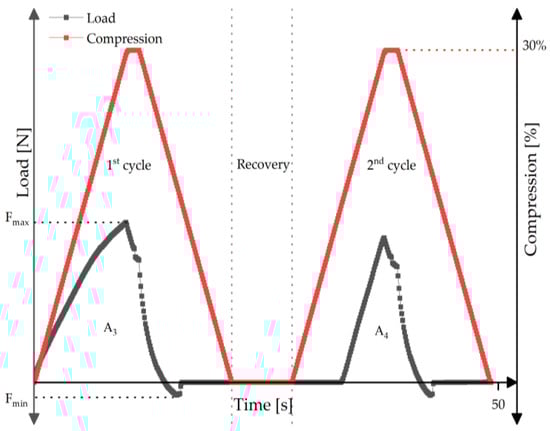
Figure 5.
Standard force–time curve obtained from TPA test.
Table 4.
Texture profile analysis (TPA) results.
The force–time curves obtained from the TPA tests typically show two significant peaks corresponding to the two compression cycles [33,35]. These peaks provide insights into various textural properties:
- Cohesiveness [dimensionless]: Calculated as the ratio of the area under the second compression curve (A4) to the area under the first compression curve (A3). This dimensionless parameter reflects how well the sample withstands a second deformation relative to its initial structure.
- Adhesiveness [N∙s]: Defined as the negative area during the first compression cycle, representing the work required to pull the compressing plunger away from the sample. Higher values indicate a more adhesive material.
- Hardness [N]: Represented by the maximum force (Fmax) during the first compression cycle. This parameter indicates the resistance of the sample to deformation. Higher values suggest a firmer material.
Other textural properties such as gumminess, springiness, resilience, chewiness, and fracturability can be calculated from the diagram, but they are more related to food science [36].
The TPA results indicate significant variations in the textural properties of the DSS samples:
- Cohesiveness: The cohesiveness values ranged from 23% to 37%. Sample S5 had the highest cohesiveness (37%) followed by samples S3L (32%) and S2 (31%), indicating that they retain their structure better under repeated deformation. Conversely, sample S3 showed the lowest cohesiveness (23%), again suggesting that liming can improve the structural integrity of the sludge.
- Adhesiveness: The values for adhesiveness were found to be minimal and did not vary significantly among the samples, as the method was not apt for measuring this property in the given context.
- Hardness: Samples S3L and S4 exhibited the highest hardness values (2.85 N), indicating a firmer texture. In contrast, sample S3 showed the lowest hardness (1.67 N), suggesting again that liming can improve the material’s texture.
3.5. Oscillatory Rheology Test Results
The rheological properties of the sludge samples were assessed using amplitude sweep tests, providing critical insights into their viscoelastic behavior. These tests measure how the material responds to stress and strain, revealing information about its structural integrity and deformation characteristics. The results are presented in the form of rheograms, with shear strain (γ) on the X-axis and the storage modulus (G′) and loss modulus (G″) on the Y-axis. Both axes are in a logarithmic scale [33]. Figure 6 shows a typical rheogram obtained during the experiments.
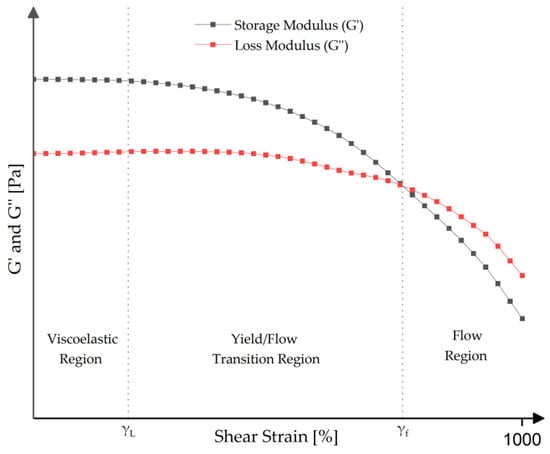
Figure 6.
Standard rheogram obtained from oscillatory rheology results.
The rheogram shown in Figure 6 describes the behavior of all the samples studied, with some differences in the order of magnitude. In all cases, the storage modulus (G′) is initially greater than the loss modulus (G″), i.e., G′ > G″, indicating that, at low stress, the DSS samples behave like viscoelastic gels. This suggests that they can be considered like solids with a certain degree of viscoelasticity.
As the shear strain (γ) increases, G″ decreases, giving rise to three distinct regions in the graph. Initially, in the Linear Viscoelastic Region (LVE), G′ remains constant, with G′ > G″, indicating that the material undergoes elastic deformations without compromising its internal structure. The boundary of this region corresponds to the yield strain or yield point (γL), which marks the point beyond which irreversible deformations begin to occur. As the deformation continues to increase, the material enters the Transition Region, where G′ > G″ still holds; however, the sludge undergoes irreversible deformation as its microstructure is progressively destroyed. This process is evidenced by the decrease in the G′ modulus, although the material retains its solid-like behavior. Finally, upon reaching the flow point (γF), the G′ and G″ moduli become equal, indicating the transition into the Flow Region, where the material begins to flow under the influence of external forces. At this stage, the sludge’s internal structure is completely destroyed, resulting in a predominantly viscous behavior, characterized by G″ > G′ [14,26,33,37,38]. The mean values of G′, γL and γF for all the studied samples are shown in Table 5.
Table 5.
Amplitude sweep results.
From the oscillatory rheology results shown in Table 5, we can infer the following:
- Linear Viscoelastic Region (LVE) and yield point (γL): Sample S3L exhibited the largest γL (0.50%), suggesting it has the most stable structure under low strain. In contrast, sample S3 had the smallest LVE (0.12%), indicating that liming raises the strain tolerance of the sludge.
- Storage Modulus: Sample S2 exhibited the highest G′ (41 kPa), indicating a firmer, more elastic structure. Conversely, sample S3 had the lowest G′ (25 kPa), not so far off its liming counterpart S3L with G′ (28 kPa).
- Flow Point (γf): Sample S3L had the highest flow point (112%), indicating a higher resistance to flow compared to other samples. Sample S3 had the lowest flow point (97%), further supporting the observation that liming improves the structural integrity of the sludge.
These findings underscore the significant impact of treatment processes, especially liming, on the rheological properties of DSS. The reduced viscoelastic stability and decreased resistance to deformation in non-limed samples suggest that while lime treatment can facilitate drying, it may also raise the mechanical stability of the sludge, which could affect its handling and practical applications.
The analysis of the relationship between G′ and the other measured properties of DSS revealed that only cohesiveness, assessed through the penetrometry test, showed a strong positive Pearson correlation (r = 0.92). This suggests that as G′ increases, cohesiveness also increases significantly, following a linear trend.
3.6. Convective Drying Test Results
The drying experiments were designed to evaluate the drying behavior and efficiency of the DSS samples. The evaporation rate [kgw/m2h] was calculated and normalized by the dryer packed bed area (m2), obtaining the drying flux [kgw/m2h], then plotted against the water content on a dry basis [kgw/kgDS] to obtain pseudo Krischer curves. This approach, widely employed in drying process investigations, helps in understanding the drying dynamics of the samples [17,39].
A typical Krischer’s curve (Figure 7) can be segmented into distinct periods. The first period, or the preheating period [Xo–X1], represents a period of adaptation of the sample to the drying conditions. The second period, or the constant-flux period [X1–X2], represents the interval during the supplied heat which serves essentially to evaporate the sludge-free water. The third period, or the first falling-flux period [X2–X3], corresponds to the interval in which the heat serves to evaporate the interstitial water and heat the sludge. The final period, or the a second falling-flux period [X3–X4], corresponds to the end of the drying; in this period, the heat evaporates the bound water [40,41,42,43].
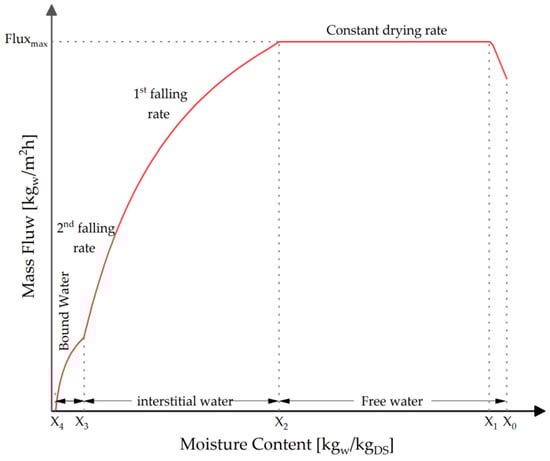
Figure 7.
Theoretical Krischer’s curve.
The Krischer’s curve for dehydrated sludges (centrifugated or filtrated) is slightly different from the theoretical curve presented in Figure 7. Since the free water has already been removed from the sludge during the dehydration operation, the second period, or constant-rate drying period [X1–X2], is not visible or is very short, making it difficult to parameterize. Additionally, the difference between the third and fourth periods is not always sufficiently noticeable, so it is considered a single falling-rate period of [X2–X4]. Figure 8 shows the obtained Krischer’s curves for the six samples.
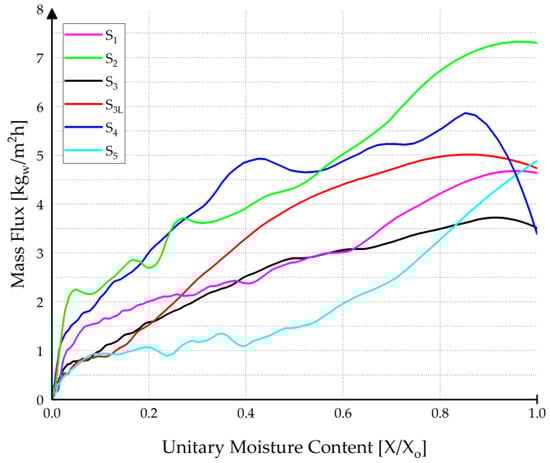
Figure 8.
Obtained Krischer’s curve for DSS samples.
From the curves, it can be seen that the samples that were limed (S3L and S4) present a higher drying speed than those that did not receive the treatment. In the case of sample S3, the increase in the maximum drying speed (plateau value) is around 40%. Table 6 shows, for the set of samples, the drying time required to achieve 90% (Dt 90%) of dry solid content and the corresponding specific evaporation capacity (SEC) (at plateau value) and the shrinkage percent during drying in terms of external area and volume reduction (Ar and Vr, respectively). The latter is important for process extrapolation as it refers to the amount of water removed by surface unit of the belt dryer and by hour.
Table 6.
Drying test results.
The drying results highlight significant differences in the drying behavior and efficiency of the DSS samples:
- Drying Time: Sample S2 and S4 exhibited the shortest drying time (45 min) to achieve 90% dry solid content, suggesting a more efficient drying process. Sample S3 had the longest drying time (150 min); in contrast, sample S3L has a time of 115 min, showing that, for the same sample, the liming operation improves the drying rate.
- Specific Evaporation Capacity: Sample S2 also showed the highest specific evaporation capacity (7.4 kg/m2 h) followed by samples S4 and S3L with specific evaporation capacities of 5.3 kg/m2 h and 5.1 kg/m2 h, respectively, further confirming its efficient drying behavior. Sample S3, however, had the lowest specific evaporation capacity (3.5 kg/m2 h), reinforcing the observation that liming can favorably affect the drying rate.
The relationship between the specific evaporation capacity and various measured variables, including TSC, VSC, TPA results, penetration results, LVE, γL and γf, revealed no significant correlations or trends, but G′ and penetrometry cohesiveness (which is logical given the positive correlation between them) showed a clear positive trend, suggesting that higher values of G′ are associated with better drying rates. This trend aligns with the existing literature, which indicates that more structured DSS dries faster and shows that its the viscoelastic properties of Have a direct influence on DSS thermal drying [29,30,31,44]. However, it is important to note that the current data do not provide sufficient evidence to conclusively determine the predictive power of the storage modulus (G′) on the drying performance of dehydrated sewage sludge due to the sample size that was analyzed.
Considering the different origins of DSS samples, the observed trend between higher G′ values and better drying rates appears to be consistent. However, it is recommended to conduct experiments using DSS samples from the same origin that exhibit variable G′ values. This approach would help to minimize the noise from other uncontrollable parameters and provide a clearer understanding of the specific influence of G′ on drying performance. To ensure consistent handling and control over the samples, they can be created in the laboratory. By controlling the sample origin and characteristics in a laboratory setting, future studies can more accurately isolate the impact of G′ and validate its predictive power in determining the drying efficiency of dehydrated sewage sludge.
4. Conclusions
This study investigated the textural properties and drying characteristics of dehydrated sewage sludge (DSS) from various wastewater treatment plants in the Liège region, Belgium. The analysis revealed significant variability in key properties, including the storage modulus (G′ ranging from 28 to 41 kPa, cohesiveness from 15 to 56 kPa, total solid content (TSC) between 14.35 and 24.58%, volatile solid content (VSC) from 40.4 to 77.8% of TSC, adhesiveness between 0.113 and 1.113 N, and hardness ranging from 1.67 to 2.15 N. Rheological tests indicated that DSS behaves like a viscoelastic gel under shear strains below 0.2%, losing its structure and transitioning to a flowable state at shear strains of approximately 100% to 112%.
Furthermore, the drying behavior analysis provided insights into the relationship between these properties and the specific evaporation capacity. Understanding these variations is essential for optimizing sludge drying processes, particularly in terms of improving energy efficiency and process performance across wastewater treatment facilities.
The results did not show significant correlations between the specific evaporation capacity and the analyzed variables. However, a clear trend was observed suggesting that higher G′ values are associated with better drying rates. This trend aligns with the existing literature, indicating that the viscoelastic properties of sludge, as represented by G′, could potentially describe or predict drying performance.
A strong correlation was identified between G′ and cohesiveness. Despite this, it is recommended to use G′ as the primary parameter for predicting sludge drying performance, as rheological tests for G′ are more standardized and reliable compared to penetration tests for cohesiveness. To validate this hypothesis and gain a more robust understanding, future research with a larger sample size is recommended.
Moreover, this study provides a valuable starting point for identifying the ranges within which the studied properties can be useful for future calculations or analyses. Establishing these ranges will facilitate more accurate and practical applications in sludge management and treatment processes.
In summary, while the current data are insufficient to conclusively determine the predictive power of G′ on drying performance, the observed trend is promising and warrants further studies with a more controlled approach and an expanded sample size. These efforts will contribute to improved sludge management practices, optimizing drying efficiency and promoting greater sustainability in wastewater treatment operations.
5. Future Directions
This study presents a detailed analysis of the drying behavior and rheological properties of real samples of dehydrated sewage sludge from various wastewater treatment plants in the Liège region. However, due to the limited sample size, no parametric statistical analyses were conducted. Future research should prioritize larger sample sizes to improve the reliability and robustness of the statistical findings, enabling more accurate and generalizable conclusions regarding the relationships between rheological properties, cohesiveness, and drying performance.
Additionally, further investigations could benefit from advanced statistical techniques and multivariate analyses to better capture the complex interactions among these variables. Such research would contribute to more efficient and sustainable sludge management practices. Future studies should also aim to explore the influence of conditioning and dewatering on dehydrated sludge rheological behavior, assess the relationship between rheological characteristics and drying rates—particularly in convective drying processes—and develop models that integrate rheological properties into drying kinetics. Ultimately, these efforts could provide industries with practical tools and insights to optimize sludge drying efficiency.
Author Contributions
Conceptualization, S.L.P.-A., M.W.A.S. and A.L.; data curation, S.L.P.-A. and M.W.A.S.; formal analysis, S.L.P.-A. and M.W.A.S.; funding acquisition, A.L.; investigation, S.L.P.-A. and M.W.A.S.; methodology, S.L.P.-A., M.W.A.S. and A.L.; software, S.L.P.-A.; supervision, A.L.; visualization, A.L.; writing—original draft A.L., S.L.P.-A. and M.W.A.S.; writing—review and editing, S.L.P.-A., M.W.A.S. and A.L. All authors have read and agreed to the published version of the manuscript.
Funding
This work was supported by the Fund for Scientific Research (F.R.S.–FNRS) [T.0159.20-PDR], “Sludge dewatering and drying vs. rheology”.
Institutional Review Board Statement
Not applicable.
Informed Consent Statement
Not applicable.
Data Availability Statement
Data are contained within the article.
Acknowledgments
The authors wish to acknowledge the invaluable support of the personnel of the Chemical Engineering Halle of the University of Liège. We also extend our thanks to the FRS-FNRS (Fund for Scientific Research) for funding their research project through the grant T.0159.20-PDR. Lastly, we express our sincere appreciation to L’ Association Intercommunale pour le Démergement et l’Epuration des communes de la province de Liège (AIDE) for granting permission to collect samples, which played a significant role in advancing this research.
Conflicts of Interest
The authors declare no conflicts of interest.
Abbreviations
The following abbreviations are used in this manuscript:
| A1 | Positive area under the curve pénétration test |
| A2 | Positive area under the curve pénétration test |
| A3 | Positive area under the curve first compression TPA |
| A4 | Positive area under the curve second compression TPA |
| DSS | Dehydrated sewage sludge |
| Fmax | Maximal force carried out by the probe |
| Fmin | Minimal force carried out by the probe |
| G′ | Storage modulus |
| G″ | Loss modulus |
| LVE | Limit of the viscoelastic region |
| S1 | Dehydrated sludge sample from Embourg WWTP |
| S2 | Dehydrated sludge sample from Lantin WWTP |
| S3 | Dehydrated sludge sample from Grosses-Battes WWTP |
| S3L | Dehydrated sludge sample from Grosses-Battes liming WWTP |
| S4 | Dehydrated sludge sample from Sclessin WWTP |
| S5 | Dehydrated sludge sample from Oupeye WWTP |
| SS | Sewage sludge |
| TPA | Texture profile analysis |
| TSC | Total solid content |
| γL | Yield point |
| γF | Flow point |
| VSC | Volatiles olid content |
| WWTP | Wastewater treatment plant |
References
- Gao, N.; Kamran, K.; Quan, C.; Williams, P.T. Thermochemical Conversion of Sewage Sludge: A Critical Review. Prog. Energy Combust. Sci. 2020, 79, 100843. [Google Scholar] [CrossRef]
- Eurostat Sewage Sludge Production and Disposal from Urban Wastewarer (in Dry Substance (d.S.)). Available online: https://ec.europa.eu/eurostat/databrowser/view/env_ww_spd/default/table?lang=en&category=env.env_wat.env_nwat (accessed on 9 April 2024).
- Raheem, A.; Sikarwar, V.S.; He, J.; Dastyar, W.; Dionysiou, D.D.; Wang, W.; Zhao, M. Opportunities and Challenges in Sustainable Treatment and Resource Reuse of Sewage Sludge: A Review. Chem. Eng. J. 2018, 337, 616–641. [Google Scholar] [CrossRef]
- Collivignarelli, M.C.; Carnevale Miino, M.; Bellazzi, S.; Caccamo, F.M.; Durante, A.; Abbà, A. Review of Rheological Behaviour of Sewage Sludge and Its Importance in the Management of Wastewater Treatment Plants. Water Pract. Technol. 2022, 17, 483–491. [Google Scholar] [CrossRef]
- Seyssiecq, I.; Ferrasse, J.H.; Roche, N. State-of-the-Art: Rheological Characterisation of Wastewater Treatment Sludge. Biochem. Eng. J. 2003, 16, 41–56. [Google Scholar] [CrossRef]
- Eshtiaghi, N.; Markis, F.; Yap, S.D.; Baudez, J.C.; Slatter, P. Rheological Characterisation of Municipal Sludge: A Review. Water Res. 2013, 47, 5493–5510. [Google Scholar] [CrossRef]
- Feng, G.; Hu, Z.; Ma, H.; Bai, T.; Guo, Y.; Hao, Y. Semi-Solid Rheology Characterization of Sludge Conditioned with Inorganic Coagulants. Water Sci. Technol. 2019, 80, 2158–2168. [Google Scholar] [CrossRef]
- Peeters, B. Effect of Activated Sludge Composition on Its Dewaterability and Sticky Phase. Ph.D. Thesis, University of Leuven, Leuven, Belgium, 2011. [Google Scholar]
- Yen, P.S.; Chen, L.C.; Chien, C.Y.; Wu, R.M.; Lee, D.J. Network Strength and Dewaterability of Flocculated Activated Sludge. Water Res. 2002, 36, 539–550. [Google Scholar] [CrossRef]
- Peeters, B.; Dewil, R.; Van Impe, J.F.; Vernimmen, L.; Smets, I.Y. Using a Shear Test-Based Lab Protocol to Map the Sticky Phase of Activated Sludge. Environ. Eng. Sci. 2011, 28, 81–85. [Google Scholar] [CrossRef]
- Liang, F.; Sauceau, M.; Dusserre, G.; Arlabosse, P. A Uniaxial Cyclic Compression Method for Characterizing the Rheological and Textural Behaviors of Mechanically Dewatered Sewage Sludge. Water Res. 2017, 113, 171–180. [Google Scholar] [CrossRef]
- Li, B.; Wang, F.; Chi, Y.; Yan, J.H. Adhesion and Cohesion Characteristics of Sewage Sludge During Drying. Dry. Technol. 2014, 32, 1598–1607. [Google Scholar] [CrossRef]
- Mouzaoui, M.; Sauceau, M.; Devriendt, L.; Baudez, J.C.; Arlabosse, P. Rheological Characterization of Sludge in Divided Granular-like and Pasty States Using a Granular Rheometer. Powder Technol. 2021, 378, 521–527. [Google Scholar] [CrossRef]
- Mouzaoui, M.; Baudez, J.C.; Sauceau, M.; Arlabosse, P. Experimental Rheological Procedure Adapted to Pasty Dewatered Sludge up to 45 % Dry Matter. Water Res. 2018, 133, 1–7. [Google Scholar] [CrossRef] [PubMed]
- Mitchell, G.; Beasley, J.E. Optimisation of Sludge Treatment and Transport; Springer: Berlin/Heidelberg, Germany, 2011; Volume 62, ISBN 8790402057. [Google Scholar]
- Kocbek, E.; Garcia, H.A.; Hooijmans, C.M.; Mijatović, I.; Kržišnik, D.; Humar, M.; Brdjanovic, D. Effects of the Sludge Physical-Chemical Properties on Its Microwave Drying Performance. Sci. Total Environ. 2022, 828. [Google Scholar] [CrossRef]
- Bennamoun, L.; Arlabosse, P.; Léonard, A. Review on Fundamental Aspect of Application of Drying Process to Wastewater Sludge. Renew. Sustain. Energy Rev. 2013, 28, 29–43. [Google Scholar] [CrossRef]
- Li, J.; Fraikin, L.; Salmon, T.; Toye, D.; Léonard, A. Influence of Back-Mixing on the Convective Drying of Sewage Sludge: The Structural Characteristics. Dry. Technol. 2022, 40, 205–212. [Google Scholar] [CrossRef]
- Li, H.; Zou, S.; Li, Y.; Jin, Y. Characteristics and Model of Sludge Adhesion during Thermal Drying. Environ. Technol. 2013, 34, 807–812. [Google Scholar] [CrossRef]
- Pambou, Y.-B. Influence Du Conditionnement et de La Déshydratation Mécanique Sur Le Séchage Des Boues d’épuration. Ph.D. Thesis, Université de Liège, Liège, Belgium, 2016. [Google Scholar]
- Ruiz, T.; Wisniewski, C. Correlation between Dewatering and Hydro-Textural Characteristics of Sewage Sludge During Drying. Sep. Purif. Technol. 2008, 61, 204–210. [Google Scholar] [CrossRef]
- Wu, B.; Dai, X.; Chai, X. Critical Review on Dewatering of Sewage Sludge: Influential Mechanism, Conditioning Technologies and Implications to Sludge Re-Utilizations. Water Res. 2020, 180, 115912. [Google Scholar] [CrossRef]
- Olivier, J.; Vaxelaire, J. Municipal Sludge Dewatering by Belt Filter Press: Effect of Operating Parameters. J. Chem. Technol. Biotechnol. 2005, 80, 948–953. [Google Scholar] [CrossRef]
- Novak, J.T. Dewatering of Sewage Sludge. Dry. Technol. 2006, 24, 1257–1262. [Google Scholar] [CrossRef]
- Chambers, P. Standard Methods for the Examination of Water and Wastewater; Scientific e-Resources: New Delhi, India, 2019; ISBN 1839471662. [Google Scholar]
- Mouzaoui, M.; Baudez, J.C.; Sauceau, M.; Arlabosse, P. How to Avoid Evaporation during Rheological Measurements of Dewatered Pasty Sludge at High Temperature. Water Sci. Technol. 2019, 79, 1503–1510. [Google Scholar] [CrossRef] [PubMed]
- Liang, F.; Sauceau, M.; Dusserre, G.; Dirion, J.L.; Arlabosse, P. Modelling of the Rheological Behavior of Mechanically Dewatered Sewage Sludge in Uniaxial Cyclic Compression. Water Res. 2018, 147, 413–421. [Google Scholar] [CrossRef] [PubMed]
- Leonard, A.; Blacher, S.; Marchot, P.; Crine, M. Use of X-Ray Microtomography to Follow the Convective Heat Drying of Wastewater Sludges. Dry. Technol. 2002, 20, 1053–1069. [Google Scholar] [CrossRef]
- Huron, Y.; Salmon, T.; Crine, M.; Blandin, G.; Léonard, A. Effect of Liming on the Convective Drying of Urban Residual Sludges. Asia-Pacific J. Chem. Eng. 2010, 5, 909–914. [Google Scholar] [CrossRef]
- Léonard, A.; Royer, S.; Blandin, G.; Salmon, T.; Fraikin, L.; Crine, M. Importance of Mixing Conditions During Sludge Liming Prior to Their Convective Drying. Eur. Dry. Conf. Palma Spain 2011, 26–28. [Google Scholar]
- Li, H.; Zou, S.; Li, C. Liming Pretreatment Reduces Sludge Build-Up on the Dryer Wall during Thermal Drying. Dry. Technol. 2012, 30, 1563–1569. [Google Scholar] [CrossRef]
- Fantasse, A.; Parra Angarita, S.; Léonard, A.; Lakhal, E.K.; Idlimam, A.; El Houssayne, B. Rheological Behavior and Characterization of Drinking Water Treatment Sludge from Morocco. Clean Technol. 2023, 5, 259–274. [Google Scholar] [CrossRef]
- Mezger, T. The Rheology Handbook; Vincentz Network: Hanover, Germany, 2020; ISBN 9783866306509. [Google Scholar]
- Rodríguez, N.H.; Ramírez, S.M.; Varela, M.T.B.; Guillem, M.; Puig, J.; Larrotcha, E.; Flores, J. Re-Use of Drinking Water Treatment Plant (DWTP) Sludge: Characterization and Technological Behaviour of Cement Mortars with Atomized Sludge Additions. Cem. Concr. Res. 2010, 40, 778–786. [Google Scholar] [CrossRef]
- Nishinari, K.; Kohyama, K.; Kumagai, H.; Funami, T.; Bourne, M.C. Parameters of Texture Profile Analysis. Food Sci. Technol. Res. 2013, 19, 519–521. [Google Scholar] [CrossRef]
- Tabilo-Munizaga, G.; Barbosa-Cánovas, G.V. Rheology for the Food Industry. J. Food Eng. 2005, 67, 147–156. [Google Scholar] [CrossRef]
- Zhu, G.; Zhu, L.; Yu, C. Rheological Properties of Soil: A Review. IOP Conf. Ser. Earth Environ. Sci. 2017, 64. [Google Scholar] [CrossRef]
- TA Instruments. Rheological Techniques for Yield Stress Analysis; TA Instruments Technical Notes—RH025; TA Instruments: New Castle, DE, USA, 2000; pp. 1–6. [Google Scholar]
- Tsotsas, E.; Mujumdar, A.S. Modern Drying Technology Edited by Evangelos Tsotsas and Arun S. Mujumdar; Wiley: Weinheim, Germany, 2007; ISBN 9783527315567. [Google Scholar]
- Vaxelaire, J.; Cézac, P. Moisture Distribution in Activated Sludges: A Review. Water Res. 2004, 38, 2215–2230. [Google Scholar] [CrossRef]
- Deng, W.; Li, X.; Yan, J.; Wang, F.; Chi, Y.; Cen, K. Moisture Distribution in Sludges Based on Di Ff Erent Testing Methods. J. Environ. Sci. 2011, 23, 875–880. [Google Scholar] [CrossRef]
- Nielsen, R.V.; Jensen, M.; Christian Duus, S.A.; Christensen, M.L. Critical Moisture Point of Sludge and Its Link to Vapour Sorption and Dewatering. Chemosphere 2019, 236, 124299. [Google Scholar] [CrossRef]
- Lee, D.J.; Lai, J.Y.; Mujumdar, A.S. Moisture Distribution and Dewatering Efficiency for Wet Materials. Dry. Technol. 2006, 24, 1201–1208. [Google Scholar] [CrossRef]
- Li, J.; Fraikin, L.; Salmon, T.; Bennamoun, L.; Toye, D.; Schreinemachers, R.; Léonard, A. Investigation on Convective Drying of Mixtures of Sewage Sludge and Sawdust in a Fixed Bed. Dry. Technol. 2015, 33, 704–712. [Google Scholar] [CrossRef]
Disclaimer/Publisher’s Note: The statements, opinions and data contained in all publications are solely those of the individual author(s) and contributor(s) and not of MDPI and/or the editor(s). MDPI and/or the editor(s) disclaim responsibility for any injury to people or property resulting from any ideas, methods, instructions or products referred to in the content. |
© 2025 by the authors. Licensee MDPI, Basel, Switzerland. This article is an open access article distributed under the terms and conditions of the Creative Commons Attribution (CC BY) license (https://creativecommons.org/licenses/by/4.0/).