1. Introduction
Despite ongoing efforts to improve energy efficiency and reduce power consumption, the building sector continues to experience a yearly increase in both direct and indirect CO
2 emissions [
1]. During building operations, direct emissions are generated by equipment based on coal, oil, and natural gas combustion [
2]. Meanwhile, indirect emissions result primarily from electricity generation in fossil fuel-based power plants. As a result, combined direct and indirect CO
2 emissions from the building sector (both residential and non-residential) accounted for 28% of total global emissions in 2019 [
3]. Moreover, energy consumption in this sector remained stable from year to year. However, there was a significant increase in emissions due to using electricity from fossil fuels [
4]. In 2022, direct emissions reached 3 Gt, while indirect emissions were approximately 6.8 Gt, totaling 9.8 Gt CO
2, a level comparable to total emissions in 2021 [
5]. China and the USA were the major polluting countries in 2012 and 2022, jointly contributing over 40% of global emissions in both years [
6]. In South America, Brazil, Argentina, and Venezuela are the primary contributors to CO
2 emissions from fossil fuel combustion in energy consumption and production [
7]. According to statistics from the Emissions Database for Global Atmospheric Research (EDGAR), these three countries accounted for 1.29%, 0.5%, and 0.28% of total global emissions in 2021 [
8]. These emissions reached around 783 Mt CO
2. In Ecuador, CO
2 emissions increased from 17.59 Mt in 1990 to 41.14 Mt in 2021. Meanwhile, Latin America and the Caribbean collectively emitted around 1438 Mt CO
2 in 2020, according to World Bank statistics [
9].
The electricity production sector is one of the fastest-growing contributors of CO
2 emissions and plays a crucial role in supporting various societal sectors, including buildings, industry, and transportation. High levels of CO
2 are a key factor in global warming and cause permanent damage to the natural environment [
10]. Electricity generation facilities emit significant amounts of CO
2, largely depending on the type of primary energy source used, such as coal, oil, and natural gas. Notably, buildings (residential and commercial) account for over half of global electricity consumption. Electricity generation facilities emit significant amounts of CO
2, largely depending on the type of primary energy source used, such as coal, oil, and natural gas. Notably, buildings (residential and commercial) account for over half of global electricity consumption [
11]. A considerable portion of a building’s electricity use is dedicated to heating and cooling systems, with demand steadily increasing each year. In the United States, 25% of greenhouse gas (GHG) emissions in 2021 originated from the electricity production sector [
12]. That same year, a key factor contributing to the resurgence of coal-based electricity generation was the record-high price of natural gas [
13]. In Ecuador, power plants accounted for 6.2% of GHG emissions in 2022, with per capita emissions reaching 2.3 tCO
2/inhabitant, significantly lower than the rate observed in developed countries such as the United States (17.1 tCO
2/inhabitant) [
14]. On a global scale, CO
2 emissions from the electricity and heat production sector increased by over 900 Mt in 2021 compared to the previous year, while emissions from the building sector rose by 167 Mt [
15]. Additionally, global CO
2 emissions from fossil fuels and industry increased by 5.17% in 2021 [
16]. Between 2019 and 2022, average annual emissions from power production were approximately 14.17 Gt, while the building sector contributed an average of 2.94 Gt during the same period [
17].
As a major contributor to CO
2 emissions in most countries, the electricity production sector is well suited for inclusion in emissions trading systems [
18]. Carbon markets provide a framework in which electricity producers, whether companies or individuals, can offset their GHG emissions by purchasing carbon credits from organizations that actively reduce or remove GHG emissions through renewable energy projects [
19]. Carbon markets serve as a mechanism for various stakeholders, including individuals, companies, and governments, to mitigate climate change by financially compensating entities that contribute to reducing atmospheric GHG accumulation [
20]. Within these markets, carbon credits, which represent verified emission reductions, are traded under specific regulations established by governments or corporate compliance policies. These systems may operate under mandatory emission reduction frameworks or voluntary initiatives aimed at minimizing fossil fuel emissions [
21]. In this context, participating stakeholders collectively agree to limit their total carbon emissions to a predefined cap. The system allows flexibility, as entities emitting more than their allocated share can purchase credits from those emitting less, provided the collective target is not exceeded [
20]. Entities can acquire credits directly from CO
2 mitigation or absorption project developers or generate credits by implementing such projects themselves [
22]. Carbon markets are generally classified into two categories: compliance markets and voluntary markets [
23,
24]. Compliance markets are established through national, regional, or international policies and regulations, requiring companies and governments to account for their emissions. In contrast, voluntary markets operate independently of regulatory frameworks, allowing public or private organizations to trade carbon credits at their discretion. Notable examples of compliance markets include the European Union, the California-Quebec market, and the systems in New Zealand, China, and the Republic of Korea. In terms of volume and value, compliance markets are significantly larger. In 2019, the regulated market accounted for approximately 3 billion tCO
2 with a market value of USD 23 billion, whereas the voluntary market traded 104 million tCO
2 with a value of USD 282.3 million [
25].
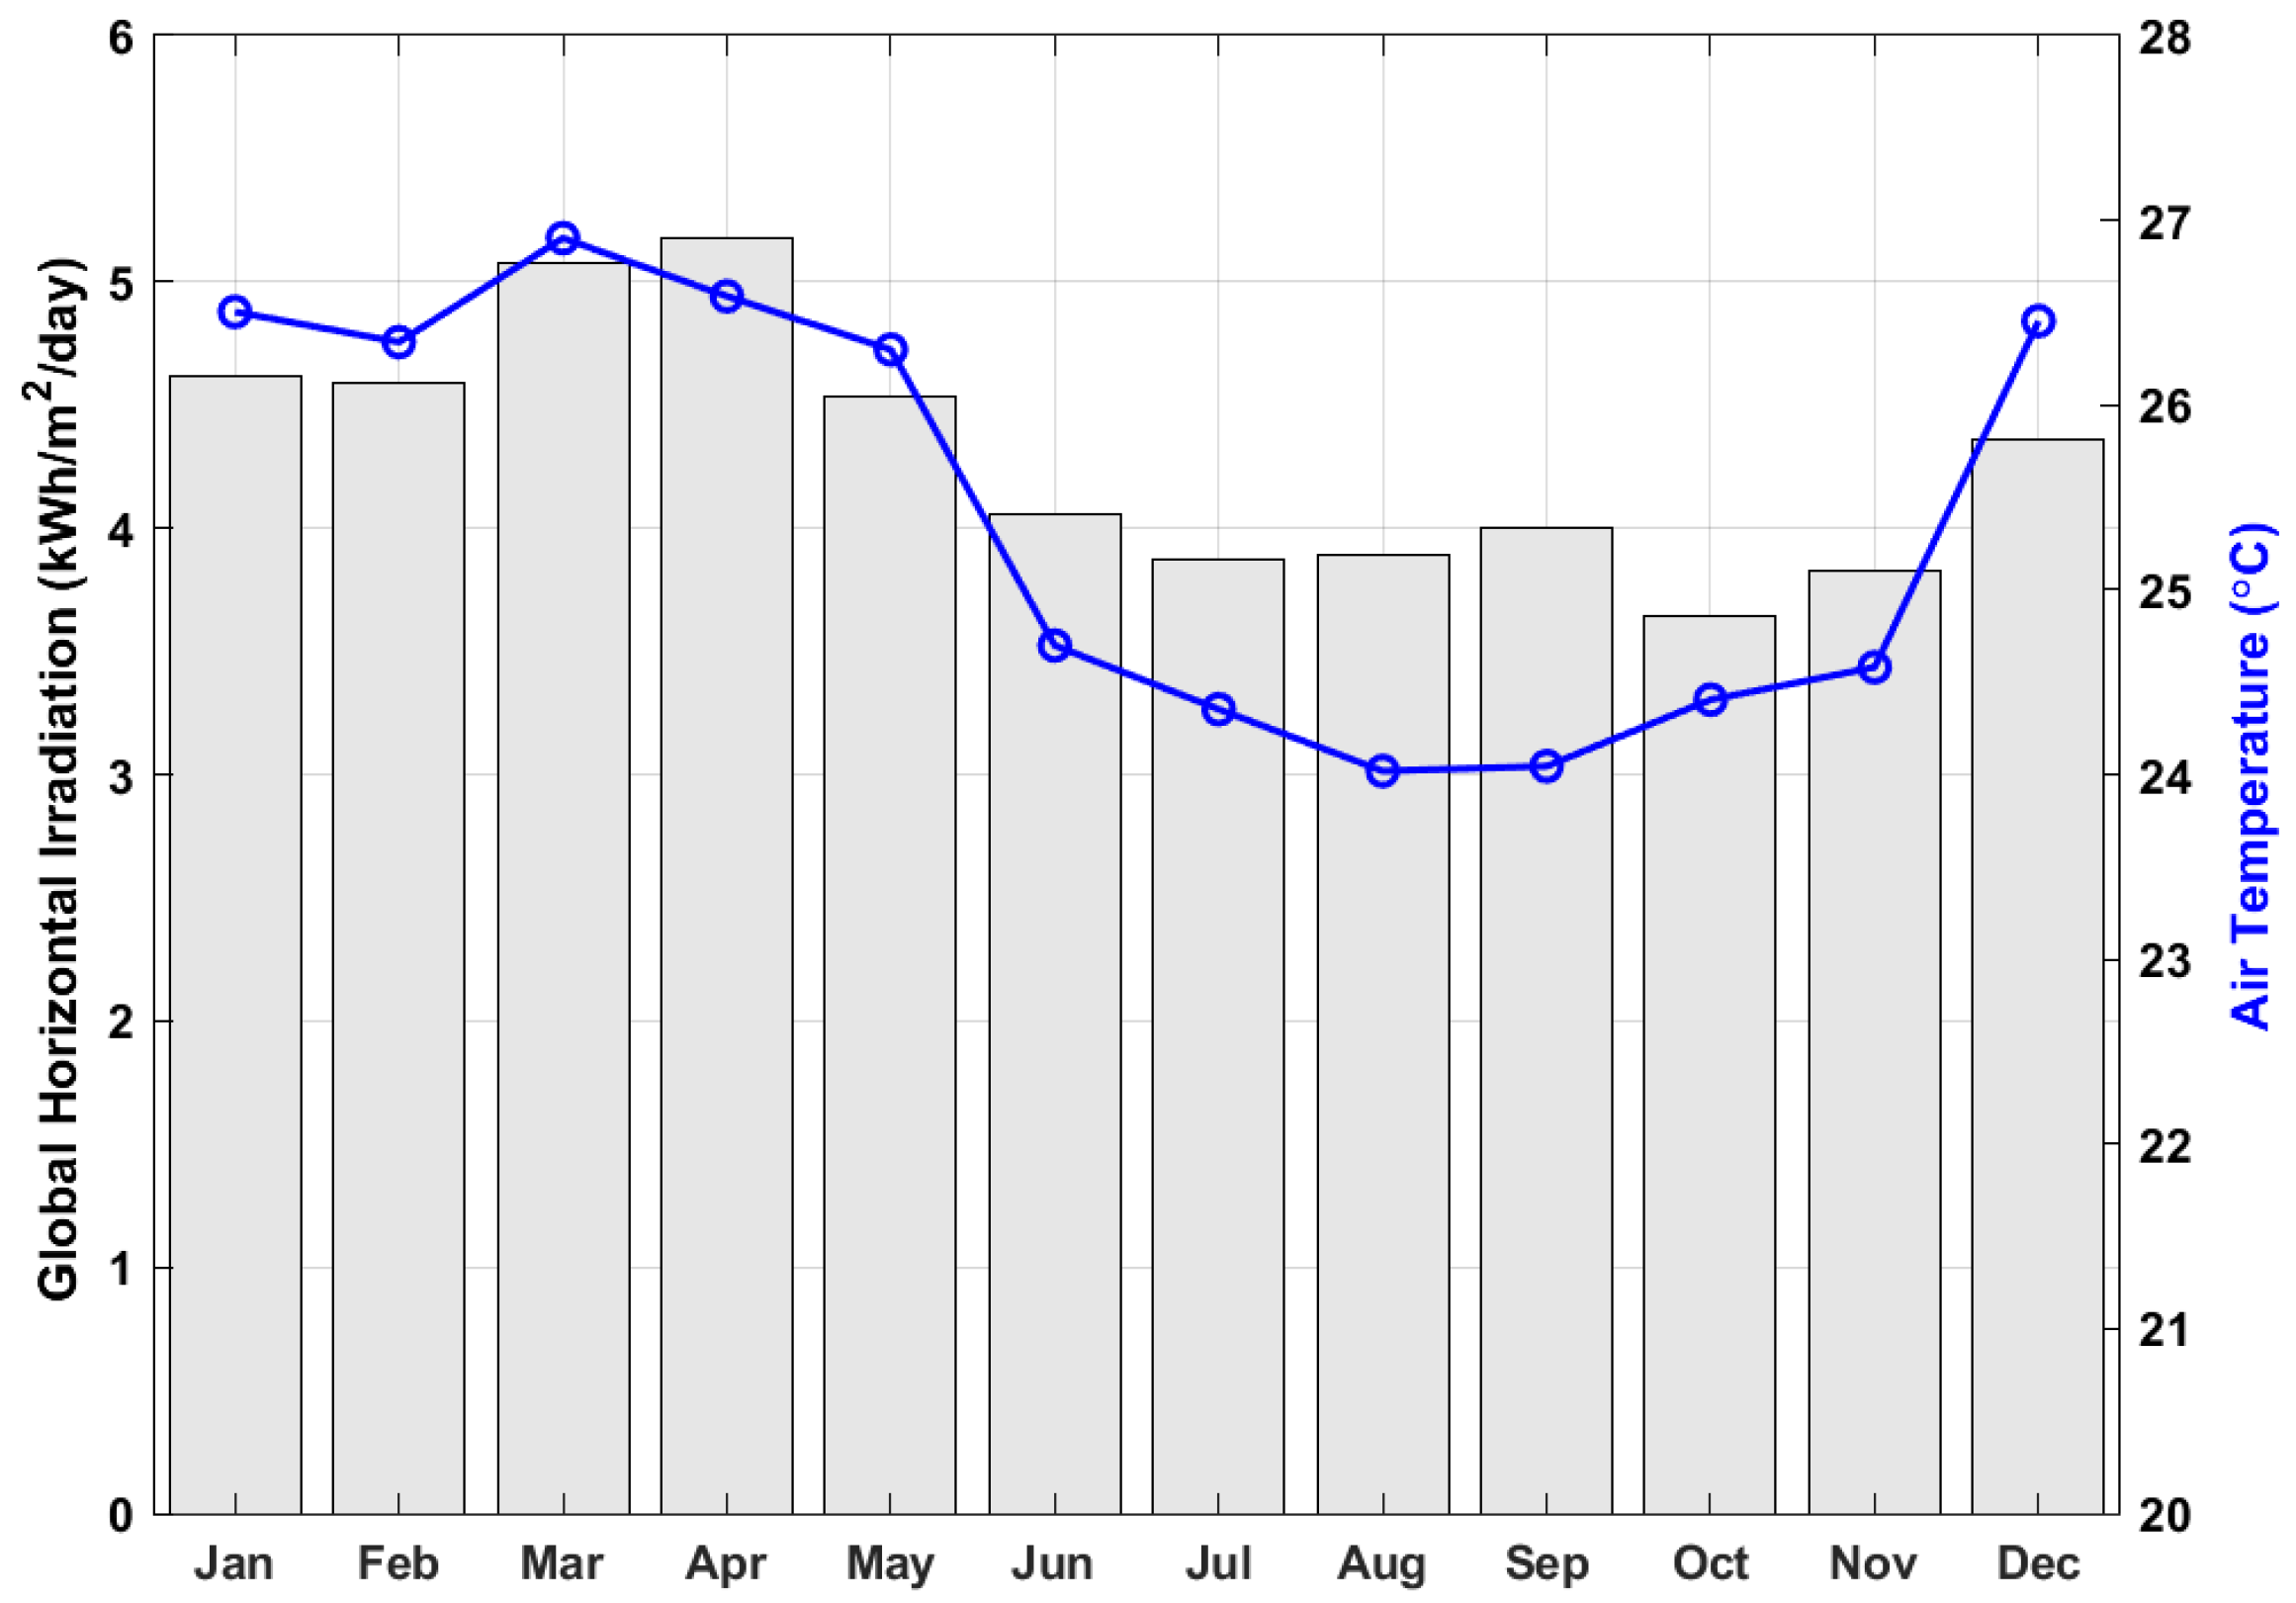
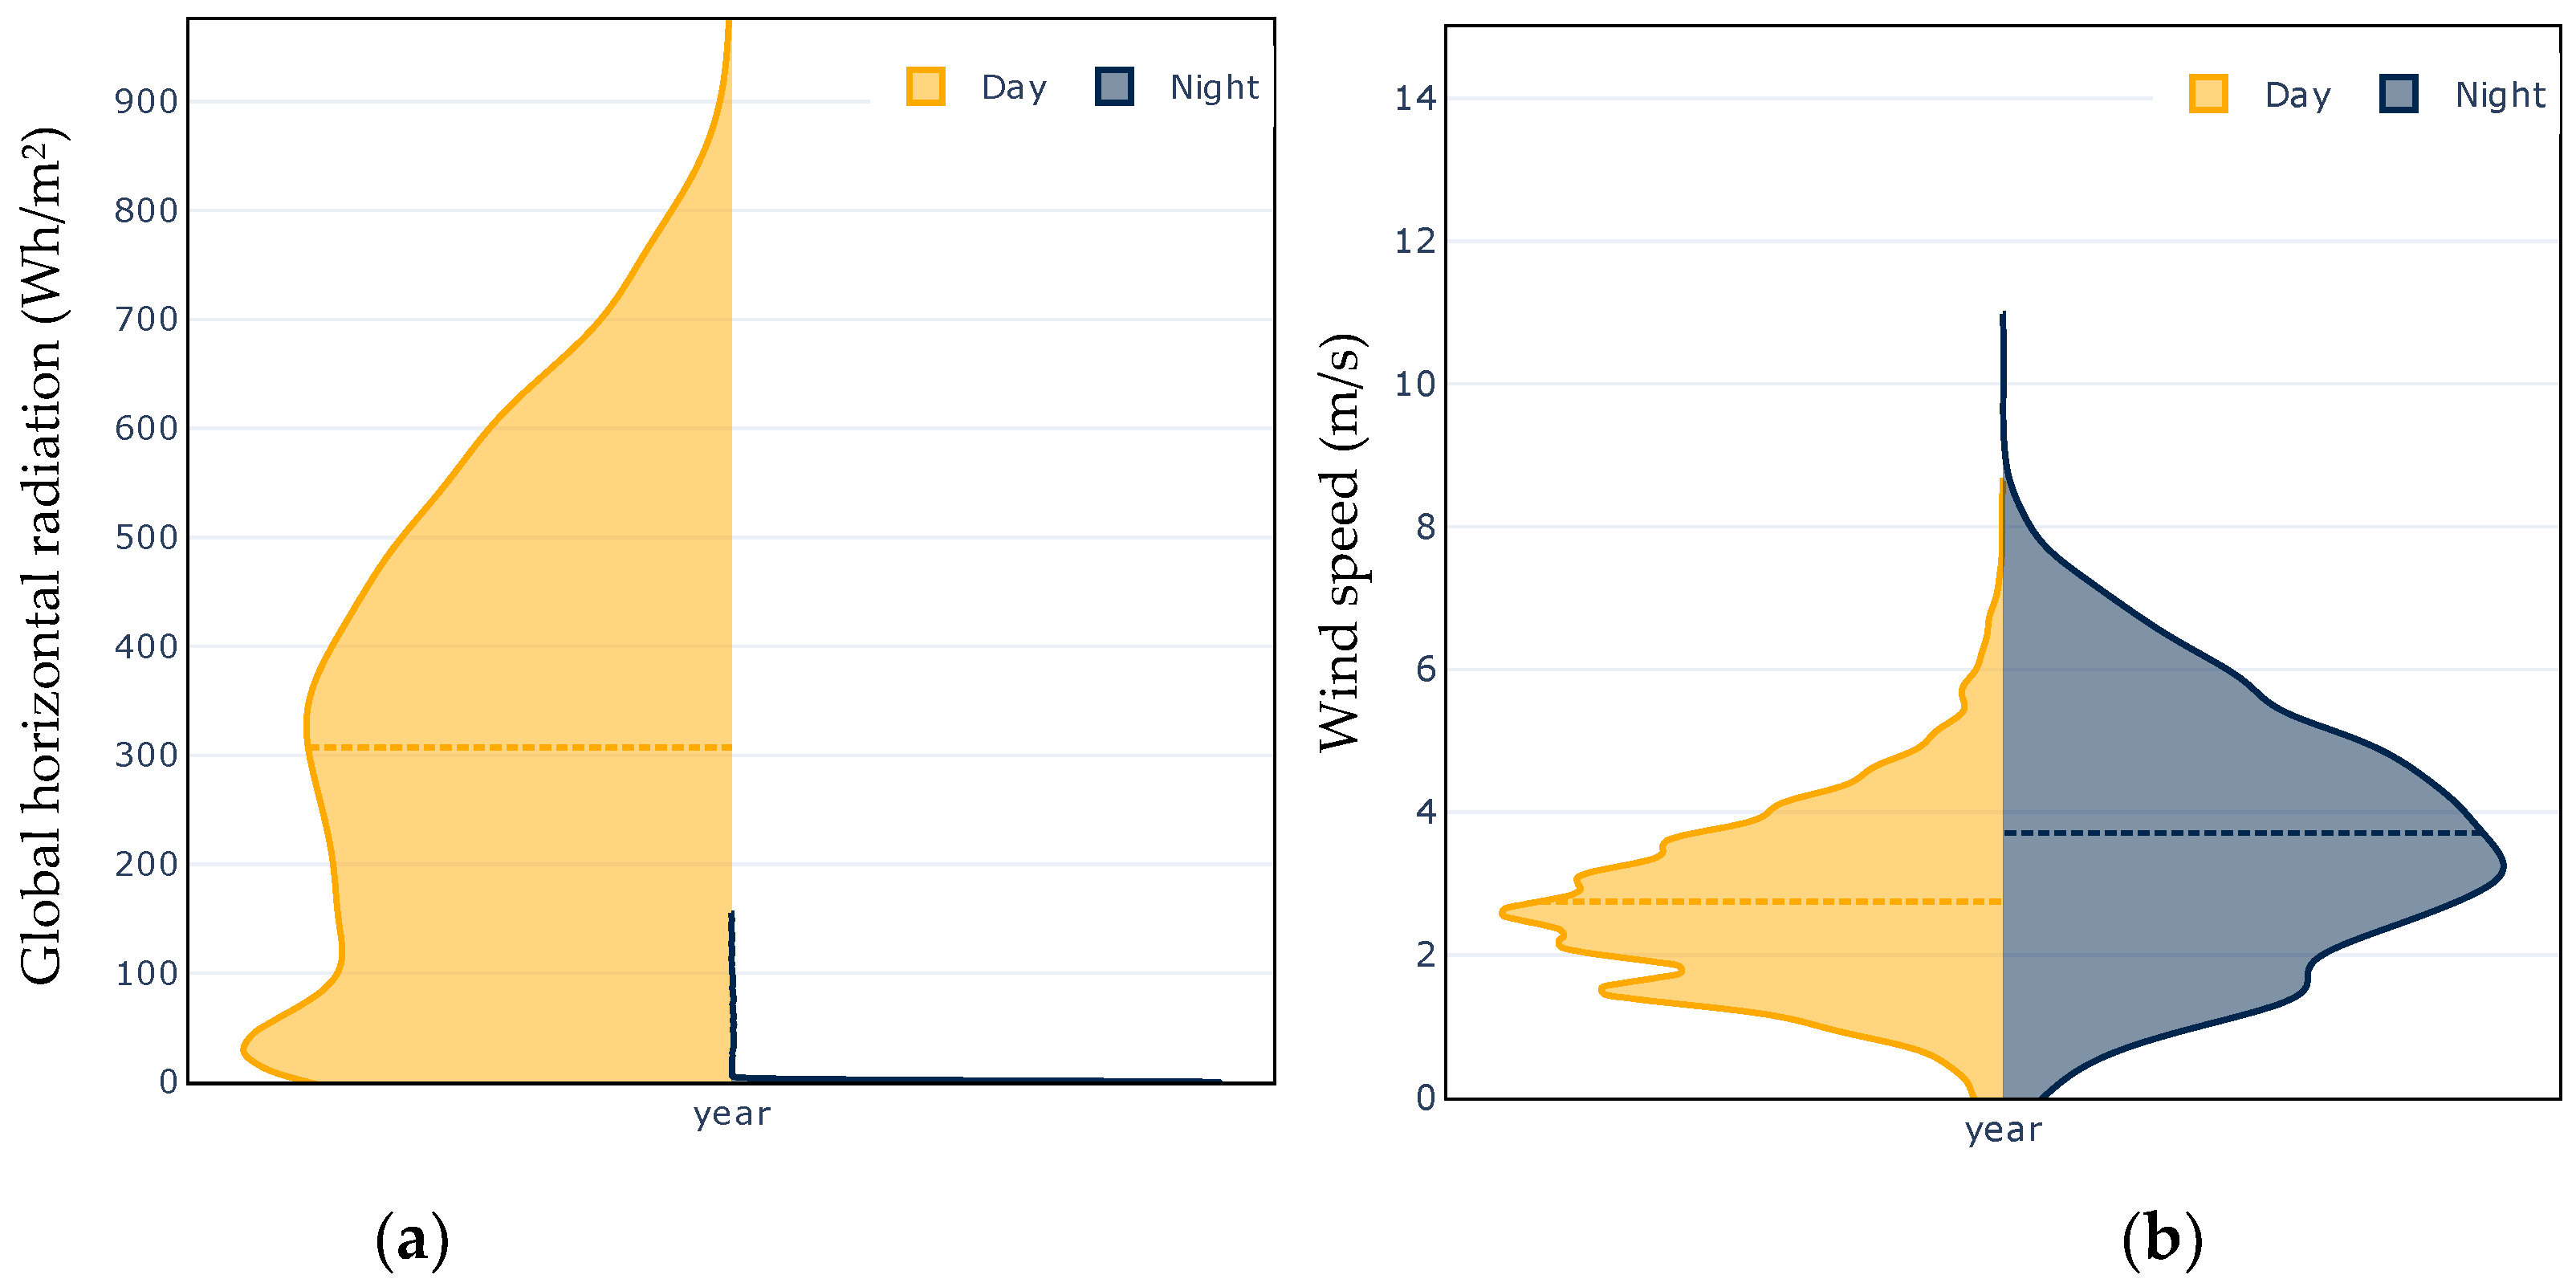
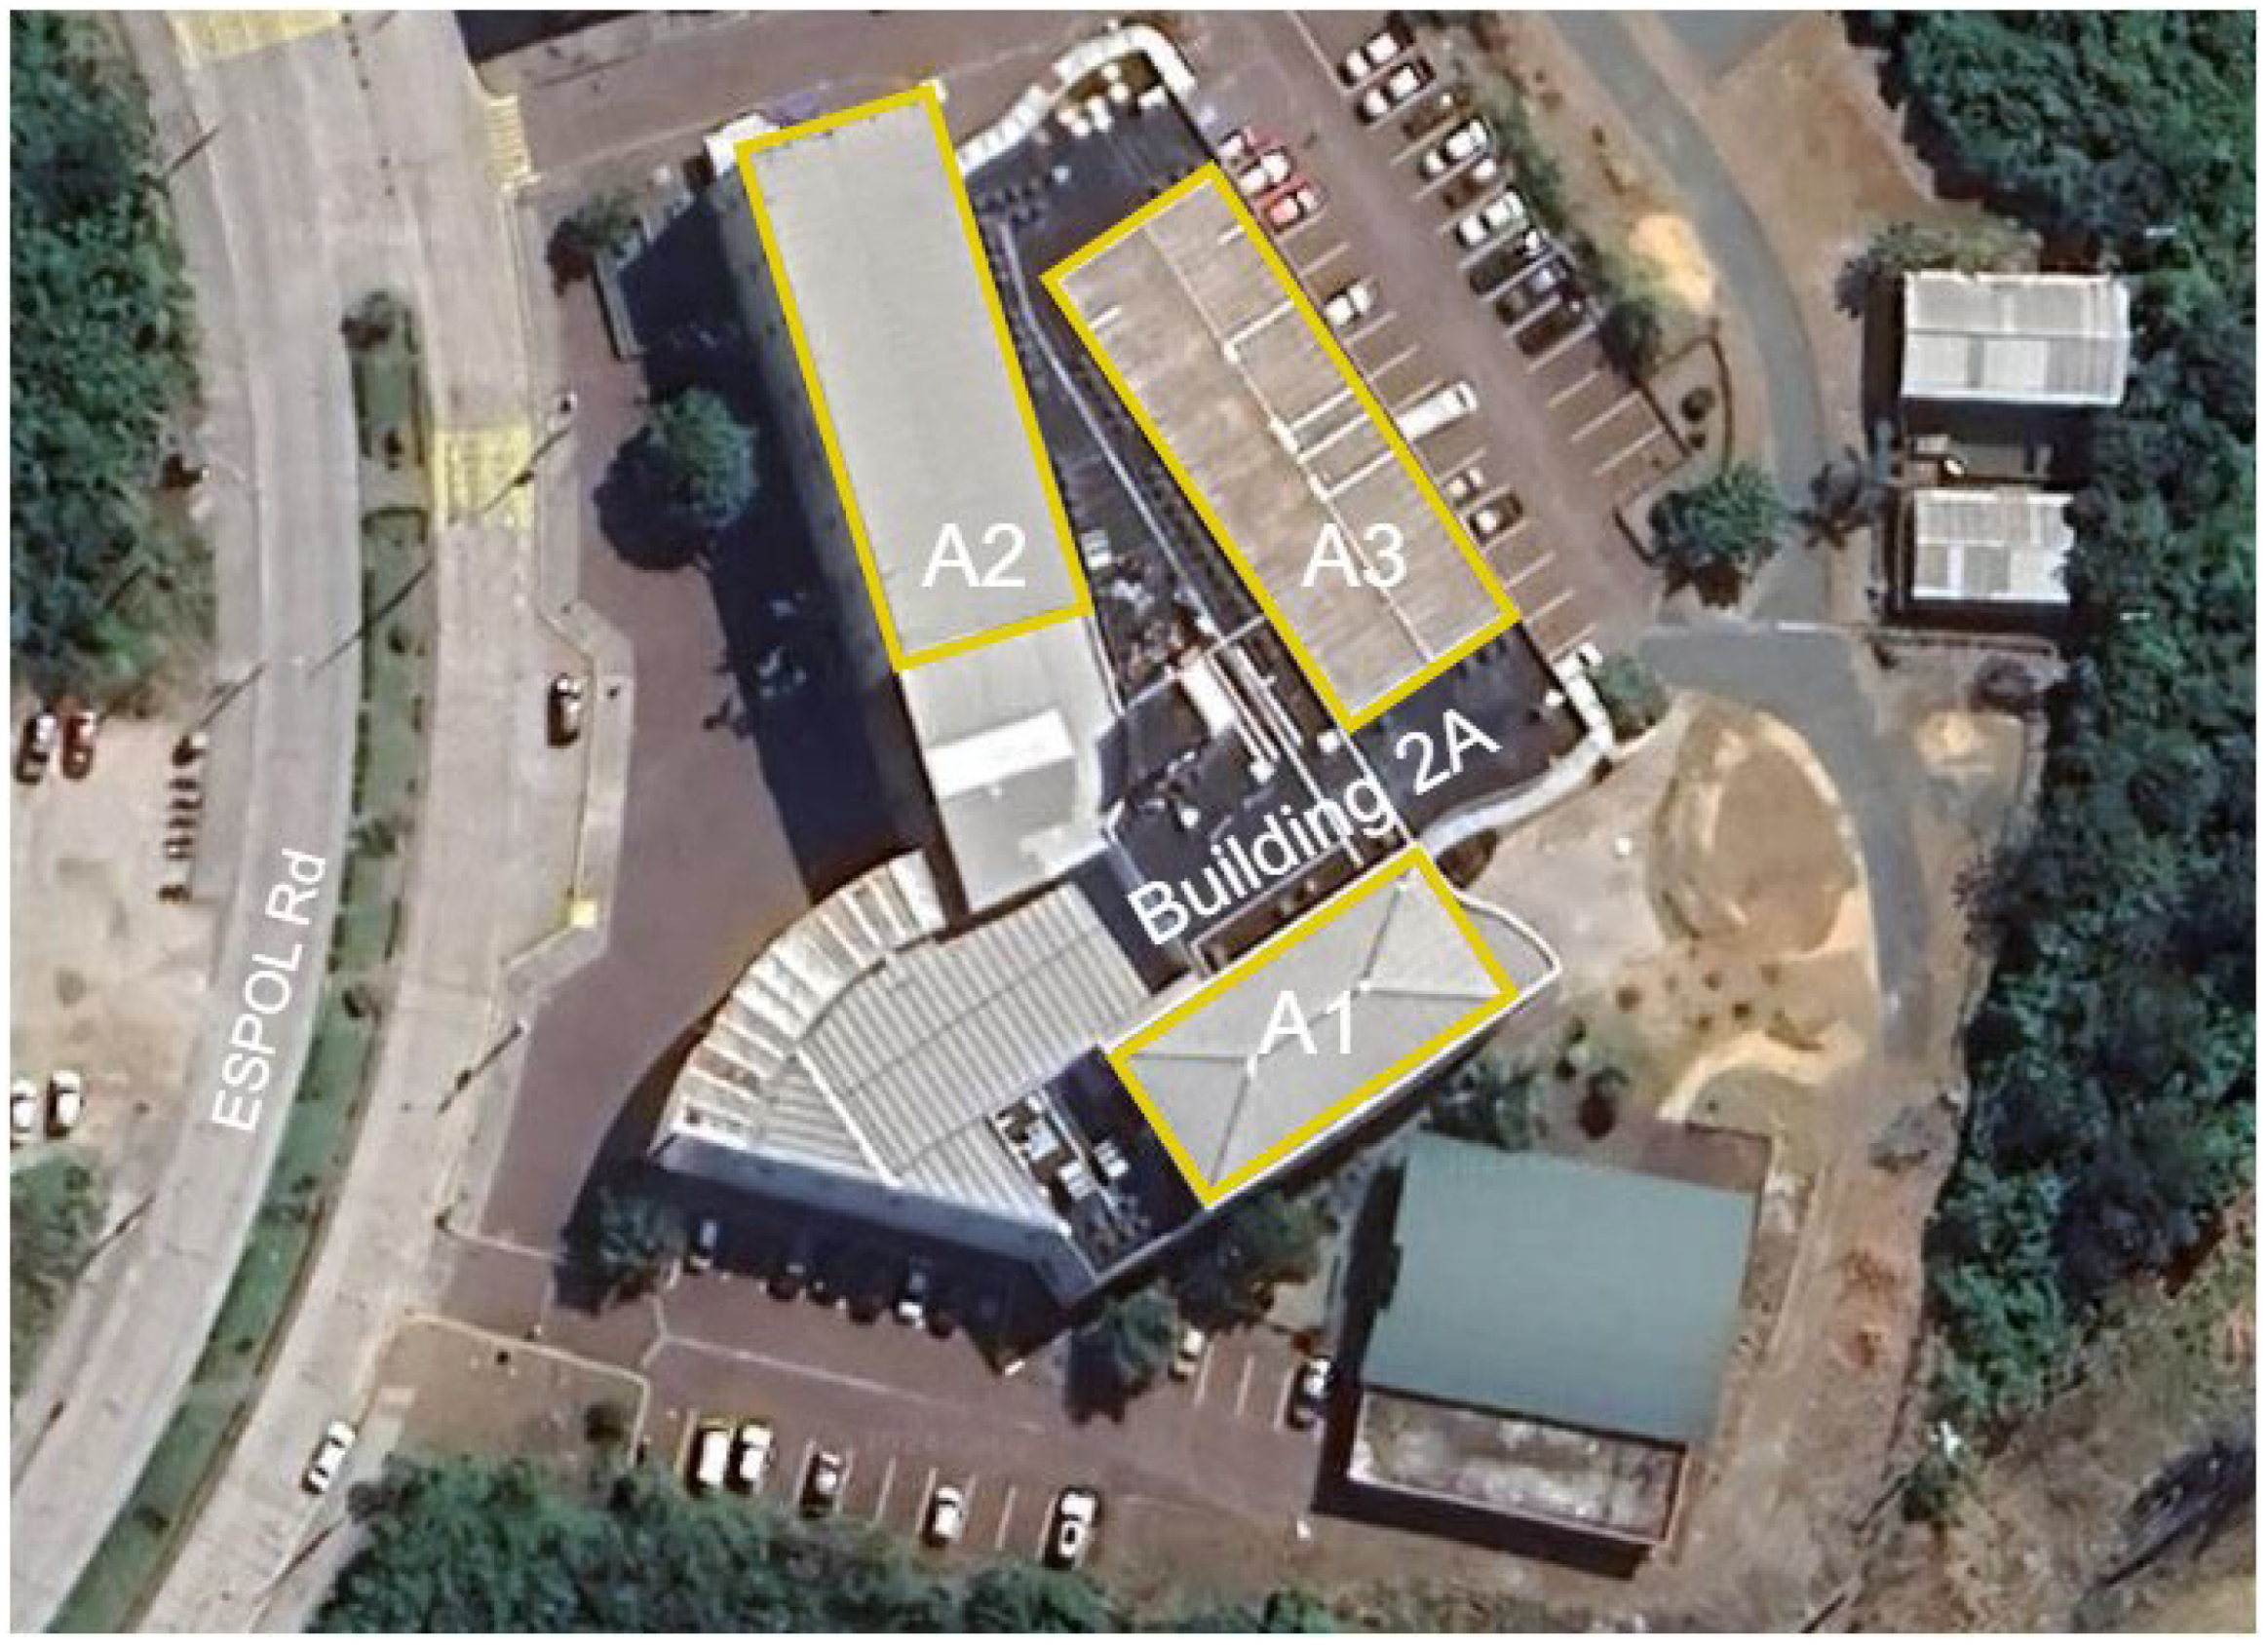
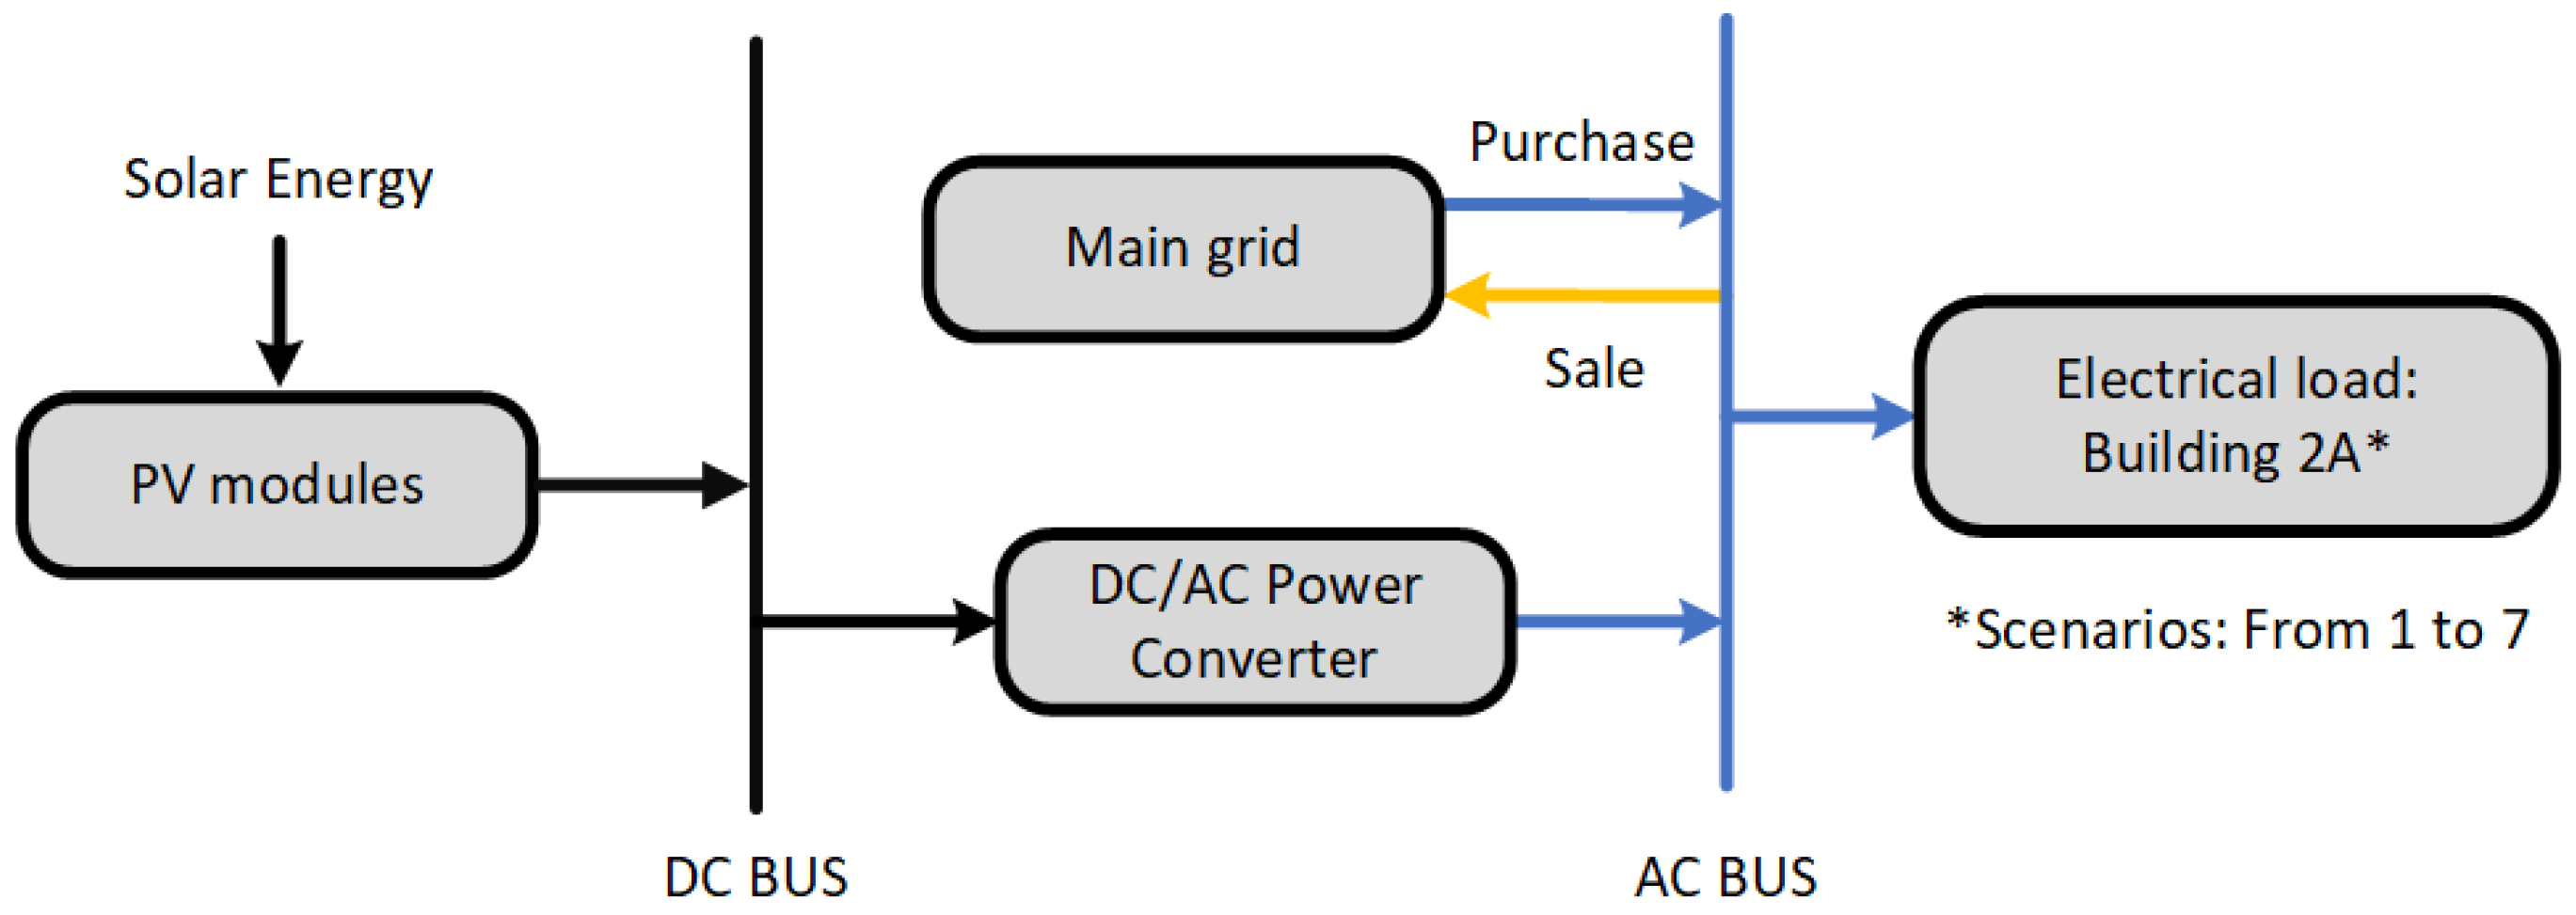
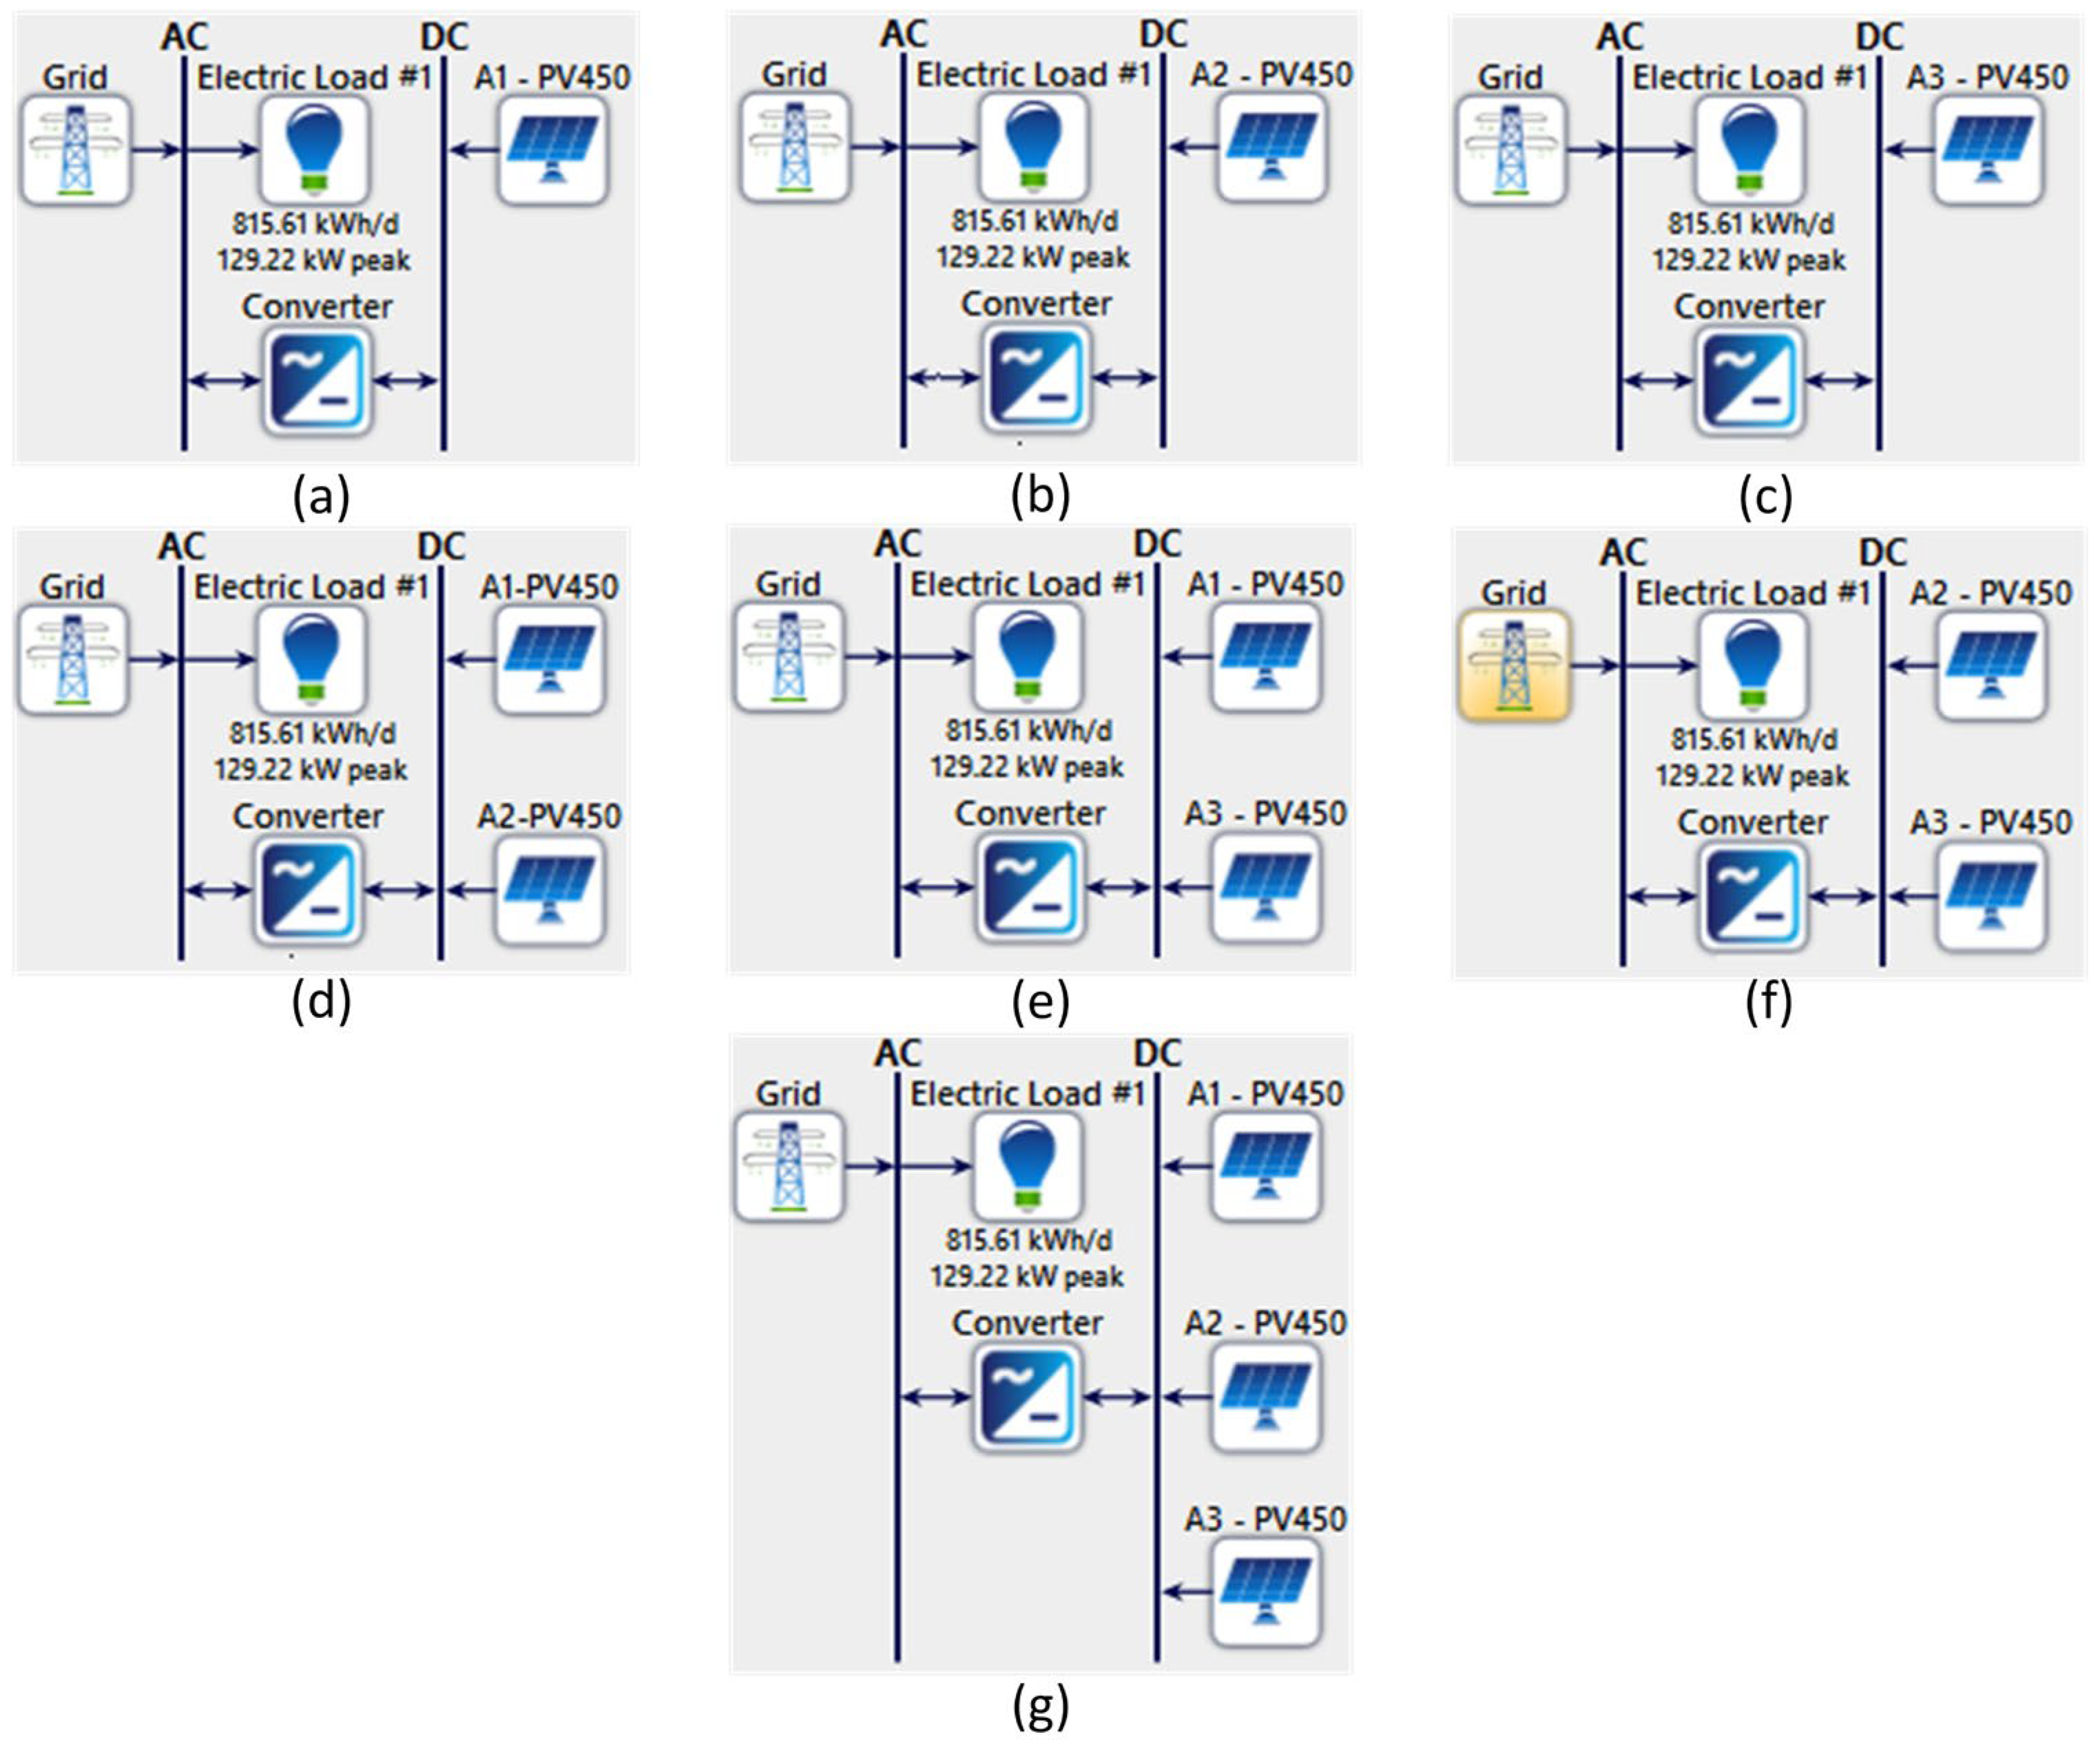
This study assesses the techno-economic and environmental feasibility of a grid-connected PV system installed on a university building in Guayaquil, Ecuador. This city, characterized by a hot climate and substantial year-round solar potential, offers favorable conditions for PV deployment. The study modeled seven PV system scenarios based on the available physical space on three building rooftops, with installation capacities of 40 kWp, 60 kWp, and 66 kWp. Each scenario was evaluated in terms of renewable electricity penetration, along with its techno-economic and environmental performance. These analyses are obtained from the engineering simulation tool Homer Pro [
26] with a project planning horizon of 25 years and an interest rate of 10%. For the environmental assessment, the reduction in indirect CO
2 emissions was calculated for each scenario using Ecuador’s Energy Matrix emission factor for 2023. Among the modeled configurations, the 166 kWp PV system demonstrated the most substantial reduction in indirect CO
2 emissions from the building. Consequently, this scenario was selected to assess its economic feasibility under a compliance carbon credit market framework.
The next section discusses the literature review. Methodology is demonstrated in
Section 3. The results and discussion are summarized in
Section 4. Finally,
Section 5 is devoted to the conclusion.
2. Literature Review
Renewable energy projects are effective solutions for reducing indirect CO
2 emissions across various electricity-consuming sectors, including transportation, buildings, and industry. Several studies have examined the potential of these projects to prevent CO
2 emissions and generate carbon credits. Among renewable technologies, PV systems stand out as the most viable option for on-site electricity generation. On-grid PV systems are particularly advantageous for reducing grid electricity consumption and lowering a building’s carbon footprint due to their scalability, ease of operation, and steadily declining implementation costs [
27,
28]. The increasing electricity demand is driving the transition of buildings towards utilizing microgrid electricity to reduce their dependence on the grid [
29].
Susilowatti et al. [
30] estimated the Net Present Cost (NPC) and internal rate of return (IRR) for a solar and biomass-based power plant by modeling its operation across various locations in Indonesia. The project achieved an annual emission reduction of 22,371.32 tCO
2, equivalent to USD 447,426.32 per year, based on a carbon credit price of USD 20 per tCO
2. In a separate study, a simulated model presented in [
31] demonstrated that a solar thermal plant and a PV plant achieved GHG emission reductions of 93,924 tCO
2 and 50,812 tCO
2, respectively. The primary distinction between these systems was the higher capital cost and greater installation complexity of the solar thermal plant compared to the PV system. Additionally, a large-scale grid-connected PV plant in a hot climate region achieved a reduction of 19,000 tCO
2 in 2018, based on evaluations using both actual data and simulations [
32]. Buragohain et al. [
33] evaluated the carbon reduction potential of a hybrid system, combining a solar PV plant and a biogas-fired generator, to assess the impact of a constant load. The net CO
2 mitigation achieved by the plant and generator were estimated at 35.97 tCO
2 and 68.62 tCO
2, respectively, resulting in a carbon credit value of USD 2090.31 (equivalent to EUR 16.32/tCO
2 or USD 19.91/tCO
2). Similarly, a project aimed at reducing diesel generator use was conducted in [
34], where the authors estimated an annual emissions reduction of 187 tCO
2. In [
35], a 200 kWp grid-connected PV plant in India mitigated 421.1 tCO
2 per year compared to thermal plants. The payback period for the project, including carbon credit revenues, was 10.7 years, 4.8 years shorter than the scenario without considering carbon credits. In the context of buildings, Hamzah and Go et al. [
36] analyzed a PV system applied to a high-rise building, utilizing both the roof and facades. The system achieved total carbon savings of 10,367.66 tCO
2 per year, with a total renewable electricity production of 679.72 MWh. The study in [
37] presents an economic analysis of a PV plant on a university campus in Italy, with installed capacities of 115 kW and 210 kW. For the 210 kW plant, the emission reduction reached 184.9 tCO
2 per year, generating approximately EUR 15,768 annually, based on a carbon credit rate of EUR 85.27/tCO
2. Agarwal et al. [
38] modeled a PV plant for a university building with a planning horizon of 25 years. The optimal size of the plant was determined to be 42 kWp, yielding carbon credits of 47.96 tCO
2 per year, equivalent to USD 779 annually, at a rate of USD 16.24/tCO
2. It is important to note that many university campuses are adopting photovoltaic power systems to meet their decarbonization goals [
39]. Carbon credits enhance the economic viability of renewable energy projects by providing additional financial revenue. These funds can be reinvested into new projects and initiatives aimed at further reducing emissions.
The carbon credit markets have evolved since the Kyoto Protocol, which established them as a mechanism for reducing or limiting GHG emissions [
40]. However, their importance was further emphasized with the signing of the Paris Agreement, which set the goal of limiting the global average temperature increase to “well below” 2 °C above pre-industrial levels [
41]. Since then, several carbon credit markets have been established worldwide to mitigate the impacts of climate change. In contrast, Latin America has yet to fully harness this potential. Mexico is the only country actively developing a voluntary carbon market since 1998. Following a reform to the General Law on Climate Change in 2018, Mexico became the first country in Latin America to initiate the development of an Emission Trading System [
42]. Other countries have made limited efforts in the form of taxes, but comprehensive policies like a carbon credit market are still lacking. These markets present an opportunity for the region, as projects to mitigate emissions or contamination can generate additional revenues if an appropriate country or regional carbon market is established.
Ecuador currently lacks policies and regulations that support public or private organizations in generating carbon credits. Additionally, the country has no agreements with other nations for transferring CO
2 mitigation outcomes through renewable energy projects. However, in response to the severe energy crisis Ecuador has faced since 2023, the government is promoting the large-scale deployment of renewable energy projects, particularly PV systems, through new legislative developments [
43]. Consequently, Ecuador presents potential opportunities for participating in international carbon credit markets.
5. Conclusions
This study presents a techno-economic and environmental analysis of an on-grid solar PV power system designed to supply energy to a university building in Guayaquil-Ecuador. Firstly, we assessed seven scenarios based on varying PV module areas across the three available rooftops of building 2A. This analysis included economic profitability indicators, such as NPV, for each scenario, considering all revenues and expenses throughout the project’s lifecycle. Overall, the solar radiation level of the site, along with the system size, were found to be key factors influencing the economic performance of the PV system. This study demonstrated the potential for reducing the building’s grid dependence through the installation of various-sized PV systems, offering valuable insights for developers and stakeholders when evaluating investment options for similar solar PV projects.
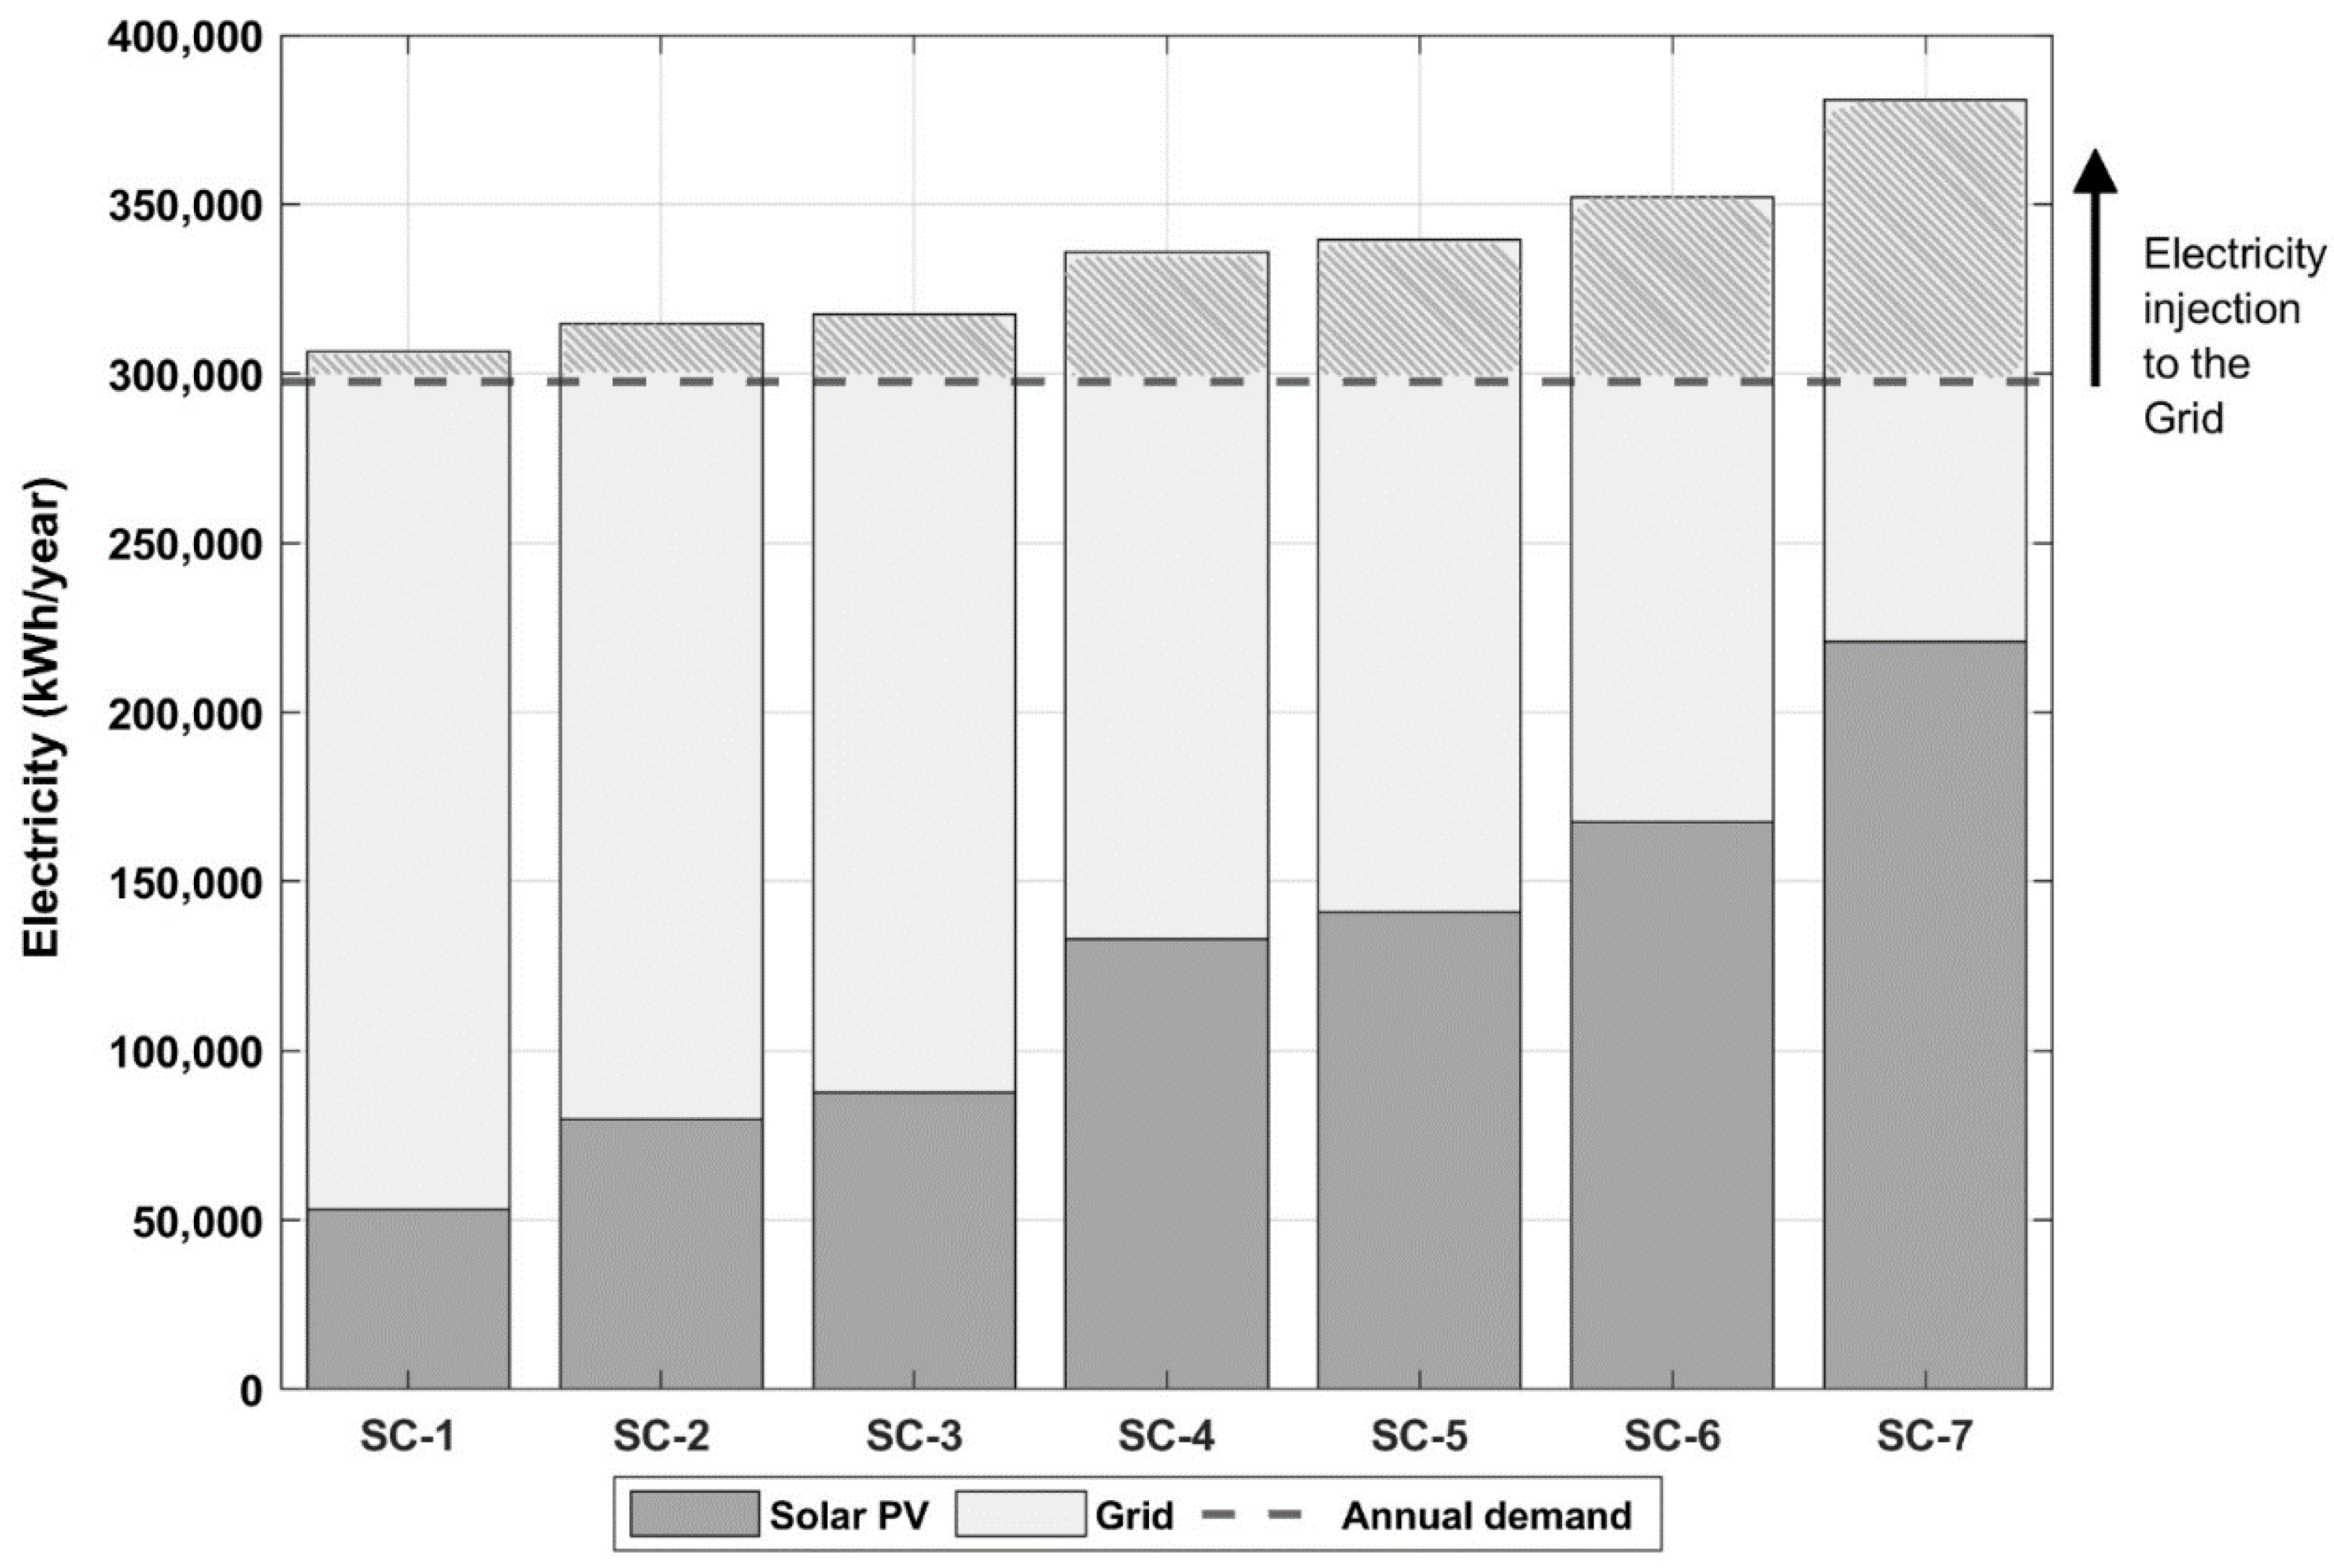
It is worth noting that the purpose of this study was not to oversize the PV plant in order to maximize the selling of surpluses back to the grid. Instead, the proposed scenarios were evaluated to identify their potential to cover the largest possible electricity share based on the rooftop area restriction. In this regard, the 166 kW installed capacity scenario met 74% of the building’s annual electricity demand but also injected a considerable share of electricity into the grid. As a result, any system larger than 166 kW would primarily contribute to grid injections rather than fully meeting the building’s electricity demand. In contrast, the scenario with the lowest installed capacity reduced electricity consumption from the grid by 18% with minimal grid injections. The electricity bill also reflected the reductions related to renewable electricity use across each scenario, ranging from 15.65% to 63.91%.
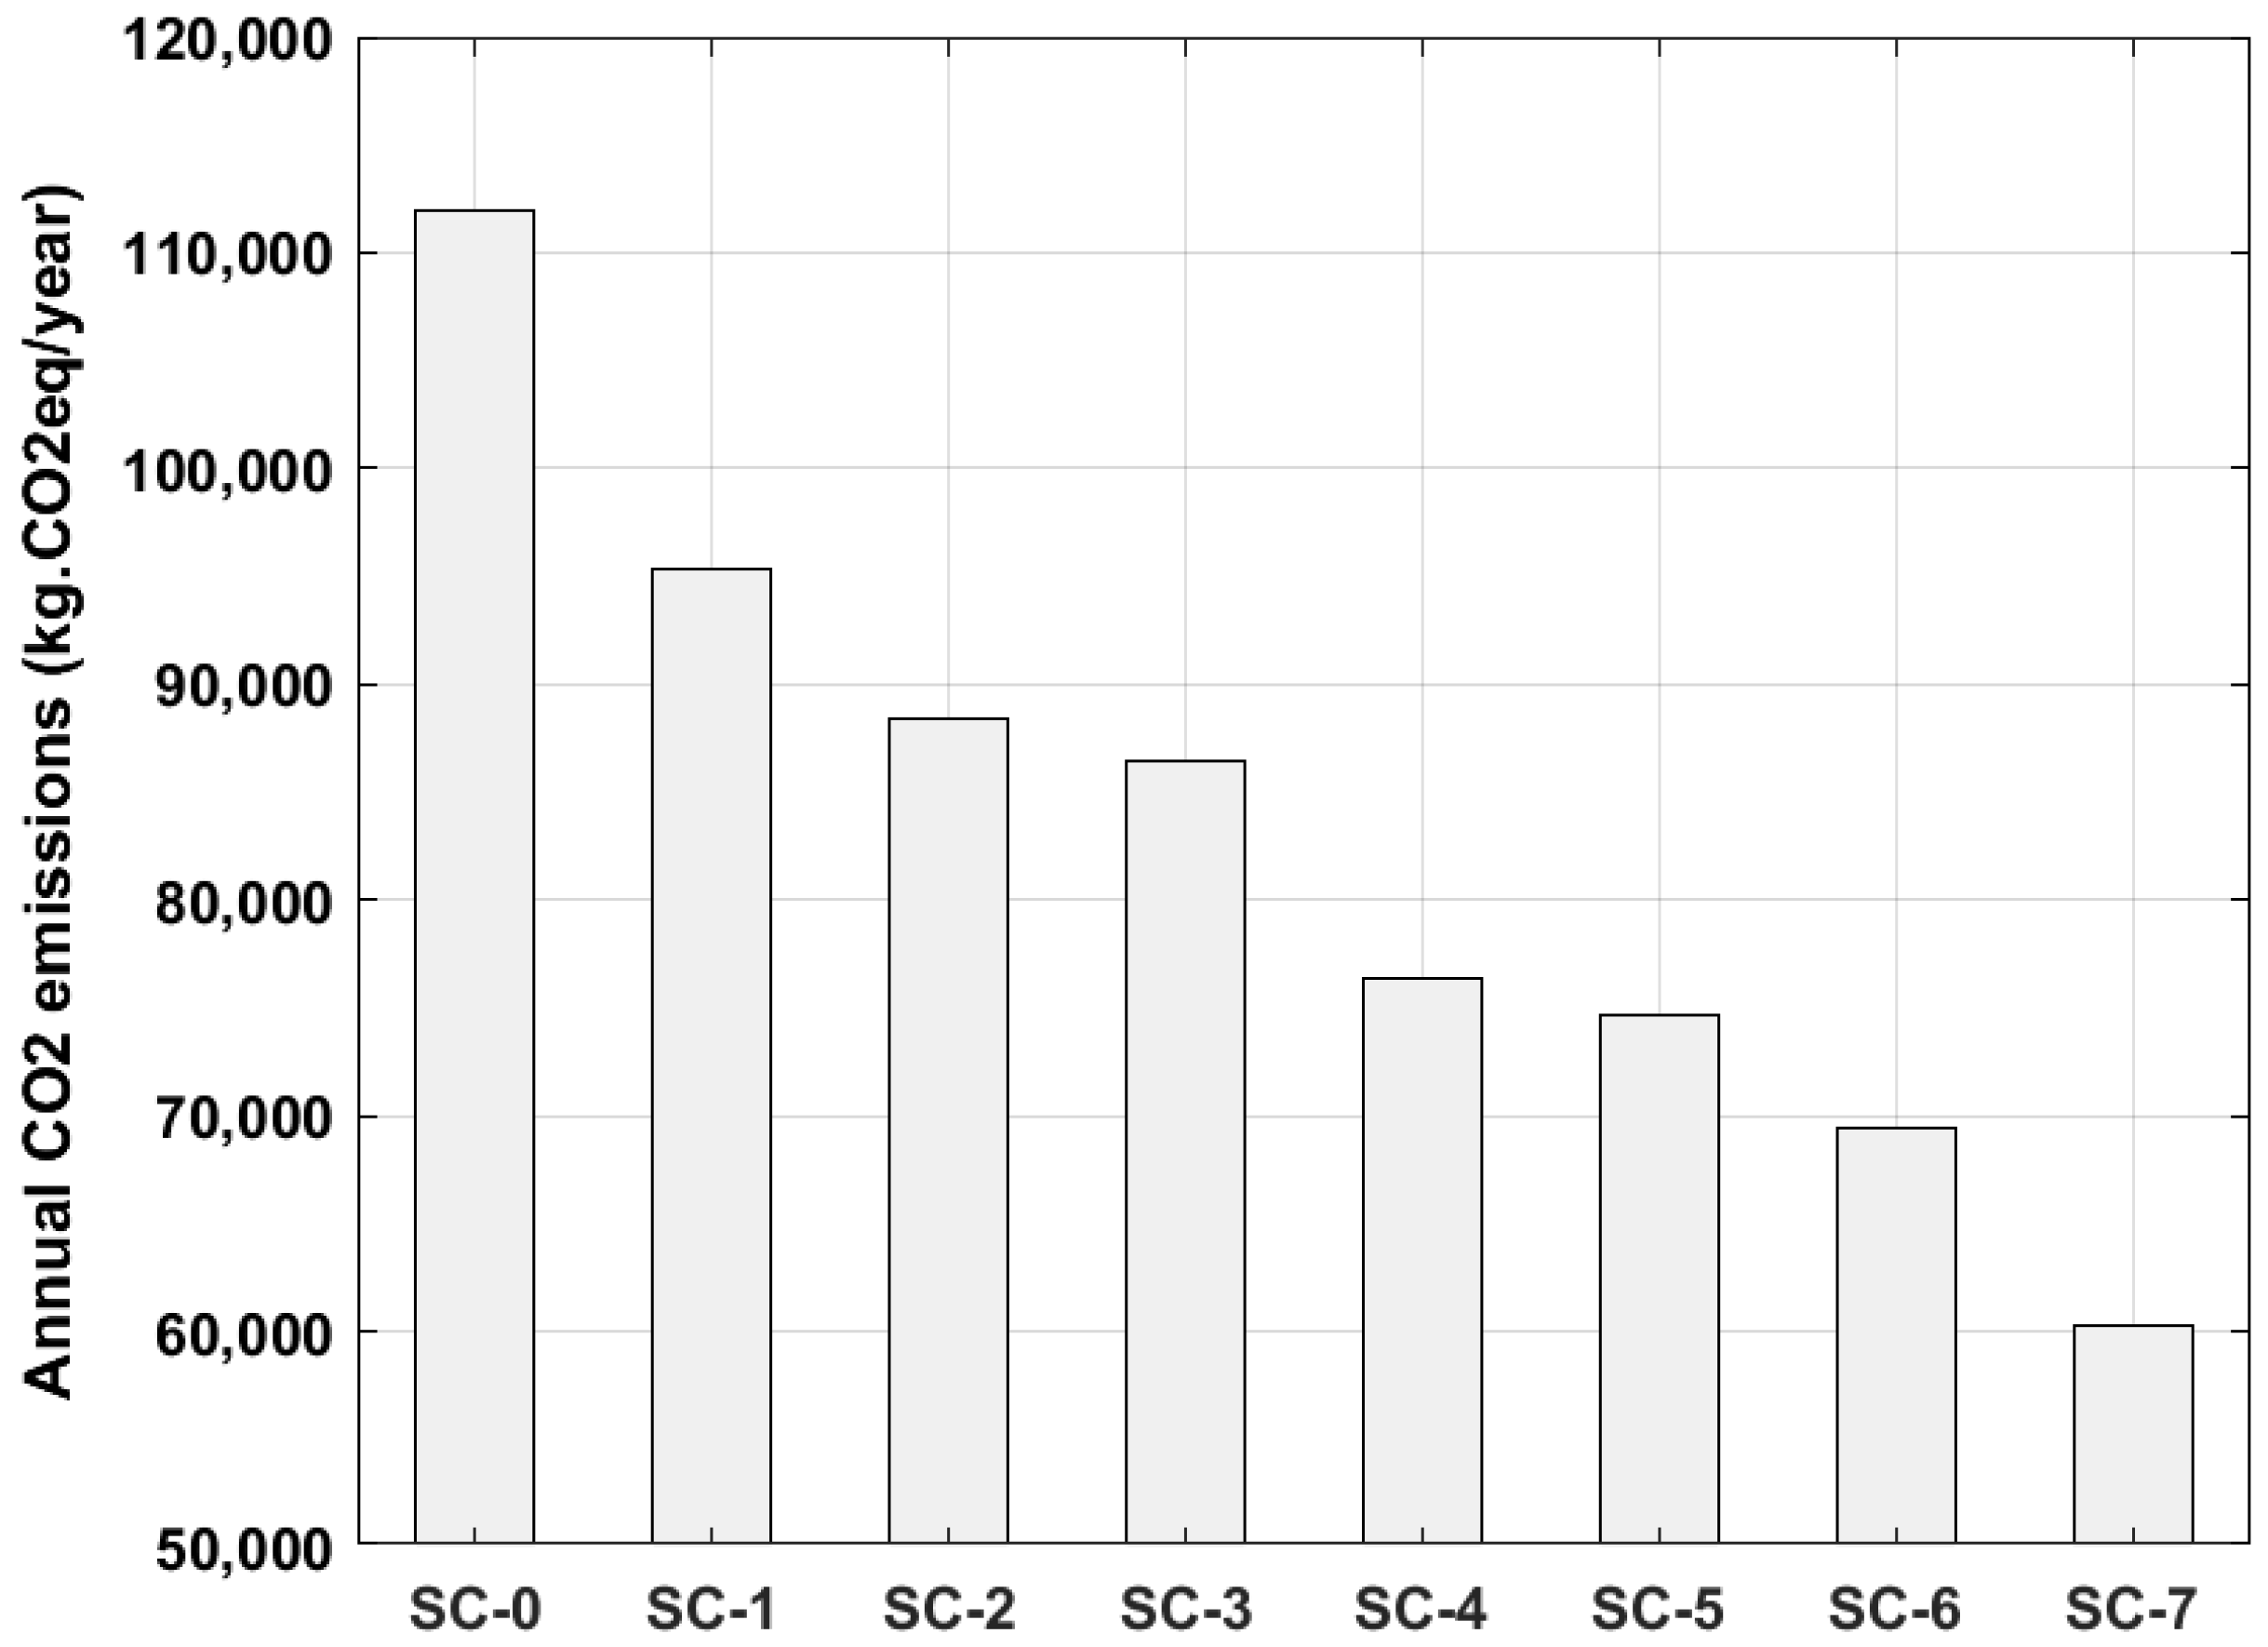
From an environmental standpoint, the study evaluated the potential reduction in indirect CO2 emissions during the building’s operational phase. In the absence of a renewable power system, the building emitted 111.96 tCO2 annually. From this baseline and estimated CO2 emissions from grid electricity use, we calculated the CO2 emission reduction in each scenario, which reflects the emissions avoided by the grid-connected PV system. These reductions ranged from 16.69 tCO2/year to 51.72 tCO2/year, based on an emission factor of 0.3761 tCO2 per MWh for Ecuador’s energy grid.
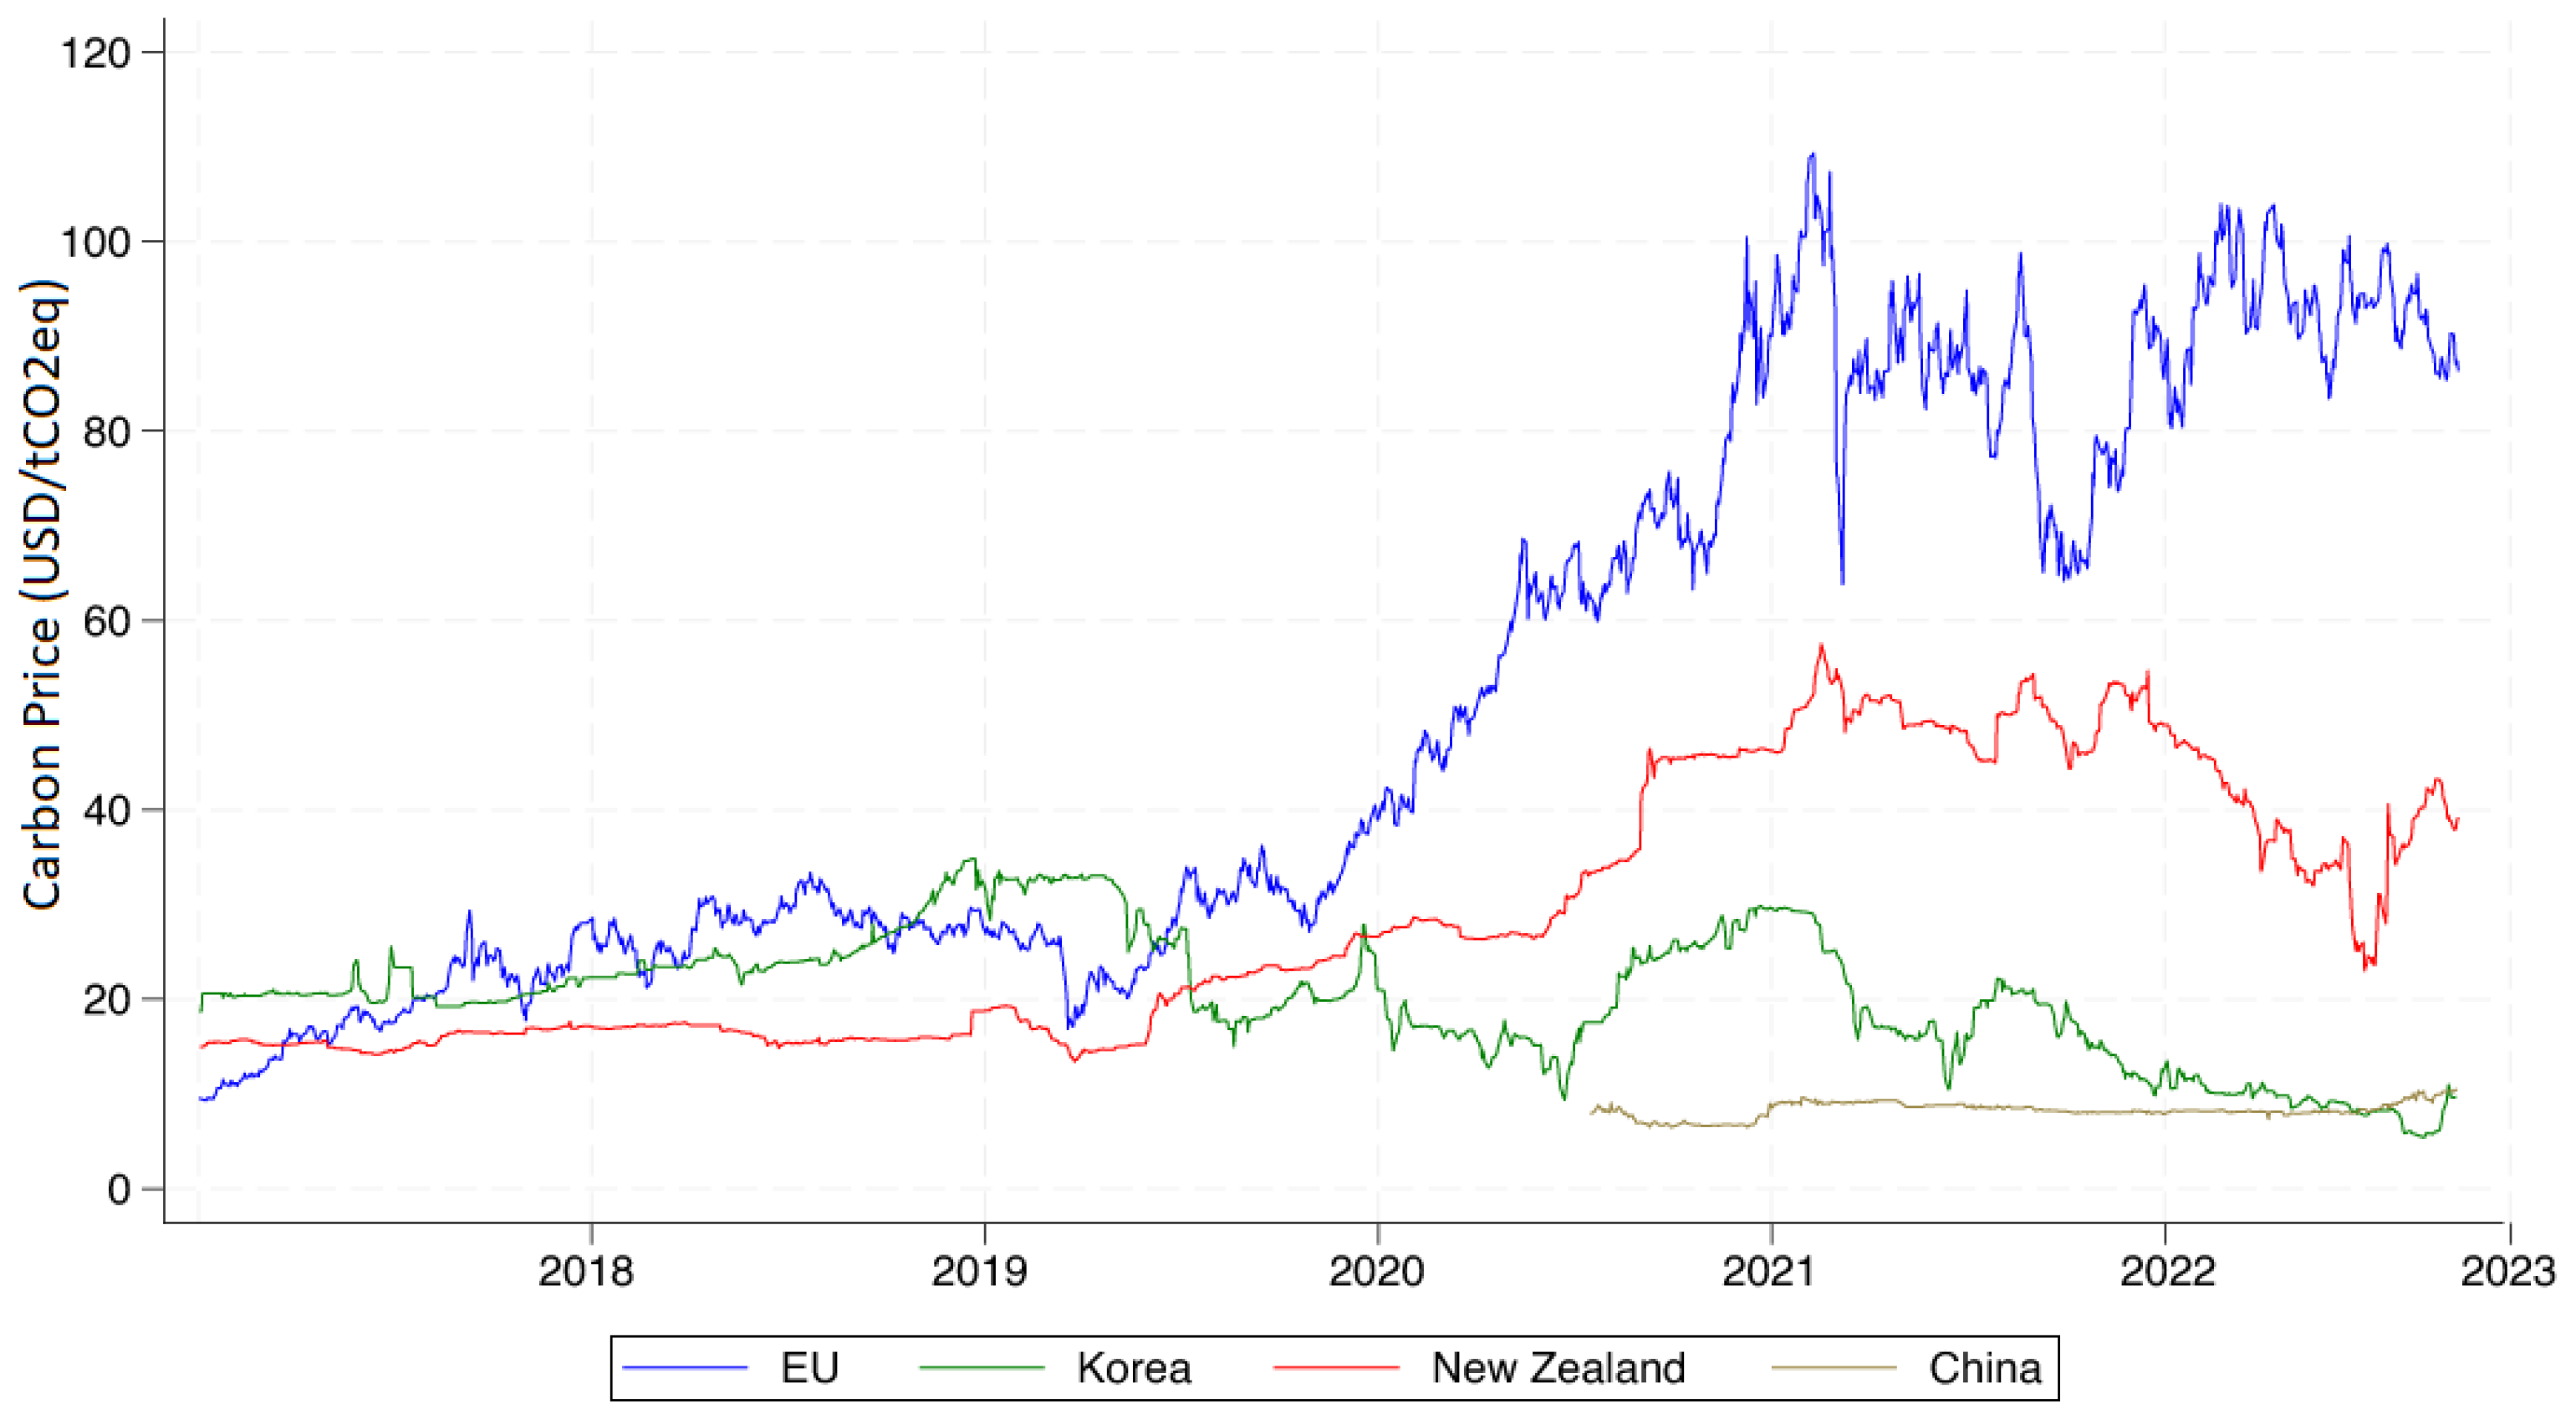
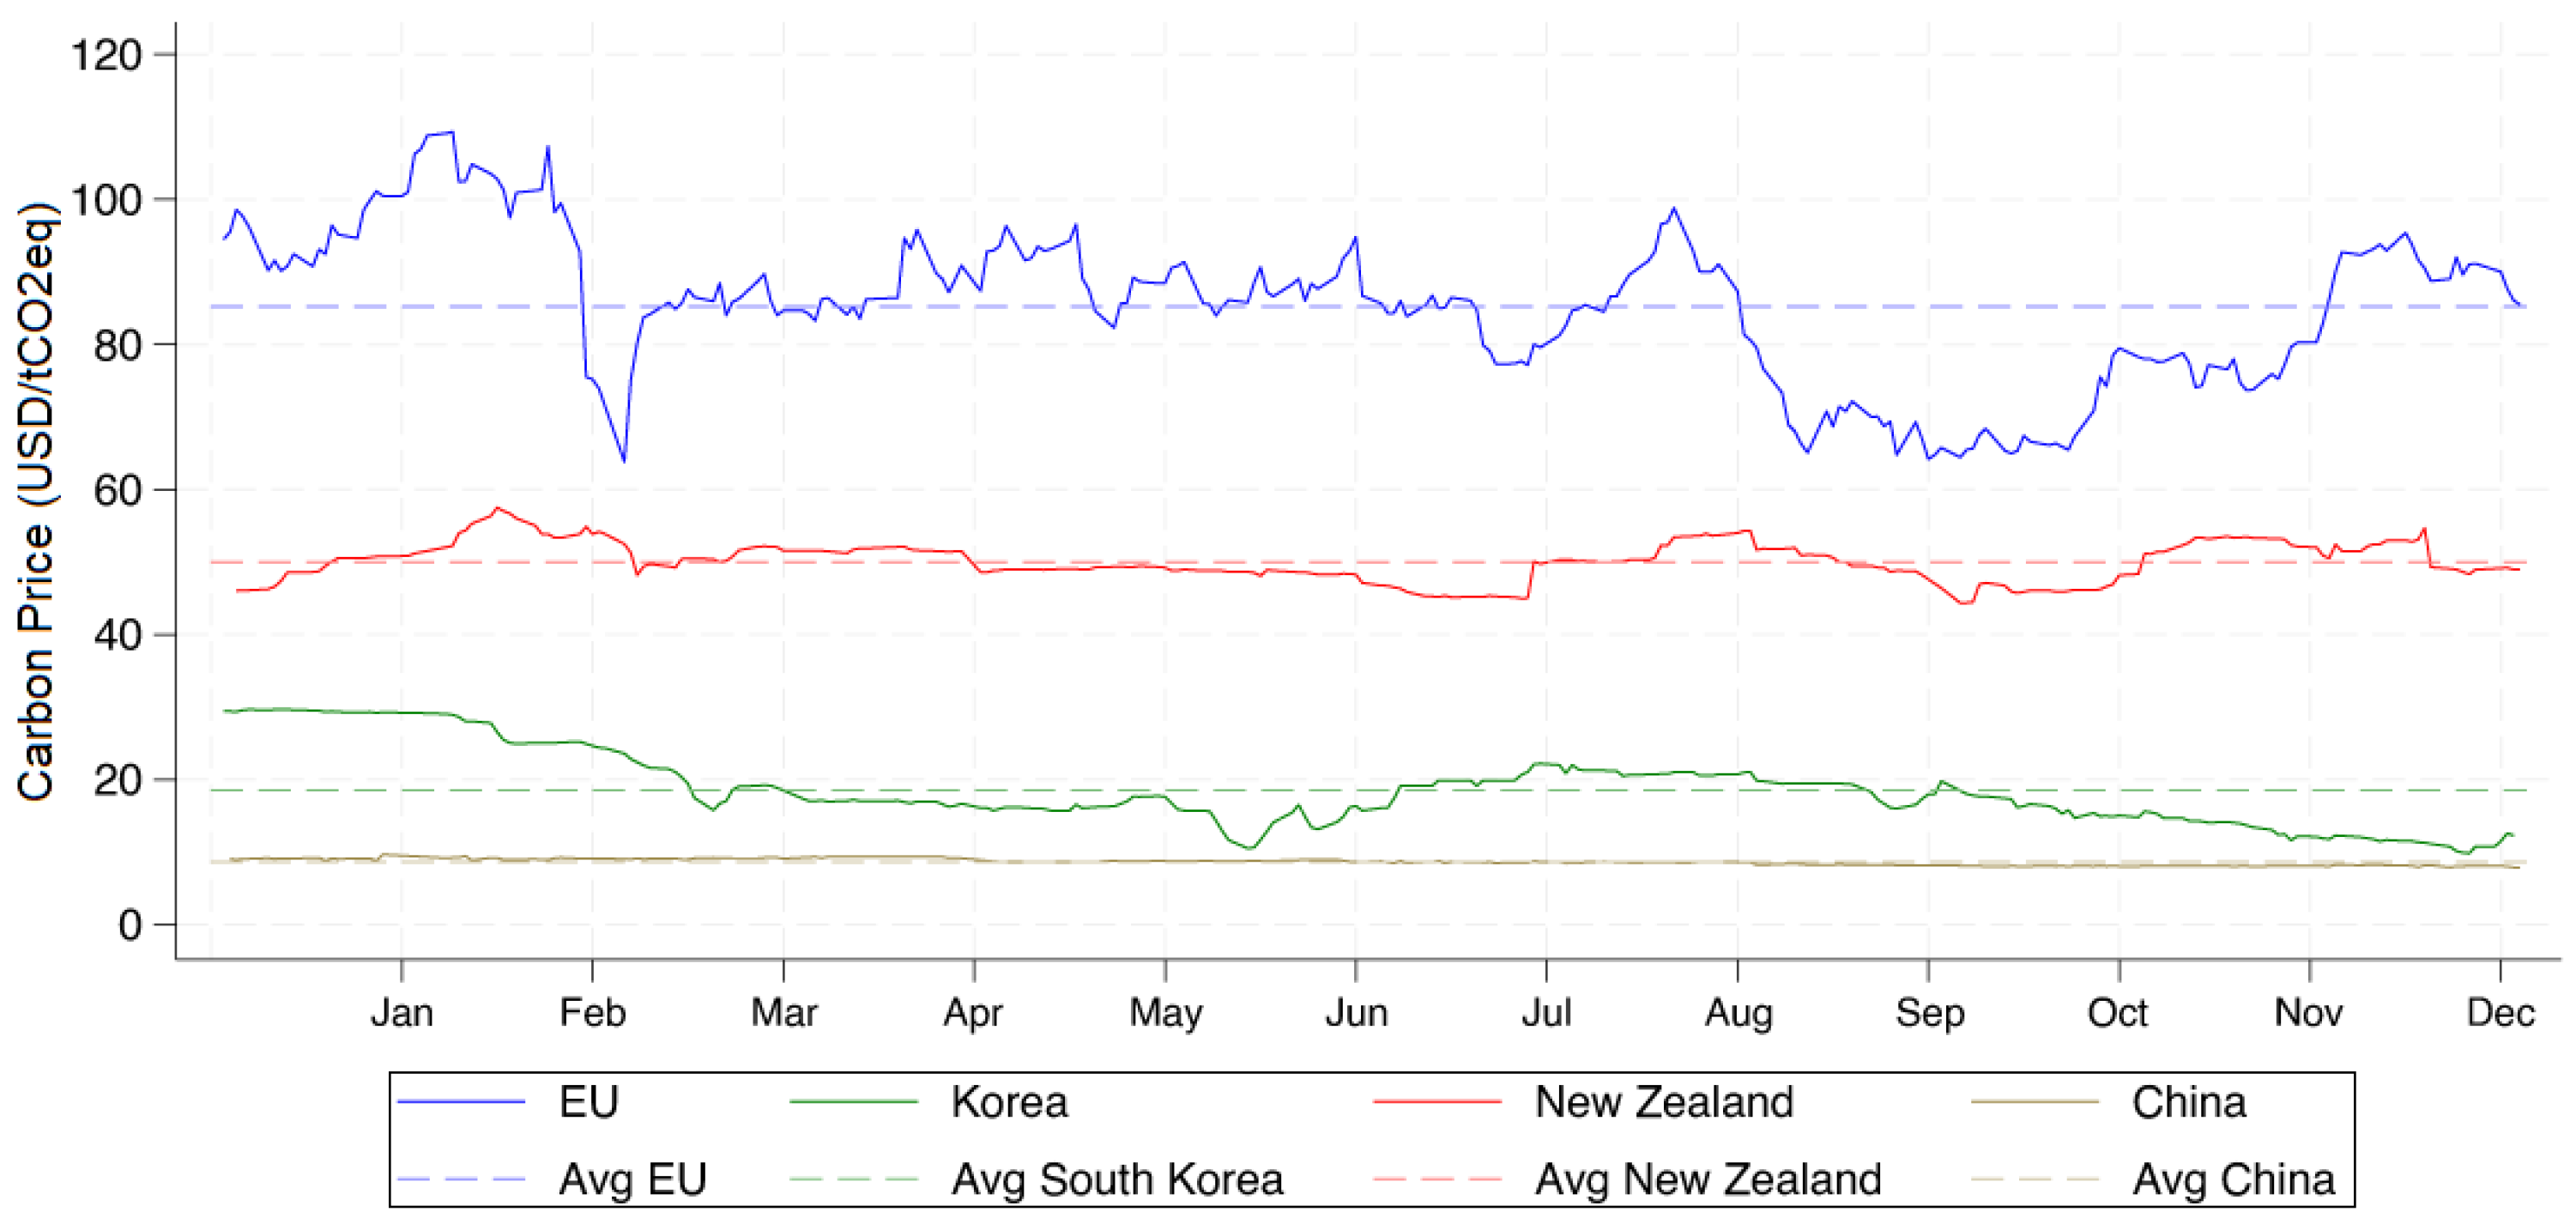
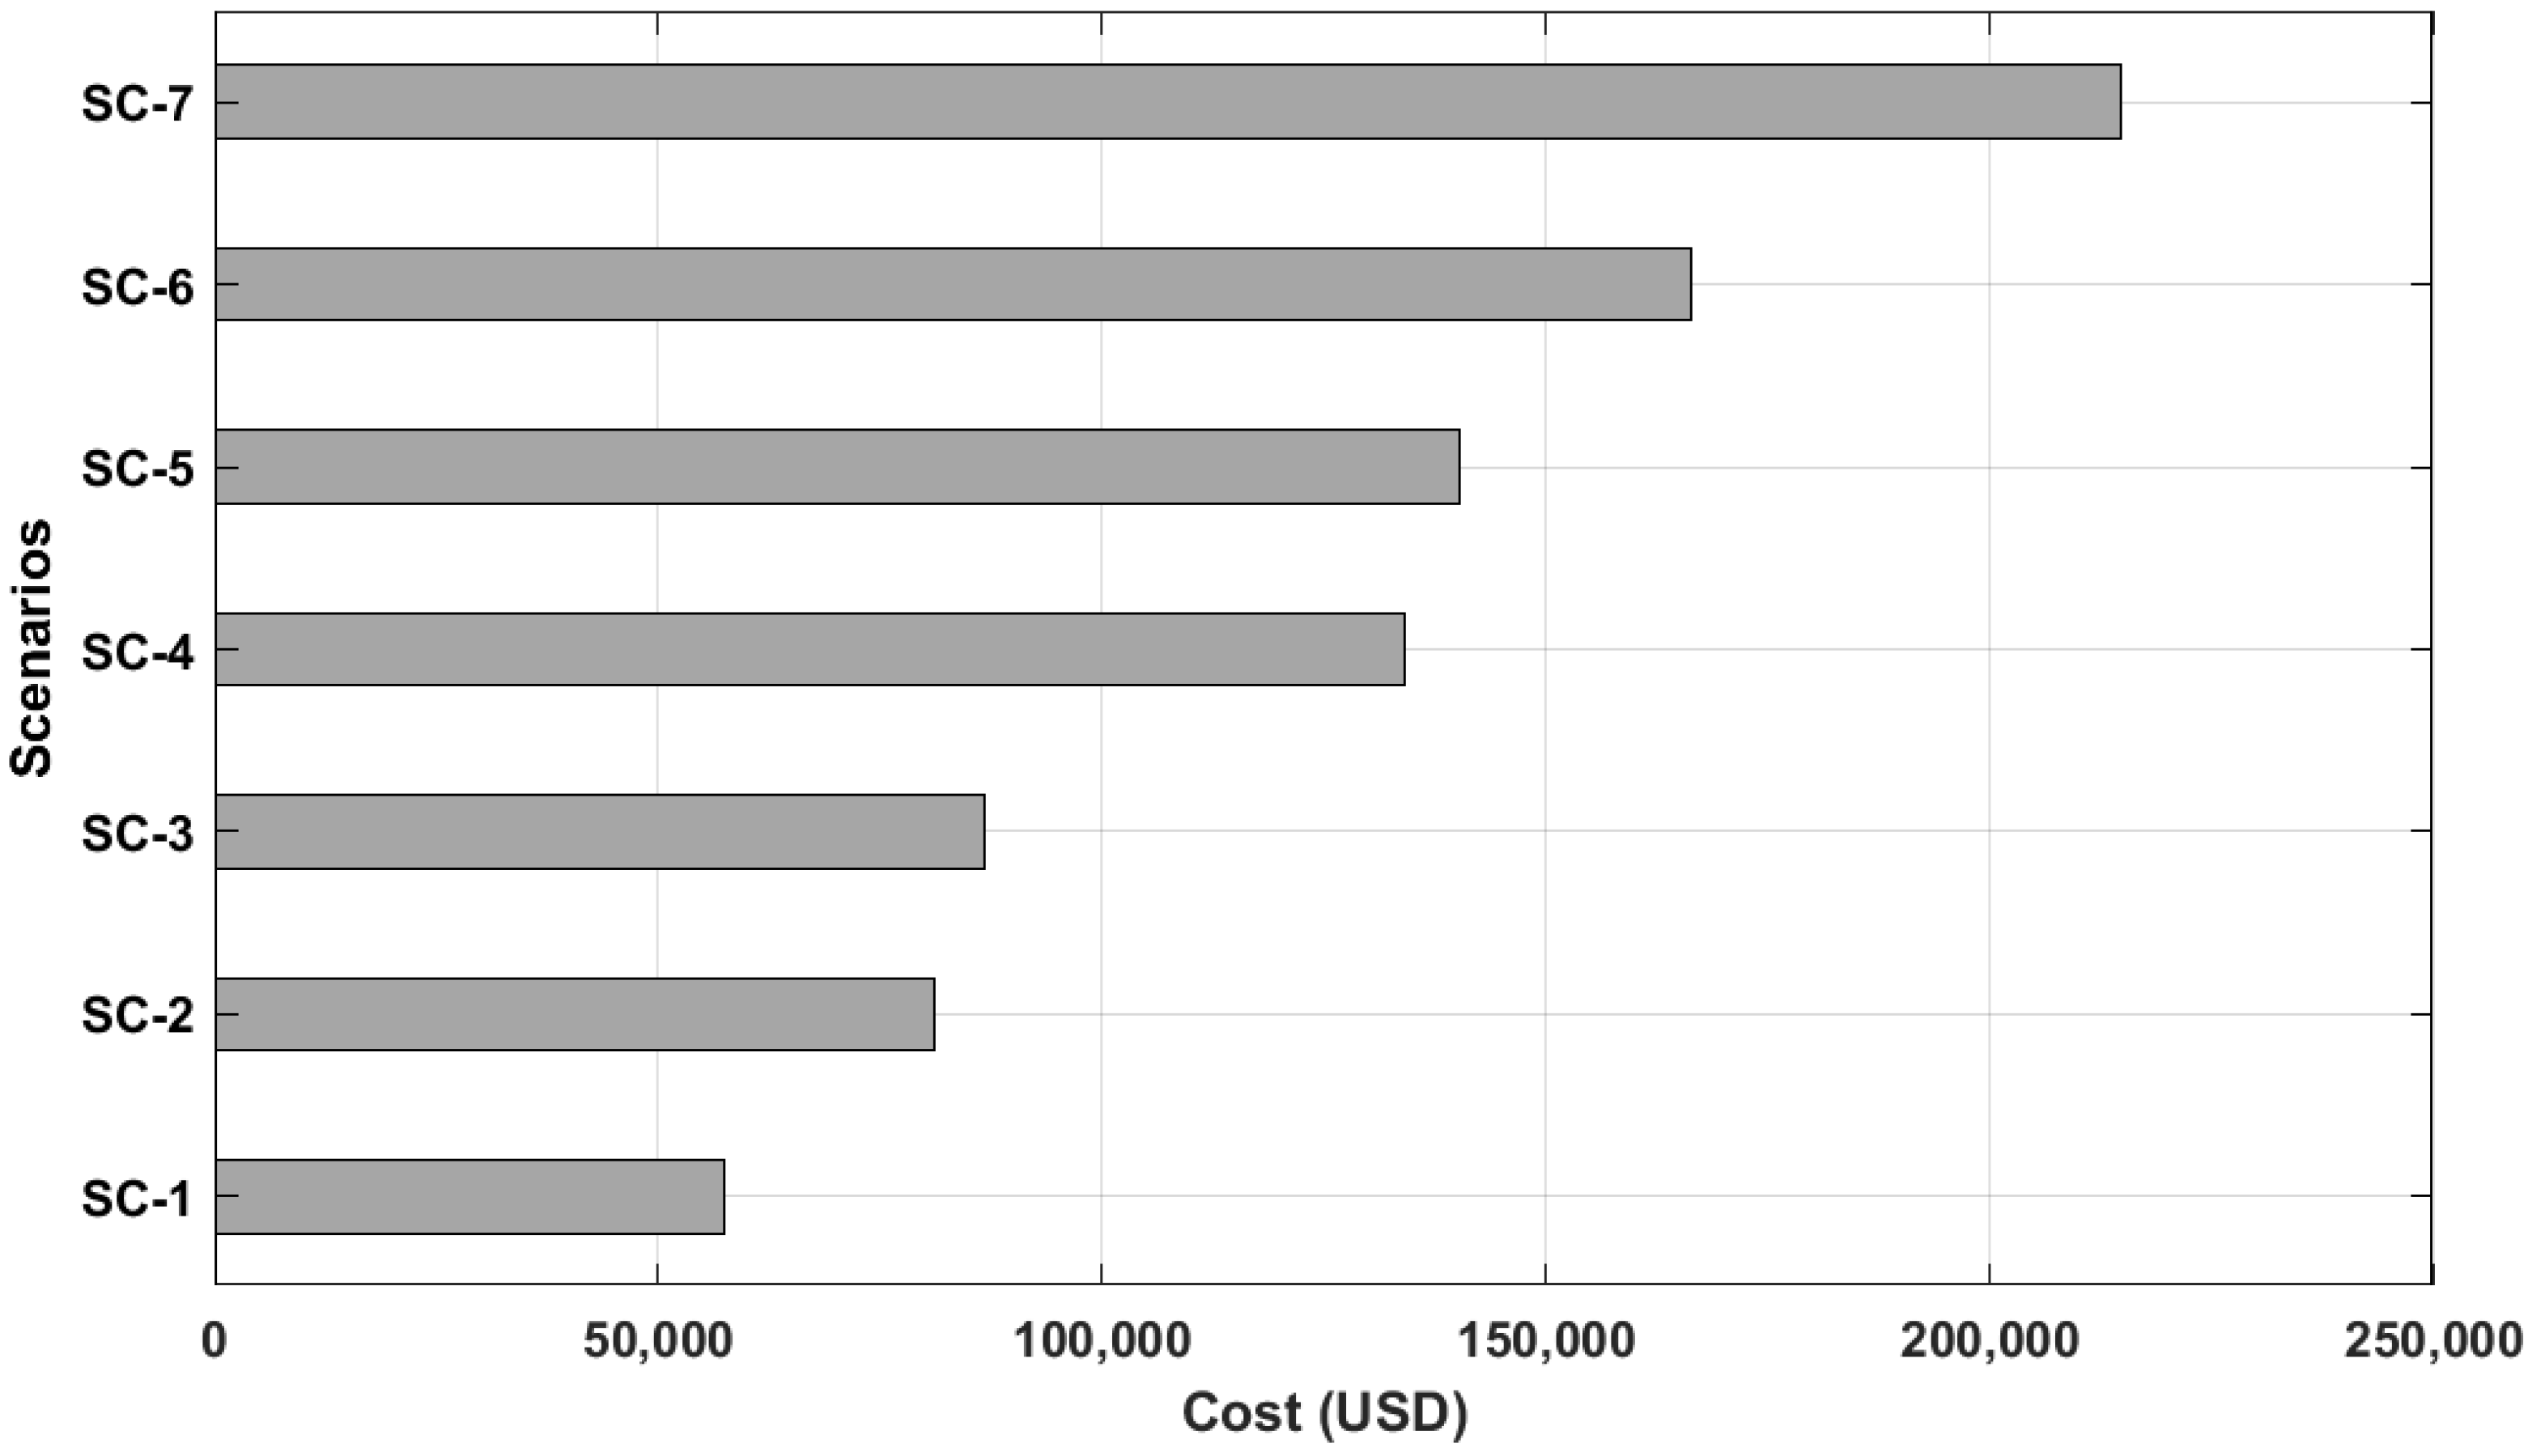
The results indicated that the seven scenarios were not financially feasible due to high initial investment costs and limited revenue streams. However, the inclusion of carbon credit revenues in SC-7 significantly improved its economic feasibility. Specifically, the NPV improvements ranged from 11% in the EU carbon credit market to 1% in the Chinese market. This suggests that Ecuador could enhance the economic viability of renewable energy projects by participating in carbon credit markets. These findings lead to two key economic and policy implications: (i) the need for carbon credit markets in developing countries, either at the national or regional level, and (ii) the importance of economic incentives for environmental protection. These incentives should aim to internalize the external costs of environmental pollution. Despite the availability of some incentives, we recommend the application of subsidies and grants to support the initial investment in clean energy projects. The initial investment costs across the scenarios ranged from USD 57,000 to nearly USD 215,000. Governments should thus play a role in stimulating clean energy projects by offering subsidies for acquiring PV system components or incentivizing the sale of surplus electricity to the grid. These initiatives are essential, as previous research has shown that consumer subsidies (e.g., feed-in tariffs and purchase price reductions) significantly impact demand. Additionally, subsidies encourage innovation and the improvement of PV module efficiency. By implementing such incentives, such as emission trading systems and subsidies, the government can foster innovation, attract investment in the green sector, help consumers and businesses reduce costs, promote greenhouse gas emissions reduction, and support environmental protection.
The main advantage of this paper lies in the fact that, so far, no studies have been conducted on carbon markets for renewable energy projects in educational buildings in Ecuador. This work is a roadmap to promote the widespread adoption of grid-connected PV systems in such buildings, aiming to facilitate potential carbon credit sales. However, a limitation is that the analysis focuses solely on three buildings, despite the university under study having many more constructions with rooftops that offer significant potential for PV system installation. Economies of scale in projects with larger PV module areas can significantly reduce initial investment costs. Purchasing equipment in large quantities allows for better price negotiations, optimization of material and infrastructure utilization, and more efficient allocation of fixed costs such as design, permits, and labor. Furthermore, advanced logistics and installation techniques can be implemented in larger-scale projects to enhance operational efficiency and reduce associated execution costs.


 ,
, 


