Abstract
The major challenges in designing a Hybrid Renewable Energy System (HRES) include selecting appropriate renewable energy sources and storage systems, accurately sizing each component, and defining suitable optimization criteria. This study addresses these challenges by employing Particle Swarm Optimization (PSO) within a multi-criteria optimization framework to design an HRES in Kern County, USA. The proposed system integrates wind turbines (WTS), photovoltaic (PV) panels, Biomass Gasifiers (BMGs), batteries, electrolyzers (ELs), and fuel cells (FCs), aiming to minimize Annual System Cost (ASC), minimize Loss of Power Supply Probability (LPSP), and maximize renewable energy fraction (REF). Results demonstrate that the PSO-optimized system achieves an ASC of USD6,336,303, an LPSP of 0.01%, and a REF of 90.01%, all of which are reached after 25 iterations. When compared to the Genetic Algorithm (GA) and hybrid GA-PSO, PSO improved cost-effectiveness by 3.4% over GA and reduced ASC by 1.09% compared to GAPSO. In terms of REF, PSO outperformed GA by 1.22% and GAPSO by 0.99%. The PSO-optimized configuration includes WT (4669 kW), solar PV (10,623 kW), BMG (2174 kW), battery (8000 kWh), FC (2305 kW), and EL (6806 kW). Sensitivity analysis highlights the flexibility of the optimization framework under varying weight distributions. These results highlight the dependability, cost-effectiveness, and sustainability for the proposed system, offering valuable insights for policymakers and practitioners transitioning to renewable energy systems.
1. Introduction
Hybrid Renewable Energy Systems (HRES) are becoming increasingly popular due to the rise in the demand for sustainable and reliable energy production. These systems integrate multiple renewables, such as wind turbines (WTs), solar photovoltaic (PV), and biomass (BMG) with advanced energy storage technologies, including battery and hydrogen (H2) storage. This combination provides a practical solution for achieving energy security, environmental sustainability, and economic viability. By leveraging multiple energy sources, HRES can address the intermittent nature of individual renewables, ensuring a consistent energy supply [1]. As the world shifts towards cleaner energy, optimizing these systems to balance cost, reliability, and environmental impact has become a key area of research [2].
Optimizing HRES is complex due to the variability of renewable sources, multiple technologies, and balancing economic, operational, environmental, and social goals. Studies have used classical, artificial, hybrid, along with software-based methods [3,4,5,6]. Traditional approaches often fall short, prompting researchers to explore advanced computational techniques [7]. These methods are different from the algorithms presented in this manuscript. Interestingly, this approach can achieve a better convergence rate, reduce computation times, and improve accuracy. In addition, most previous works have utilized a single-criterion objective function for optimal HRES. For example, Boujdaini et al. [8] utilized Particle Swarm Optimization (PSO) to minimize COE in a PV–wind–battery–diesel system, emphasizing optimal system sizing for reliable energy supply in remote areas. Similarly, Li et al. [9] employed PSO to optimize a PV–wind system with H2 storage, achieving significant reductions in power redundancy and shortages. Charfi et al. [10] demonstrated the trade-off between minimizing CO2 emissions and system costs in a PV–battery–diesel generator system. Other studies, such as Hamza et al. [11] and Medghalchi and Taylan [12], focused on rapid system sizing and economic viability, albeit with limited reliability and sustainability assessments. Bismark et al. [13] and Iweh and Akupan [14] extended single-objective optimization to include operational costs and greenhouse gas (GHG) emissions, finding that differential evolution (DE) often outperforms PSO in convergence speed and accuracy.
Furthermore, several studies have emphasized the use of a multi-criteria decision-making approach to simultaneously achieve multiple objectives, such as economic efficiency, environmental sustainability, and system reliability. Zhang et al. [15] employed Multi-Objective PSO (MOPSO) to optimize a Combined Heat and Power (CHP)–PV energy storage system, achieving significant energy performance improvements. Similarly, Zhang et al. [16] integrated Simulated Annealing (SA) with PSO (SAPSO) to enhance the scheduling efficiency of a PV–wind–battery–diesel generator system. Advanced hybrid algorithms, such as those explored by Güven et al. [17] and Ukoima et al. [18], demonstrated superior performance in balancing economic and environmental metrics. Eriksson and Gray [19] developed a multi-dimensional PSO algorithm that effectively maximized Net Present Value (NPV) and reliability while minimizing Annual System Cost (ASC) and carbon footprint. Studies by Verma et al. [20] and Yahiaoui and Tlemçani [21] compared multiple algorithms, highlighting the effectiveness of Whale Optimization Algorithm (WOA) and Pheasant Bird Optimization Algorithm (PBOA) in addressing complex HRES challenges. Xie et al. [22] and Pravin et al. [23] further emphasized the role of multi-objective approaches in improving energy efficiency and economic performance, particularly under dynamic environmental conditions. Saravanan et al. [24] conducted a comparative analysis of several meta-heuristic algorithms, demonstrating PSO’s effectiveness in optimizing cost, reliability, and energy production for remote systems. Bakhtiari and Naghizadeh [25] designed an HRES that incorporates WTs, PV, fuel cells (FCs), electrolyzers (ELs), H2 tanks, and battery storage units to address the intermittency of renewable energy. The research employed a multi-criteria approach to minimize the Total System Cost (TSC), by considering the Loss of Power Supply Probability (LPSP), Total Energy Loss (TEL), and the power disparity between generation and storage capacity (TELSUB). Utilizing the constraint method and the Shuffled Frog Leaping Algorithm (SFLA), the system was optimized based on actual wind speed and solar irradiance data for a specific location with intermittent load demand. The detailed summary of various literature on the optimization of HRES using meta-heuristic algorithms is highlighted in Table 1.

Table 1.
Summary of various literature on the optimization of HRES using meta-heuristic algorithms.
As evident from Table 1, most studies so far have primarily focused on combinations of WT, PV, batteries, and DG, with some, including FC in hybrid systems. The literature highlights an increasing number of studies exploring the use of meta-heuristic algorithms, including GA, PSO, and hybrid methods, for addressing complex energy system design challenges [29]. Previous research on HRES has largely overlooked how BMG could play its part. Furthermore, it is crucial to understand that, while there is a lot of research separately in BMG, PV, and WT, there is a research gap in the integration of these together in a single framework. This study implements and evaluates the performance of these widely used algorithms and their hybrid for HRES optimization. By comparing their effectiveness in balancing multiple objectives, this work provides valuable insights into their practical applicability and limitations. This study implements a single framework integration, incorporating battery and hydrogen storage units. The proposed model addresses this gap by unifying these components to ensure a flexible and reliable energy supply. The novelty of employing a multi-criteria optimization framework lies in its ability to integrate diverse performance indicators, including cost, reliability, and sustainability, into the decision-making process. The HRES cost, reliability, and sustainability are calculated using three matrices, ASC, LPSP, and REF. To validate the effectiveness of multi-criteria optimization using PSO, a comparative analysis was conducted with established optimization methods, such as GA and hybrid GAPSO. This study addresses the following objectives:
- Identify optimal performing HRES configuration using multi-criteria optimization that integrates BMG, PV, and WT resources with battery and H2 storage systems, utilizing advanced PSO.
- Determine the cost-effectiveness of maintaining reliability and sustainability.
- Assess the performance of the PSO algorithm in comparison to GA and GAPSO, focusing on solution quality, convergence speed, and computational efficiency.
- Perform sensitivity analysis on weighted parameters and its influences on the objective functions.
This study extends beyond theoretical contributions by offering valuable practical insights for policymakers, engineers, and stakeholders in the renewable energy sector. Through the optimization of Hybrid Renewable Energy Systems (HRES) design and operation, it facilitates the transition to cleaner energy solutions, contributing to global efforts in mitigating climate change and promoting sustainable development. Additionally, it presents a systematic approach adaptable to diverse geographical and operational contexts, thereby enhancing the knowledge base in renewable energy system design.
2. Hybrid Renewable Energy System Components Modeling
Figure 1 illustrates the proposed HRES constituting PV–WT–battery–BMG–EL–FC system. The mathematical representation of all technologies is briefly presented in the following subsections, followed by the energy management system.
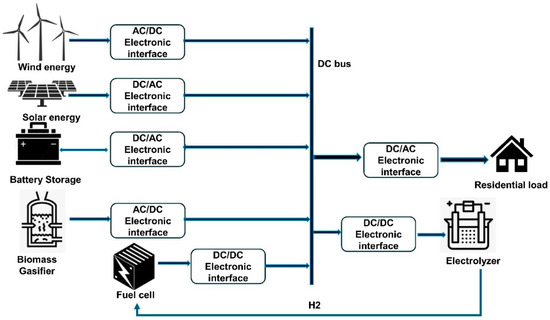
Figure 1.
Proposed system model for standalone HRES.
2.1. Wind Model
The commonly used mathematical model for a WT in the sizing optimization of HRES is illustrated in Equations (1)–(3) [30,31]. The WT generates power when the wind speed is within the cut-in () and cut-out velocity (), and it depends on the wind velocity (v), air density (ρ), wind turbine area (A), and energy coefficient (Cp). The maximum possible Cp of 0.4 is taken into account to make the computation simpler. The estimated wind power ( from each WT is as follows:
The power generation function P(v) is expressed as follows:
The total power produced from a wind farm consists of WTs can be expressed as the following:
2.2. PV Model
The power supplied by PV panels ( as a function of solar irradiance (G) and temperature (T) is calculated using Equation (4), where is the nominal output power with reference solar irradiance ( in W/m2) at reference temperature ( in °C). is received irradiance at ambient temperature () [19]. Finally, is the power temperature coefficient.
2.3. Biomass Model
The amount of power generated from the biomass generator ( at any operational hour (T) can be calculated as shown in Equations (5) and (6) [31].
In Equations (5) and (6), feedstock presents biomass from a farm in (ton/year), CV is calorific value for feedstock, is conversion efficient from BM–electricity, and is the capacity utilization factor.
2.4. Battery Model
When PV and wind sources produce more power than needed, the extra power is stored in the batteries for future use and vice versa. Equations (7) and (8) are used to calculate the charging/discharging processes and minimum battery storage capacity, respectively [32].
where , are the stored energy in the battery, discharge from the battery, total energy generation, and load energy at time t, while are the charged and discharge energy of the battery at time t−1. , σ, DOD (0.8), , and SB are the minimum level of charge, the battery’s self-discharge, depth of discharge, battery efficiencies (0.9), and nominal capacity, respectively.
2.5. Electrolyzer and Fuel Cell Model
The electrolyzer utilizes surplus electricity to produce H2 after charging the battery. The power consumed by the electrolyzer denoted as Pel-HT is calculated using Equation (10) [33].
where and represent the electrolyzer’s efficiency and the excess power consumed after charging the battery.
The energy stored in the H2 tank is calculated and given by Equation (11) [32]:
where EHT,t and EHT,t−1 are H2 stored in the tank at time t and t − 1, respectively. represents the power supplied to the fuel cell, and is H2 tank efficiency.
The hourly H2 level in the tank is determined using Equation (12) [34]:
where Q is the H2 mass flow, and is the H2 consumption. Finally, the power output of the FC is calculated using Equation (13):
2.6. Energy Management Strategy
Photovoltaic and wind power generation depend on solar radiation, wind speed, and temperature, all of which fluctuate hourly. Additionally, load demand varies according to user requirements. The primary objective of efficient HRES energy dispatch is to optimize efficiency and reliability, reduce costs, and maintain a stable energy supply throughout the year. In this study, the authors developed a Rule-Based Energy Management Strategy (REMS) to conduct extensive simulations of the HRES with an hourly time resolution over a full year. Batteries serve as short-term storage within a hybrid storage configuration, mitigating the intermittency of Renewable Energy Sources (RES). Hydrogen (H2) storage offers long-term energy storage by converting surplus renewable energy into green hydrogen. The focus is placed on battery storage rather than fuel cells, while Biomass Gasification (BMG) power generation is utilized only when power generation falls short. The energy management strategy is well displayed in Figure 2.
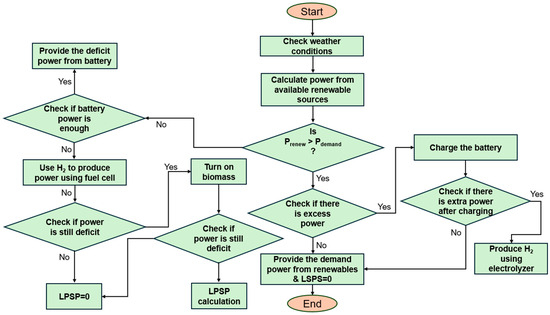
Figure 2.
Energy management for HRES.
When the power generated from PV and wind turbines (WTs) matches the load demand, the power sources fully supply the demand without contributions from the battery, hydrogen storage, or BMG. If power generation (Pgen) exceeds demand, the surplus energy is stored in the storage system. If the generated power surpasses the battery’s rated capacity, the excess is directed toward hydrogen production via the electrolyzer (EL). When Pgen falls below the required demand, the storage system compensates for the deficit. If the shortfall exceeds the battery’s capacity, the fuel cell (FC) supplies additional power. If the deficiency continues, the BMG system activates to cover the remaining load, ensuring system reliability.
3. Optimization Problem Formulation
3.1. Multicriteria Optimization Function
The main goal of this research is to identify the optimal number of components (PV–WT–battery–BMG–EL–FC system) for HRES at the minimum possible annual cost while ensuring reliability and sustainability. To achieve this objective, a multi-criteria approach utilizing PSO simulation with the weighted sum method is proposed (Figure 3). This integrates multiple criteria into a single objective function for improved configuration of the components and cost optimization [35].
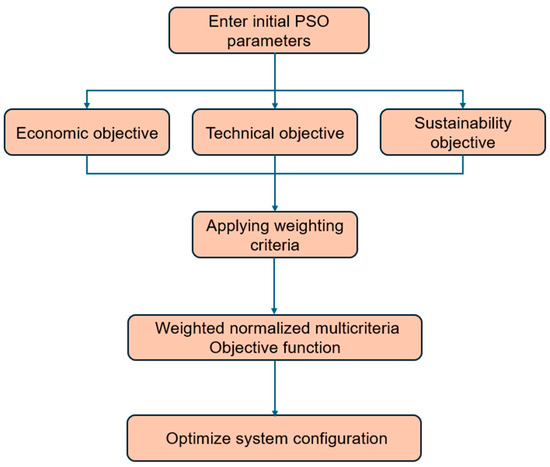
Figure 3.
Optimization algorithm.
To facilitate comparison among different criteria, it is necessary to normalize the data. Normalization transforms the raw data into a common scale, typically between 0 and 1. Normalization methods depend on whether the criterion is a benefit to maximize or a cost to minimize. This can be achieved using min/max normalization formula as given by Equation (14):
where is the normalized value; are the present, minimum, and maximum value [36].
For cost criteria, the normalized value ASC (x′) is calculated as follows:
The normalized value LPSP (x′) is as follows:
The normalized value REF (x′) is as follows:
This normalization ensures that all criteria are on the same scale, allowing for meaningful comparisons. Next, the weight for each objective is typically determined based on stakeholder priorities, system [37]. The sum of weights must equal 1:
Therefore, the common approach to handle a multiple-objective function is combining them into a single objective using a weighted sum, as defined in Equations (18) and (19):
In Equation (20), represent the variables for capacity of PV–WT–battery–BMG–EL–FC.
− denotes the weighting factors for the objective optimization problem, which depend on the specific problem and are selected through trial and error.
3.2. Constraint
The optimization algorithm followed these constraints (Equation (21)) and the decision variables’ upper and lower limits:
0 ≤ NPV ≤ NPV,max
0 ≤ NWT ≤ NWT,max
0 ≤ NBM ≤ NBM,max
0 ≤ NB ≤ NB,max
0 ≤ NHT ≤ NHT,max
0 ≤ Nel ≤ Nel,max
Eb,min ≤ Eb ≤ Eb,max
PFCmin ≤ PFC ≤ PFCmax
SOCmin ≤ SOC ≤ SOCmax
LPSP ≤ 0.01
REF ≥ 0.60
0 ≤ NWT ≤ NWT,max
0 ≤ NBM ≤ NBM,max
0 ≤ NB ≤ NB,max
0 ≤ NHT ≤ NHT,max
0 ≤ Nel ≤ Nel,max
Eb,min ≤ Eb ≤ Eb,max
PFCmin ≤ PFC ≤ PFCmax
SOCmin ≤ SOC ≤ SOCmax
LPSP ≤ 0.01
REF ≥ 0.60
NWT, NPV, NBM, NB, Nel, and NHT are a set of integer numbers, and its respective maximum numbers are NWT,max, NPV,max, NBM,max, NB,max, Nel,max, and NHT,max. EB,max, PFc,max, and HTmax are the maximum rating of the battery unit and the FC and the capacity of the H2 tank, respectively.
3.3. Design Criteria
3.3.1. Annual System Cost
To assess the economic objective, this study employed ASC as an essential performance parameter. The ASC was determined using the mathematical formula provided in Equations (22) and (23) [38].
where , represent components () total costs, capital costs, operating costs, replacement costs, and salvage costs, respectively.
3.3.2. Loss of Power Supply Probability
The LPSP measures the reliability of the HRES, ranging from 0 to 1. A value of 1 indicates a load deficit, while 0 means the load is always satisfied [27,30]. Mathematically, it is expressed as follows:
The LPSP value has to be lesser than 1%.
3.3.3. Renewable Fraction
REF is the percent of the energy delivered to a load that comes from renewable sources; it is given by Equation (25) [32]. In this simulation, the REF value was set >60%.
where and are the total deficit power from renewables and the total power generation.
4. Optimization Methods
4.1. Particle Swarm Optimization
In 1995, Kennedy and Eberhart introduced Particle Swarm Optimization (PSO), inspired by the collective behavior of bird flocking and fish schooling in nature. This approach follows a traditional problem-solving strategy that iteratively refines candidate solutions based on quality measures. PSO operates with a population of candidate solutions, represented as particles that navigate the search space using simple mathematical rules influenced by their own experiences and interactions with neighboring particles. The algorithm follows three fundamental steps: First, each particle is evaluated based on how well its position addresses the target objectives. Next, the global best fitness and position are updated using the individual best fitness and position of all particles [39]. Finally, PSO equations adjust the velocity and position of each particle, guiding them as a swarm using both individual experience and global information to converge toward an optimal solution. It will cause a change in the velocity and position of each particle given by Equations (26) and (27).
where ω, Vid, C1, C2, R1, R2, and Xid are the inertia factor, particle’s velocity in the idth dimension, cognitive and social factors, uniform random functions in [0, 1], and particles position. All particles must iterate their Xid position, i.e., move towards pbest and gbest (as defined by the updated set of non-dominated solutions). Equations (26) and (27) state that a particle updates its position using its old position and an experienced value of its best particle’s performance in the swarm. The PSO algorithm is shown in the flowchart below (Figure 4).
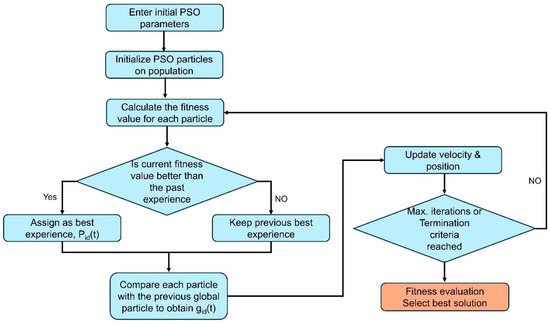
Figure 4.
Flowchart for PSO algorithm.
In this study, a global best PSO (gBest) approach is implemented to optimize the HRES. Unlike lBest PSO, which updates particle velocities based on neighborhoods, gBest uses the best solution from the entire swarm for faster and better convergence. gBest is chosen for its efficiency in solving multi-criteria optimization problems like minimizing ASC, LPSP, and maximizing REF. Though lBest’s neighborhood size can improve diversity and avoid premature convergence, it adds computational overhead and may slow down the process. It also increases computational overhead and may slow convergence. For the HRES optimization problem, where rapid and reliable convergence is critical, the gBest approach offers a balanced trade-off between performance and complexity.
The pseudocode description of the PSO algorithm (Algorithm 1) used to optimize HRES is presented below.
| Algorithm 1: Pesudocode for PSO algorithm |
| 1: For each particle 2: Initialize particle position and velocity 3: End For 4: Do 5: For each particle 6: Calculate fitness value 7: If the fitness value is better than the best fitness value pbest in history 8: Set current value as the new pbest 9: End 10: Choose the particle with the best fitness value of all the particles as gbest 11: For each particle 12: Calculate particle velocity according to the following equation: 13: 14: Update particle position according to the following equation: 15: 16: End 17: While maximum iterations or minimum error criteria is not attained |
4.2. Generic Algorithm
The Genetic Algorithm (GA) is another widely utilized optimization technique, drawing inspiration from natural selection and genetic principles. GA maintains a population of candidate solutions, evolving them over successive generations to identify optimal or near-optimal solutions. Each new generation comprises a combination of existing individuals, offspring, and mutations [40]. Figure 5 illustrates the flowchart of the GA optimization process. The core elements of GA include selection, crossover, mutation, and fitness evaluation. This approach is especially effective for tackling complex optimization problems where conventional methods may be less efficient.

Figure 5.
GA.
The pseudocode description of the GA (Algorithm 2) used to optimize HRES is presented below:
| Algorithm 2: Pseudocode algorithm for GA |
| 1: Begin 2: Generate an initial population of chromosomes. 3: While termination conditions not met 4: For each chromosome in the population evaluate the fitness of the chromosome. 5: Select parents from the population based on fitness. 6: Perform the crossover to recombine parents and produce offspring. 7: Apply mutation to the offspring with a defined probability. 8: Replace the old population with the new offspring population. 9: End 10: Store the chromosome with the best fitness value. 11: End |
4.3. Hybrid Genetic Algorithm Particle Swarm Optimization
The hybrid GAPSO algorithm combines the strengths of both Genetic Algorithm (GA) and Particle Swarm Optimization (PSO) while addressing their respective limitations [41]. It allocates iterations equally between the two methods. While GA is highly effective but relatively slow due to evolutionary operations such as selection, crossover, and mutation, PSO is computationally faster since it relies on mathematical operators, though it is prone to premature convergence. PSO follows three key steps: evaluating each particle based on objective functions, updating the personal best fitness and position for each particle, and determining the global best fitness and position among all particles. The PSO equations integrate both individual particle experience and collective swarm experience to efficiently navigate toward an optimal solution. This approach begins with the random initialization of a population of candidate solutions, followed by the calculation of the objective function value for each solution. GA processes this population by dividing it into two subpopulations, while PSO updates their positions. Both GA and PSO maintain archives of non-dominated solutions, which carry over to the next generation. This mechanism enables non-dominated solutions in PSO to serve as parents for GA, and vice versa, facilitating a balanced and effective optimization process. The flowchart for GAPSO is illustrated in Figure 6 and pseudocode in Algorithm 3.
| Algorithm 3: Pseudocode algorithm for GAPSO |
| 1: Begin 2: Input parameters for GA and PSO (population size, crossover rate, mutation rate, inertia weight, cognitive and social coefficients, etc.). 3: Generate the initial population using GA. 4: While GA termination criteria (e.g., maximum iterations) not met: 5: Perform selection to choose parents based on fitness. 6: Apply crossover to generate offspring from selected parents. 7: Apply mutation to offspring with a given probability. 8: Replace the population with the new offspring. 9: End While 10: Initialize PSO particles based on the GA-generated population. 11: While PSO termination criteria (e.g., maximum iterations) not met: 12: For each particle: 13: Calculate fitness value 14: Update pbest if the current fitness is 15: Determine gbest across all particles 16: For each particle 17: Calculate particle velocity according to the following equation: 18: 19: Update particle position according to the following equation: 20: 21: End; 22: End For 23: End While 24: Select the best solution based on fitness evaluation. 25: End |

Figure 6.
GAPSO algorithm.
5. Case Study: Resource Assessment of the Study Area
The methodology developed in this work has been employed to design a cost-effective and reliable HRES. The selected combinations of integrated technologies are tailored to the nature of the location and surrounding weather conditions in California City, Kern County, USA. In the hybrid system, sources were selected so that each source could compensate for the production shortfall of others, especially during periods when one source could not generate energy [42]. The optimization process considers environmental conditions, including hourly and seasonal changes in resource availability, to predict energy production from solar and wind sources, ensuring a more robust and realistic solution amidst randomness and challenges. The time-series data used for wind and solar was collected from European Commission, Joint Research Center databases [43], providing a historical reference for power output predictions. The daily average solar irradiance is 193.36 W/m2, with a peak value of 952.0 W/m2. Wind speed has been recorded at an 18 m height over 20 years at the same location, with an average speed of 5.5 m/s and a maximum of 26.5 m/s. The wind turbine used in this analysis has a cut-in speed of 2.75 m/s and a cut-out speed of 25 m/s. Wind speed, temperature, and solar irradiance data were collected over a one-year period (8760 h), as depicted in Figure 7 and Figure 8. Additionally, Figure 8 illustrates the hourly load demand for a year, with an average load profile of 1415 kWh and a peak demand of 4472.2 kWh. Agricultural residues and dry wood serve as primary biomass feedstocks, which are readily available in California City, Kern County, making them well-suited for integration into the energy system. The load demand for the proposed site is derived from the IES real-time electricity tracker data tools. Furthermore, technical and economic parameters used in this study are provided in Table 2. The methodology outlined in this study is designed to be adaptable to regions with diverse renewable energy resource profiles. By replacing the time-series input data for wind speed, solar irradiance, temperature, and load demand with region-specific datasets, the optimization framework can effectively evaluate and configure HRES tailored to local conditions. This flexibility ensures the methodology’s applicability across varying geographic, climatic, and economic contexts.
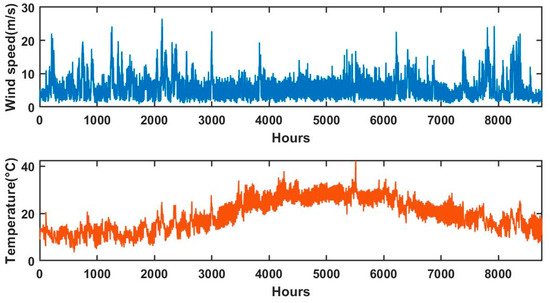
Figure 7.
Wind and temperature profile of proposed location.
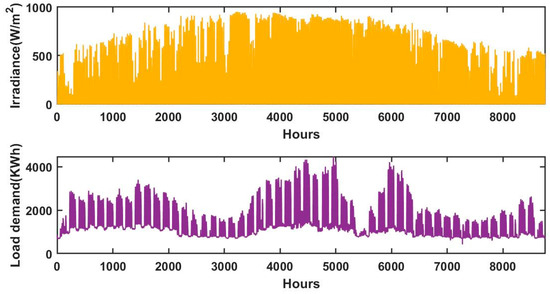
Figure 8.
Solar irradiance and load profile of proposed location.
Table 2.
Technical and economic parameters [17,44] *.
The parameters of the proposed optimization techniques are presented in Table 3. The selection of parameters for PSO and GA is crucial for achieving a balance between exploration (searching broadly across the solution space) and exploitation (refining solutions near promising regions).
Table 3.
Parameters for PSO and GA.
6. Result and Discussion
6.1. Optimization Performance
The proposed HRES is evaluated in MATLAB R2019b using PSO algorithms and compared with GA and GAPSO. The results determine the optimal size-based, techno-economic-sustainability characteristics. Decision variable bounds are set through trial and error, which is highly problem-dependent. Initially, the performance of the proposed HRES is measured considering equal weights (balance condition) to minimize ASC, maintaining reliability and sustainability. Reliability and sustainability are measured through LPSP and REF. Figure 9 and Table 4 illustrate the convergence curve and numerical results for PSO, GA, and GAPSO algorithms. The study uses GA and GAPSO as established optimization techniques to compare with PSO. Their performance metrics (e.g., ASC, LPSP, REF) act as a reference point or baseline to demonstrate the advantages of PSO.

Figure 9.
Convergence curve of optimization.
Table 4.
Summary result of HRES optimization.
The optimization algorithm was executed in 50 iterations to analyze the optimal performance, considering ASC, LPSP, and REF as multi-criteria functions. Among these, GAPSO achieved the lowest normalized fitness value of 0.35 and converged within 17 iterations, indicating its computational efficiency and optimal performance. PSO, with a normalized fitness value of 0.36, performs competitively but converges slightly slower, stabilizing within approximately 25 iterations. In comparison, GA achieves the highest normalized fitness value of 0.37, indicating the least optimal solution, and requires nearly 48 iterations to stabilize, making it the slowest algorithm in terms of convergence speed. When comparing PSO with GA and GAPSO, PSO proves to be a strong contender, offering faster convergence and better fitness value than GA, but slightly lagging behind GAPSO in both speed and optimization performance. Overall, GAPSO outperforms both PSO and GA, while PSO remains a superior choice compared to GA in terms of both efficiency and solution quality.
Table 4 reveals several key insights of optimization parameters for PSO, GA, and GAPSO. In terms of design objectives (Figure 10), GAPSO achieves the lowest ASC of USD 6,267,348 and a high REF (89.79%) while ensuring zero LPSP. PSO indicates that strong reliance on renewable energy leads to the highest REF (90.01%), making it environmentally preferable. However, its slightly higher LPSP and ASC (USD 6,336,303) suggest minor trade-offs in reliability and cost. Despite achieving zero LPSP, GA is the least cost-efficient (USD 6,551,730) and has the lowest REF (88.91%). This indicates a heavier reliance on backup energy sources like biomass, leading to increased costs.
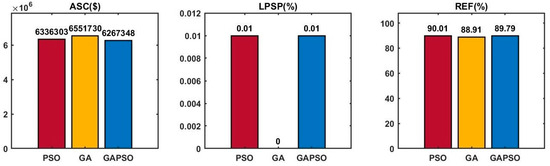
Figure 10.
Optimal design objectives for PSO, GA, and GAPSO.
The component-sizing analysis (Figure 11) shows solar energy consistently has the highest capacity, followed by wind, across all algorithms. Battery storage also remains vital due to its high capacity for energy storage. H2 storage capacity, including EL and H2 tanks, fluctuates across the cases, reflecting different levels of emphasis on H2 as a storage medium. PSO places strong emphasis on solar PV and EL capacities, indicating its prioritization of renewable energy generation and long-term hydrogen storage, making it suitable for scenarios where maximizing sustainability is critical. GA focuses heavily on BMG and H2 tanks, reflecting a strategy that prioritizes reliability and long-term energy storage. GAPSO balances WT, PV, and H2 components effectively and demonstrates a robust design strategy, prioritizing both cost-efficiency and renewable energy integration.
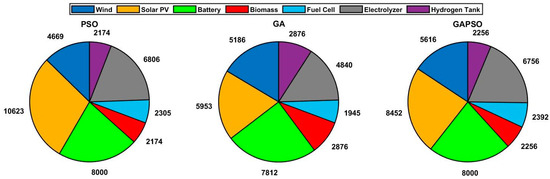
Figure 11.
Optimal components sizing of the HRES for PSO, GA, and GAPSO.
For simplicity, the system’s performance was evaluated over one year using PSO. The generation over the hours by each of the components is shown in Figure 12, Figure 13 and Figure 14. Wind and solar provide significant contributions but require storage and backup systems to address their variability. Batteries handle short-term fluctuations effectively, while H2 storage addresses longer-term imbalances. BMG and FCs ensure uninterrupted power supply during prolonged periods of low renewable energy generation. The system effectively meets load demand with high reliability and sustainability, showcasing its potential as a robust solution for modern energy challenges.
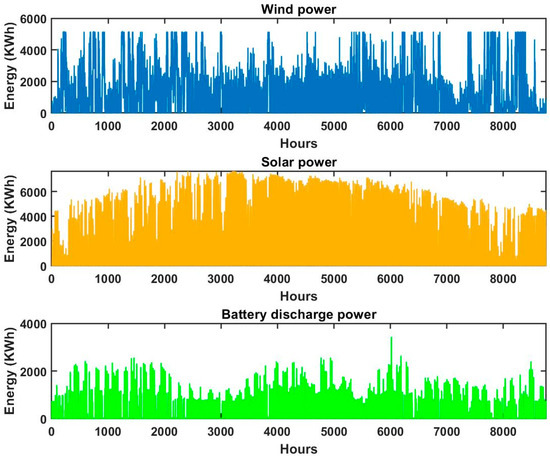
Figure 12.
Energy contribution by wind, solar, and battery.
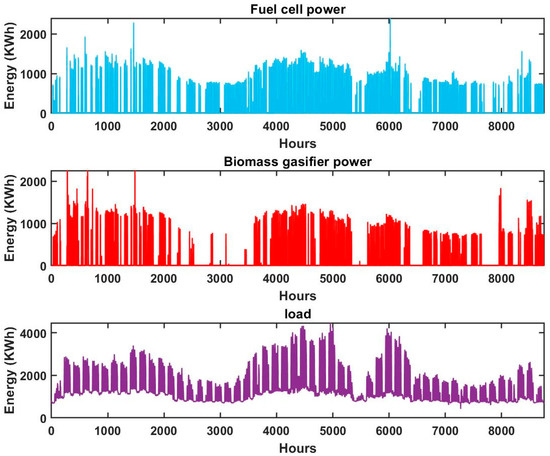
Figure 13.
Energy contribution by fuel cells and biomass and load.

Figure 14.
Battery SOC utilization and equivalent hydrogen energy stored in the tank.
6.2. Sensitivity Analysis:
6.2.1. Performance Evaluation Under Various Ambient Conditions
Figure 15 provides a detailed visualization of the power exchange between various system components for 48 h period in first week of January where demand is low. The system first utilizes renewable sources like solar and wind power. During peak renewable generation periods (e.g., 81–89 h and 103–117 h), the load is entirely met by renewables, reducing reliance on storage and backup systems. During the periods before 81 h and between 90 and 103 h, WT and PV are unable to generate energy. Consequently, batteries, FC, and BMG are required to support the load. The detailed management of the storage and backup system was illustrated in Figure 4.
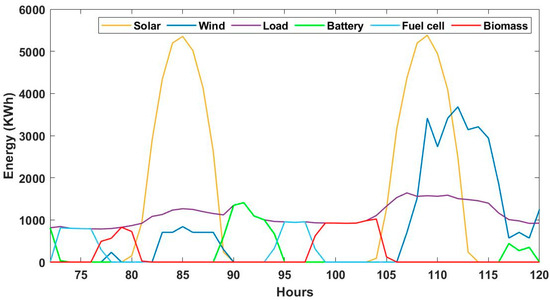
Figure 15.
The energy contribution from each component on the fourth and fifth days of January, a month characterized by low load demand.
A similar pattern is observed during the analyzed period of peak load demand (Figure 16). Between hours 4445–4458 and 4475–4484, renewable energy generated from wind turbines (WTs) and photovoltaic (PV) systems sufficiently meet the load demand. Excess power is utilized to charge the battery storage system and supply the electrolyzer (EL) for hydrogen production, eliminating the need for the biomass generator (BMG). However, during hours 4460–4469, when no energy is available from WT and PV, the combined output from the fuel cell (FC) and battery storage falls short of meeting the demand. Consequently, the BMG is activated to compensate for the deficit, ensuring system reliability through its operational strategy.
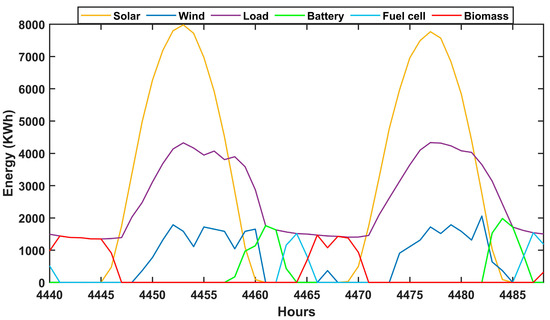
Figure 16.
Energy contribution by the components during fifth and sixth day in July (High load demand month).
Figure 17 demonstrates the energy contribution of various components in the HRES under poor weather conditions, where renewable energy generation is significantly reduced. Both solar and WT outputs are minimal, with sporadic peaks that are insufficient to meet the load demand. This highlights the reliance on storage and backup systems during periods of low renewable availability. The battery storage system plays a crucial role by discharging energy to partially meet the load during the early hours of the observed period. However, as the period progresses, the battery’s contribution diminishes, indicating depletion of its stored energy due to prolonged reliance.
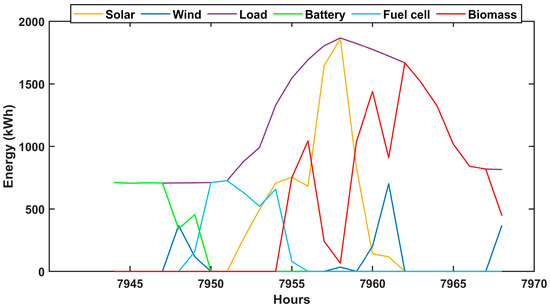
Figure 17.
One-day energy contribution by the components during poor weather conditions.
To address the deficit, the FC becomes active, utilizing stored H2 to generate power. While the FC effectively supports the load demand, its output alone is not sufficient to cover the entire deficit. Consequently, the BMG steps in as a last-resort backup system, providing a significant contribution during extended renewable and storage shortfalls. The BMG’s output increases steadily to compensate for the remaining energy gap, ensuring the load demand is met without any interruptions.
Figure 18 highlights the energy contributions of the HRES during good weather conditions between hours 95 and 120, where solar and wind power dominate. Solar power peaks around hour 109, while WT provides consistent support, effectively meeting the load demand with minimal reliance on storage or backup systems. The battery briefly discharges around hour 115 to address minor renewable deficits, and BMG contributes between hours 96 and 105. The FC remains inactive throughout this period, demonstrating the system’s efficient prioritization of renewable energy.

Figure 18.
One-day energy contribution by the components during good weather conditions.
Figure 17 and Figure 18 highlights the system’s design incorporates mechanisms to manage extreme weather events and sudden renewable energy fluctuations. By utilizing storage solutions for immediate and prolonged imbalances and backup systems for severe deficits, the HRES ensures resilience and reliability.
6.2.2. Change in Weighting Parameters
Here, this study also considered three scenarios (Case I, Case II, Case III), with different weight distributions for the objectives. Figure 19 and Table 5 provide insights into the performance of the optimization across these cases.
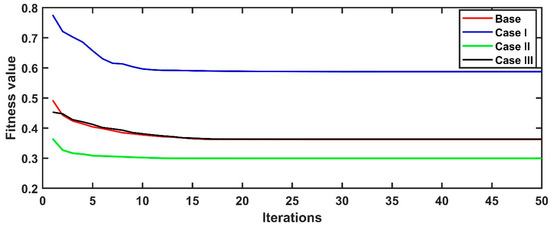
Figure 19.
Convergence analysis of PSO with varying weights assigned to the objective constraints.
Table 5.
Performance analysis with varying weights assigned to the objective constraints.
The base case achieves a balanced result; with equal weights, the system achieves a balanced result, converging to a fitness value of approximately 0.4. Case I (w1 = 0.6 w2 = 0.3, w3 = 0.1), which prioritizes cost (w1 = 0.6), achieves the lowest ASC (USD 6,244,144) and the highest fitness value (0.59), making it the most cost-efficient. Case II (w1 = 0.3 w2 = 0.6, w3 = 0.1) emphasizes reliability (w2 = 0.6), resulting in the lowest LPSP (0.01%) but with a lower fitness value (0.29). Case III (w1 = 0.3 w2 = 0.1, w3 = 0.6) focuses on renewable integration (w3 = 0.6), achieving the highest REF (90.88%) and eliminating LPSP entirely but at the cost of the highest ASC (USD 6,691,189) and a fitness value of 0.36. The results highlight clear trade-offs between cost efficiency, reliability, and renewable energy integration, with the optimal choice depending on the system’s priorities. This sensitivity analysis highlights the flexibility of the weighted sum approach allows for customization based on regional priorities, such as minimizing costs in resource-scarce areas or maximizing renewable energy utilization in regions with abundant resources
6.2.3. Impact of Key Parameters in the PSO Algorithm on HRES Performance
The performance of the HRES depends on how well the PSO algorithm is configured. Key parameters in PSO play a critical role in determining the efficiency of the optimization process and the quality of the results, as shown in Figure 20. This study compares the effects of varying key PSO parameters (cognitive and social coefficients, particle size, and inertia weight) on the performance of the HRES. The parameters for the base case are provided in Table 3.
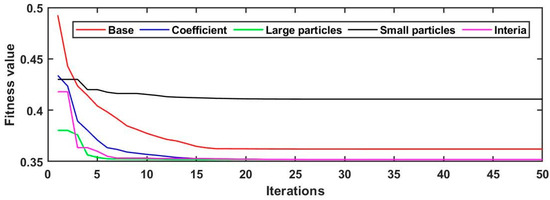
Figure 20.
Convergence plot showing the impact of PSO parameters.
In the base case, the algorithm achieves balanced convergence, with moderate fitness value and steady performance. When the cognitive coefficient (c1) is increased (from 1.5 to 2) and the social coefficient (c2) is decreased (1.5 to 1: blue curve), the algorithm initially converges faster due to enhanced individual exploration and stabilizes at 0.35. Increasing the particle size from 24 to 50 (green curve) significantly improves exploration, leading to faster convergence and the lowest fitness value, indicating the best optimization results. This is attributed to the algorithm’s ability to thoroughly search the solution space, resulting in better component sizing and system configurations. In contrast, reducing the particle size to 5 (black curve) limits exploration, causing slower convergence and suboptimal results. This demonstrates the risk of premature convergence when particle diversity is insufficient. Finally, increasing the inertia weight from 0.5 to 0.9 (magenta curve) ensures broad exploration in the early stages and efficient exploitation in later stages, making it both effective and efficient compared to the base case. Proper tuning of PSO parameters ensures that the HRES achieves the best performance by balancing ASC, LPSP, and REF. These parameters must be chosen carefully to avoid slow optimization or suboptimal solutions while meeting the energy system’s goals.
6.3. Comparison with Existing Study
Since achieving an exact match in configuration, load, and design parameters is not always feasible, this study conducts a comparative analysis of optimal HRES (Table 6) using a similar configuration, regardless of the optimization algorithm employed. The proposed configuration demonstrates performance in terms of LPSP and REF compared to previous studies. In terms of ASC, the current study achieves a balance between cost, reliability, and renewable energy utilization. This trade-off may be considered acceptable, depending on the application’s requirements, economic constraints, and regional factors. Variations in ASC, LPSP, and REF between this study and prior research can be attributed to differences in geographical location, the availability of renewable resources such as solar irradiance and wind speed, and specific design constraints.
Table 6.
Performance comparison with previous studies.
7. Conclusions and Recommendations
This study aimed to optimize the configuration of an HRES, integrating WT/PV/BMG/battery/EL/FC, using a multi-criteria optimization approach, and combining ASC, LPSP, and REF into a single-objective function through a weighted sum approach using PSO. The results demonstrated a balanced trade-off between cost, reliability, and sustainability, with an ASC of USD 6,336,303, a low LPSP of 0.01%, and a high REF of 90.01%. Compared to GA and hybrid GAPSO, PSO improved cost-effectiveness by 3.4% over GA and achieved a 1.09% reduction in ASC compared to GAPSO. Reliability is consistent across PSO, GA, and GAPSO, with negligible variation in LPSP performance. PSO has a slight edge over GA (1.22%) and GAPSO (0.99%) in terms of REF. The system’s optimized configuration, including 4669 kW WT, 10,623 kW of PVs, 8000 kWh batteries, 2174 kW BMG, 2305 kW FC, and 6806 kW EL, underscores its efficiency. A sensitivity analysis demonstrated the adaptability of the optimization framework under varying weight distributions, reinforcing the robustness of PSO for multi-criteria decision-making. The comparative analysis further validated the proposed system’s superior performance over previous studies, emphasizing its potential to address the challenges of energy intermittency, economic feasibility, and environmental sustainability.
These findings have significant implications for the design and implementation of HRES, particularly in regions with dynamic resource availability. Future work could focus on scalability of the PSO algorithm by analyzing its computational performance and optimization efficiency in more extensive energy systems with increased decision variables, constraints, and broader geographic or temporal scopes and integrating emerging algorithms. Additionally, incorporating long-term degradation models and analyzing hydrogen storage safety and regulatory frameworks will enhance the accuracy and practical applicability of the proposed methodology.
Author Contributions
Conceptualization, writing—original draft preparation, S.O.B. and O.S.T.; writing—original draft preparation, A.M.; writing—review and editing, S.O.B., O.S.T., A.M., M.D., N.H. and M.A.; supervision, O.S.T. All authors have read and agreed to the published version of the manuscript.
Funding
This research received no external funding.
Institutional Review Board Statement
Not applicable.
Informed Consent Statement
Not applicable.
Data Availability Statement
Data are contained within the article.
Acknowledgments
The authors gratefully acknowledge the College of Engineering and Mines, Department of Energy Engineering at University of North Dakota for motivation to publish this manuscript.
Conflicts of Interest
Author Maharshi Dey was employed by the company UbiQD Inc., and Author Nabil Halwany was employed by the company Huawei Technologies. The remaining authors declare that the research was conducted in the absence of any commercial or financial relationships that could be construed as a potential conflict of interest.
Nomenclature
| AC | Alternative current |
| ANN | Artificial neural network |
| ASC | Annualized system cost |
| BMG | Biomass Gasifier |
| CHP | Combine heat and power |
| CSA | Cuckoo search algorithm |
| CUF | Capacity utilization factor |
| CV | Calorific value |
| DC | Direct current |
| DPP | Deficit power probability |
| EEF | Excess energy fraction |
| FA | Firefly algorithm |
| FC | Fuel cell |
| GA | Genetic algorithm |
| GHG | Green House Gas |
| GWO | gray wolf optimizer |
| HDI | Human development index |
| HOMER | Hybrid optimization of multiple energy resources |
| HRES | Hybrid renewable energy system |
| INSEL | Integrated simulation environment language |
| JCF | Job creation factor |
| LCOE | Levelized cost of energy |
| LOLE | Loss of load expected |
| LPSP | Loss of power supply probability |
| MCDM | Multi-criteria decision-making |
| NPC | Net present cost |
| NPV | Net Present Value |
| PSO | Particle Swarm Optimization |
| PV | Photovoltaic |
| RAPSIM | Renewable alternative power system simulation |
| REF | Renewable energy fraction |
| REMS | Rule-based energy management strategy |
| SA | Simulated annealing |
| SHO | Spotted hyena optimization |
| SOC | State of charge |
| TEL | Total energy loss |
| TNPC | Total Net Present Cost |
| TRNSYS | Transient system simulation software |
| WOA | Whale optimization algorithm |
| WT | Wind turbine |
References
- Alhumaid, A.; Khan, K.; Alismail, F.; Khalid, M. Multi-Input Nonlinear Programming Based Deterministic Optimization Framework for Evaluating Microgrids with Optimal Renewable-Storage Energy Mix. Sustainability 2021, 13, 5878. [Google Scholar] [CrossRef]
- Martínez-Díaz, J.; Villafáfila-Robles, R.; Montesinos-Miracle, D.; Sudrià-Andreu, A. Study of optimization design criteria for stand-alone hybrid renewable power systems. Renew. Energy Power Qual. J. 2024, 11, 1266–1270. [Google Scholar] [CrossRef]
- Ammari, C.; Belatrache, D.; Touhami, B.; Makhloufi, S. Sizing, optimization, control and energy management of hybrid renewable energy system—A review. Energy Built Environ. 2022, 3, 399–411. [Google Scholar] [CrossRef]
- Khan, A.A.; Minai, A.F.; Pachauri, R.K.; Malik, H. Optimal Sizing, control, and Management Strategies for Hybrid Renewable Energy Systems: A Comprehensive Review. Energies 2022, 15, 6249. [Google Scholar] [CrossRef]
- Modu, B.; Abdullah, P.; Bukar, A.L.; Hamza, M.F.A. Systematic review of hybrid renewable energy systems with hydrogen storage: Sizing, optimization, and energy management strategy. Int. J. Hydrogen Energy 2023, 48, 38354–38373. [Google Scholar] [CrossRef]
- Bade, S.O.; Meenakshisundaram, A.; Tomomewo, O.S. Current Status, Sizing Methodologies, Optimization Techniques, and Energy Management and Control Strategies for Co-Located Utility-Scale Wind–Solar-Based Hybrid Power Plants: A Review. Energies 2024, 5, 677–719. [Google Scholar] [CrossRef]
- Babatunde, A.; Munda, J.L.; Hamam, Y. Selection of a Hybrid Renewable Energy Systems for a Low-Income Household. Sustainability 2019, 11, 4282. [Google Scholar] [CrossRef]
- Boujdaini, L.E.; Mezrhab, A.; Moussaoui, M.A.; Jurado, F.; Vera, D. Sizing of a stand-alone PV–wind–battery–diesel hybrid energy system and optimal combination using a particle swarm optimization algorithm. Electr. Eng. 2022, 104, 3339–3359. [Google Scholar] [CrossRef]
- Li, G.; Yuan, B.; Ge, M.; Xiao, G.; Li, T.; Wang, J. Capacity configuration optimization of a hybrid renewable energy system with hydrogen storage. Int. J. Green Energy 2022, 19, 1583–1599. [Google Scholar] [CrossRef]
- Charfi, S.; Atieh, A.; Chaabene, M. Optimal sizing of a hybrid solar energy system using particle swarm optimization algorithm based on cost and pollution criteria. Environ. Prog. Sustain. Energy 2018, 38, 13055. [Google Scholar] [CrossRef]
- Hamza, E.; Jalal, S.; Faysal, Y.M.; Hamid, G. Optimization and Management of Hybrid Renewable Energy System Using PSO Algorithm: Data Center Application; IEEE: New York, NY, USA, 2024; pp. 1–5. [Google Scholar] [CrossRef]
- Medghalchi, Z.; Taylan, O. A novel hybrid optimization framework for sizing renewable energy systems integrated with energy storage systems with solar photovoltaics, wind, battery and electrolyzer-fuel cell. Energy Convers. Manag. 2023, 294, 117594. [Google Scholar] [CrossRef]
- Bismark, K.M.K.C.; Caballa, L.G.C.; Yap, C.M.F.; Peña, R.a.S.; Parocha, R.C.; Macabebe, E.Q.B. Optimization of a hybrid renewable energy system for a rural community using PSO. IOP Conf. Ser. Earth Environ. Sci. 2023, 1199, 012034. [Google Scholar] [CrossRef]
- Iweh, C.D.; Akupan, E.R. Control and optimization of a hybrid solar PV—Hydro power system for off-grid applications using particle swarm optimization (PSO) and differential evolution (DE). Energy Rep. 2023, 10, 4253–4270. [Google Scholar] [CrossRef]
- Zhang, J.; Cho, H.; Mago, P.J.; Zhang, H.; Yang, F. Multi-Objective Particle Swarm Optimization (MOPSO) for a Distributed Energy System Integrated with Energy Storage. J. Therm. Sci. 2019, 28, 1221–1235. [Google Scholar] [CrossRef]
- Zhang, G.; Wang, W.; Du, J.; Liu, H. A Multiobjective Optimal Operation of a Stand-Alone Microgrid Using SAPSO Algorithm. J. Electr. Comput. Eng. 2020, 2020, 6042105. [Google Scholar] [CrossRef]
- Güven, A.F.; Yörükeren, N.; Tag-Eldin, E.; Samy, M.M. Multi-Objective Optimization of an Islanded Green Energy System Utilizing Sophisticated Hybrid Metaheuristic Approach. IEEE Access 2023, 11, 103044–103068. [Google Scholar] [CrossRef]
- Ukoima, K.N.; Okoro, O.I.; Obi, P.I.; Akuru, U.B.; Davidson, I.E. Optimal sizing, energy balance, load management and performance analysis of a hybrid renewable energy system. Energies 2024, 17, 5275. [Google Scholar] [CrossRef]
- Eriksson, E.; Gray, E. Optimization of renewable hybrid energy systems—A multi-objective approach. Renew. Energy 2019, 133, 971–999. [Google Scholar] [CrossRef]
- Verma, R.; Bhatia, R.; Raghuwanshi, S.S. Optimization and performance enhancement of renewable energy microgrid energy system using pheasant bird optimization algorithm. Sustain. Energy Technol. Assess. 2024, 66, 103801. [Google Scholar] [CrossRef]
- Yahiaoui, A.; Tlemçani, A. An efficient study of pv/wind/battery/electrolyzer/h2-tank/fc for a remote area electrification. Rev. Roum. Des Sci. Tech. Série Électrotechnique Et Énergétique 2024, 69, 129–134. [Google Scholar] [CrossRef]
- Xie, X.; Xiong, H.; Gao, C.; Hu, S. Microgrid Economic and Environmental Cost Optimization Scheduling Based on MO-PSO. IEEE 2024, 30, 1009–1014. [Google Scholar] [CrossRef]
- Parvin, M.; Yousefi, H.; Noorollahi, Y. Techno-economic optimization of a renewable micro grid using multi-objective particle swarm optimization algorithm. Energy Convers. Manag. 2023, 277, 116639. [Google Scholar] [CrossRef]
- Saravanan, S.G.D.; Ramya, G.; Hariprasad, N.; Gomathy, S.; Maranan, R. A comparative analysis of Meta-Heuristic algorithms for optimal configuration of hybrid renewable energy systems for remote villages. In Metaheuristics Algorithm and Optimization of Engineering and Complex Systems; Advances in Systems Analysis, Software Engineering, and High Performance Computing Book Series; IGI Global: Hershey, PA, USA, 2024; pp. 143–167. [Google Scholar] [CrossRef]
- Bakhtiari, H.; Naghizadeh, R.A. Multi-criteria optimal sizing of hybrid renewable energy systems including wind, photovoltaic, battery, and hydrogen storage with ɛ-constraint method. IET Renew. Power Gener. 2018, 12, 883–892. [Google Scholar] [CrossRef]
- Menesy, A.S.; Sultan, H.M.; Habiballah, I.O.; Masrur, H.; Khan, K.R.; Khalid, M. Optimal configuration of a hybrid Photovoltaic/Wind Turbine/Biomass/Hydro-Pumped Storage-Based energy system using a Heap-Based optimization algorithm. Energies 2023, 16, 3648. [Google Scholar] [CrossRef]
- Alshammari, N.; Asumadu, J. Optimum unit sizing of hybrid renewable energy system utilizing harmony search, jaya and particle swarm optimization algorithms. Sustain. Cities Soc. 2020, 60, 102255. [Google Scholar] [CrossRef]
- Wali, S.B.; Hannan, M.A.; Ker, P.J.; Kiong, T.S. Optimal Sizing of PV-Battery Based Hybrid Renewable System Using Particle Swarm Optimization for Economic Sustainability; IEEE: New York, NY, USA, 2023; pp. 1–6. [Google Scholar] [CrossRef]
- Nassef, A.M.; Abdelkareem, M.A.; Maghrabie, H.M.; Baroutaji, A. Review of metaheuristic optimization algorithms for power systems problems. Sustainability 2023, 15, 9434. [Google Scholar] [CrossRef]
- Bade, S.O.; Tomomewo, O.S. Optimizing a Hybrid Wind-Solar-Biomass System with Battery and Hydrogen Storage Using Generic Algorithm-Particle Swarm Optimization for Performance Assessment. Clean. Energy Syst. 2024, 9, 100157. [Google Scholar] [CrossRef]
- Gupta, M.; Bhargava, A. Optimal design of hybrid renewable-energy microgrid system: A techno–economic–environment–social–reliability perspective. Clean Energy 2024, 8, 66–83. [Google Scholar] [CrossRef]
- Shams, S.A.; Ahmadi, R. Dynamic optimization of solar-wind hybrid system connected to electrical battery or hydrogen as an energy storage system. Int. J. Energy Res. 2021, 45, 10630–10654. [Google Scholar] [CrossRef]
- Sun, H.; Ebadi, A.G.; Toughani, M.; Nowdeh, S.A.; Naderipour, A.; Abdullah, A. Designing framework of hybrid photovoltaic-biowaste energy system with hydrogen storage considering economic and technical indices using whale optimization algorithm. Energy 2022, 238, 121555. [Google Scholar] [CrossRef]
- Cheraghi, R.; Jahangir, M.H. Multi-objective optimization of a hybrid renewable energy system supplying a residential building using NSGA-II and MOPSO algorithms. Energy Convers. Manag. 2023, 294, 117515. [Google Scholar] [CrossRef]
- Pariz, M.C.; Carvalho CM, F.; Rebelo PC, A.; Colmenero, J.C. Treatment of the uncertainties in prioritization of information technology projects: A hybrid multicriteria approach. J. Multi Criteria Decis. Anal. 2022, 29, 327–340. [Google Scholar] [CrossRef]
- Ding, W.; Ji, Y.; Liao, H.; Fang, D. A multiobjective discrete combination optimization method for dynamics design of engineering structures. Int. J. Mech. Syst. Dyn. 2022, 2, 108–116. [Google Scholar] [CrossRef]
- Roy, D.; Bhowmik, M.; Roskilly, A.P. Technoeconomic, environmental and multi criteria decision making investigations for optimisation of off-grid hybrid renewable energy system with green hydrogen production. J. Clean. Prod. 2024, 443, 141033. [Google Scholar] [CrossRef]
- Amoussou, I.; Tanyi, E.; Ali, A.; Agajie, T.F.; Khan, B.; Ballester, J.B.; Nsanyuy, W.B. Optimal Modeling and Feasibility Analysis of Grid-Interfaced Solar PV/Wind/Pumped Hydro Energy Storage Based Hybrid System. Sustainability 2023, 15, 1222. [Google Scholar] [CrossRef]
- Nishanth, J.R.; Deshmukh, M.A.; Kushwah, R.; Kushwaha, K.K.; Balaji, S.; Sampath, B. Particle swarm optimization of hybrid renewable energy systems. In Intelligent Engineering Applications and Applied Sciences for Sustainability; Advances in Civil and Industrial Engineering Book Series; IGI Global: Hershey, PA, USA, 2023; pp. 291–308. [Google Scholar] [CrossRef]
- Ahmadi, R.; Pourfatemi, S.M.; Ghaffari, S. Exergoeconomic optimization of hybrid system of GT, SOFC and MED implementing genetic algorithm. Desalination 2017, 411, 76–88. [Google Scholar] [CrossRef]
- Sharma, D.; Gaur, P.; Mittal, A.P. Comparative Analysis of Hybrid GAPSO Optimization Technique With GA and PSO Methods for Cost Optimization of an Off-Grid Hybrid Energy System. Energy Technol. Policy 2014, 1, 106–114. [Google Scholar] [CrossRef]
- Zebra EI, C.; Van Der Windt, H.J.; Nhumaio, G.; Faaij, A.P. A review of hybrid renewable energy systems in mini-grids for off-grid electrification in developing countries. Renew. Sustain. Energy Rev. 2021, 144, 111036. [Google Scholar] [CrossRef]
- JRC Photovoltaic Geographical Information System (PVGIS)—European Commission. 2024. Available online: https://re.jrc.ec.europa.eu/pvg_tools/en/#HR (accessed on 11 November 2024).
- Acakpovi, A.; Adjei, P.; Nwulu, N.; Asabere, N.Y. Optimal Hybrid Renewable Energy System: A Comparative Study of Wind/Hydrogen/Fuel-Cell and Wind/Battery Storage. J. Electr. Comput. Eng. 2020, 2020, 1756503. [Google Scholar] [CrossRef]
- Modu, B.; Abdullah, M.P.; Alkassem, A.; Hamza, M.F. Optimal rule-based energy management and sizing of a grid-connected renewable energy microgrid with hybrid storage using levy flight algorithm. Energy Nexus 2024, 16, 100333. [Google Scholar] [CrossRef]
Disclaimer/Publisher’s Note: The statements, opinions and data contained in all publications are solely those of the individual author(s) and contributor(s) and not of MDPI and/or the editor(s). MDPI and/or the editor(s) disclaim responsibility for any injury to people or property resulting from any ideas, methods, instructions or products referred to in the content. |
© 2025 by the authors. Licensee MDPI, Basel, Switzerland. This article is an open access article distributed under the terms and conditions of the Creative Commons Attribution (CC BY) license (https://creativecommons.org/licenses/by/4.0/).