
Multi-Criteria Optimization of a Hybrid Renewable Energy System Using Particle Swarm Optimization for Optimal Sizing and Performance Evaluation

 , , , , and
Abstract
1. Introduction
- Identify optimal performing HRES configuration using multi-criteria optimization that integrates BMG, PV, and WT resources with battery and H2 storage systems, utilizing advanced PSO.
- Determine the cost-effectiveness of maintaining reliability and sustainability.
- Assess the performance of the PSO algorithm in comparison to GA and GAPSO, focusing on solution quality, convergence speed, and computational efficiency.
- Perform sensitivity analysis on weighted parameters and its influences on the objective functions.
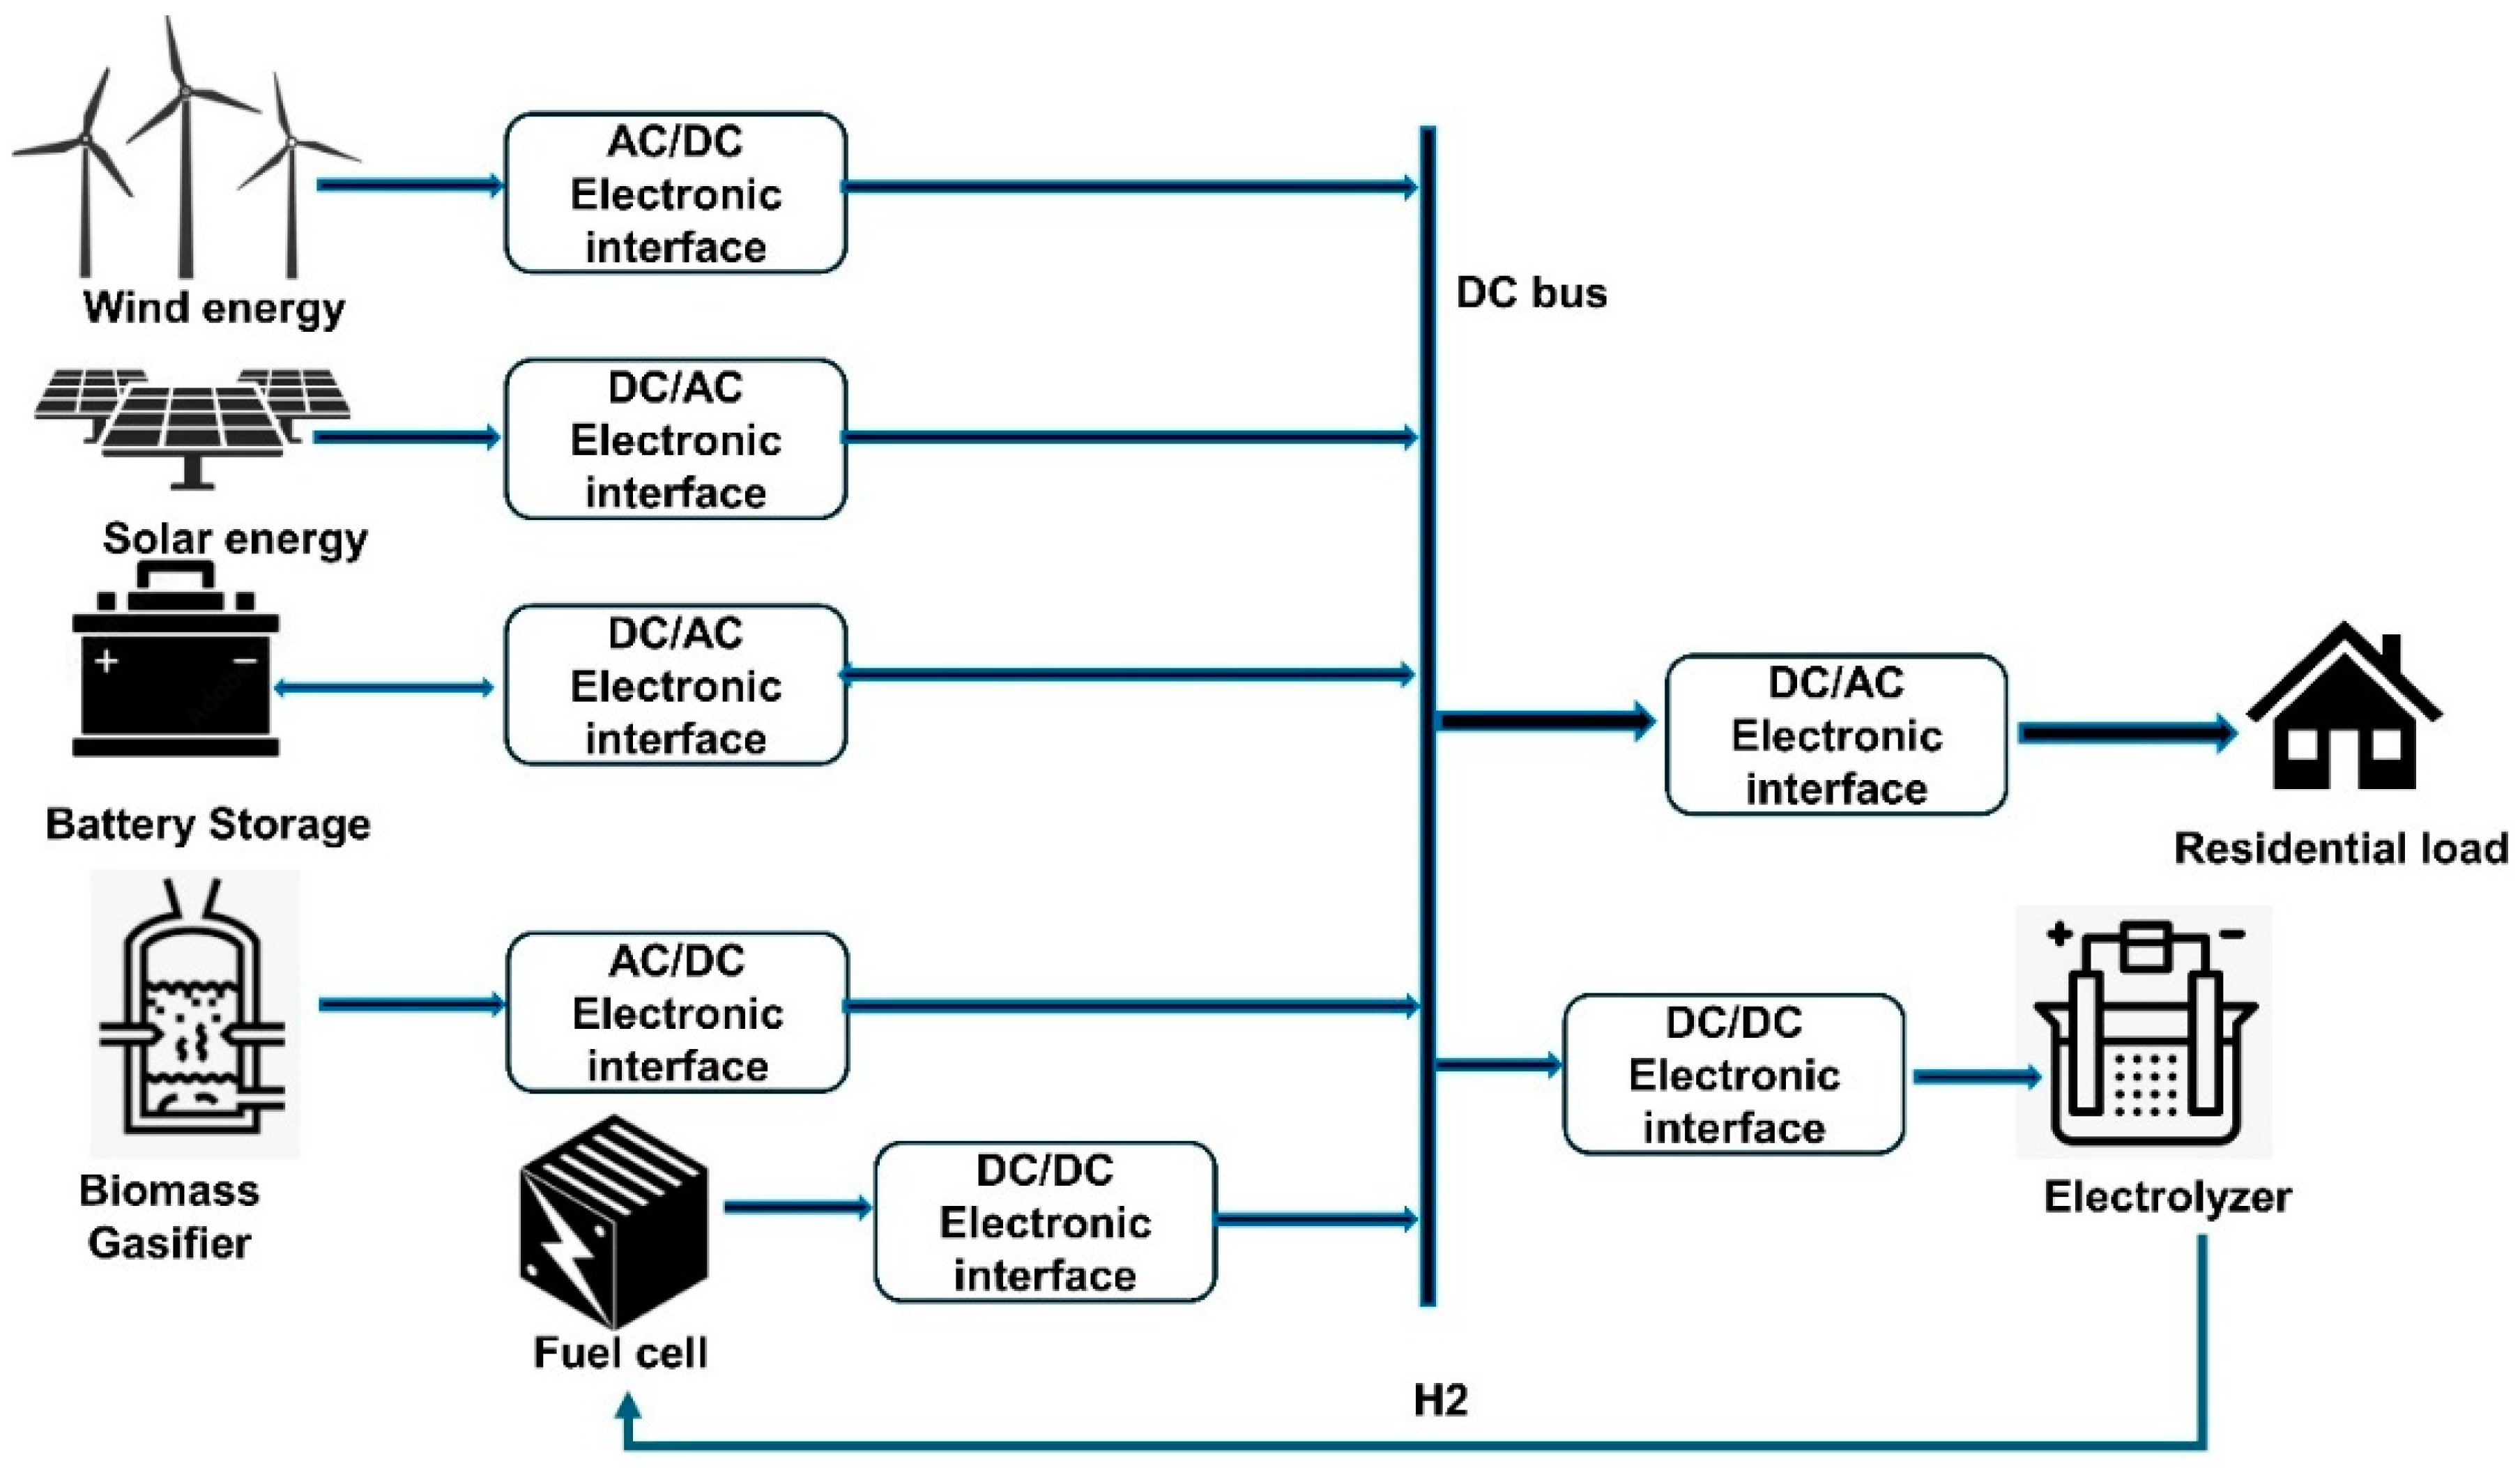
2. Hybrid Renewable Energy System Components Modeling
2.1. Wind Model
2.2. PV Model
2.3. Biomass Model
2.4. Battery Model
2.5. Electrolyzer and Fuel Cell Model
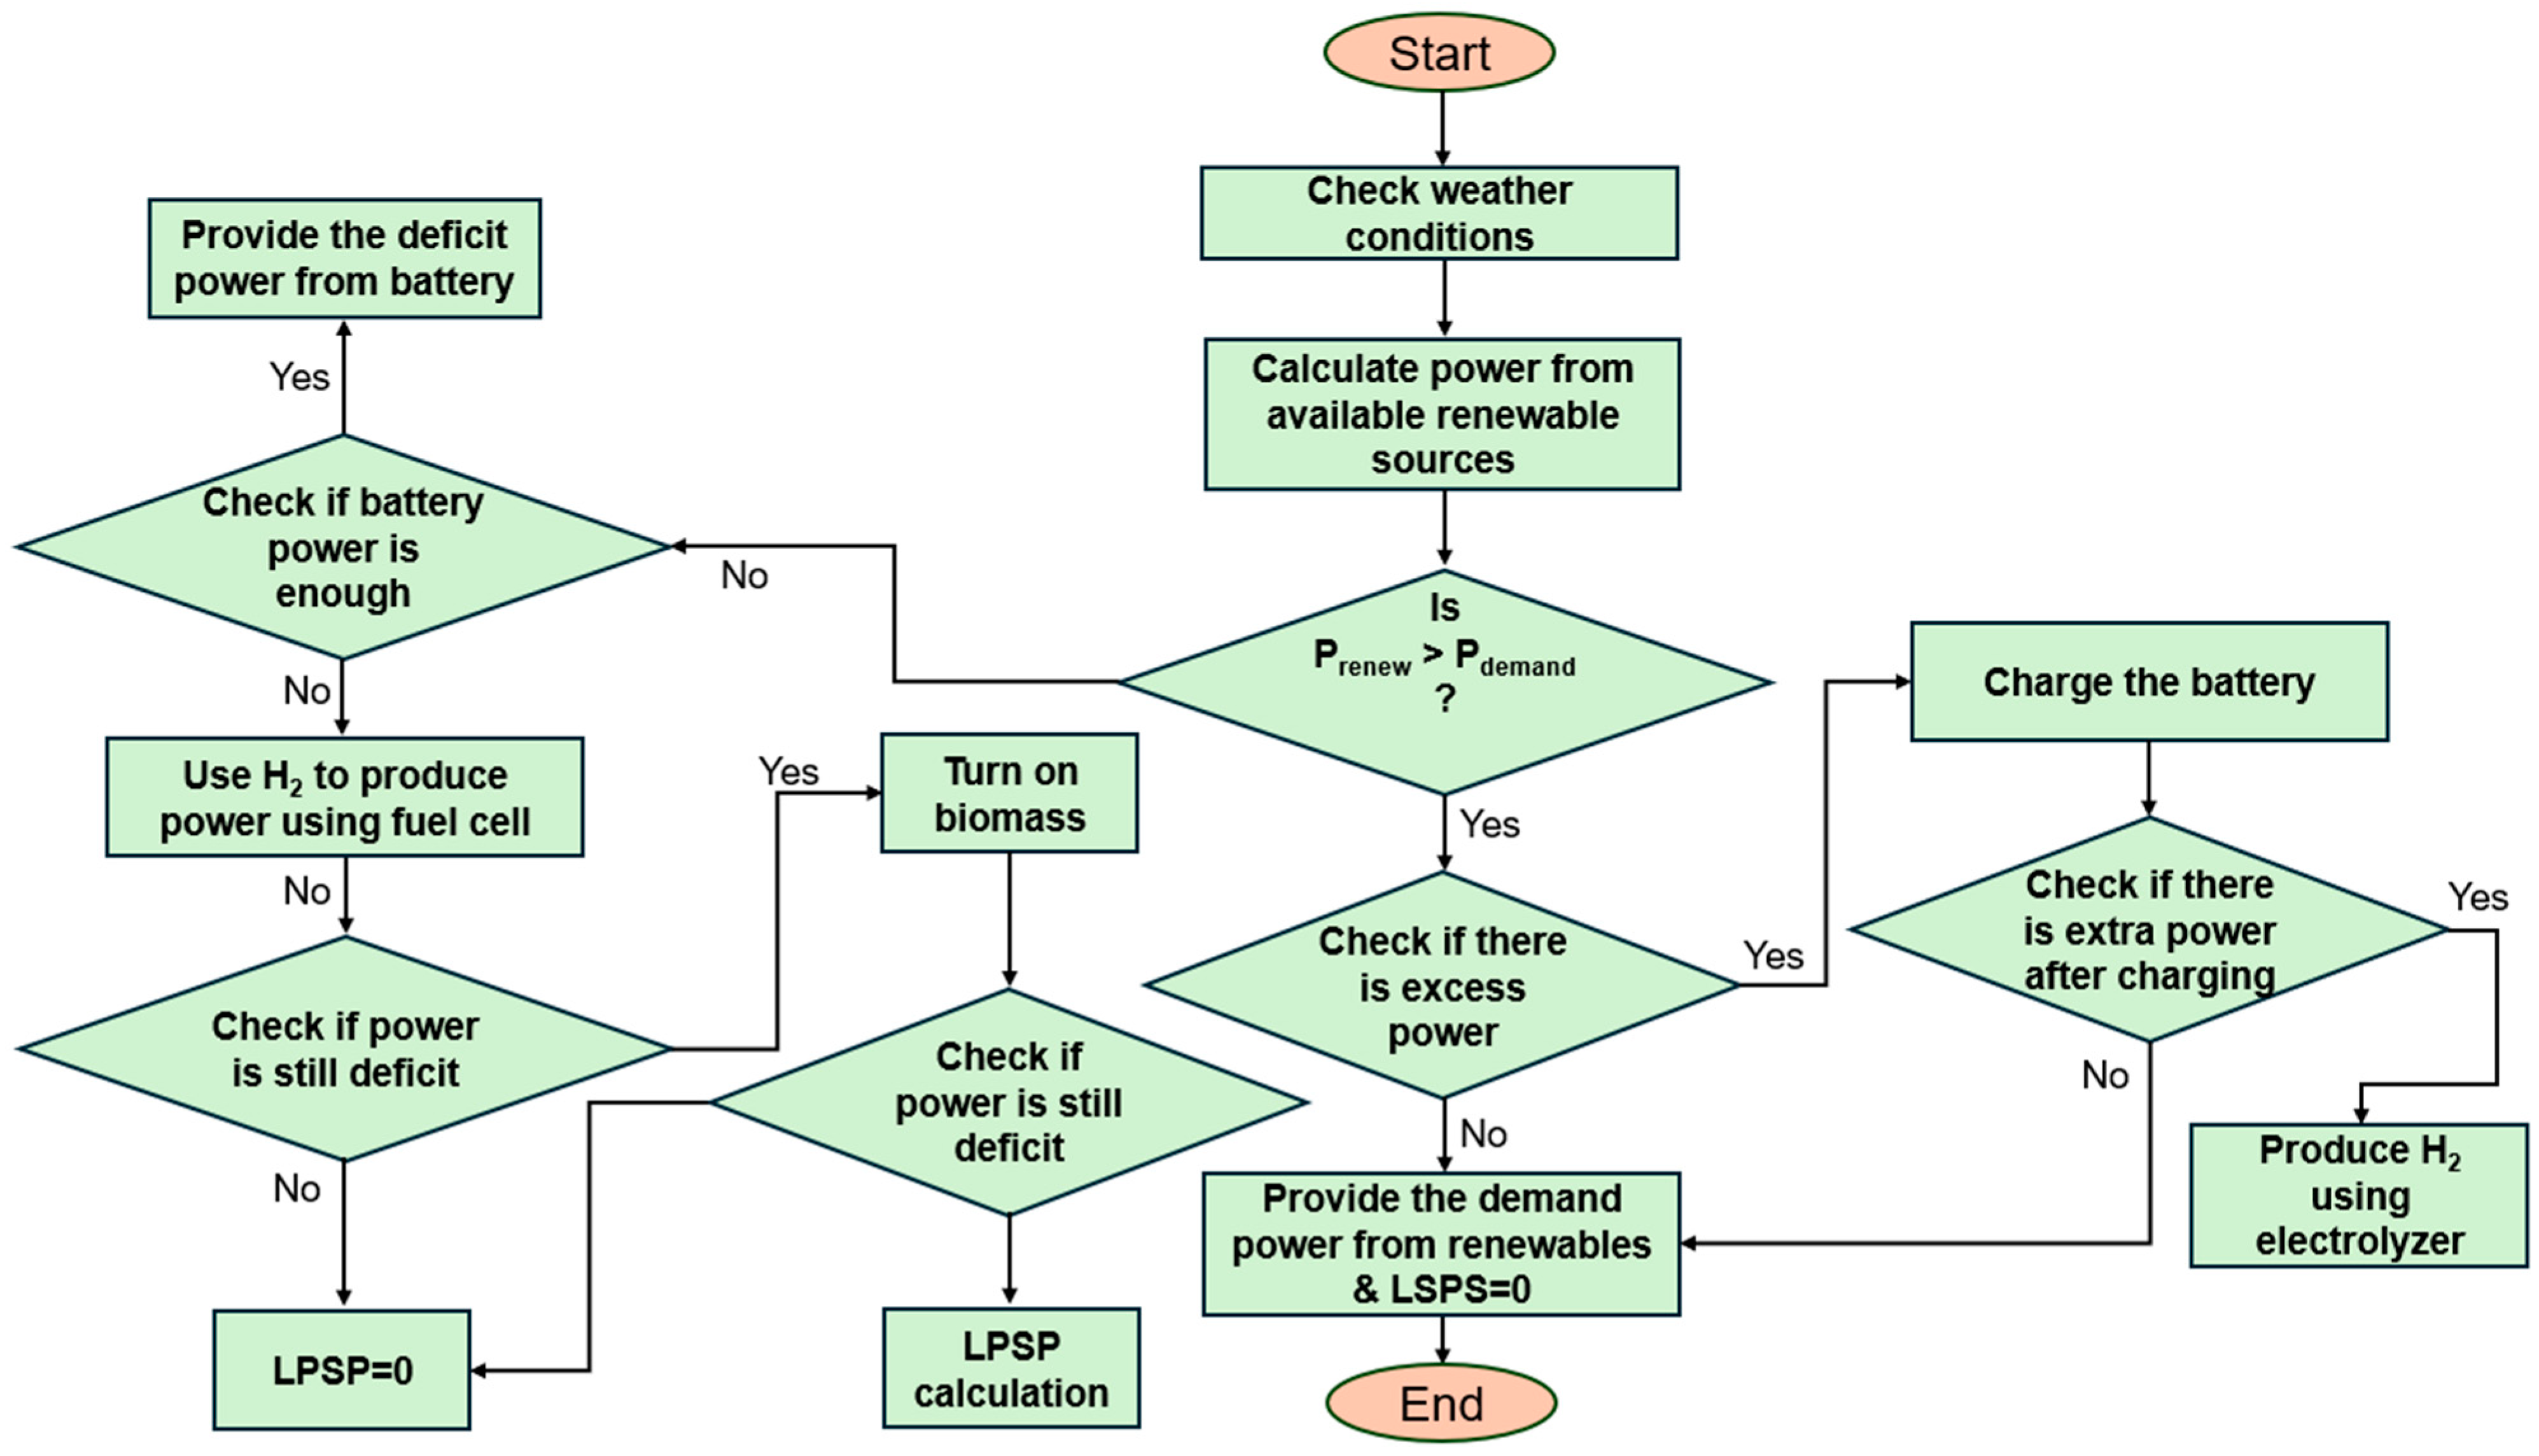
2.6. Energy Management Strategy
3. Optimization Problem Formulation
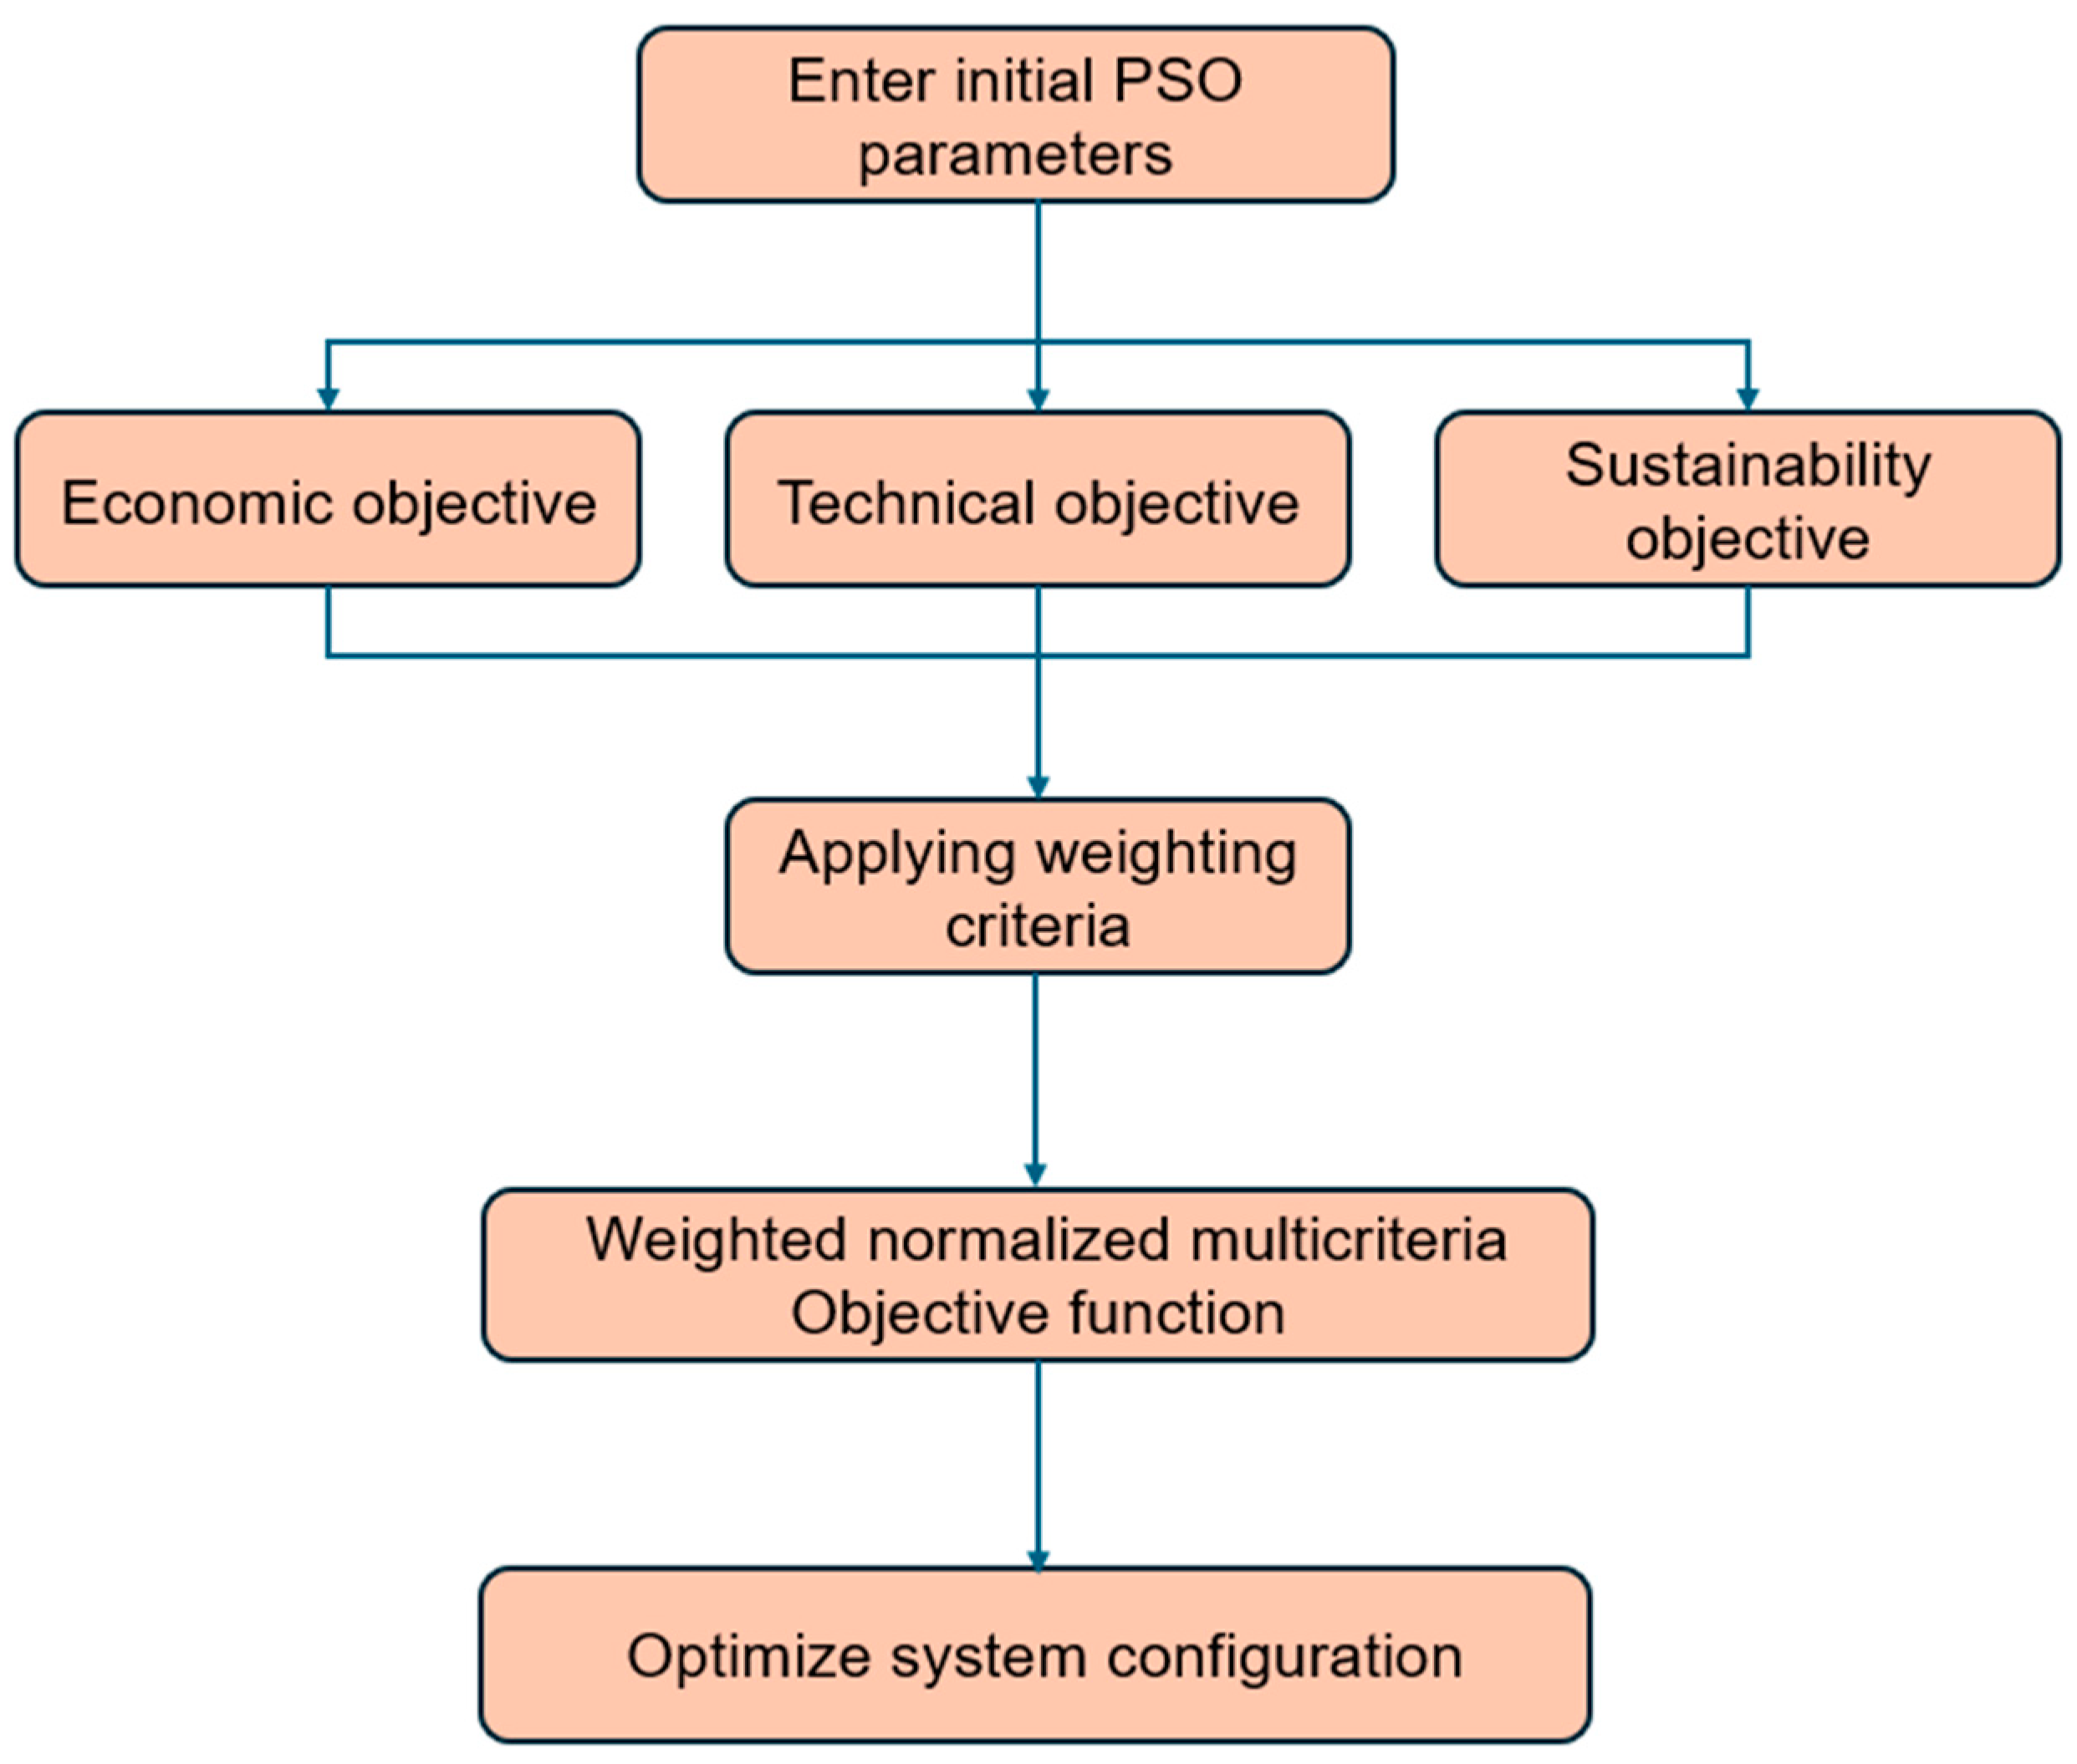
3.1. Multicriteria Optimization Function
3.2. Constraint
0 ≤ NWT ≤ NWT,max
0 ≤ NBM ≤ NBM,max
0 ≤ NB ≤ NB,max
0 ≤ NHT ≤ NHT,max
0 ≤ Nel ≤ Nel,max
Eb,min ≤ Eb ≤ Eb,max
PFCmin ≤ PFC ≤ PFCmax
SOCmin ≤ SOC ≤ SOCmax
LPSP ≤ 0.01
REF ≥ 0.60
3.3. Design Criteria
3.3.1. Annual System Cost
3.3.2. Loss of Power Supply Probability
3.3.3. Renewable Fraction
4. Optimization Methods
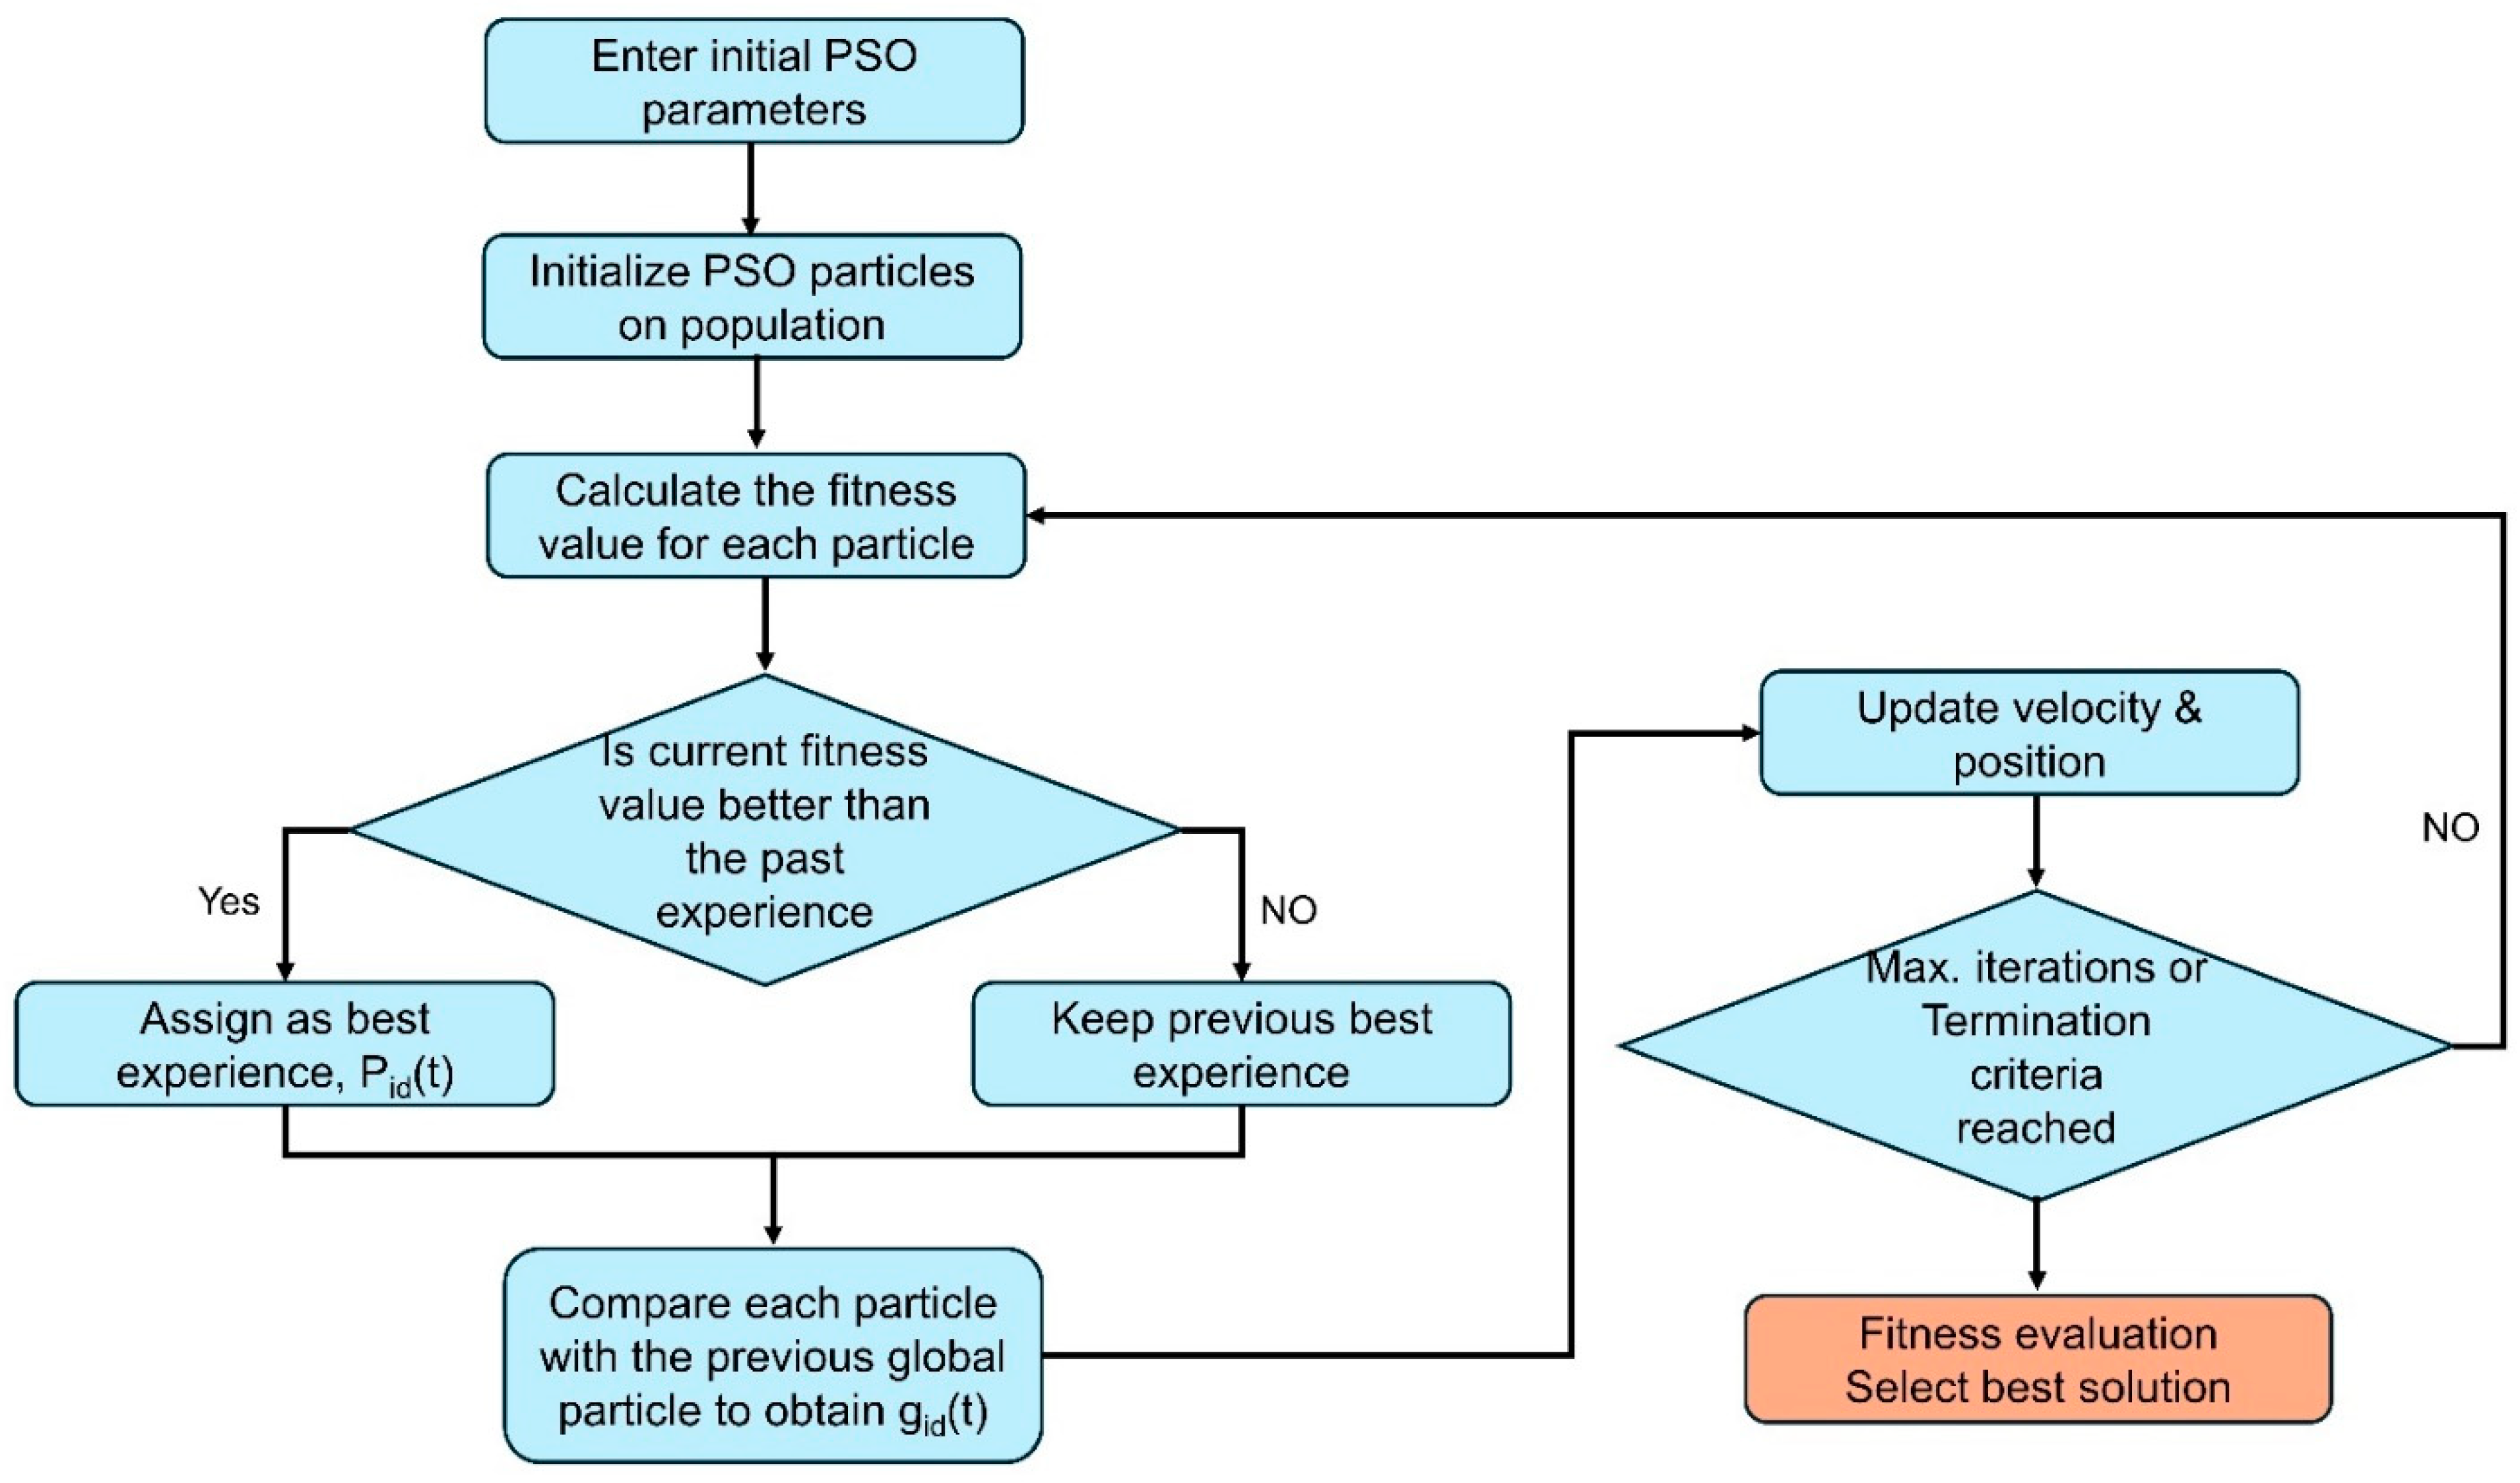
4.1. Particle Swarm Optimization
| Algorithm 1: Pesudocode for PSO algorithm |
| 1: For each particle 2: Initialize particle position and velocity 3: End For 4: Do 5: For each particle 6: Calculate fitness value 7: If the fitness value is better than the best fitness value pbest in history 8: Set current value as the new pbest 9: End 10: Choose the particle with the best fitness value of all the particles as gbest 11: For each particle 12: Calculate particle velocity according to the following equation: 13: 14: Update particle position according to the following equation: 15: 16: End 17: While maximum iterations or minimum error criteria is not attained |
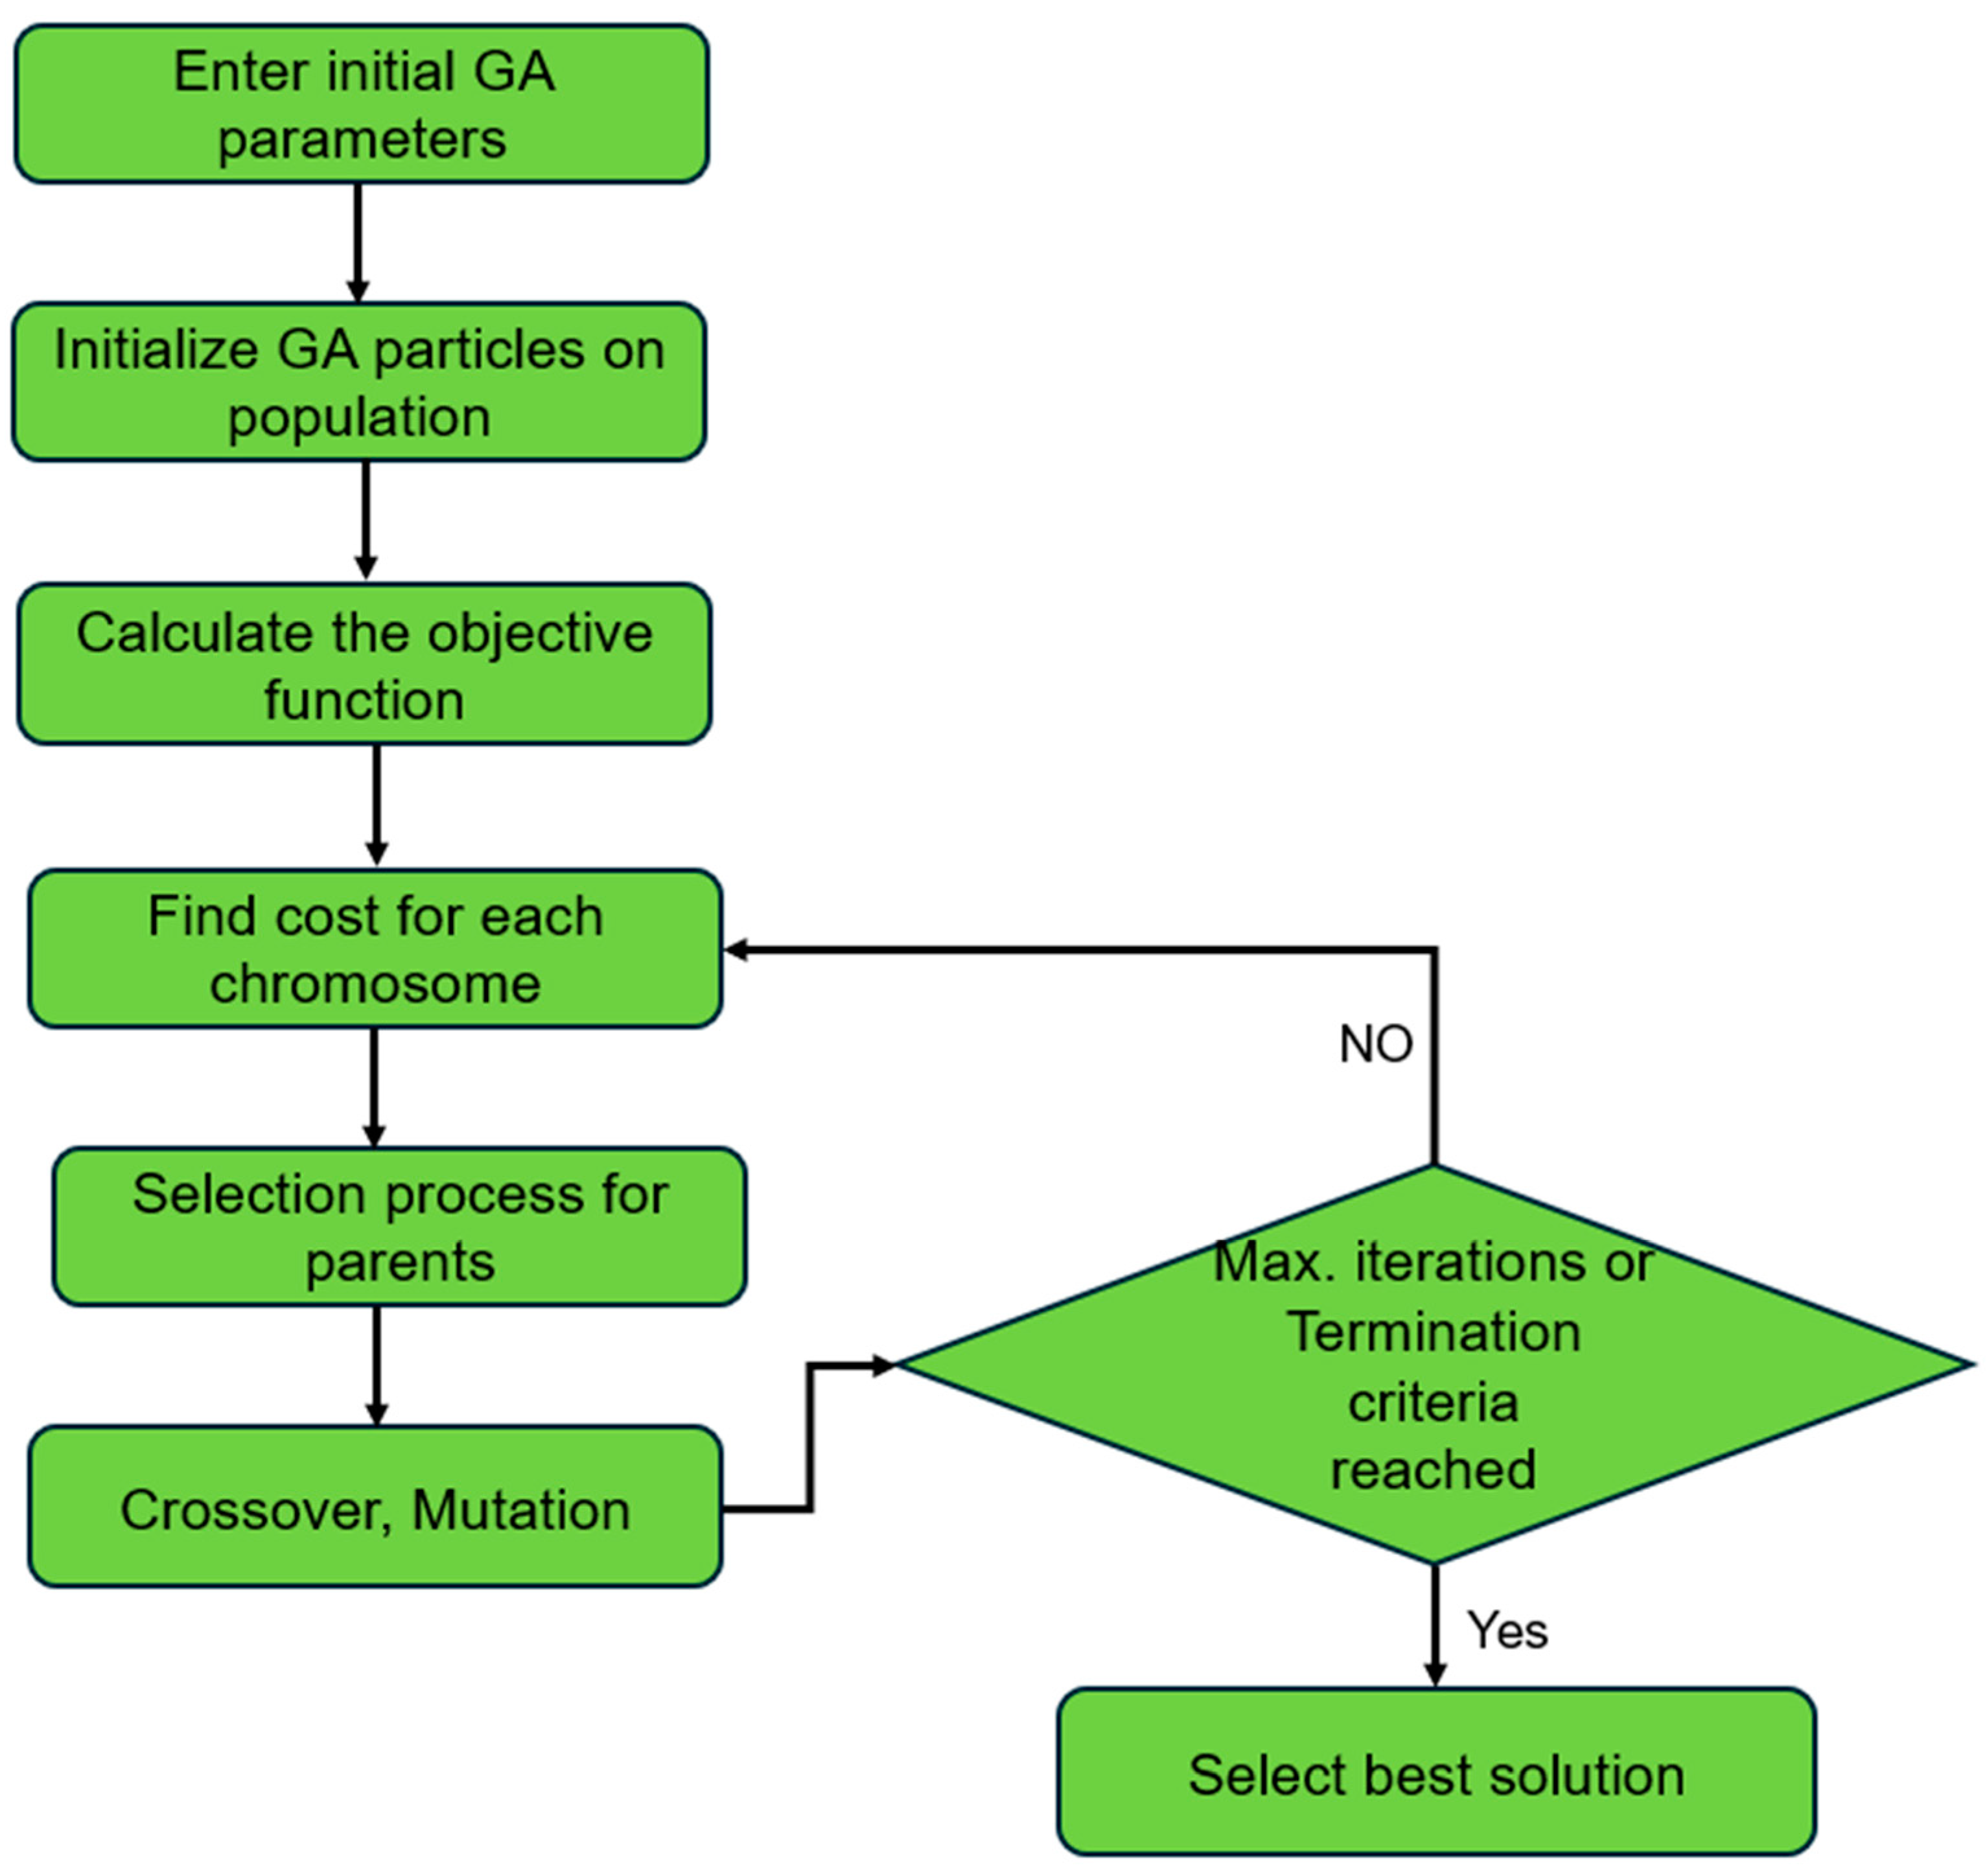
4.2. Generic Algorithm
| Algorithm 2: Pseudocode algorithm for GA |
| 1: Begin 2: Generate an initial population of chromosomes. 3: While termination conditions not met 4: For each chromosome in the population evaluate the fitness of the chromosome. 5: Select parents from the population based on fitness. 6: Perform the crossover to recombine parents and produce offspring. 7: Apply mutation to the offspring with a defined probability. 8: Replace the old population with the new offspring population. 9: End 10: Store the chromosome with the best fitness value. 11: End |
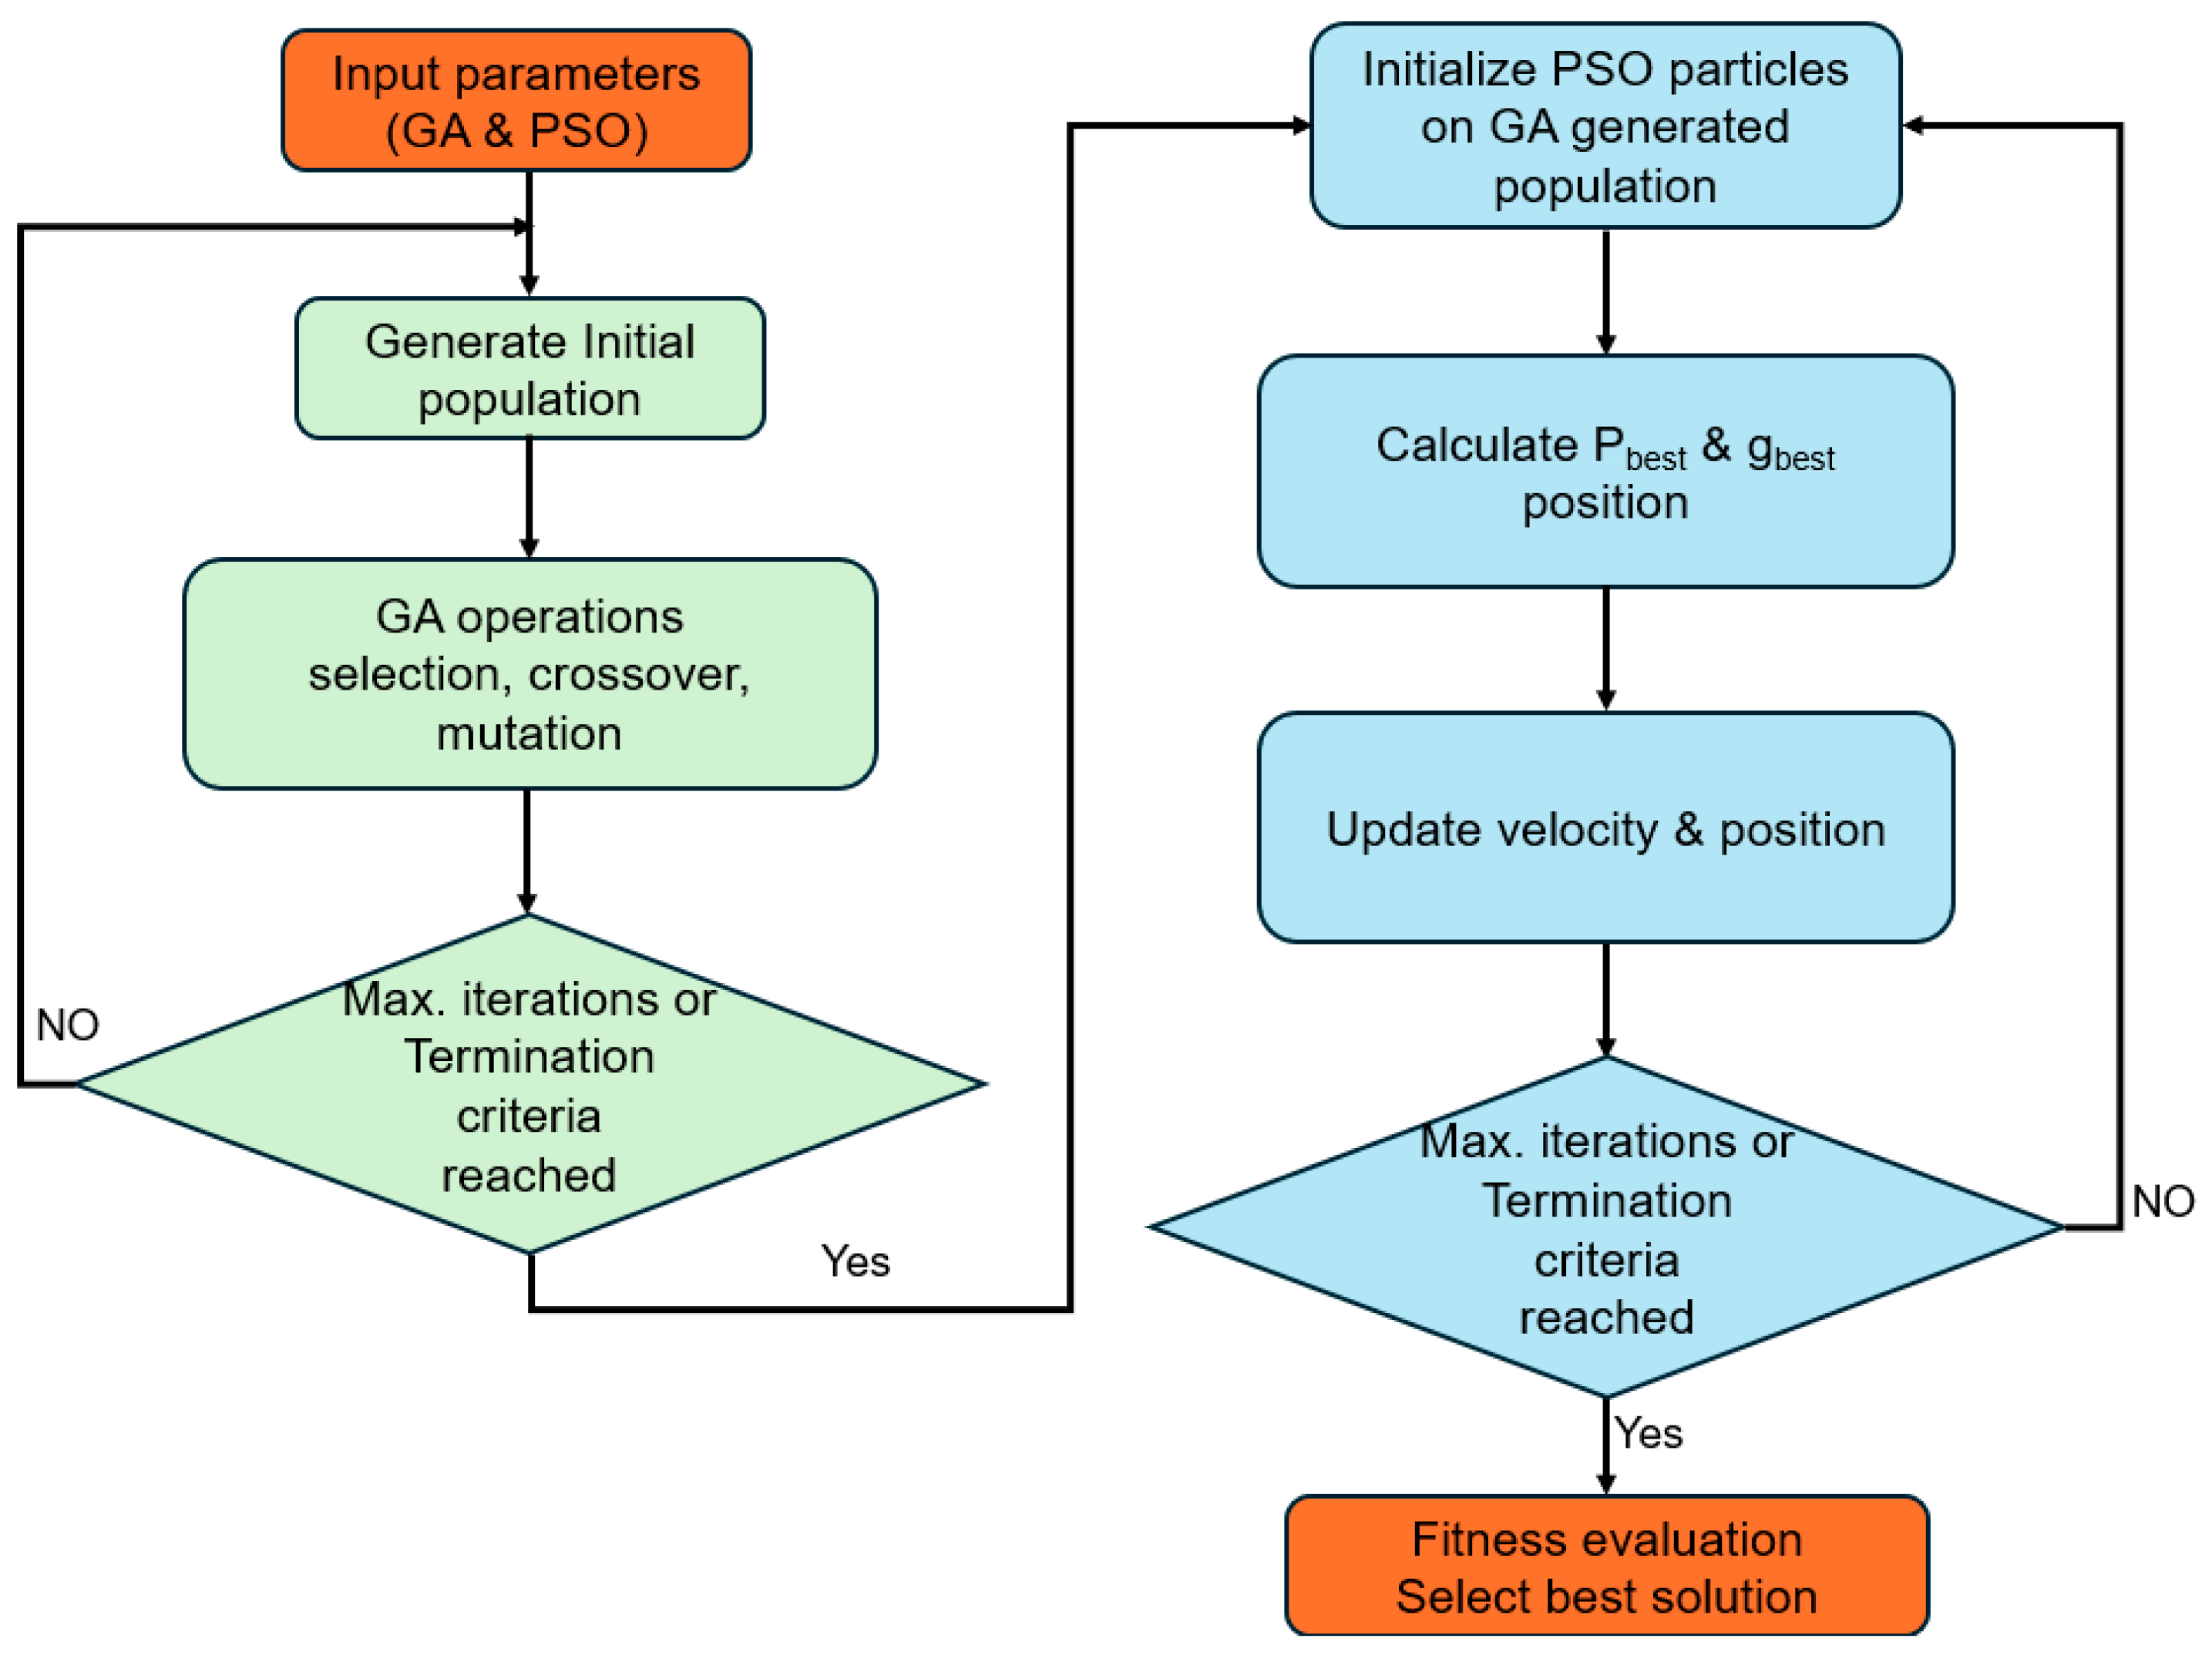
4.3. Hybrid Genetic Algorithm Particle Swarm Optimization
| Algorithm 3: Pseudocode algorithm for GAPSO |
| 1: Begin 2: Input parameters for GA and PSO (population size, crossover rate, mutation rate, inertia weight, cognitive and social coefficients, etc.). 3: Generate the initial population using GA. 4: While GA termination criteria (e.g., maximum iterations) not met: 5: Perform selection to choose parents based on fitness. 6: Apply crossover to generate offspring from selected parents. 7: Apply mutation to offspring with a given probability. 8: Replace the population with the new offspring. 9: End While 10: Initialize PSO particles based on the GA-generated population. 11: While PSO termination criteria (e.g., maximum iterations) not met: 12: For each particle: 13: Calculate fitness value 14: Update pbest if the current fitness is 15: Determine gbest across all particles 16: For each particle 17: Calculate particle velocity according to the following equation: 18: 19: Update particle position according to the following equation: 20: 21: End; 22: End For 23: End While 24: Select the best solution based on fitness evaluation. 25: End |
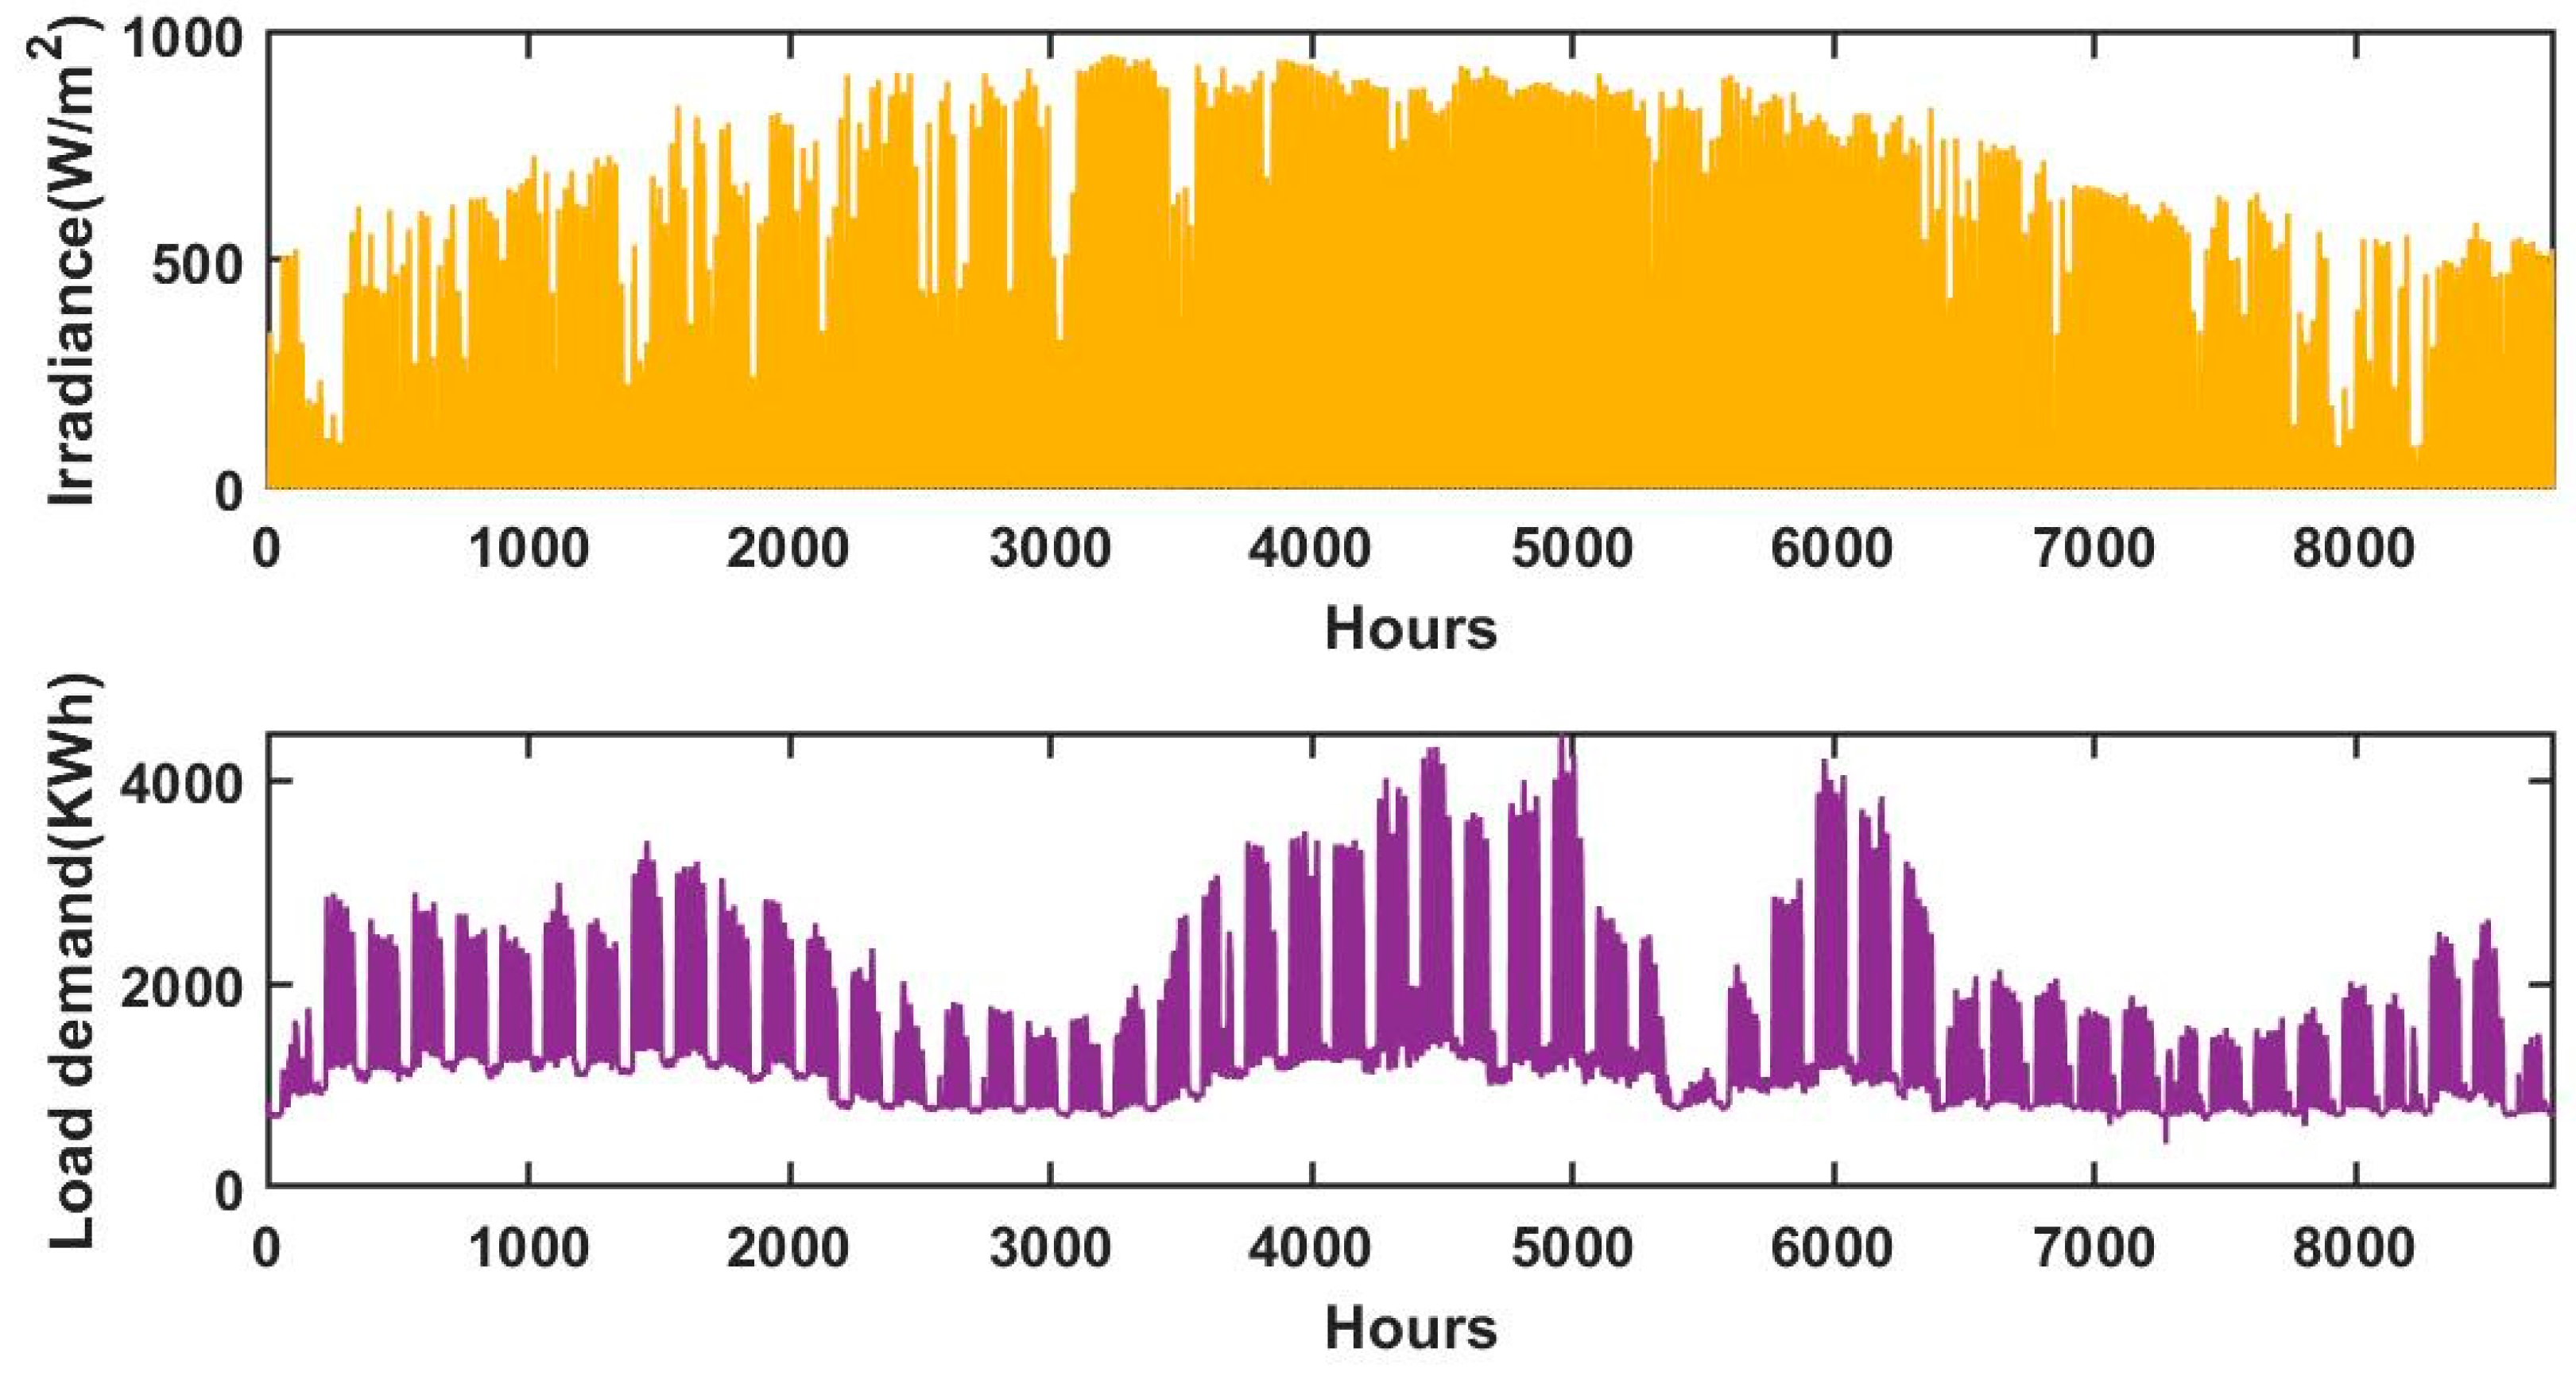
5. Case Study: Resource Assessment of the Study Area
6. Result and Discussion
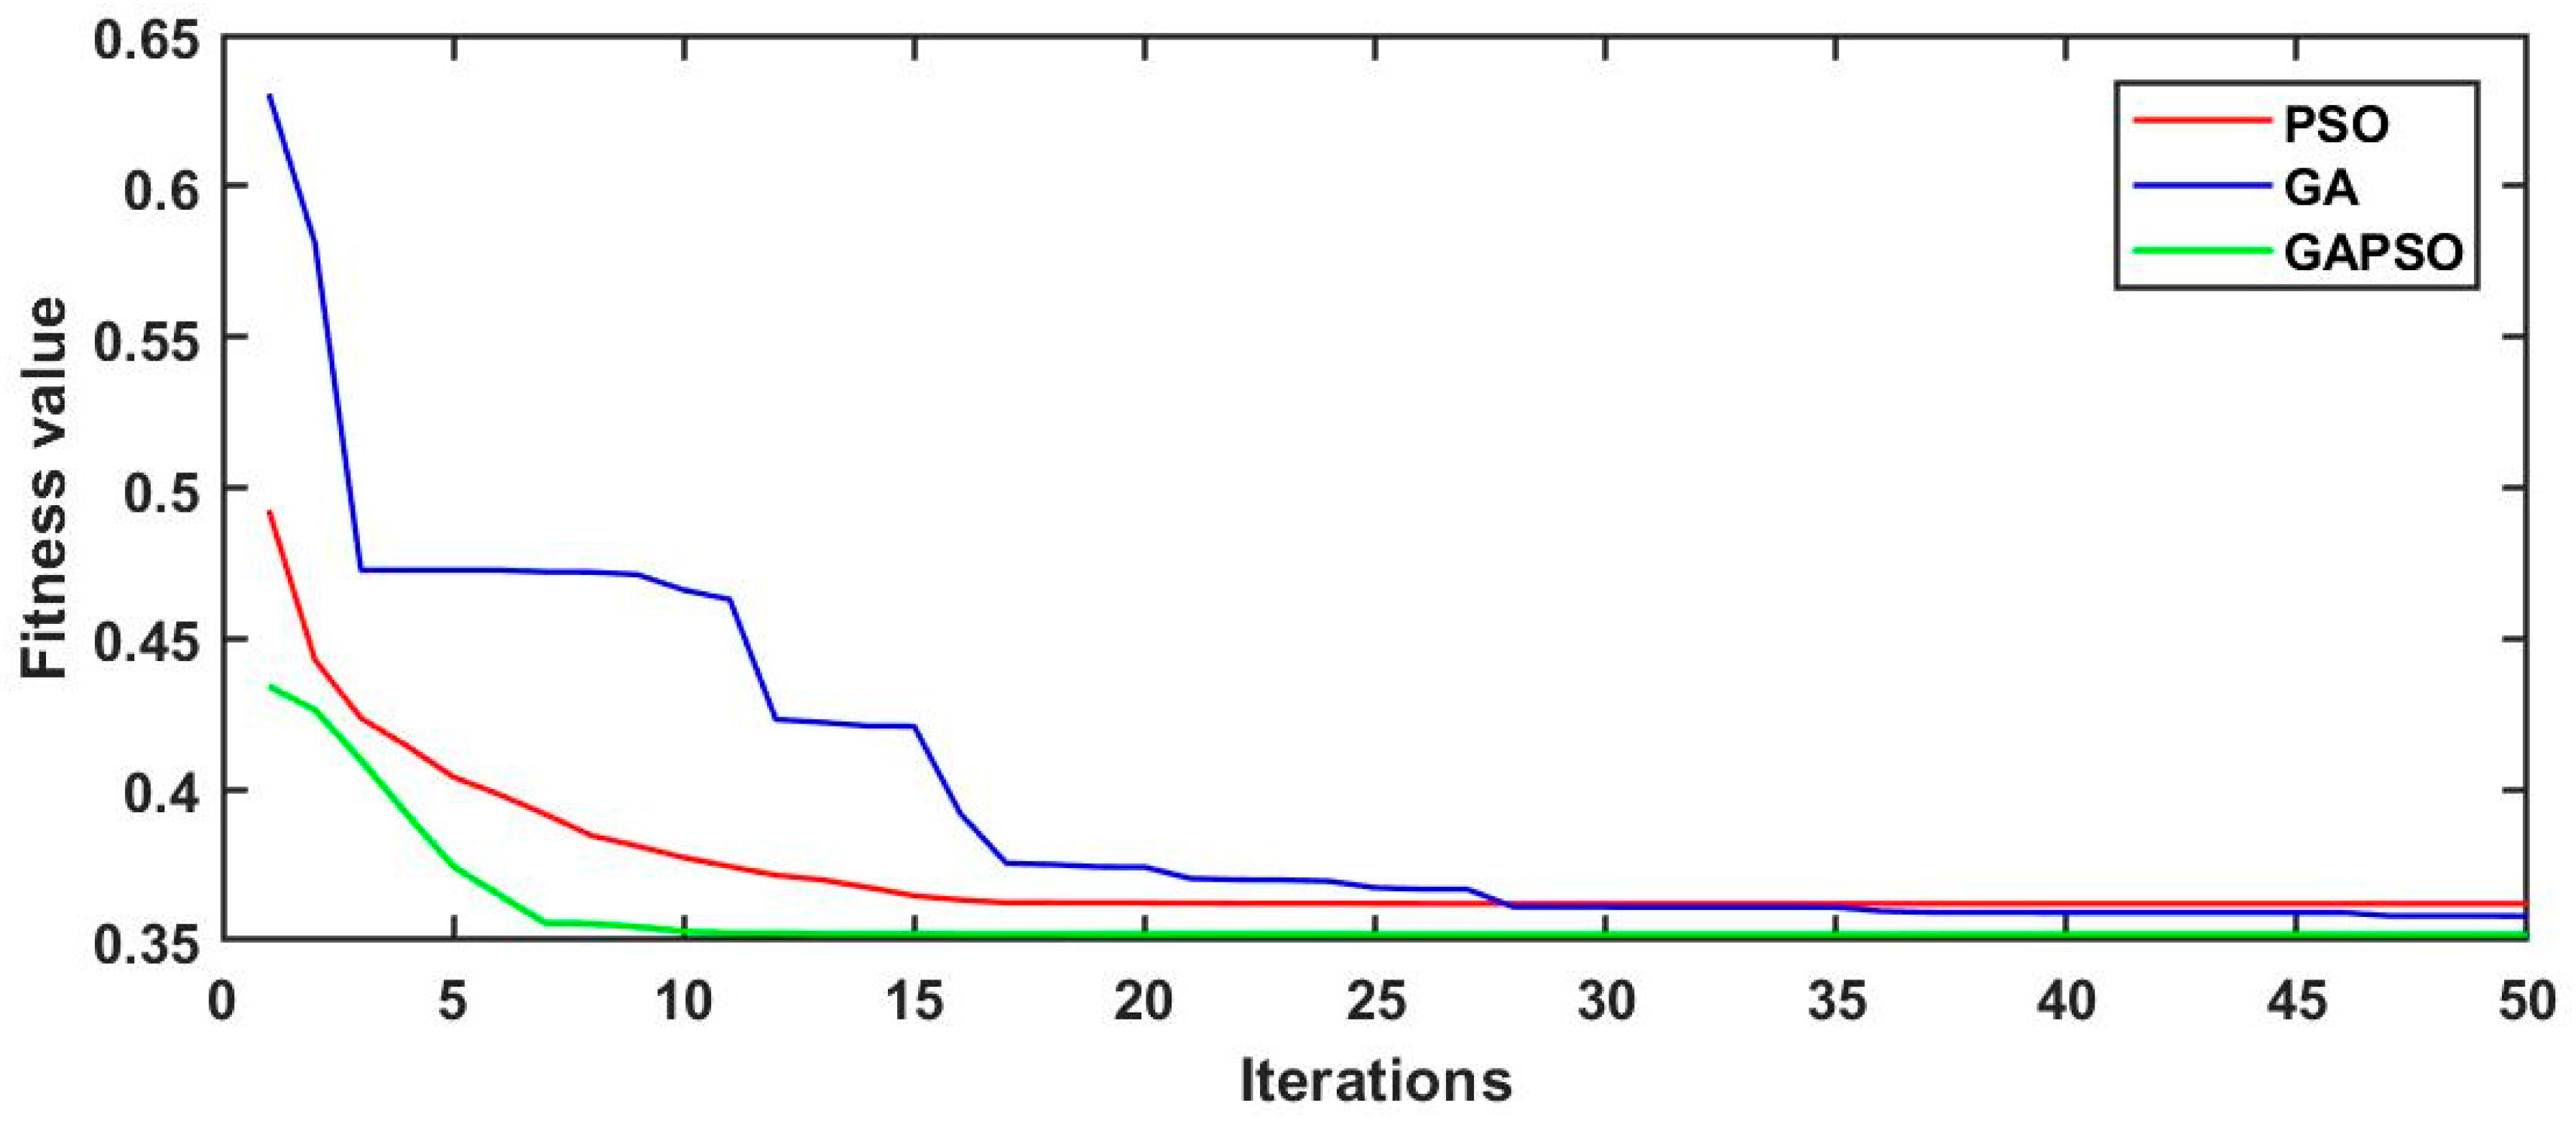
6.1. Optimization Performance
6.2. Sensitivity Analysis:
6.2.1. Performance Evaluation Under Various Ambient Conditions
6.2.2. Change in Weighting Parameters
6.2.3. Impact of Key Parameters in the PSO Algorithm on HRES Performance
6.3. Comparison with Existing Study
7. Conclusions and Recommendations
Author Contributions
Funding
Institutional Review Board Statement
Informed Consent Statement
Data Availability Statement
Acknowledgments
Conflicts of Interest
Nomenclature
| AC | Alternative current |
| ANN | Artificial neural network |
| ASC | Annualized system cost |
| BMG | Biomass Gasifier |
| CHP | Combine heat and power |
| CSA | Cuckoo search algorithm |
| CUF | Capacity utilization factor |
| CV | Calorific value |
| DC | Direct current |
| DPP | Deficit power probability |
| EEF | Excess energy fraction |
| FA | Firefly algorithm |
| FC | Fuel cell |
| GA | Genetic algorithm |
| GHG | Green House Gas |
| GWO | gray wolf optimizer |
| HDI | Human development index |
| HOMER | Hybrid optimization of multiple energy resources |
| HRES | Hybrid renewable energy system |
| INSEL | Integrated simulation environment language |
| JCF | Job creation factor |
| LCOE | Levelized cost of energy |
| LOLE | Loss of load expected |
| LPSP | Loss of power supply probability |
| MCDM | Multi-criteria decision-making |
| NPC | Net present cost |
| NPV | Net Present Value |
| PSO | Particle Swarm Optimization |
| PV | Photovoltaic |
| RAPSIM | Renewable alternative power system simulation |
| REF | Renewable energy fraction |
| REMS | Rule-based energy management strategy |
| SA | Simulated annealing |
| SHO | Spotted hyena optimization |
| SOC | State of charge |
| TEL | Total energy loss |
| TNPC | Total Net Present Cost |
| TRNSYS | Transient system simulation software |
| WOA | Whale optimization algorithm |
| WT | Wind turbine |
References
- Alhumaid, A.; Khan, K.; Alismail, F.; Khalid, M. Multi-Input Nonlinear Programming Based Deterministic Optimization Framework for Evaluating Microgrids with Optimal Renewable-Storage Energy Mix. Sustainability 2021, 13, 5878. [Google Scholar] [CrossRef]
- Martínez-Díaz, J.; Villafáfila-Robles, R.; Montesinos-Miracle, D.; Sudrià-Andreu, A. Study of optimization design criteria for stand-alone hybrid renewable power systems. Renew. Energy Power Qual. J. 2024, 11, 1266–1270. [Google Scholar] [CrossRef]
- Ammari, C.; Belatrache, D.; Touhami, B.; Makhloufi, S. Sizing, optimization, control and energy management of hybrid renewable energy system—A review. Energy Built Environ. 2022, 3, 399–411. [Google Scholar] [CrossRef]
- Khan, A.A.; Minai, A.F.; Pachauri, R.K.; Malik, H. Optimal Sizing, control, and Management Strategies for Hybrid Renewable Energy Systems: A Comprehensive Review. Energies 2022, 15, 6249. [Google Scholar] [CrossRef]
- Modu, B.; Abdullah, P.; Bukar, A.L.; Hamza, M.F.A. Systematic review of hybrid renewable energy systems with hydrogen storage: Sizing, optimization, and energy management strategy. Int. J. Hydrogen Energy 2023, 48, 38354–38373. [Google Scholar] [CrossRef]
- Bade, S.O.; Meenakshisundaram, A.; Tomomewo, O.S. Current Status, Sizing Methodologies, Optimization Techniques, and Energy Management and Control Strategies for Co-Located Utility-Scale Wind–Solar-Based Hybrid Power Plants: A Review. Energies 2024, 5, 677–719. [Google Scholar] [CrossRef]
- Babatunde, A.; Munda, J.L.; Hamam, Y. Selection of a Hybrid Renewable Energy Systems for a Low-Income Household. Sustainability 2019, 11, 4282. [Google Scholar] [CrossRef]
- Boujdaini, L.E.; Mezrhab, A.; Moussaoui, M.A.; Jurado, F.; Vera, D. Sizing of a stand-alone PV–wind–battery–diesel hybrid energy system and optimal combination using a particle swarm optimization algorithm. Electr. Eng. 2022, 104, 3339–3359. [Google Scholar] [CrossRef]
- Li, G.; Yuan, B.; Ge, M.; Xiao, G.; Li, T.; Wang, J. Capacity configuration optimization of a hybrid renewable energy system with hydrogen storage. Int. J. Green Energy 2022, 19, 1583–1599. [Google Scholar] [CrossRef]
- Charfi, S.; Atieh, A.; Chaabene, M. Optimal sizing of a hybrid solar energy system using particle swarm optimization algorithm based on cost and pollution criteria. Environ. Prog. Sustain. Energy 2018, 38, 13055. [Google Scholar] [CrossRef]
- Hamza, E.; Jalal, S.; Faysal, Y.M.; Hamid, G. Optimization and Management of Hybrid Renewable Energy System Using PSO Algorithm: Data Center Application; IEEE: New York, NY, USA, 2024; pp. 1–5. [Google Scholar] [CrossRef]
- Medghalchi, Z.; Taylan, O. A novel hybrid optimization framework for sizing renewable energy systems integrated with energy storage systems with solar photovoltaics, wind, battery and electrolyzer-fuel cell. Energy Convers. Manag. 2023, 294, 117594. [Google Scholar] [CrossRef]
- Bismark, K.M.K.C.; Caballa, L.G.C.; Yap, C.M.F.; Peña, R.a.S.; Parocha, R.C.; Macabebe, E.Q.B. Optimization of a hybrid renewable energy system for a rural community using PSO. IOP Conf. Ser. Earth Environ. Sci. 2023, 1199, 012034. [Google Scholar] [CrossRef]
- Iweh, C.D.; Akupan, E.R. Control and optimization of a hybrid solar PV—Hydro power system for off-grid applications using particle swarm optimization (PSO) and differential evolution (DE). Energy Rep. 2023, 10, 4253–4270. [Google Scholar] [CrossRef]
- Zhang, J.; Cho, H.; Mago, P.J.; Zhang, H.; Yang, F. Multi-Objective Particle Swarm Optimization (MOPSO) for a Distributed Energy System Integrated with Energy Storage. J. Therm. Sci. 2019, 28, 1221–1235. [Google Scholar] [CrossRef]
- Zhang, G.; Wang, W.; Du, J.; Liu, H. A Multiobjective Optimal Operation of a Stand-Alone Microgrid Using SAPSO Algorithm. J. Electr. Comput. Eng. 2020, 2020, 6042105. [Google Scholar] [CrossRef]
- Güven, A.F.; Yörükeren, N.; Tag-Eldin, E.; Samy, M.M. Multi-Objective Optimization of an Islanded Green Energy System Utilizing Sophisticated Hybrid Metaheuristic Approach. IEEE Access 2023, 11, 103044–103068. [Google Scholar] [CrossRef]
- Ukoima, K.N.; Okoro, O.I.; Obi, P.I.; Akuru, U.B.; Davidson, I.E. Optimal sizing, energy balance, load management and performance analysis of a hybrid renewable energy system. Energies 2024, 17, 5275. [Google Scholar] [CrossRef]
- Eriksson, E.; Gray, E. Optimization of renewable hybrid energy systems—A multi-objective approach. Renew. Energy 2019, 133, 971–999. [Google Scholar] [CrossRef]
- Verma, R.; Bhatia, R.; Raghuwanshi, S.S. Optimization and performance enhancement of renewable energy microgrid energy system using pheasant bird optimization algorithm. Sustain. Energy Technol. Assess. 2024, 66, 103801. [Google Scholar] [CrossRef]
- Yahiaoui, A.; Tlemçani, A. An efficient study of pv/wind/battery/electrolyzer/h2-tank/fc for a remote area electrification. Rev. Roum. Des Sci. Tech. Série Électrotechnique Et Énergétique 2024, 69, 129–134. [Google Scholar] [CrossRef]
- Xie, X.; Xiong, H.; Gao, C.; Hu, S. Microgrid Economic and Environmental Cost Optimization Scheduling Based on MO-PSO. IEEE 2024, 30, 1009–1014. [Google Scholar] [CrossRef]
- Parvin, M.; Yousefi, H.; Noorollahi, Y. Techno-economic optimization of a renewable micro grid using multi-objective particle swarm optimization algorithm. Energy Convers. Manag. 2023, 277, 116639. [Google Scholar] [CrossRef]
- Saravanan, S.G.D.; Ramya, G.; Hariprasad, N.; Gomathy, S.; Maranan, R. A comparative analysis of Meta-Heuristic algorithms for optimal configuration of hybrid renewable energy systems for remote villages. In Metaheuristics Algorithm and Optimization of Engineering and Complex Systems; Advances in Systems Analysis, Software Engineering, and High Performance Computing Book Series; IGI Global: Hershey, PA, USA, 2024; pp. 143–167. [Google Scholar] [CrossRef]
- Bakhtiari, H.; Naghizadeh, R.A. Multi-criteria optimal sizing of hybrid renewable energy systems including wind, photovoltaic, battery, and hydrogen storage with ɛ-constraint method. IET Renew. Power Gener. 2018, 12, 883–892. [Google Scholar] [CrossRef]
- Menesy, A.S.; Sultan, H.M.; Habiballah, I.O.; Masrur, H.; Khan, K.R.; Khalid, M. Optimal configuration of a hybrid Photovoltaic/Wind Turbine/Biomass/Hydro-Pumped Storage-Based energy system using a Heap-Based optimization algorithm. Energies 2023, 16, 3648. [Google Scholar] [CrossRef]
- Alshammari, N.; Asumadu, J. Optimum unit sizing of hybrid renewable energy system utilizing harmony search, jaya and particle swarm optimization algorithms. Sustain. Cities Soc. 2020, 60, 102255. [Google Scholar] [CrossRef]
- Wali, S.B.; Hannan, M.A.; Ker, P.J.; Kiong, T.S. Optimal Sizing of PV-Battery Based Hybrid Renewable System Using Particle Swarm Optimization for Economic Sustainability; IEEE: New York, NY, USA, 2023; pp. 1–6. [Google Scholar] [CrossRef]
- Nassef, A.M.; Abdelkareem, M.A.; Maghrabie, H.M.; Baroutaji, A. Review of metaheuristic optimization algorithms for power systems problems. Sustainability 2023, 15, 9434. [Google Scholar] [CrossRef]
- Bade, S.O.; Tomomewo, O.S. Optimizing a Hybrid Wind-Solar-Biomass System with Battery and Hydrogen Storage Using Generic Algorithm-Particle Swarm Optimization for Performance Assessment. Clean. Energy Syst. 2024, 9, 100157. [Google Scholar] [CrossRef]
- Gupta, M.; Bhargava, A. Optimal design of hybrid renewable-energy microgrid system: A techno–economic–environment–social–reliability perspective. Clean Energy 2024, 8, 66–83. [Google Scholar] [CrossRef]
- Shams, S.A.; Ahmadi, R. Dynamic optimization of solar-wind hybrid system connected to electrical battery or hydrogen as an energy storage system. Int. J. Energy Res. 2021, 45, 10630–10654. [Google Scholar] [CrossRef]
- Sun, H.; Ebadi, A.G.; Toughani, M.; Nowdeh, S.A.; Naderipour, A.; Abdullah, A. Designing framework of hybrid photovoltaic-biowaste energy system with hydrogen storage considering economic and technical indices using whale optimization algorithm. Energy 2022, 238, 121555. [Google Scholar] [CrossRef]
- Cheraghi, R.; Jahangir, M.H. Multi-objective optimization of a hybrid renewable energy system supplying a residential building using NSGA-II and MOPSO algorithms. Energy Convers. Manag. 2023, 294, 117515. [Google Scholar] [CrossRef]
- Pariz, M.C.; Carvalho CM, F.; Rebelo PC, A.; Colmenero, J.C. Treatment of the uncertainties in prioritization of information technology projects: A hybrid multicriteria approach. J. Multi Criteria Decis. Anal. 2022, 29, 327–340. [Google Scholar] [CrossRef]
- Ding, W.; Ji, Y.; Liao, H.; Fang, D. A multiobjective discrete combination optimization method for dynamics design of engineering structures. Int. J. Mech. Syst. Dyn. 2022, 2, 108–116. [Google Scholar] [CrossRef]
- Roy, D.; Bhowmik, M.; Roskilly, A.P. Technoeconomic, environmental and multi criteria decision making investigations for optimisation of off-grid hybrid renewable energy system with green hydrogen production. J. Clean. Prod. 2024, 443, 141033. [Google Scholar] [CrossRef]
- Amoussou, I.; Tanyi, E.; Ali, A.; Agajie, T.F.; Khan, B.; Ballester, J.B.; Nsanyuy, W.B. Optimal Modeling and Feasibility Analysis of Grid-Interfaced Solar PV/Wind/Pumped Hydro Energy Storage Based Hybrid System. Sustainability 2023, 15, 1222. [Google Scholar] [CrossRef]
- Nishanth, J.R.; Deshmukh, M.A.; Kushwah, R.; Kushwaha, K.K.; Balaji, S.; Sampath, B. Particle swarm optimization of hybrid renewable energy systems. In Intelligent Engineering Applications and Applied Sciences for Sustainability; Advances in Civil and Industrial Engineering Book Series; IGI Global: Hershey, PA, USA, 2023; pp. 291–308. [Google Scholar] [CrossRef]
- Ahmadi, R.; Pourfatemi, S.M.; Ghaffari, S. Exergoeconomic optimization of hybrid system of GT, SOFC and MED implementing genetic algorithm. Desalination 2017, 411, 76–88. [Google Scholar] [CrossRef]
- Sharma, D.; Gaur, P.; Mittal, A.P. Comparative Analysis of Hybrid GAPSO Optimization Technique With GA and PSO Methods for Cost Optimization of an Off-Grid Hybrid Energy System. Energy Technol. Policy 2014, 1, 106–114. [Google Scholar] [CrossRef]
- Zebra EI, C.; Van Der Windt, H.J.; Nhumaio, G.; Faaij, A.P. A review of hybrid renewable energy systems in mini-grids for off-grid electrification in developing countries. Renew. Sustain. Energy Rev. 2021, 144, 111036. [Google Scholar] [CrossRef]
- JRC Photovoltaic Geographical Information System (PVGIS)—European Commission. 2024. Available online: https://re.jrc.ec.europa.eu/pvg_tools/en/#HR (accessed on 11 November 2024).
- Acakpovi, A.; Adjei, P.; Nwulu, N.; Asabere, N.Y. Optimal Hybrid Renewable Energy System: A Comparative Study of Wind/Hydrogen/Fuel-Cell and Wind/Battery Storage. J. Electr. Comput. Eng. 2020, 2020, 1756503. [Google Scholar] [CrossRef]
- Modu, B.; Abdullah, M.P.; Alkassem, A.; Hamza, M.F. Optimal rule-based energy management and sizing of a grid-connected renewable energy microgrid with hybrid storage using levy flight algorithm. Energy Nexus 2024, 16, 100333. [Google Scholar] [CrossRef]


| References | System Components | Optimization Methods | Performance Matrix | Objective Function | Key Findings | Gaps |
|---|---|---|---|---|---|---|
| [8] | PV–WT–battery–diesel generator (DG) | PSO | System cost, sustainability, reliability, H2 production, sizing | Min COE | Findings emphasize the importance of careful system sizing and optimization to ensure a reliable energy supply while minimizing costs, particularly in remote areas where traditional energy sources may be limited. | Need for multi-objective optimization |
| [9] | PV–WT–reversible solid oxide cell–H2 storage–battery | PSO | System cost, power redundancy, sizing | Min COE Min power redundancy and shortage | Power redundancy decreased by 85.08%, and the power shortage decreased by 64.42%. | Need for multi-objective |
| [10] | PV–battery–DG | PSO | System cost, environmental impact | Min COE Min CO2 emission | Optimizing the system for minimum pollution increases the overall cost by 0.3% compared to optimizing for minimum system cost. | The proposed method heavily relies on the PSO algorithm. Lack of reliability study. |
| [11] | PV–WT–battery–FC | PSO | Sizing | Sizing | The PSO algorithm is utilized to effectively identify the optimal sizing of a hybrid energy system by evaluating energy consumption over a year-long dataset. | Lack of economic, reliability, and sustainability assessment |
| [12] | PV–WT–battery–EL–FC | PSO, GA | Economic | Min(COE) | Integrating multiple renewable energy sources (RES) with a battery energy storage system (BESS) proved to be cost-effective and led to a 16–20% increase in the demand-supply fraction. | Lack of reliability and multi-objective optimization |
| [13] | PV–WT–hydro | PSO | Economic, Environmental, and Energy Management Systems | Min (operational cost, GHG emission) | Significantly improve energy access while reducing GHG and LCOE. | Lack of detailed economic, and reliability assessment |
| [14] | PV–battery–hydro | PSO, DE | Economic reliability | Min (LCOE) Min(LPSP) | DE tool is deemed more accurate and cost-effective than PSO in terms of convergence speed and accuracy. | proposed optimal system design suggests zero battery capacity, which may not be practical for all off-grid applications, particularly in areas with intermittent energy supply. |
| [16] | PV–WT–battery–DG | SAPSO | System cost Environmental | Min ASC Min Emission cost | Proposed model with PSO-SA outperforms traditional PSO offers the best trade-off scheduling schemes. | No focus on reliability |
| [17] | PV–WT–battery–DG | GA, FA, HFA-PSO | Economic Environmental | Min ASC, COE, Max REF, Min Total gas emissions (TGE) | HFAPSO algorithm outperforms other algorithms in achieving 100% REF | No focus on reliability |
| [18] | PV–WT–battery | PSO | Economic | Min(total economic cost, ASC, LCOE) | Demonstrate an effective energy management system for the community’s needs. | Lack of reliability and sustainability assessment |
| [19] | PV–battery–EL–FC | Normalized Weighted Constrained Multi-Objective PSO | Economic Technical Environmental Socio-political | Min LPSP Min LCOE Max NPV Min Carbon footprint Max REF | This paper presents the implementation and demonstration of a four-dimensional multi-objective meta-heuristic algorithm. | - |
| [21] | PV–WT–battery–FC–EL | WOA, PSO, GWO | Economic | Min (COE, TNPC) | WOA outperforms other algorithms in terms of performance and sizing | Lack of reliability and sustainability assessment |
| [22] | PV–WT–micro turbine–DG–battery | MOPSO | Economic Environmental Energy management | - | MOPSO is effiective in reducing energy consumption, minimizing environmental impact, and enhancing economic efficiency | No focus on reliability assessment |
| [23] | PV–CHP–WT | MOPSO | Economic reliability | Min LPSP Min COE | Combining wind and solar energy can be particularly beneficial under future policies like carbon taxes or renewable energy incentives.x | Lack sustainability assessment |
| [24] | PV/WT/battery/ | PSO, GA, GWO, FA, SSA | Economic. Environmental Reliablity | Min cost Max reliability Max energy production Min environmental impact | Emphasizes the comparative nature of the analysis, suggesting that different meta-heuristic algorithms can yield varying results, with PSO standing out as particularly effective for this application. | specific details about the objective function are not provided in the contexts |
| [26] | PV–WT–BMG–hydro | PSO, GWO, HBO | Energy production Reliability economic | Min COE Min LPSP | HBO algorithm’s superior performance in achieving optimal solutions | No multi-objective optimization is performed |
| [27] | PV–WT–BMG–battery | PSO, HS, Jaya | Economic Efficiency Reliability | Min LPSP Max efficiency Min NPC | The highest-performing system consists of thirteen solar PV units (70.98 kW), four biomass units (160 kW), a single wind turbine (20 kW), and fifteen NI-Fe battery banks (288 kWh). The total present cost of the system amounts to USD581,218, with an energy cost of USD0.254 per kWh. | Lack of multi-objective optimization |
| [28] | PV–battery | PSO | Sizing, Economic, sustainability | Min LCOE Max REF | This study optimizes the sizing of a PV–battery hybrid renewable system using particle swarm optimization (PSO), achieving an 80.36% reduction in LCOE with a configuration of 3.3 kW PV and a 1 kWh battery, ensuring a 100% renewable energy fraction. | Lack of multi-objective optimization |
| Description | Parameter | Value | Unit |
|---|---|---|---|
| Wind Turbine | Rated capacity | 1 | kW |
| Capital cost | 2000 | USD/kW | |
| O&M cost | 2000 | USD/kW | |
| Replacement cost | 200 | USD/year | |
| Lifespan | 20 | Year | |
| Photovoltaic Panel | Rated capacity | 0.345 | kW |
| Capital cost | 20 | USD/kW | |
| O&M cost | 650 | USD/kW | |
| Replacement cost | 650 | USD/year | |
| Lifespan | 50 | Year | |
| Battery Storage | Rated capacity | 100 | kWh |
| Capital cost | 550 | USD/kWh | |
| Replacement cost | 550 | USD/year | |
| Lifespan | 10 | Year | |
| Biomass Gasifier * | Rated capacity | 1000 | kW |
| Capital cost | 175 | USD/kW | |
| O&M cost | 30 | USD/kW | |
| Replacement cost | 175 | USD/year | |
| Lifespan | 10 | Year | |
| Inverter | Rated capacity | 1 | kW |
| Capital cost | 300 | USD/kW | |
| O&M cost | 50 | USD/kW | |
| Replacement cost | 300 | USD/year | |
| Lifespan | 95 | Year | |
| Rated capacity | 10 | kW | |
| Fuel Cell * | Rated capacity | 10 | kW |
| Capital cost | 2000 | USD | |
| O&M cost | 10 | USD | |
| Replacement cost | 2000 | USD | |
| Lifespan | 50,000 | hours | |
| Electrolyzer * | Rated capacity | 10 | kW |
| Capital cost | 1000 | USD | |
| O&M cost | 20 | USD | |
| Replacement cost | 1000 | USD | |
| Lifespan | 15 | Year | |
| Hydrogen Tank * | Tank capacity | 100 | kg |
| Capital cost | 200 | USD | |
| O&M cost | 20 | USD | |
| Replacement cost | 200 | USD | |
| Lifespan | 25 | Year |
| Algorithm | Parameters | Value |
|---|---|---|
| PSO | Population | 24 |
| Intertia weight | 0.5 | |
| Personal learning coefficient | 1.5 | |
| Global learning coefficient | 1.5 | |
| Iterations | 50 | |
| GA | Population | 24 |
| Crossover index | 10 | |
| Mutation index | 10 | |
| Mutation probability | 0.2 | |
| Crossover probability | 0.2 | |
| Iterations | 50 |
| Parameters | Algorithm | ||
|---|---|---|---|
| PSO | GA | GAPSO | |
| Design Criteria | |||
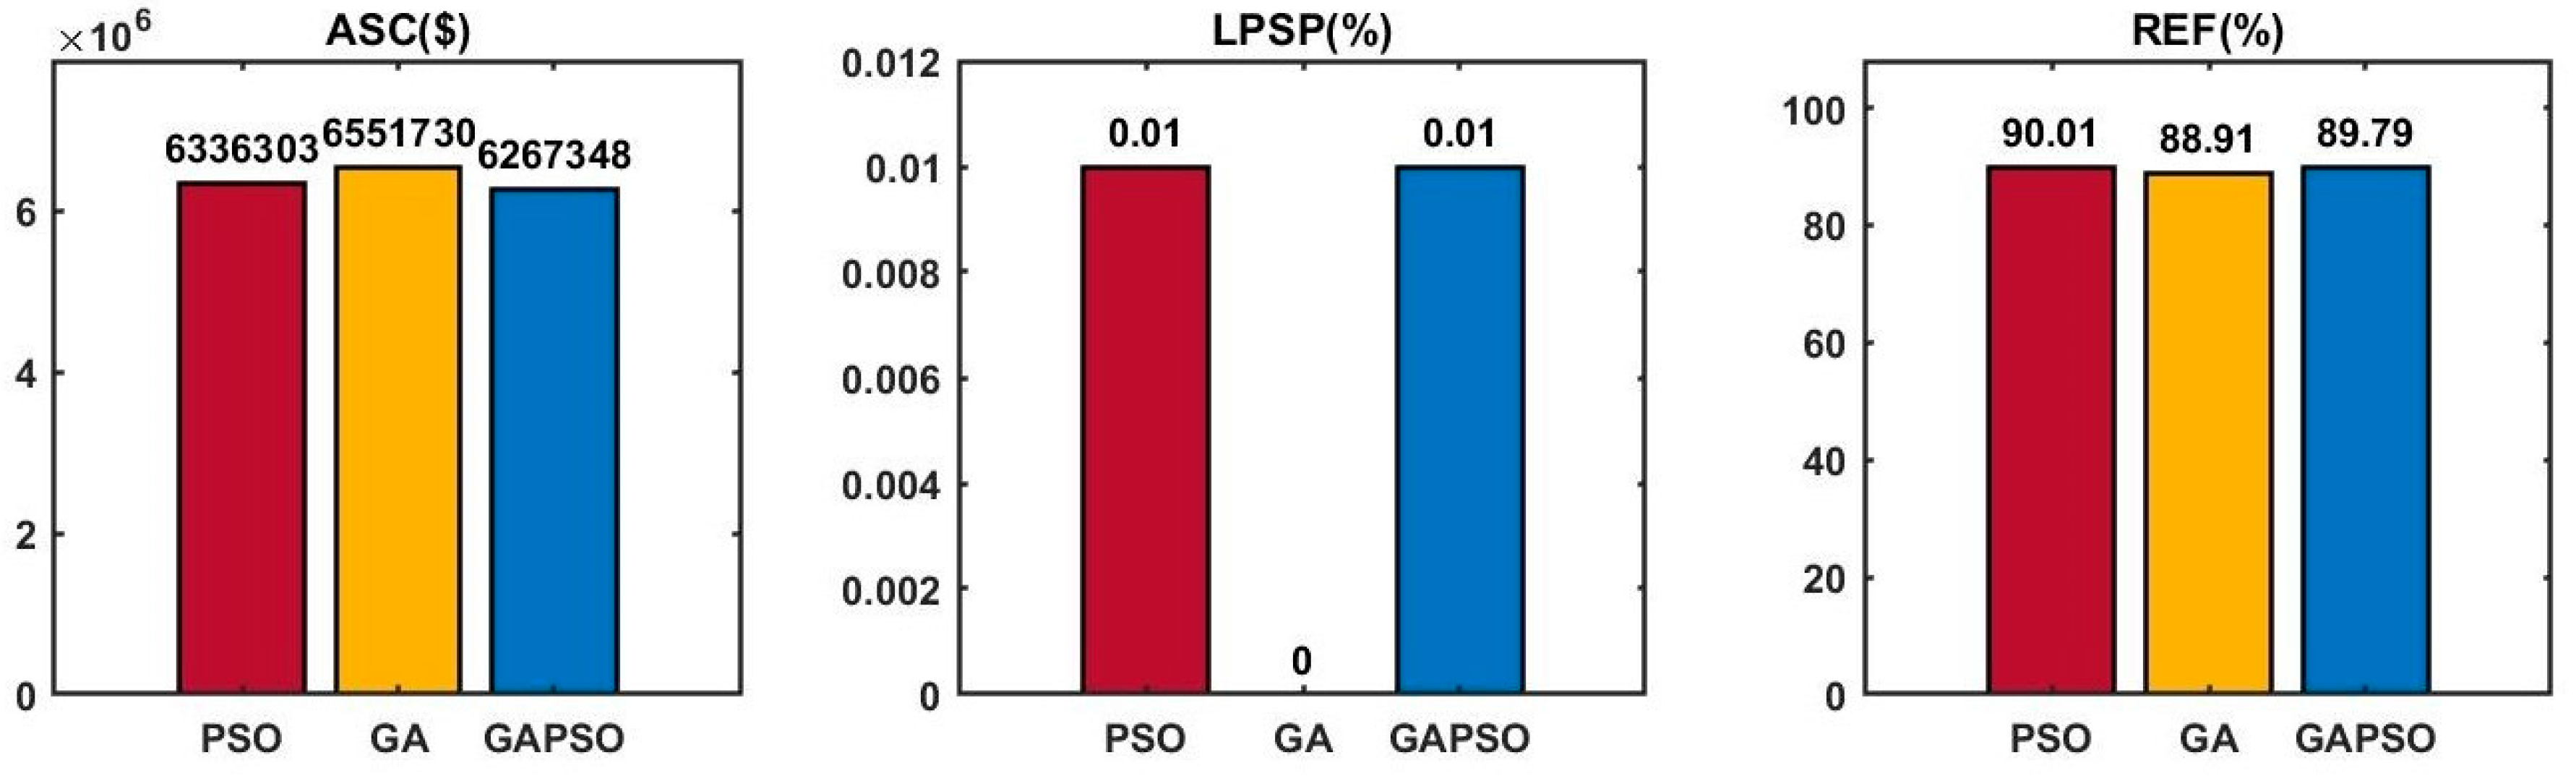
| ASC (USD) | 6,336,303 | 6,551,730 | 6,267,348 |
| LPSP (%) | 0.01 | 0 | 0.01 |
| REF (%) | 90.01 | 88.91 | 89.79 |
| Optimal sizing | |||
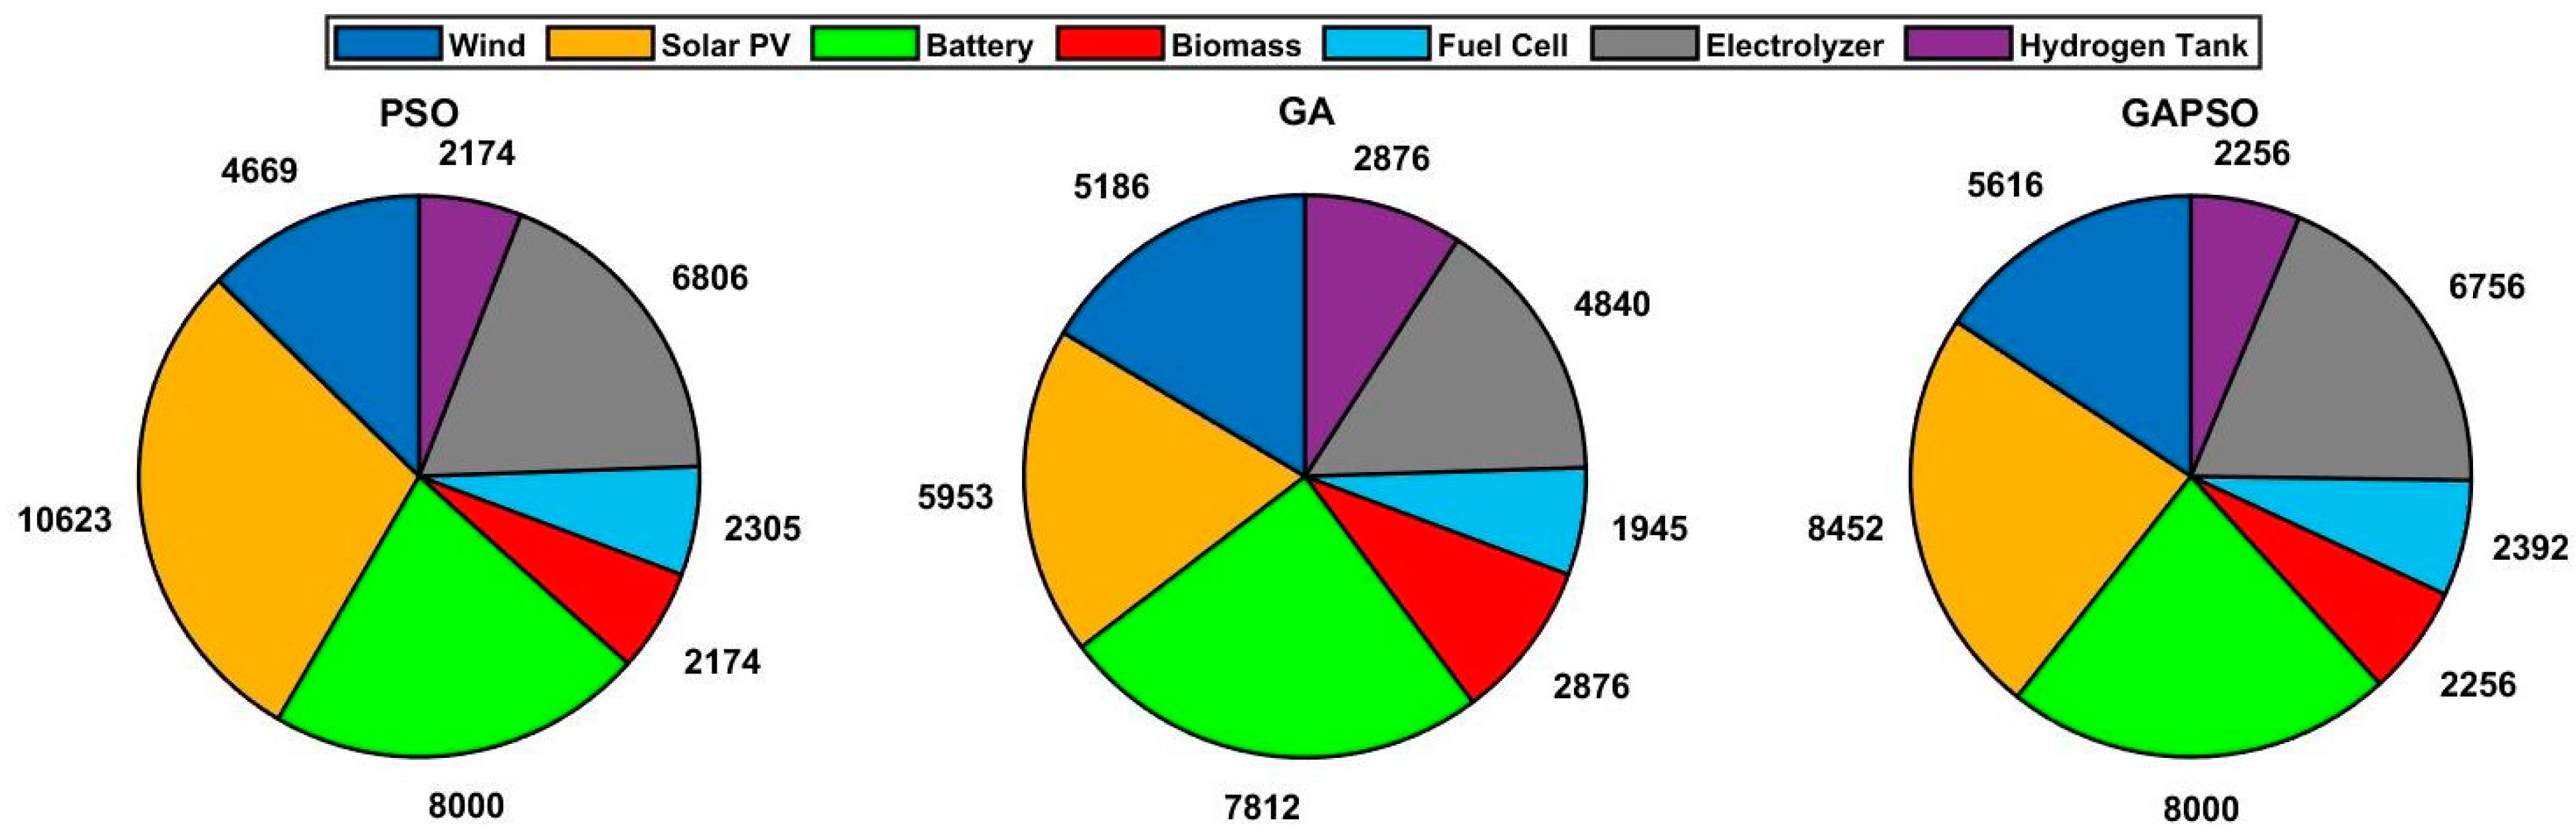
| Wind turbine (kW) | 4669 | 5186 | 5616 |
| Solar PV (kW) | 10,623 | 5953 | 8452 |
| Battery (kWh) | 8000 | 7812 | 8000 |
| Biomass (kW) | 2174 | 2876 | 2256 |
| Fuel cell (kW) | 2305 | 1945 | 2392 |
| Electrolyzer (kW) | 6806 | 4840 | 6756 |
| H2 tank (kg) | 2174 | 2876 | 2256 |
| Convergence plot | |||
| Fitness value | 0.36 | 0.37 | 0.35 |
| No of iterations | <25 | <48 | <17 |
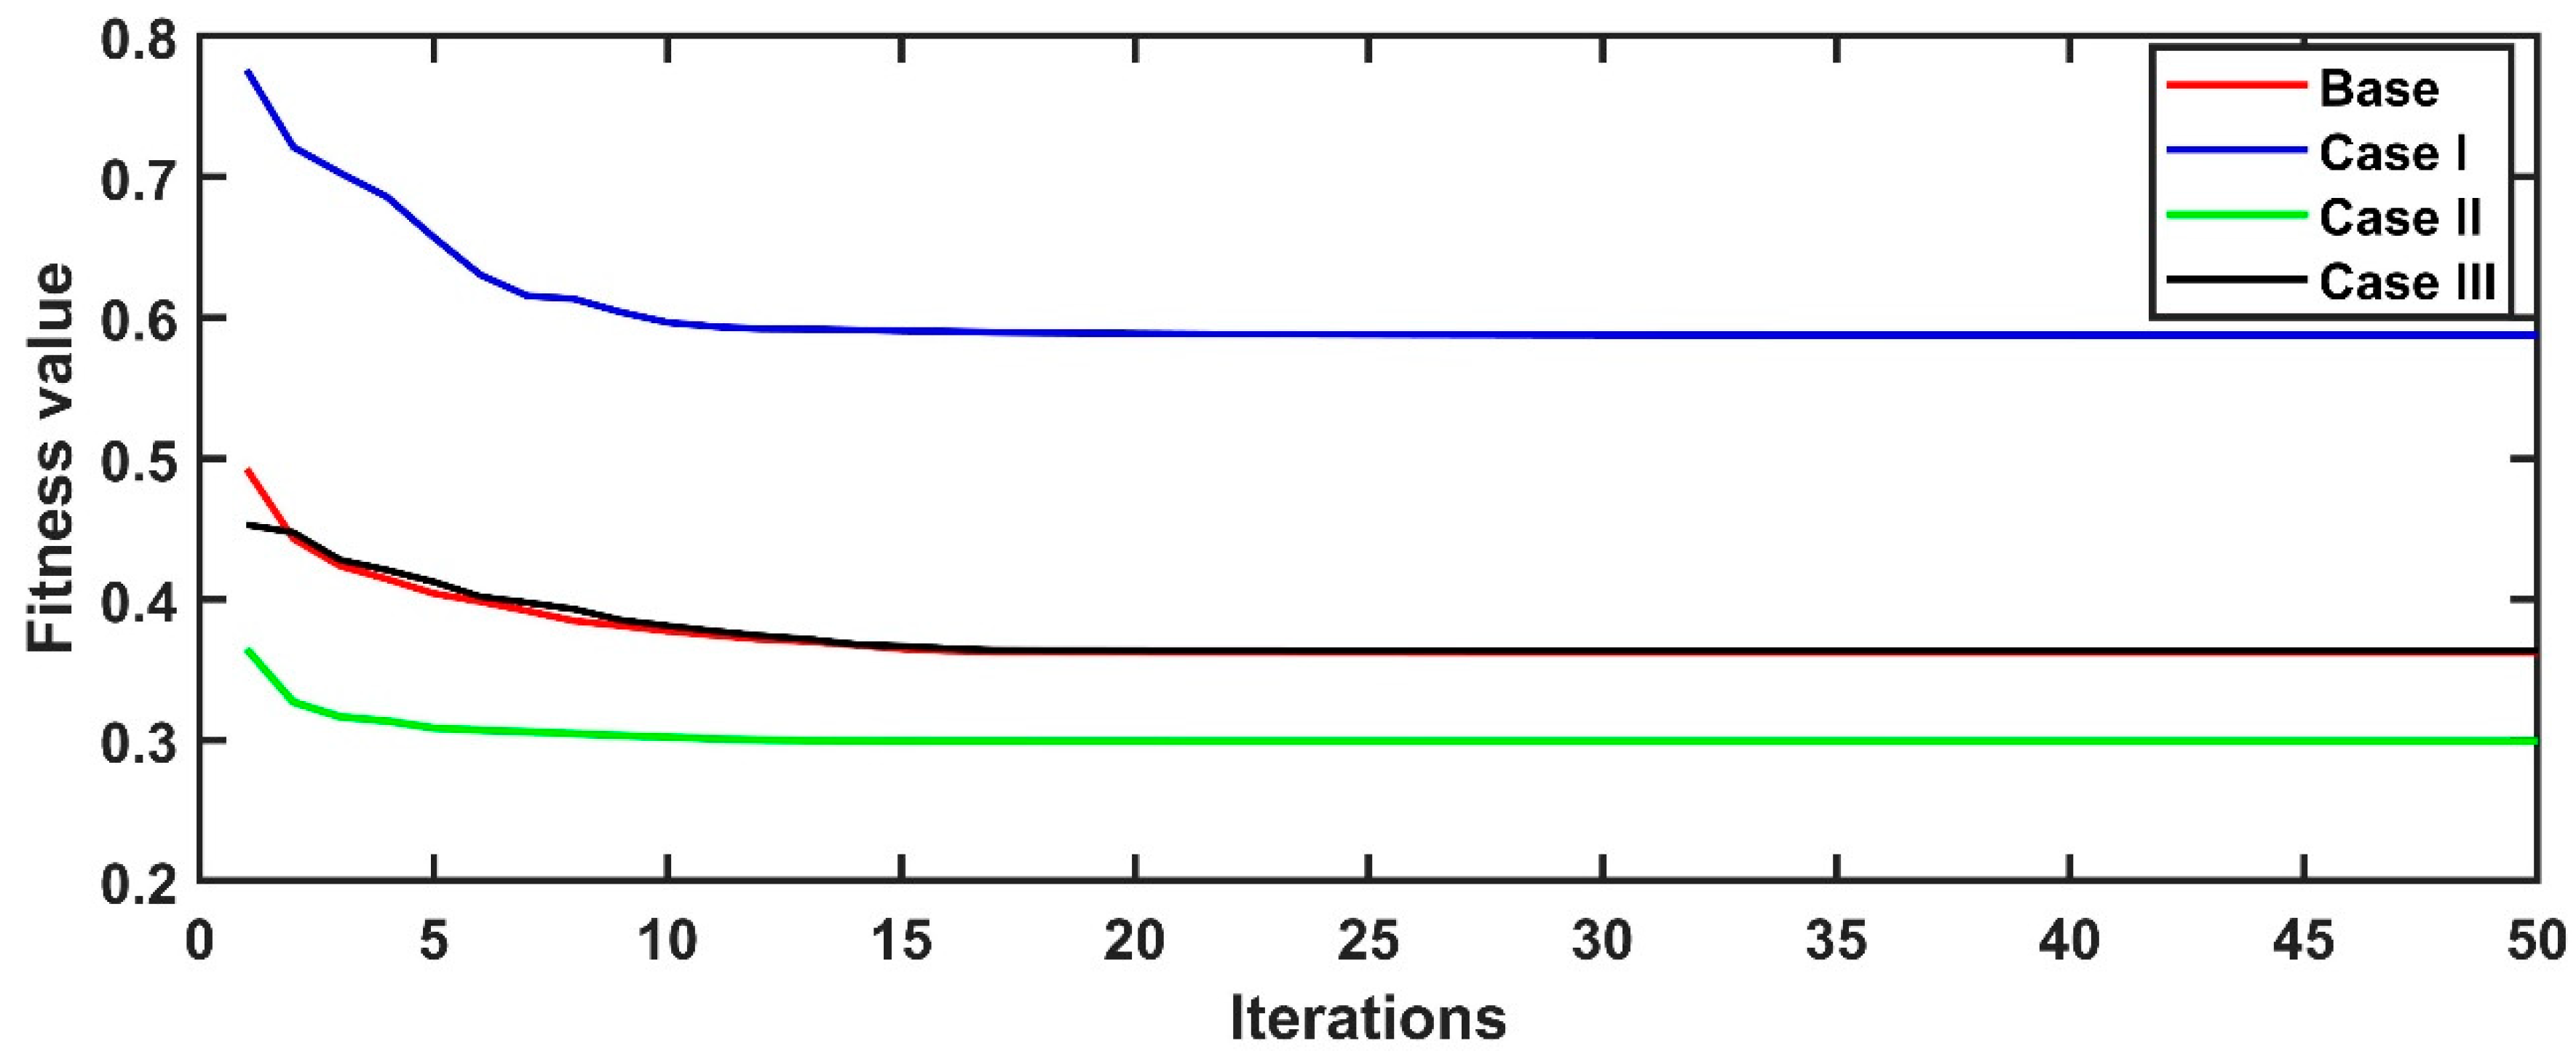
| Algorithms | Case Study | Optimization Results | |||
|---|---|---|---|---|---|
| ASC (USD) | LPSP (%) | REF (%) | Fitness Value | ||
| PSO | Case I | 6,241,414 | 0.01 | 88.52 | 0.59 |
| Case II | 6,253,709 | 0.01 | 89.52 | 0.29 | |
| Case III | 6,691,189 | 0 | 90.88 | 0.36 | |
Disclaimer/Publisher’s Note: The statements, opinions and data contained in all publications are solely those of the individual author(s) and contributor(s) and not of MDPI and/or the editor(s). MDPI and/or the editor(s) disclaim responsibility for any injury to people or property resulting from any ideas, methods, instructions or products referred to in the content. |
© 2025 by the authors. Licensee MDPI, Basel, Switzerland. This article is an open access article distributed under the terms and conditions of the Creative Commons Attribution (CC BY) license (https://creativecommons.org/licenses/by/4.0/).
Share and Cite
Bade, S.O.; Tomomewo, O.S.; Meenakshisundaram, A.; Dey, M.; Alamooti, M.; Halwany, N. Multi-Criteria Optimization of a Hybrid Renewable Energy System Using Particle Swarm Optimization for Optimal Sizing and Performance Evaluation. Clean Technol. 2025, 7, 23. https://doi.org/10.3390/cleantechnol7010023
Bade SO, Tomomewo OS, Meenakshisundaram A, Dey M, Alamooti M, Halwany N. Multi-Criteria Optimization of a Hybrid Renewable Energy System Using Particle Swarm Optimization for Optimal Sizing and Performance Evaluation. Clean Technologies. 2025; 7(1):23. https://doi.org/10.3390/cleantechnol7010023
Chicago/Turabian StyleBade, Shree Om, Olusegun Stanley Tomomewo, Ajan Meenakshisundaram, Maharshi Dey, Moones Alamooti, and Nabil Halwany. 2025. "Multi-Criteria Optimization of a Hybrid Renewable Energy System Using Particle Swarm Optimization for Optimal Sizing and Performance Evaluation" Clean Technologies 7, no. 1: 23. https://doi.org/10.3390/cleantechnol7010023
APA StyleBade, S. O., Tomomewo, O. S., Meenakshisundaram, A., Dey, M., Alamooti, M., & Halwany, N. (2025). Multi-Criteria Optimization of a Hybrid Renewable Energy System Using Particle Swarm Optimization for Optimal Sizing and Performance Evaluation. Clean Technologies, 7(1), 23. https://doi.org/10.3390/cleantechnol7010023