Abstract
This paper addresses the optimal sizing of Hybrid Renewable Energy Systems (HRESs), encompassing wind, solar, and battery systems, with the aim of delivering reliable performance at a reasonable cost. The focus is on mitigating unscheduled outages on the national grid in Iraq. The proposed On–off-grid HRES method is implemented using MATLAB and relies on an iterative technique to achieve multi-objectives, balancing reliability and economic constraints. The optimal HRES configuration is determined by evaluating various scenarios related to energy flow management, electricity prices, and land cover effects. Consumer requirements regarding cost and reliability are factored into a 2D optimization process. A battery model is developed to capture the dynamic exchange of energy among different renewable sources, battery storage, and energy demands. A detailed case study across fifteen locations in Iraq, including water, desert, and urban areas, revealed that local wind speed significantly affects the feasibility and efficiency of the HRES. Locations with higher wind speeds, such as the Haditha lake region (payback period: 7.8 years), benefit more than urban areas (Haditha city: payback period: 12.4 years). This study also found that not utilizing the battery, particularly during periods of high electricity prices (e.g., 2015), significantly impacts the HRES performance. In the Haditha water area, for instance, this technique reduced the payback period from 20.1 to 7.8 years by reducing the frequency of charging and discharging cycles and subsequently mitigating the need for battery replacement.
Keywords:
battery; electric power; hybrid system; optimization; renewable energy; solar energy; wind energy 1. Introduction
Amidst pressing global electricity demands and its shortfall in residential supply in many countries, we target solutions. Focusing on Iraq’s energy systems—thermal, photovoltaic (PV) panels, and wind— our study primarily examines the electricity generation potential of renewables. We center our efforts on PV panels and wind turbines, vital for Iraq’s energy crisis and renewable energy goals [1,2]. In regions facing extreme climatic conditions, such as Iraq, this energy crisis becomes even more pronounced [3,4]. Iraq serves as a pertinent case study, grappling with heightened energy requirements for both cooling during summers and heating throughout winters. Notably, a substantial energy demand–supply gap has persisted over the past decade (2010–2020) [5]. This disparity underscores the imperative for the integration of renewable energy resources, even within oil-rich nations. Against the backdrop of the prevailing energy crisis and escalating environmental degradation on a global scale, the expedited development of renewable energy sources like solar and wind is of paramount importance [6].
Hybrid Renewable Energy Systems (HRESs), harnessing solar, wind, and energy storage technologies, emerge as a promising avenue for electricity generation [3,4]. Notably viable from both an economic and functional standpoint, these systems hold promise for present and future application within on-grid and off-grid scenarios [7]. However, a sharp contrast exists between traditional energy sources and the intermittent, unpredictable, and uncertain nature of wind and solar energies. This inherent intermittency and unpredictability give rise to profound reliability concerns, impacting the operational and design aspects of such systems [8]. As a strategic countermeasure, the deployment of Hybrid Renewable Energy Systems (HRESs) gains traction, particularly when bolstered by efficient energy storage solutions [9,10,11].
Several optimization techniques have demonstrated their adaptability in configuring optimal systems, ensuring a balance between energy production and demand while minimizing costs [12]. However, a crucial aspect of this optimization process is to define the cost and reliability parameters of Hybrid Renewable Energy Systems (HRESs) as system components and storage capacities are determined [7]. Existing literature analysis reveals a multitude of optimization techniques proposed for sizing and assessing the feasibility of HRES, often incorporating various combinations of renewable sources. These methods encompass linear programming, graphical construction techniques, and iterative approaches [13].
Comprehensive surveys elucidate that achieving the optimal design of HRES involves the dual objectives of minimizing electricity generation costs while fulfilling energy demand and mitigating emissions [14,15,16]. This design optimization encompasses both on-grid and off-grid operational modes [6]. Seeling-Hochmuth underscores the optimization of HRES through cost minimization while adhering to loss of power supply (LPS) and emission constraints [17]. Similarly, Yang et al. employ a Genetic Algorithm (GA) to ascertain the optimal sizing of an HRES by simultaneously minimizing the annualized cost of energy (ACOE) and LPS constraints [18]. Bapat et al. advocate for determining the optimal size of a solar-bio-battery-diesel HRES by minimizing ACOE and fulfilling load requirements [19].
In assessing reliability, studies differentiating between on-grid and off-grid systems often employ Grid Power Availability Probability (GPAP) and Loss of Power Supply Probability (LPSP) as constraints, respectively [7,13,20,21]. In a broader context, much of the aforementioned research has aimed to discern optimal Hybrid Renewable Energy System (HRES) designs that cater to singular objectives within a framework of numerous constraints. The efficacy of multi-objective evolutionary algorithms has spurred interest in HRES design through multi-objective optimization. These objectives commonly encompass minimizing costs, reducing emissions or fuel consumption, enhancing reliability, and prioritizing renewables over conventional generators [6]. In [22], an iterative optimization method has been introduced, aiming at lowering the Levelized Cost of Energy (LCE) by modifying the Deficiency of Power Supply Probability (DPSP). Similarly, the utilization of Loss of Power Supply Probability (LPSP) has been incorporated by [23], enhancing a techno-economic algorithm proficient in determining the HRES size that ensures dependable supply at minimal expense. In [24], an iterative Pareto fuzzy approach is used to optimize HRES size by simultaneously minimizing system costs, maximizing reliability, and curtailing surplus power for potential hydrogen extraction.
To address diverse gaps and objectives in the literature, following [21,25], the Multi-Objective Genetic Algorithm (MOGA) is used in optimizing diesel/wind systems with aims to curtail emissions and fuel expenses. Furthermore, the Strength Pareto Evolutionary Algorithm (SPEA) is utilized to optimize HRES size and power management as suggested in [26,27,28]. In a parallel vein, the Non-Dominated Sorting Genetic Algorithm (NSGA) is harnessed to diminish greenhouse gas emissions and system costs [29,30]. Notably, software tools like HOMER, tailored for HRES design, offer single-objective optimization focused on minimizing lifetime system costs, employing an enumeration method to establish the optimal configuration [6].
In our analysis, a new approach is proposed to address the issue of frequent and unscheduled outages of the national grid for several hours per day, which has been common in Iraq in recent years [31]. We developed a novel On–off-grid Optimal-Hybrid Renewable Energy System (On–off-grid Op-HRES) by integrating both off-grid and on-grid components.
This study presents a novel and comprehensive investigation of renewable energy potential across diverse locations in Iraq. We employ advanced optimization techniques to analyze data from these locations, providing a deeper understanding than previously conducted studies within the country [32,33,34,35]. To our knowledge, no prior study has undertaken such a detailed and geographically diverse analysis coupled with advanced optimization methodologies. This work fills a critical gap in the existing knowledge base and provides valuable insights for policymakers and stakeholders aiming to optimize Iraq’s renewable energy transition.
This unique design, implemented using MATLAB R2018a, ensures optimal configuration. Our novelty also lies in the effective adaptation of this system to address Iraq’s specific conditions and weather patterns through strategic arrangements and designs. The optimization technique used an iterative method based on a multi-objective approach to enhance energy supply reliability, minimize electricity generation costs, and maximize the utilization of renewable energy sources. The effectiveness of the proposed approach is assessed through simulation and analysis of the results obtained for the different scenarios.
In Section 2, we describe the hybrid system and modelling components, including load profile, wind power generation model, photovoltaic generation model, and battery model. Moving to Section 3, we explain the energy flow management and optimization principles, including different scenarios of flow management. In Section 4, we share our main discoveries, highlighting the system’s economic effects to improve electricity costs. Then, in Section 5, we compare our system with the Homer model. Lastly, in Section 6, we provide a summary of our findings, discuss the implications of those findings, and consider potential directions for further study.
2. Description of Hybrid System and Modelling Components
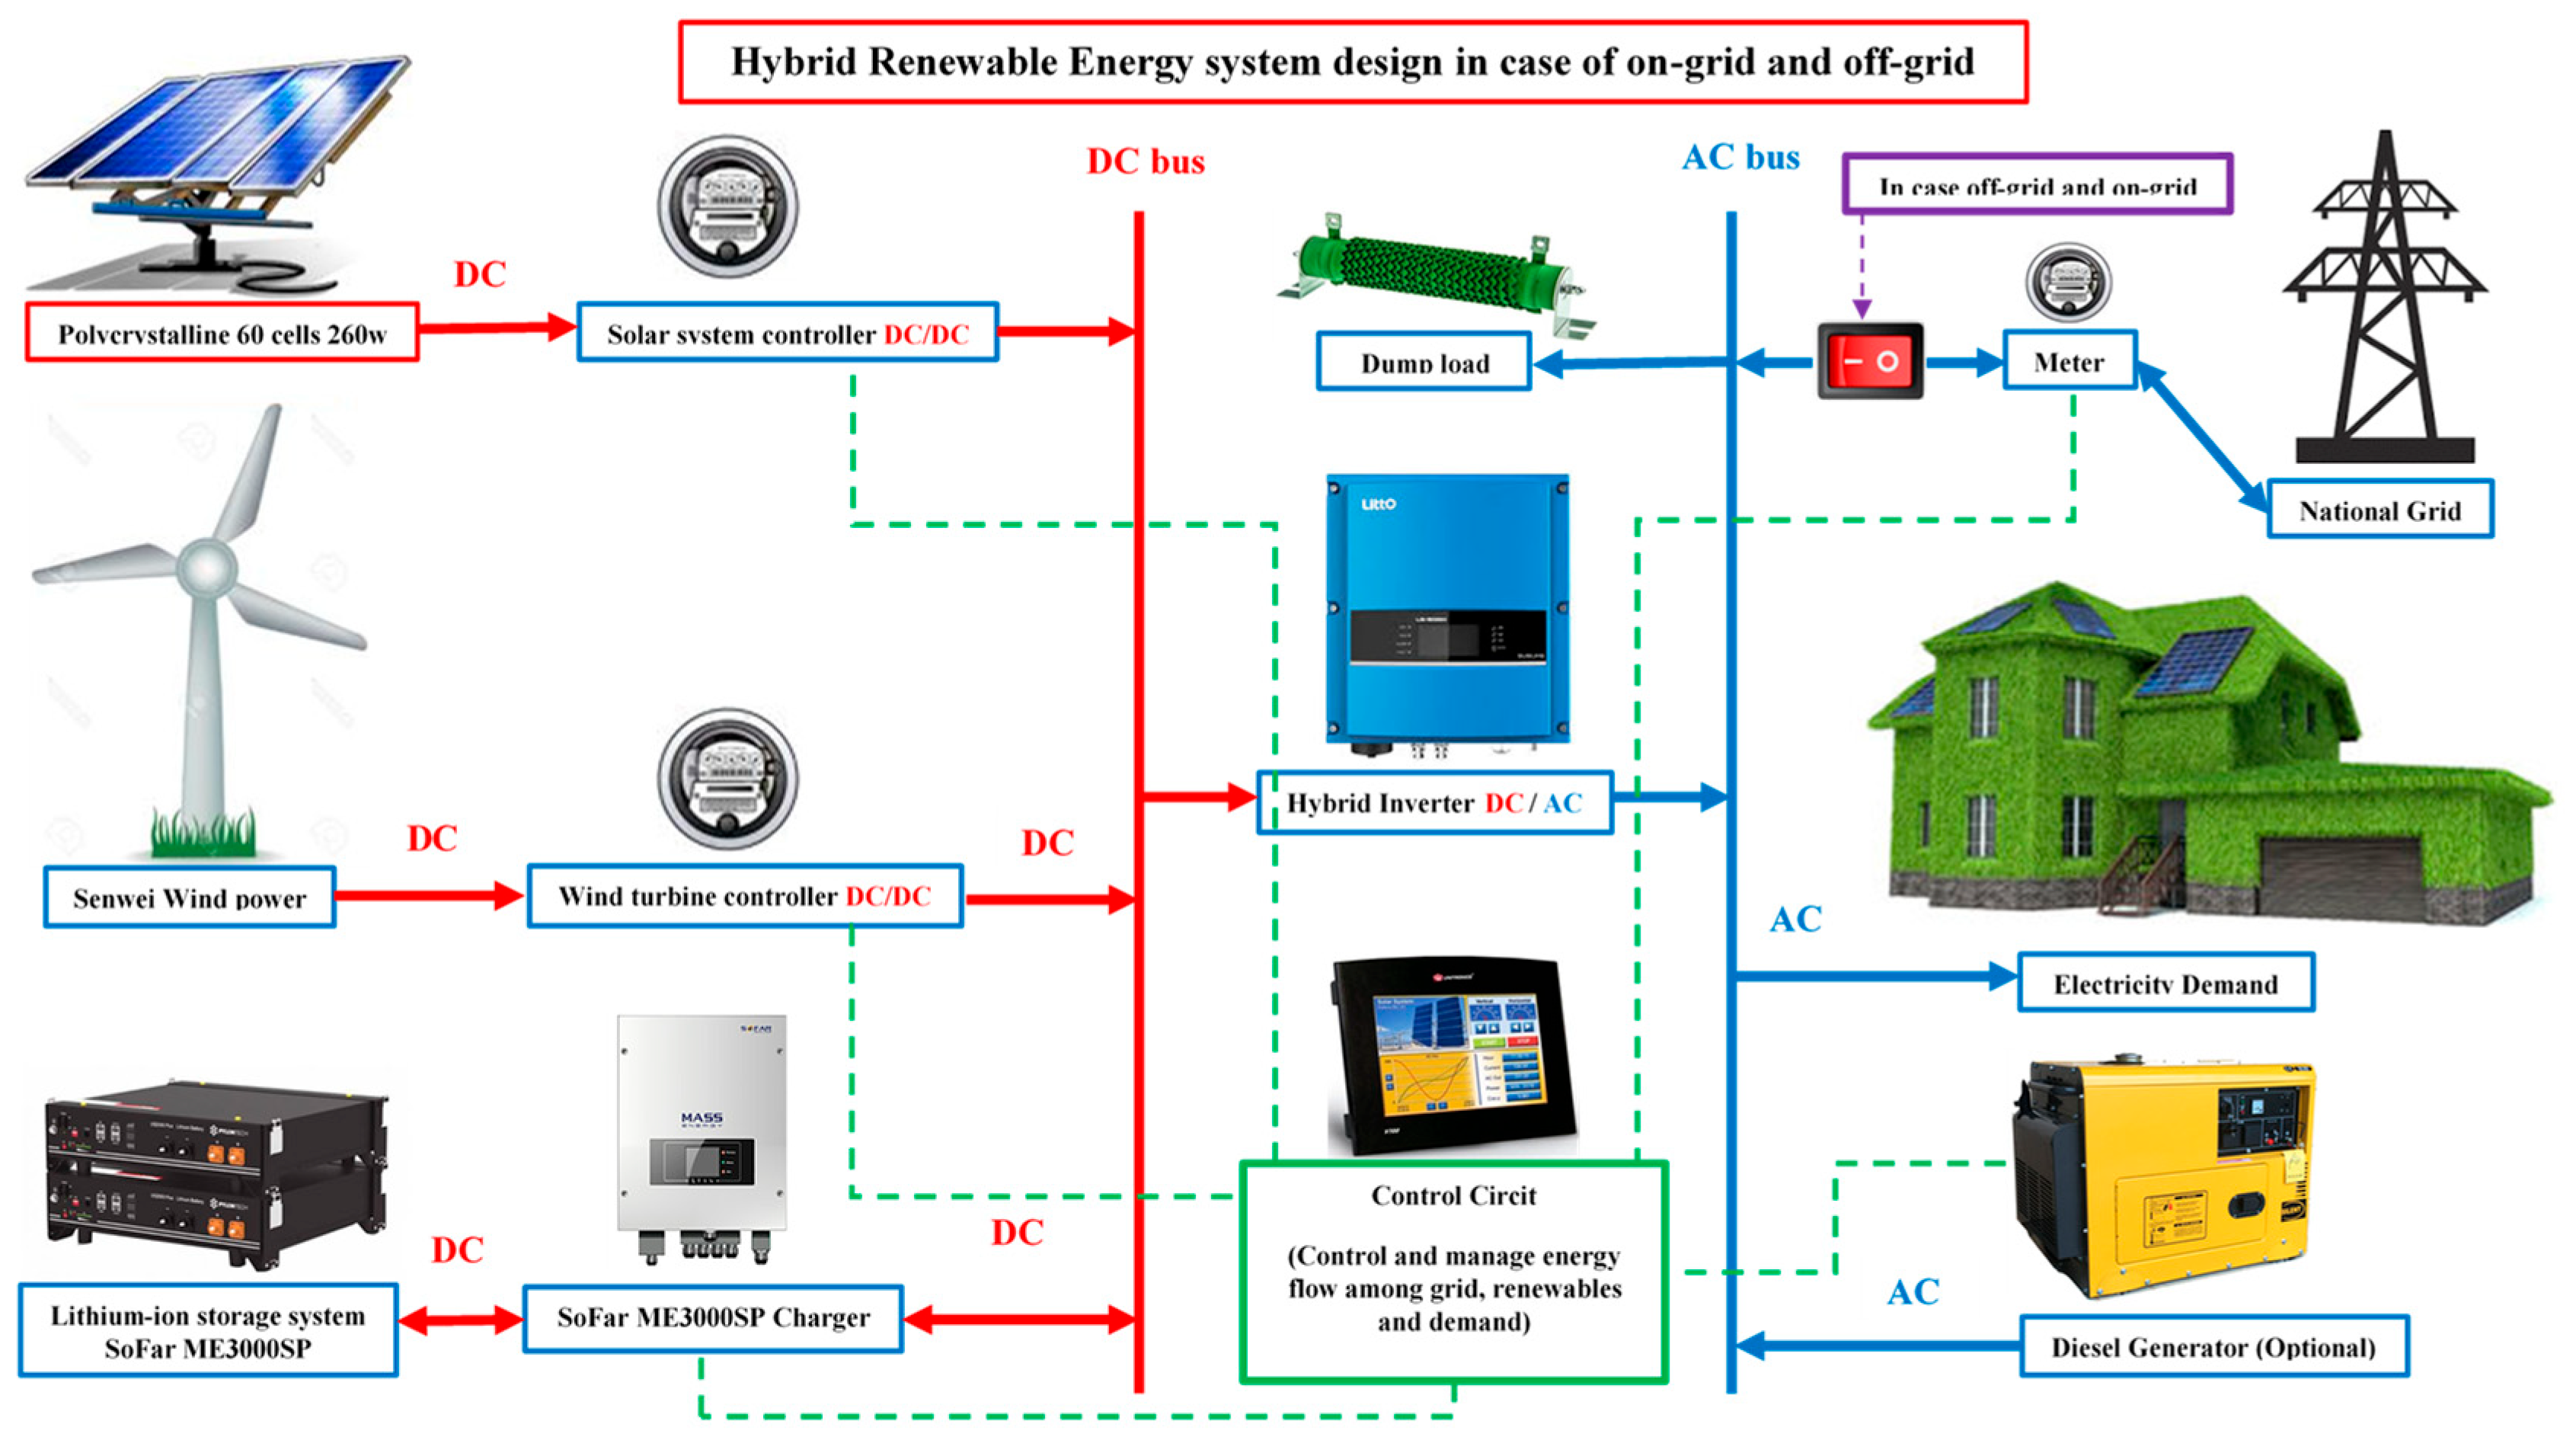
To design a flexible, reliable, and economical On–off-grid Op-HRES, a combination of different sizes of wind turbines, solar systems, lithium-ion batteries, and DC-AC inverters were considered. Various possible combinations of these components were evaluated as presented in Figure 1 [36]. The Hybrid Renewable Energy System (HRES) connects wind turbines, solar systems, and lithium-ion batteries to the DC bus, minimizing power fluctuations and improving voltage stability [37,38,39]. An inverter integrates the AC load demand and grid with the HRES’s DC bus. The control circuit manages energy flow between the grid, renewables, and demand. Excess energy is managed by a dump load, and a diesel generator serves as a backup when renewable energy sources and battery storage are insufficient, or the grid connection is unavailable. This system combines clean, renewable energy sources with battery storage and a backup generator for a reliable and sustainable power supply.
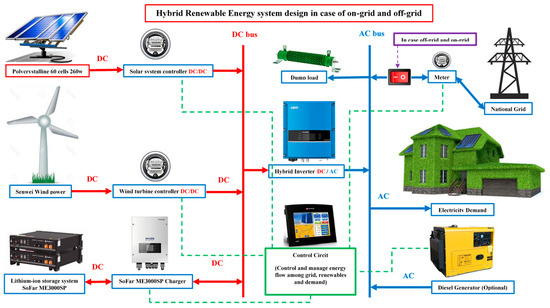
Figure 1.
Schematic diagram of On–off-grid Op-HRES design and components.
Equation (1) enables the determination of the appropriate DC-AC inverter size () to meet the maximum power demand in the AC bus. This is calculated based on the combined sizes of the PV system (), wind turbine (), and the maximum battery discharge power (), as [36]:
Furthermore, to optimize the configuration size (CSZ) of the wind turbine, various sizes ranging from 2 kW to 30 kW were considered. The wind turbines selected for this study were from SENWEI Energy Technology Inc and included the following sizes: 2 kW, 5 kW, 10 kW, and 20 kW [40]. Additionally, 29 configurations of solar systems were evaluated, with sizes ranging from 1.56 kW to 30.16 kW, using Polycrystalline 60 cell 260 W solar modules. Finally, a lithium-ion storage unit with a capacity of 2.4 kWh was utilized to create different battery sizes, as shown in Table 1.

Table 1.
The characteristics of the 2.4 kWh lithium-ion storage unit (SoFar E3000SP) [41].
2.1. Load Profile
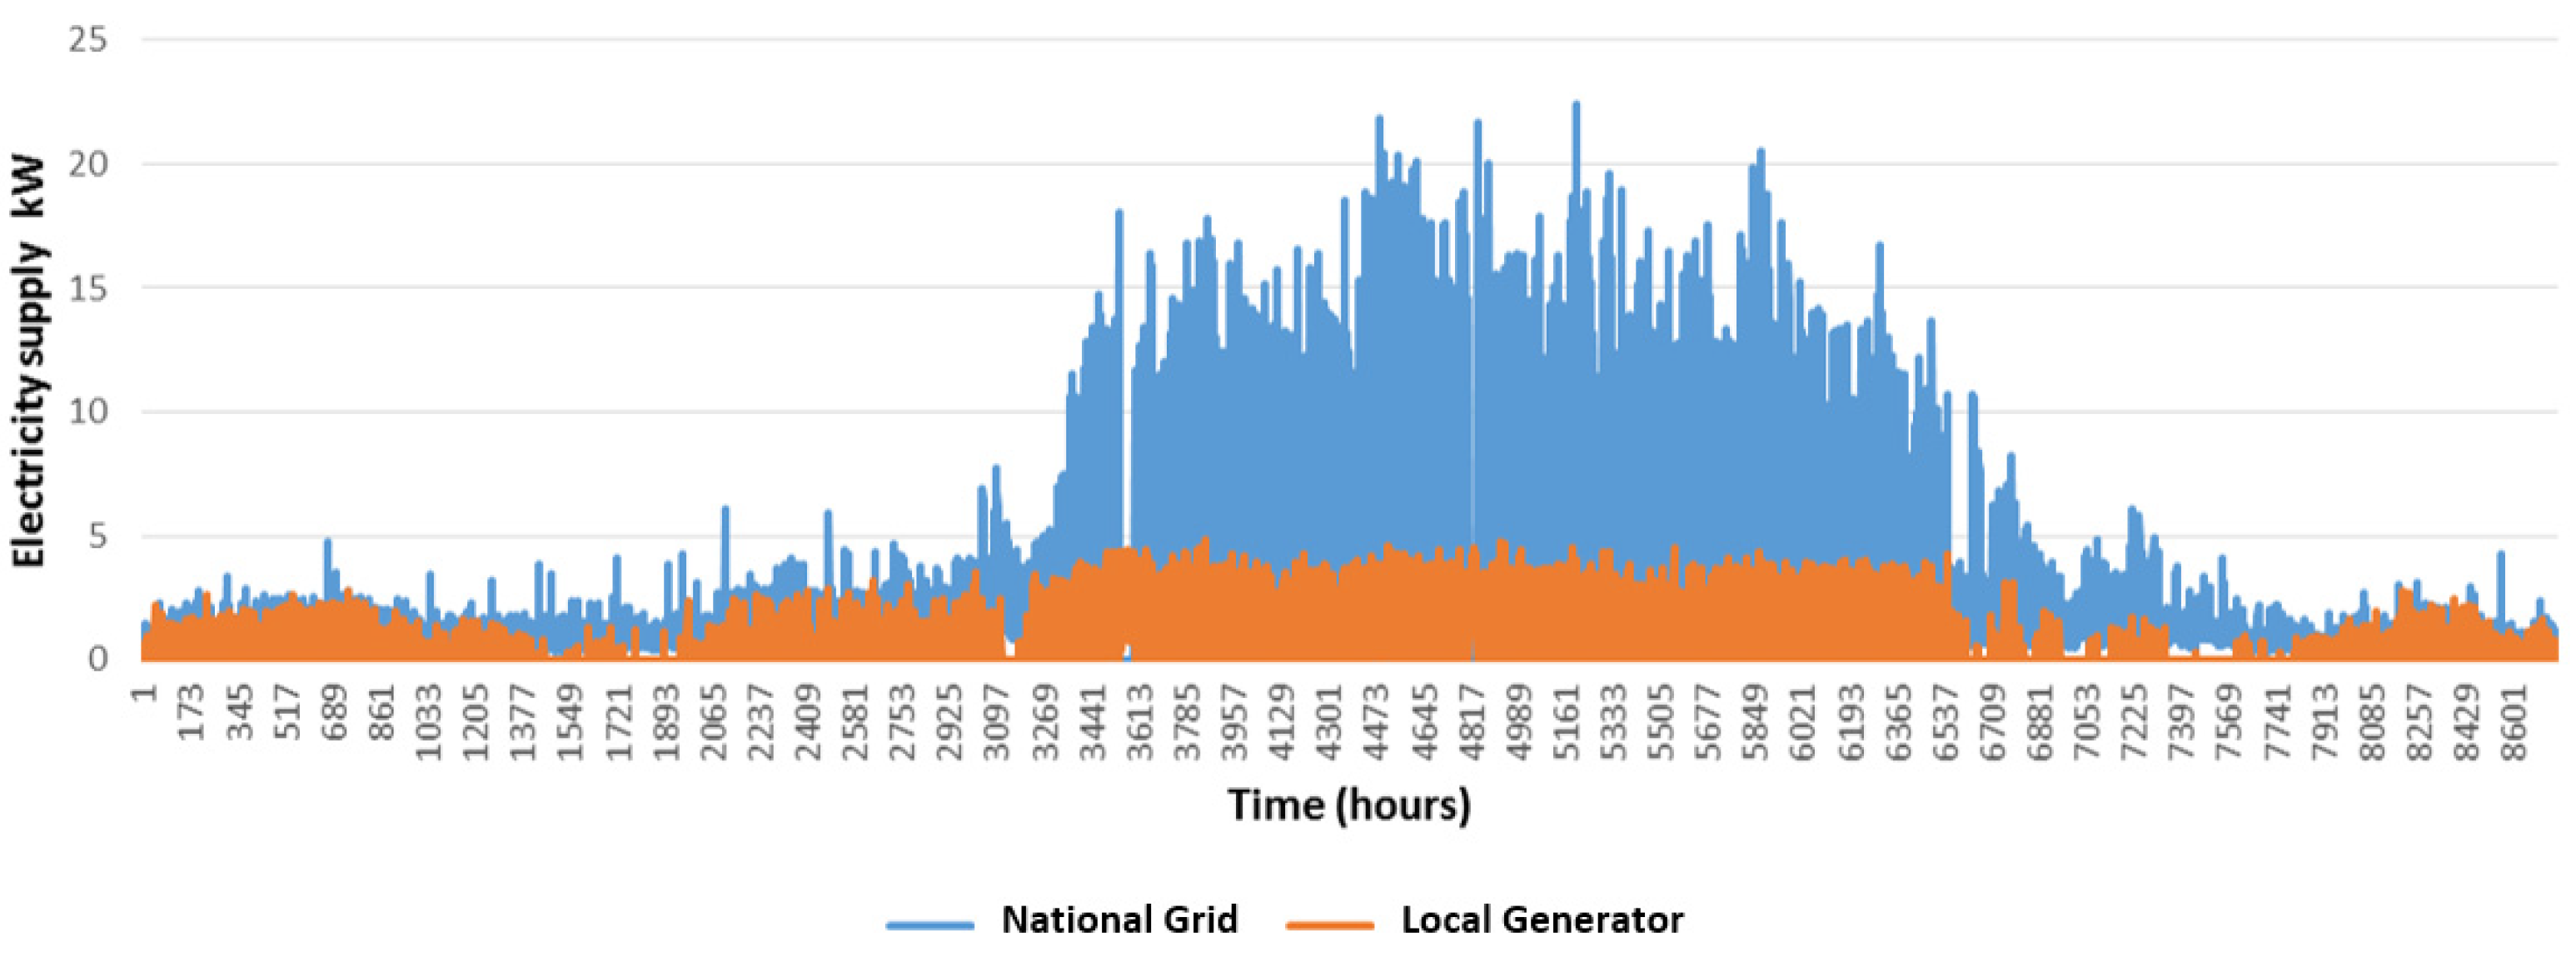
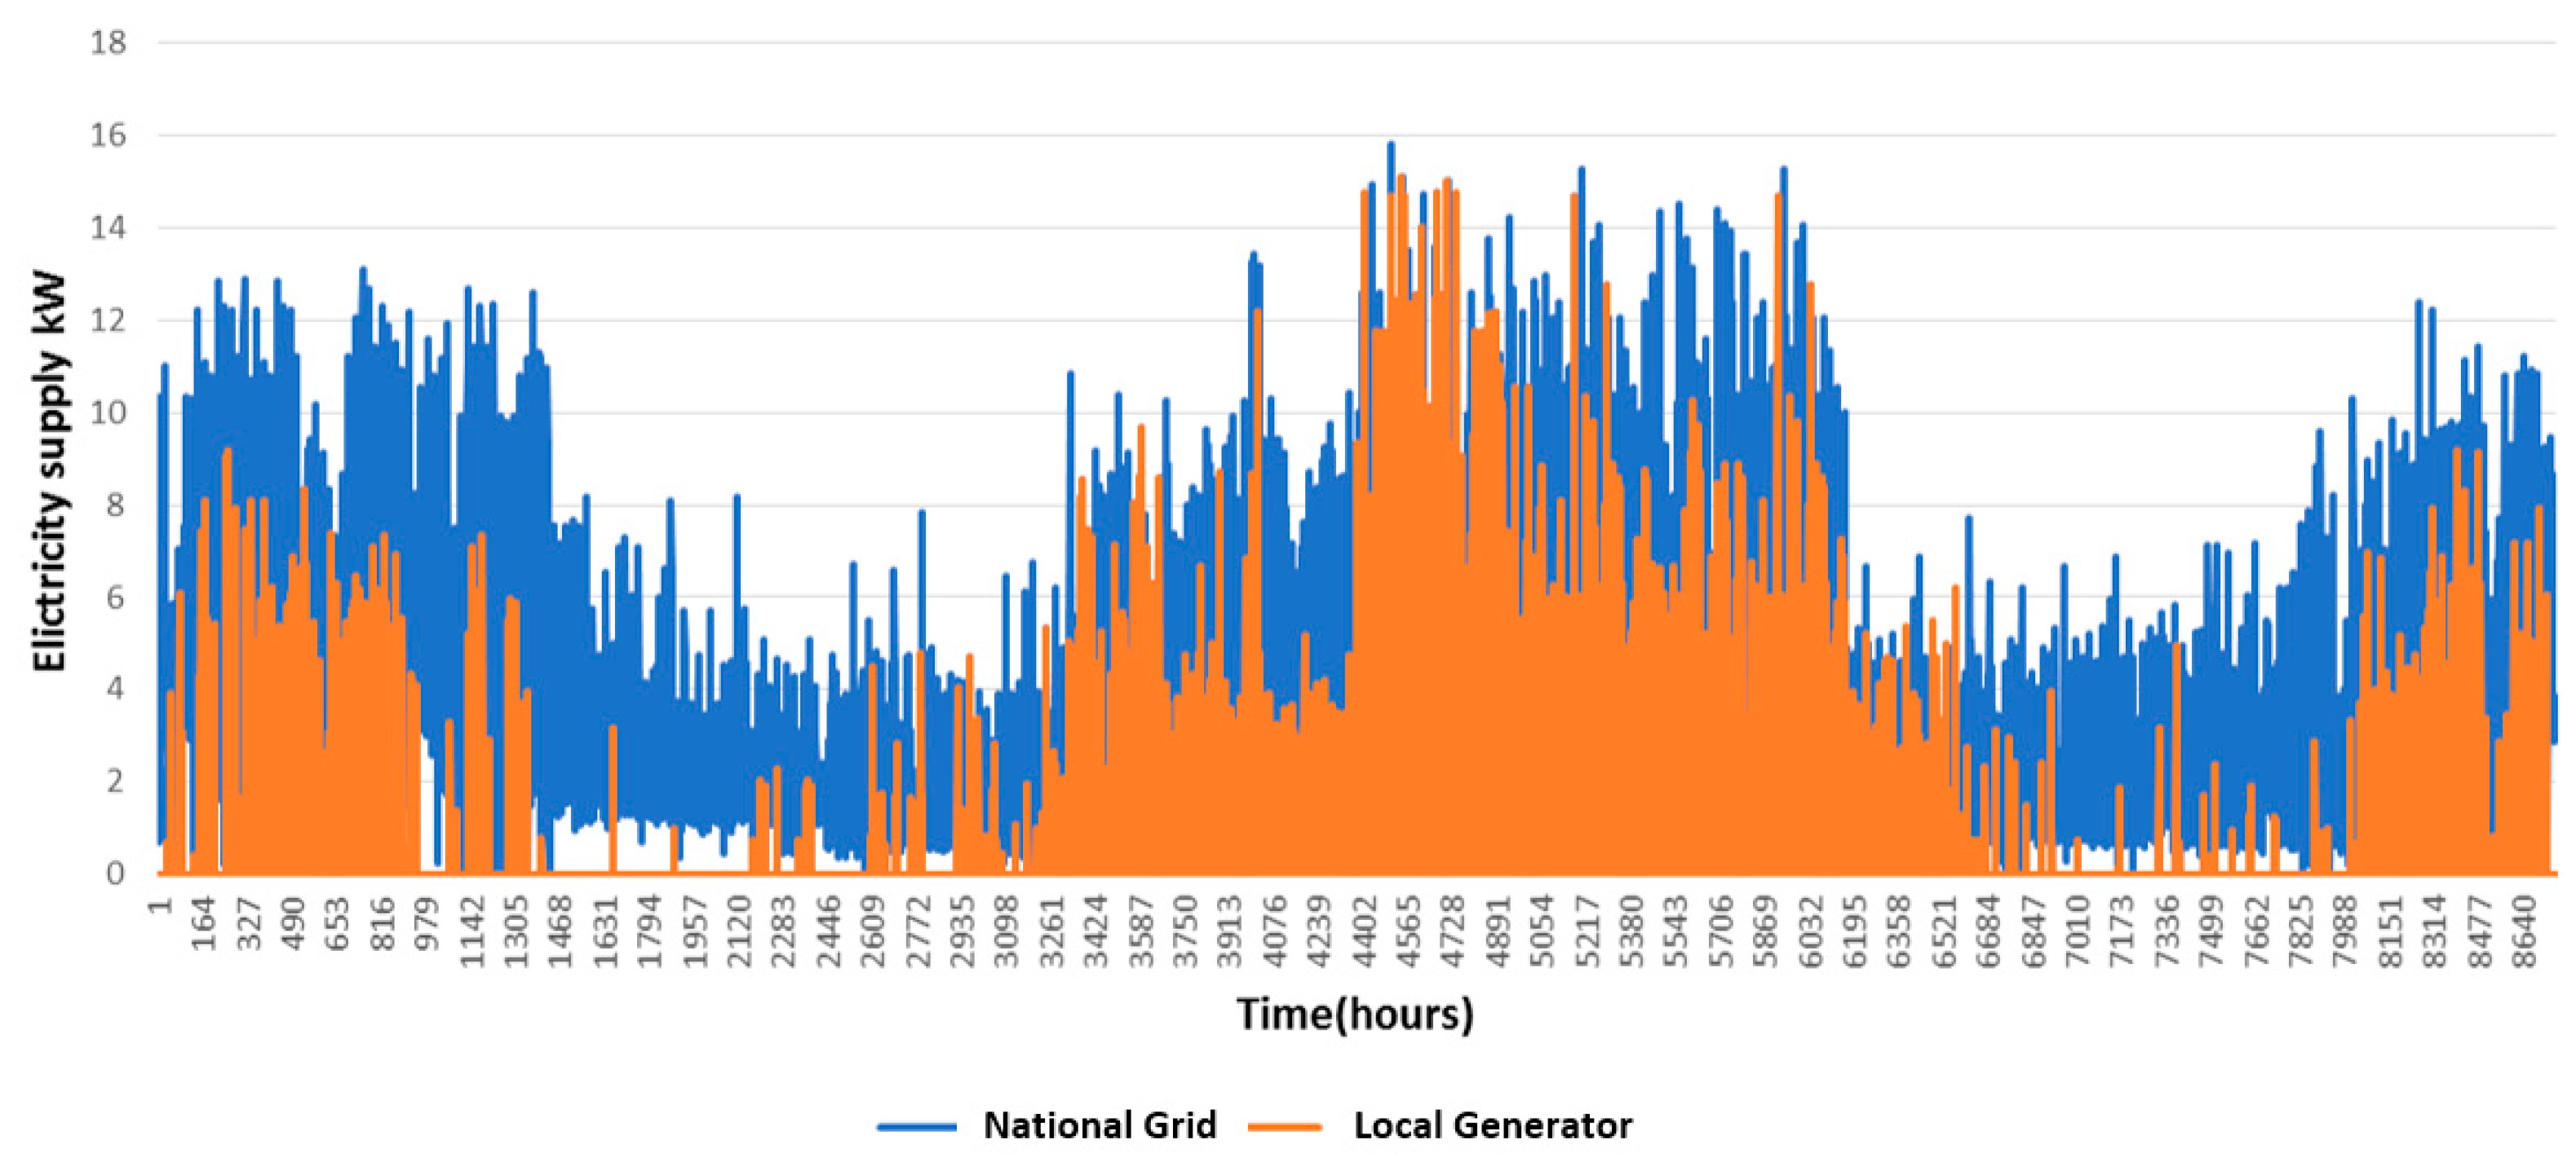
Accurate energy consumption data are critical for optimization, with 8760 h of data being the standard requirement [13,20,42]. To this end, the Efergy Engage hub kit, an online wireless home electricity monitor, was installed in two Iraqi houses, Baghdad house (BG) and Karbala house (KR), to record hourly energy consumption online [43], as depicted in Figure 2 and Figure 3. In addition, Iraq has implemented the Increasing Block Tariffs (IBTs) pricing policy over the past decades setting the price of electricity from the national grid as described in detail in [36]. Upon initial examination, we can observe significant spikes in hourly energy consumption from the national grid during hot summer months, primarily attributed to the usage of cooling devices, as depicted in Figure 2 and Figure 3. Conversely, during winter, as shown in Figure 3, energy consumption rises due to the utilization of electric heating devices, while other heating sources are utilized in Figure 2.
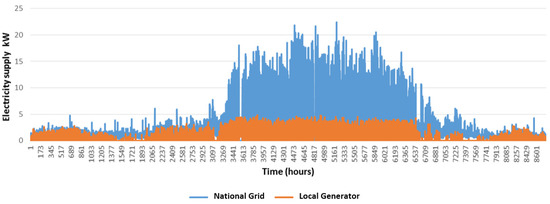
Figure 2.
BG energy consumption for 8760 h in 2018. On-grid demand was supplied from the national grid (blue line), and energy consumption during outage hours (off-grid) was covered by a local generator (orange line).
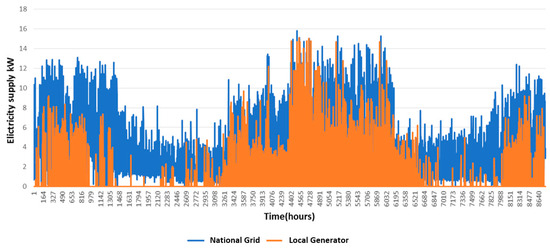
Figure 3.
KR energy consumption for 8760 h in 2018. On-grid demand was supplied from the national grid (blue line), and energy consumption during outage hours (off-grid) was covered by a local generator (orange line).
In Figure 2, we also note that hourly consumption from the generator remains relatively stable, hovering below 5 kWh, owing to the procurement of electricity from the local generator at a high cost. However, there is an evident uptick in electricity usage in Figure 3 when disconnected from the national grid, attributed to reliance on a large home generator (40 kWh) without limitations or restrictions, unlike the scenario depicted in Figure 2. This flexibility enables the system to meet high load demands effectively.
2.2. Wind Power Generation Model
This research paper utilizes a wind power generation model to estimate hourly power production from a wind turbine. The estimation is based on the hourly wind speed data for the year 2014. To derive the wind speed data, a developed downscaling model (DSM) is employed as described in reference [36]. The DSM improves the accuracy of power production estimation by providing more precise and localized wind speed estimates for the turbine.
2.3. Photovoltaic Generation Model
The estimation of hourly PV power production takes into account two parameters: wind speed (forced convection) and ambient temperature [36,44]. This evaluation is developed by incorporating the wind effect, which is not considered in the original Homer model calculation [45]. The specifications of the solar panels used in the study can be found in [36,46]. The annual optimum fixed tilted plane is provided by PVGIS [47], while the typical hourly solar radiation levels (GHI, and ) over one year for periods 2004, 2005, and 2006 are derived from HelioClim-3 version 5 by SoDa [48]. The azimuth angle equals 0°. Furthermore, hourly ambient temperature is provided by MERRA-2 RE-ANALYSIS for 2006 [49].
2.4. Battery Model
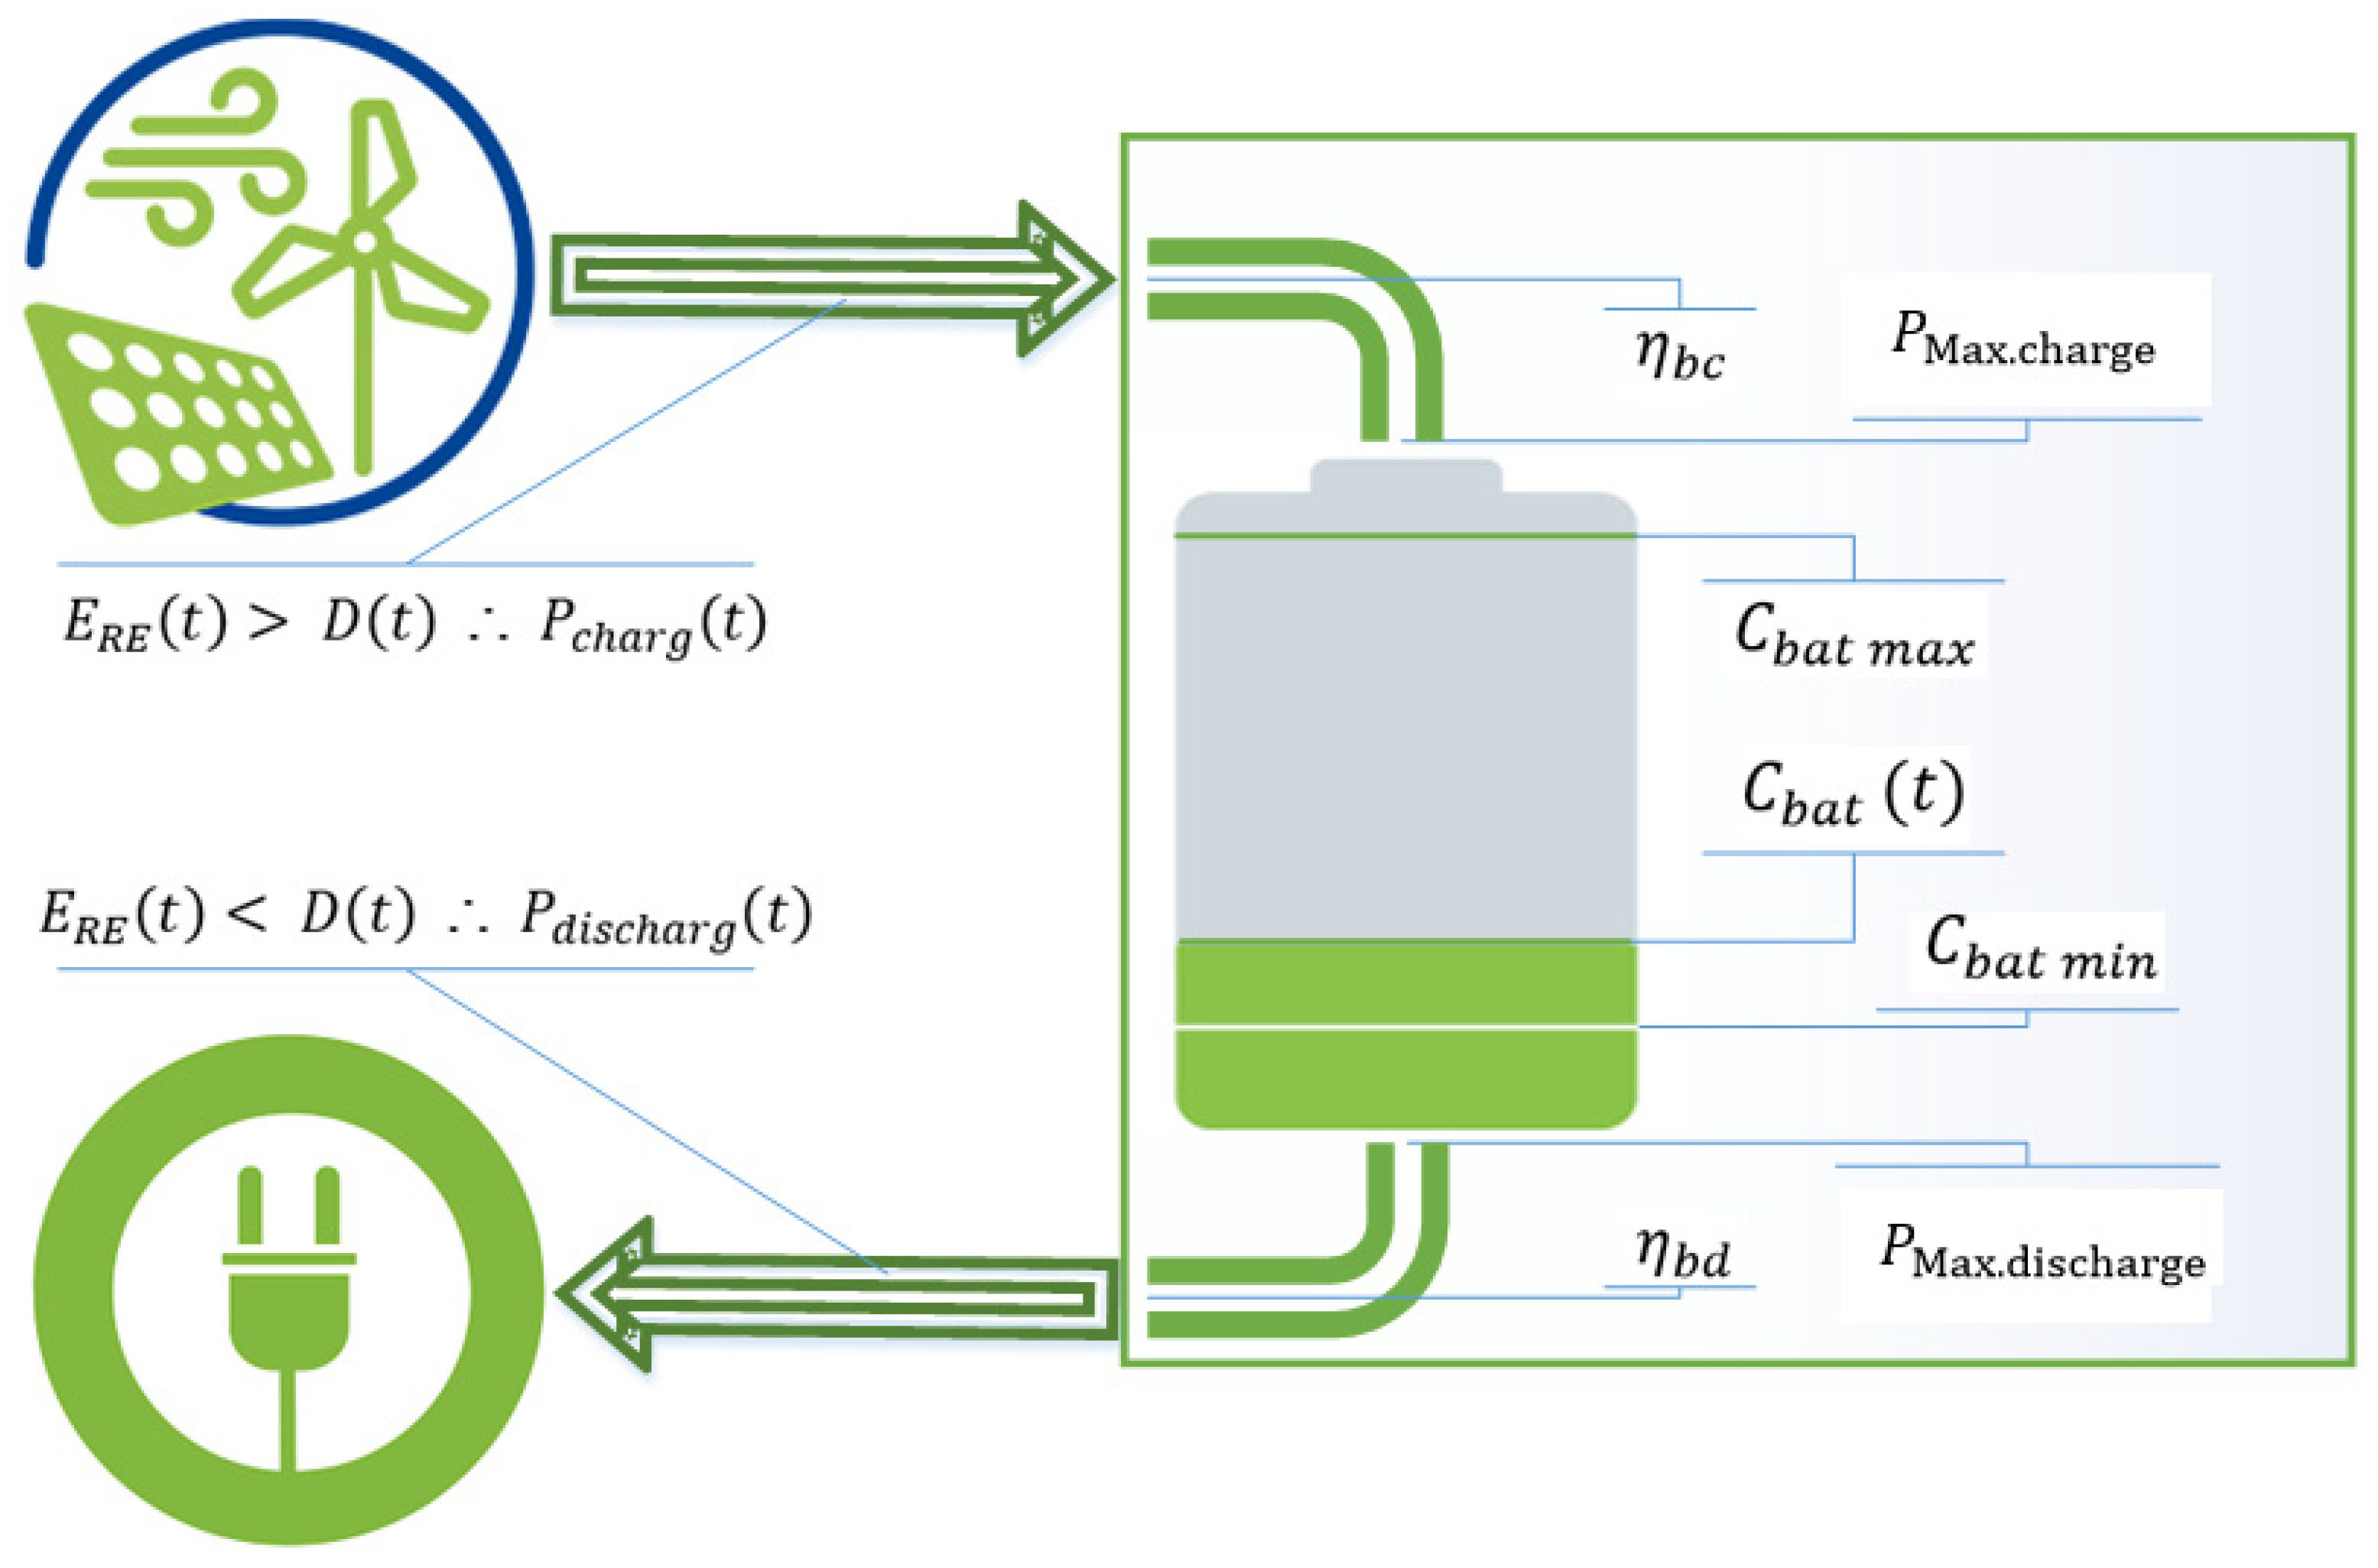
The maximum power charge and discharge of a battery (C-rate) is the cornerstone in the battery modelling system to determine the amount of energy flow among the renewable generators, battery, and demand, as shown in Figure 4. At the beginning, the total renewable energy that can be generated by the HRES at the time step (t = 1 h) is calculated as [41].
where and are the energies produced by the PV system and the wind turbine. The energy flow from the DC bus to the load in the AC bus is limited by the inverter efficiency , whereas (Figure 4) represents equivalent DC demand corresponding to the inverter input, determined as follows:
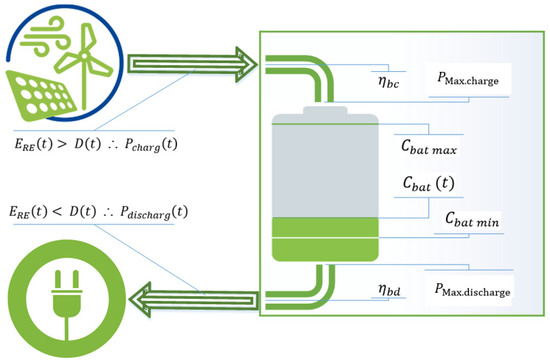
Figure 4.
Schematic showing how the battery parameters control the maximum and minimum amount of energy flow among the renewable systems, battery, and demand.
The energy flow when is determined as follows [41]:
where the energy flow for is defined as the energy need, as follows:
If Equation (4), the energy flow between renewables and battery must be estimated to determine the state of storage capacity, . The calculation depends on the state of storage capacity at a previous time step , such that the following applies:
The self-discharge rate , the maximum storage capacity , battery charge efficiency , and the maximum power charge (Figure 4) that controls the maximum amount of energy supplied to the battery are based on the C-rate of a battery.
According to the power charging from Equation (6), it is possible to calculate the battery capacity at the time step based on the previous state of battery capacity and self-discharge rate as follows:
If in Equation (5), the storage system should cover the energy demand, and the energy flow between battery and demand must be determined based on new parameters like minimum storage capacity and battery discharge efficiency. Furthermore, the maximum power discharge determines the maximum amount of energy that can be discharged from the battery, calculated as follows:
According to the , it is possible to calculate the battery capacity as follows:
When , will depend only on and , reducing Equation (9) to the following:
is the required amount of energy to charge battery, while represents the amount of energy that can be discharged from inside the battery. The above methodology of energy flow among renewables, battery, and demand is developed according to [20,42,50,51,52]. Since the lithium-ion battery (SoFar ME3000SP) is the storage system in this work, the values and definitions of parameters that related to battery are as follows:
- The self-discharge rate = 0.0013 per day, and = 5.5 × 10⁻⁵ per hour based on 4% per month [53].
- is the inverter efficiency that converts the current from the DC to the AC = 98% [54].
- is the battery charge efficiency = 94.5% [41].
- is the battery discharge efficiency = 94% [41].
- The calculation of maximum power charge and discharge of battery depends on the Max. C-rate = [41] and the storage nominal capacity .
At any time step, should be. The for the lithium-ion battery = 98% of the storage nominal capacity , calculated as follows [53]:
while the minimum storage capacity of the lithium-ion battery is determined based on DOD and of the battery, expressed as follows [20]:
where DOD (%) represents the maximum depth of battery discharge. For ME3000SP, the DOD = 90% [41].
3. Optimization Principles and Energy Flow Management
3.1. Optimization Algorithm
In the optimization process, the iterative technique is embedded using multi-objectives of several scenarios to determine the most optimal HRES configuration. One strategy is suggested to determine the optimum configuration that should meet the consumer requirement based on economic and reliability constraints. The algorithm strategy is called 2D. It is designed to be always reliable and to give priority to satisfying off-grid demand according to the minimum LPSP based on the minimum LCE [42,55], while the normalization used to deal with different units and scales is in the range of [0,1], calculated as follows [56]:
where is the a set of the observed values, is the number of configurations from 1–10,136, is the minimum values in , and , is the maximum values in . The process of 2D optimization is based on the following algorithm:
- Calculate the LPSP and LCE for 10,136 configurations.
- Calculate the normalization for each of LPSP and LCE using Equation (13) for each.
- Calculate the min-sum for a specific configuration regarded as the optimal configuration , expressed as follows:where and represent the normalization of LPSP and LCE.
3.2. Hybrid Controller for Energy Flow Management
Since Iraq’s national grid suffers from outages and fluctuations in electricity supply, designers must suggest solutions compatible with both supplies from private generators and the grid itself. To address this challenge, we have suggested the following three scenarios. Scenario A illustrates energy flow management during grid outages (off-grid), while Scenario B illustrates energy flow management when electricity is supplied from the national grid (on-grid) with discharging the battery as explained in Section 3.3. In addition, Scenario C evaluates the connection to the grid without discharging the battery to extend the lifespan of the battery and reduce the cost of HRES by reducing the replacement of the batteries since the battery has limited cycles as explained in Section 3.4.
Scenario A for off-grid
The energy flow management (EFM) strategy for off-grid is described as follows:
- Case 1. The total energy at the time step (t) should satisfy the , while the excess electricity is stored in the battery. If the the surplus electricity will go to the dump load as a wasted energy.
- Case 2. If , the energy deficit will be covered by discharging the battery.
- Case 3. If and or , the energy deficit will be satisfied by an optional generator.
Scenario B for on-grid with discharging
The EFM strategy for on-grid is described as follows:
- Case 1. The total energy generated should satisfy the , while the is saved in the battery. If the , the surplus electricity is exported to the grid.
- Case 2. Same process as in Case 2 in Scenario A for off-grid.
- Case 3. If we have the same conditions in Case 3 in Scenario A for off-grid, the demand will be satisfied by purchasing electricity from the grid based on IBT prices to satisfy the demand.
Scenario C for on-grid without discharging
- Case 1. The same process in Case 1 in Scenario A for on-grid.
- Case 2. When and , the energy deficit will be satisfied by purchasing electricity from the grid based on the IBT prices. The stored energy in the battery will be kept to the next job in the off-grid mode.
3.3. On–off-Grid System with Discharging
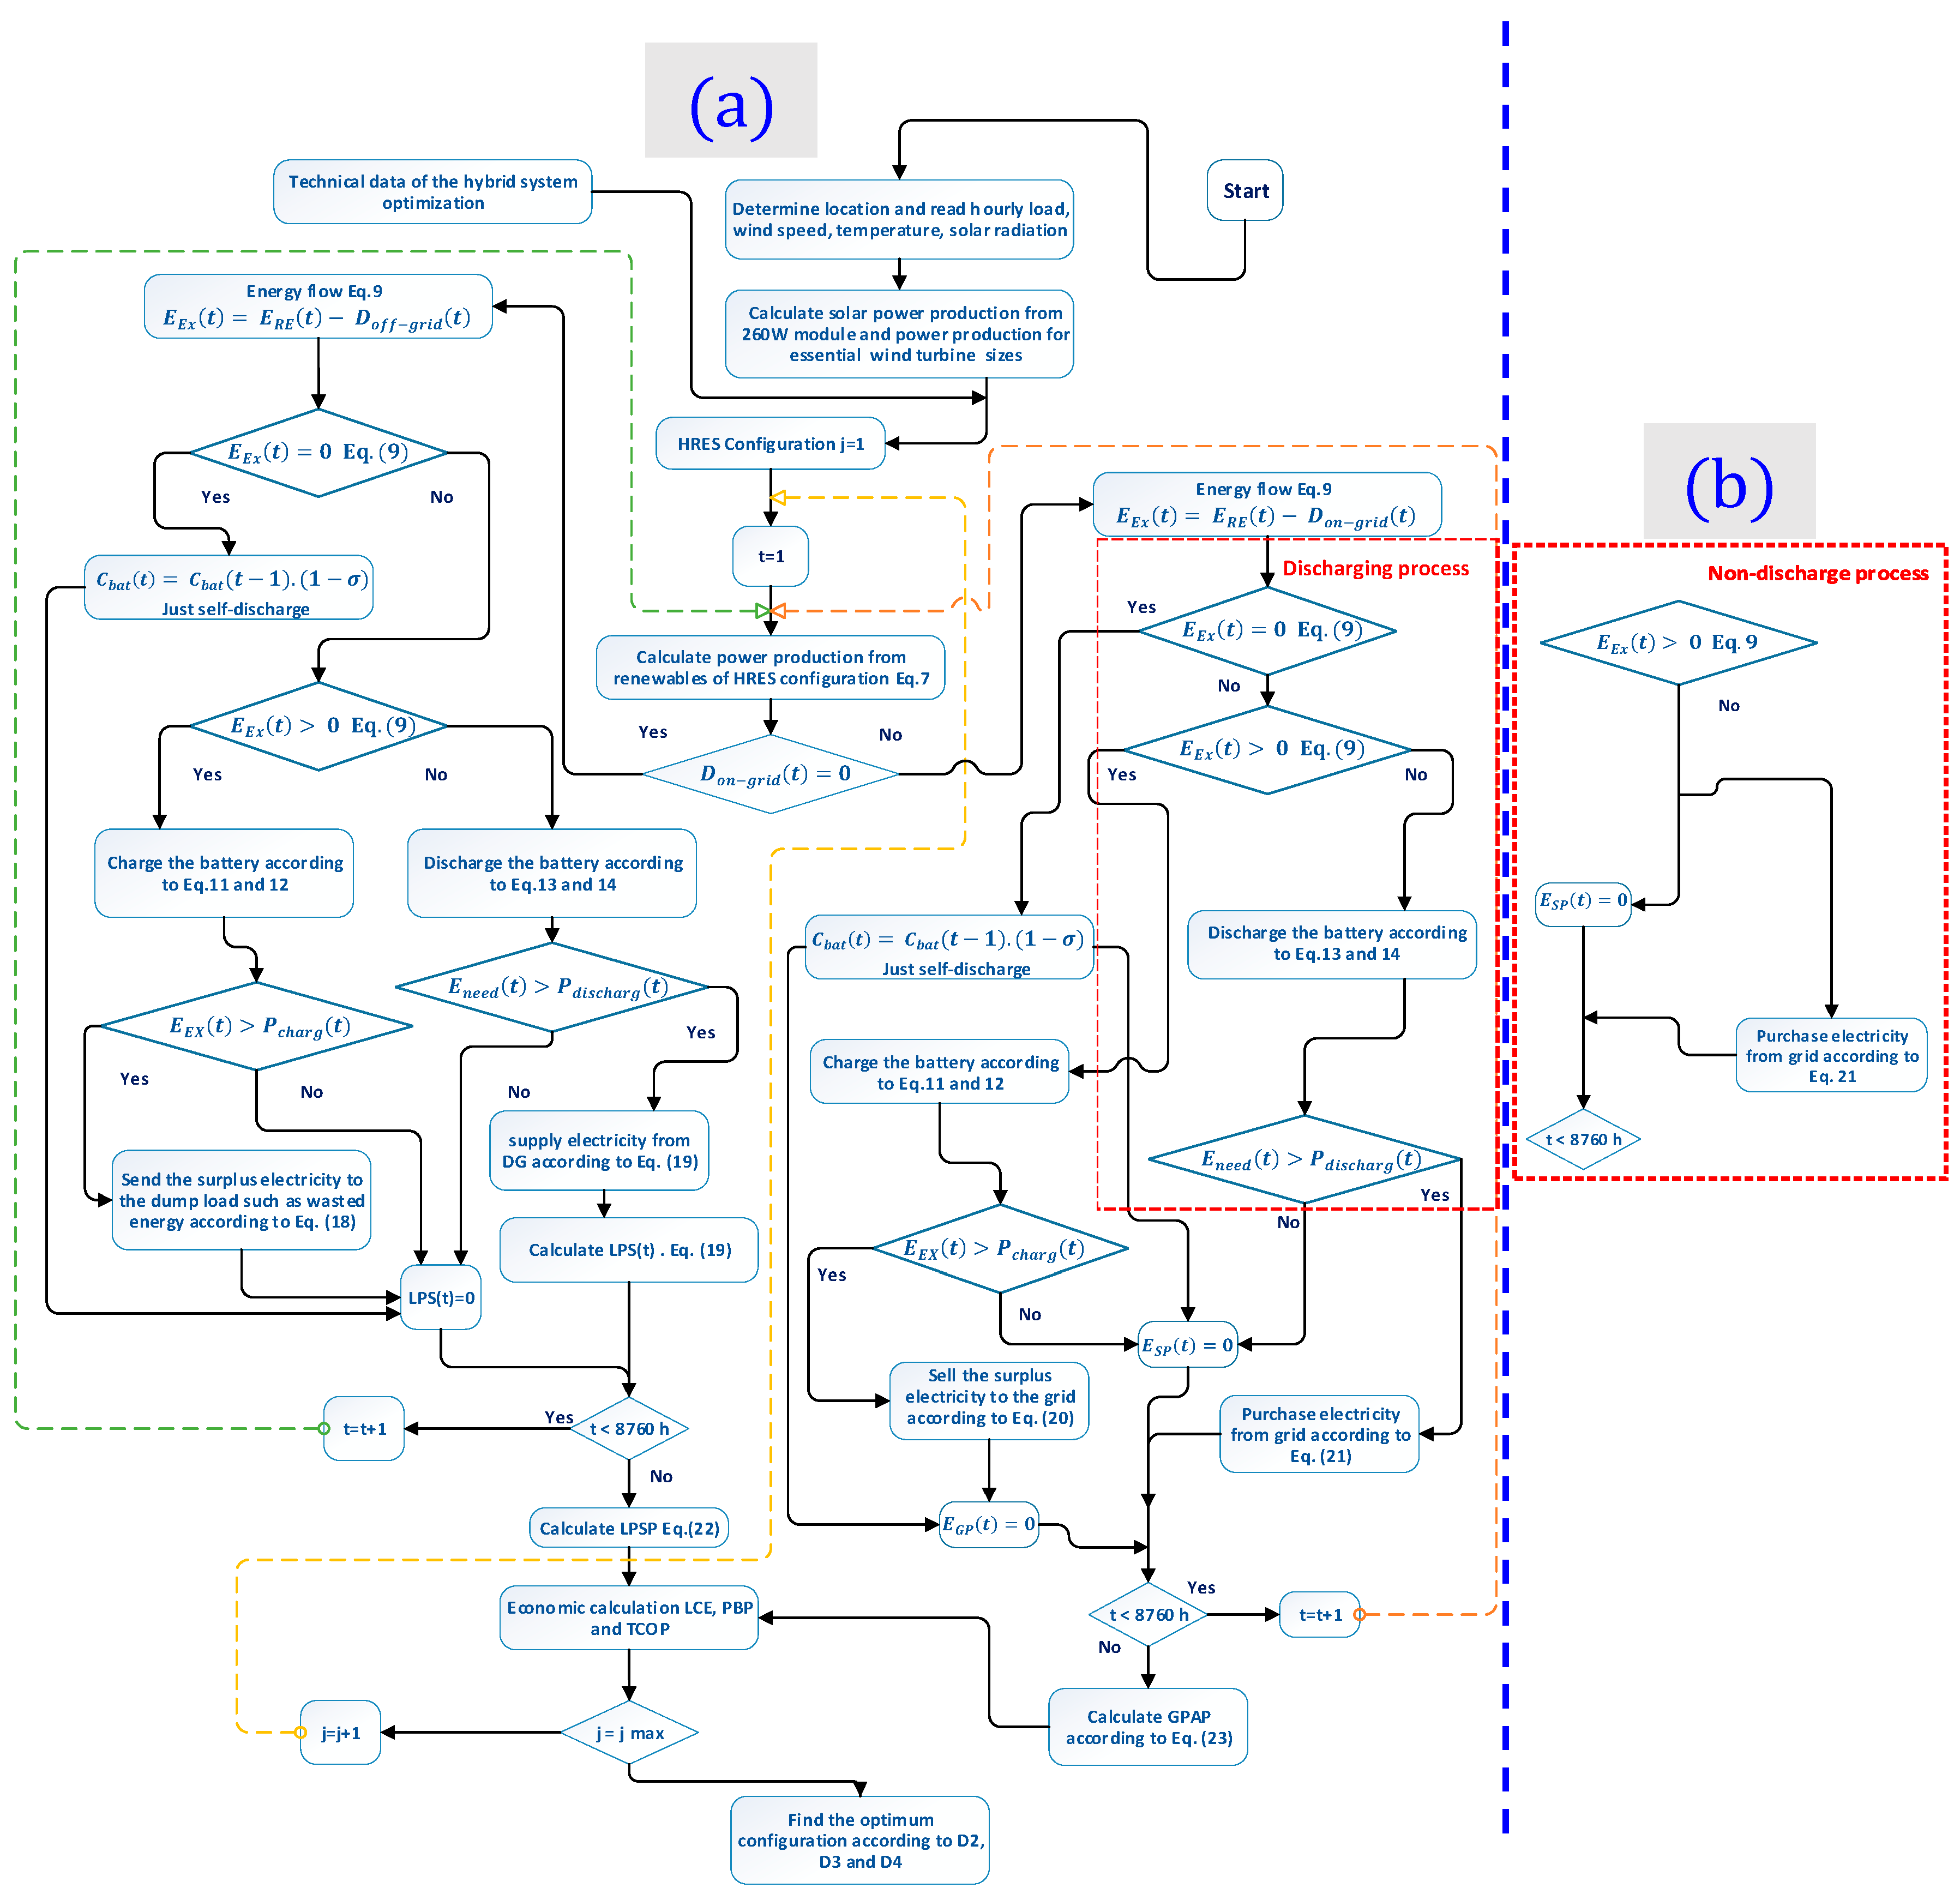
The approach of combining on-grid and off-grid systems is created by using a MATLAB script (On–off-grid Op-HRES) based on Scenario A for off-grid and Scenario B for on-grid, while discharging the battery based on 2017 or 2015 IBT prices, as illustrated in Figure 5a.
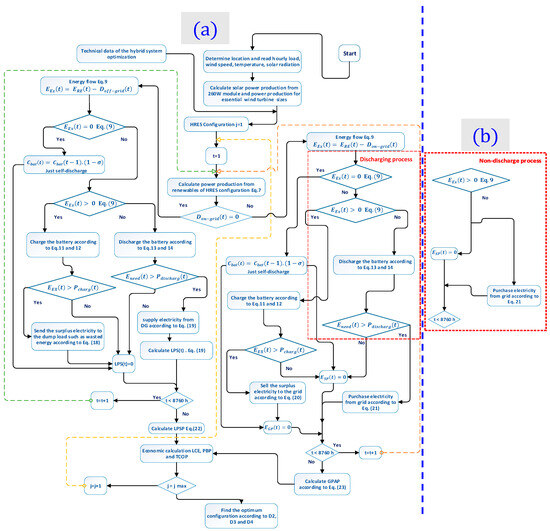
Figure 5.
Flowchart of the optimization process for the On–off-grid Op-HRES with battery discharging in the case of on-grid depicted by the dotted red box in (a), while the red box in (b) represents the flowchart of the non-discharging process.
Firstly, one year of hourly on–off-grid demand data, hourly wind speed data at 2 m, 12 m, 15 m, 18 m, and 20 m, hourly ambient temperature and hourly solar radiation (GHI, , ) are prepared according to site coordinates. Secondly, solar power production for the Polycrystalline 260 W system is calculated for different sizes of the solar system. Power production of the selected sizes of wind turbines according to typical hub heights is calculated. Then, technical information, which is related to the battery, and financial information, such as the cost of renewables’ components and IBT prices, are calculated.
The optimization process starts from the first configuration and continues until the last configuration number 10,136, while the simulation starts from t = 1 h and ends at t = 8760 h for each configuration by calculating the in Equation (2). The important step in the simulation is the decision that must be taken by On–off-grid Op-HRES according to the on-grid demand condition. If , the code will run the configuration through the off-grid based on Scenario A off-grid, while if , the code will run through the on-grid according to Scenario B on-grid with discharging.
According to Case 1 in Scenario A off-grid, the HRES should satisfy the. If in Equation (4), the should be estimated by Equation (10). If in Equation (4), the battery should be charged using Equations (6) and (7). If >, the surplus electricity will be sent to the dump load as follows:
According to Case 2 when in Equation (5), the demand should be satisfied by discharging the battery according to Equations (8) and (9). According to Case 3, when or , the required electricity to cover the demand will be supplied by the generator as follows:
where is the energy from the diesel generator DG. The deficit energy will be determined as LPS at time step , i.e., , while when and during the charging and discharging processes. At this point, the simulation will move to the next step ( + 1) and check if the on-grid demand is still zero or if there is supply from the grid. If , the MATLAB script will run the HRES through the on-grid process according to Scenario A for on-grid with discharging the battery.
According to Case 1 in Scenario B for on-grid, should be satisfied. If in Equation (9), the battery capacity should be estimated according to Equation (10). If , the battery should be charged using Equations (6) and (7). If >, the surplus electricity will be sent to the grid, expressed as follows:
According to Case 2 when in Equation (10), the demand is satisfied locally by discharging the battery according to Equations (8) and (9). According to Case 3, when , the required electricity to cover the demand will be purchased from the grid as follows:
In Equation (18), is equivalent to the in the off-grid case. In this case, the purchased electricity from the grid will be estimated based on IBT prices according to Scenario A on-grid with discharge. At this point, the simulation will pass to the next step (+1) and, then, continue until 8760 h of the simulation.
The performance of any configuration over 8760 h of simulating must be evaluated. The optimization should choose the configuration that shows the min LPSP. Loss of Power Supply Probability (LPSP) is defined as the ratio of summation of all hourly loss of power supply (LPS) when there is no interaction with the grid over the total load as follows [57,58]:
In addition, the optimization should choose the configuration that shows the min GPAP for a considered period t = 8760. Grid Power Absorption Probability (GPAP) is the ratio of purchased electricity over the total demand during 8760 h, calculated as follows [41,59]:
Additionally, the performance of configuration should be evaluated based on economic constraints such as LCE and PBP as described in Section 4.
3.4. On–off-Grid System without Discharging
The energy flow management (EFM) of this strategy is integrating between on-grid and off-grid systems as explained in Section 3.3, but without discharging the battery when even when or . The energy deficit will be covered by purchasing electricity from the grid to satisfy the on-grid demand. The stored energy will be kept for the next job in the off-grid mode to increase the battery lifetime according to Scenario C for on-grid without discharging, as illustrated in Figure 5b, that can be substituted by the discharge process in the red dots box in Figure 5b. The performance of HRES will be evaluated by LPSP in the case of off-grid, and GPAP in the case of on-grid, as well as based on LCE and PBP in terms of economic assessment.
4. Systemic Economic Constraints
In order to determine the optimal configuration, both economic (LCE and PBP) and reliability (LPSP and GPAP) constraints should be considered. Economic constraints are described as follows.
4.1. Levelized Cost of Energy
The Levelized Cost of Energy (LCE) is used to estimate the price of electricity generated by the HRES [60,61,62,63]. It is defined as the ratio of the total annualized project cost (Levelized Annual Cost, LAC, as expressed in Equation (21)) to the annual financial flow discounted for the Annual Energy Production (AEP), as expressed in Equation (22).
where is the Capital Recovery Factor, and is the Total Present Value [64]. In this study, Equation (22) is modified to include different parameters to estimate LCE precisely and to match the Iraqi housing requirement [36] as expressed in Equation (23).
are the Levelized Annual Costs of battery, wind turbine, PV solar system and inverter, respectively. stands for annual surplus electricity (KWh), is the annual energy(KWh) that is purchased from the grid, and is the annual energy (KWh) that is generated by the diesel generator. The Annual Energy Load (KWh) consumed by demand, is denoted as and is calculated using the following formula:
where , and are expressed in Equation (25), Equation (26), and Equation (27), respectively.
4.2. Payback Period
Payback period (PBP) represents the duration needed to recoup the Total Capital of Project (TCOP), through the Net Annual Cash inflow of AEP () generated by the project itself and calculated as follows [65]:
The Annual Saving (AS) replaces here the . The ASS represents the annual cost savings achieved by implementing the HRES instead of relying solely on the grid or generator to meet the total demand, defined as follows:
where is the cost of electricity from the national grid based on IBT, is the net of monthly demand costing after using the HRES, is the monthly demand, is the monthly energy production by HRES, and is the cost of monthly demand.
The cost of monthly on-grid demand is calculated based on IBT. The cost of monthly off-grid demand is estimated based on the price of a local generator (as mentioned in Section 2.1). In the case of on-grid, the represents the net grid trade between the surplus electricity by HRES and grid purchases from the grid, calculated in the following form:
where is the consumption hours. If , then due to no payback policy from the national grid in Iraq if surplus electricity is injected to the grid. In the case of off-grid, the represents the cost of the rest of monthly demand that is covered by generator, such that the following applies:
The price of electricity from the generator is estimated in Section 2.1. Accordingly, in the case of on-grid and off-grid demand, the Annual Saving ( in this project is expressed as follows:
According to Equation (33), the PBP can be determined as follows:
where and refer to TCOP for wind turbine, solar system, battery, and inverter, respectively.
5. Verification with Homer Software
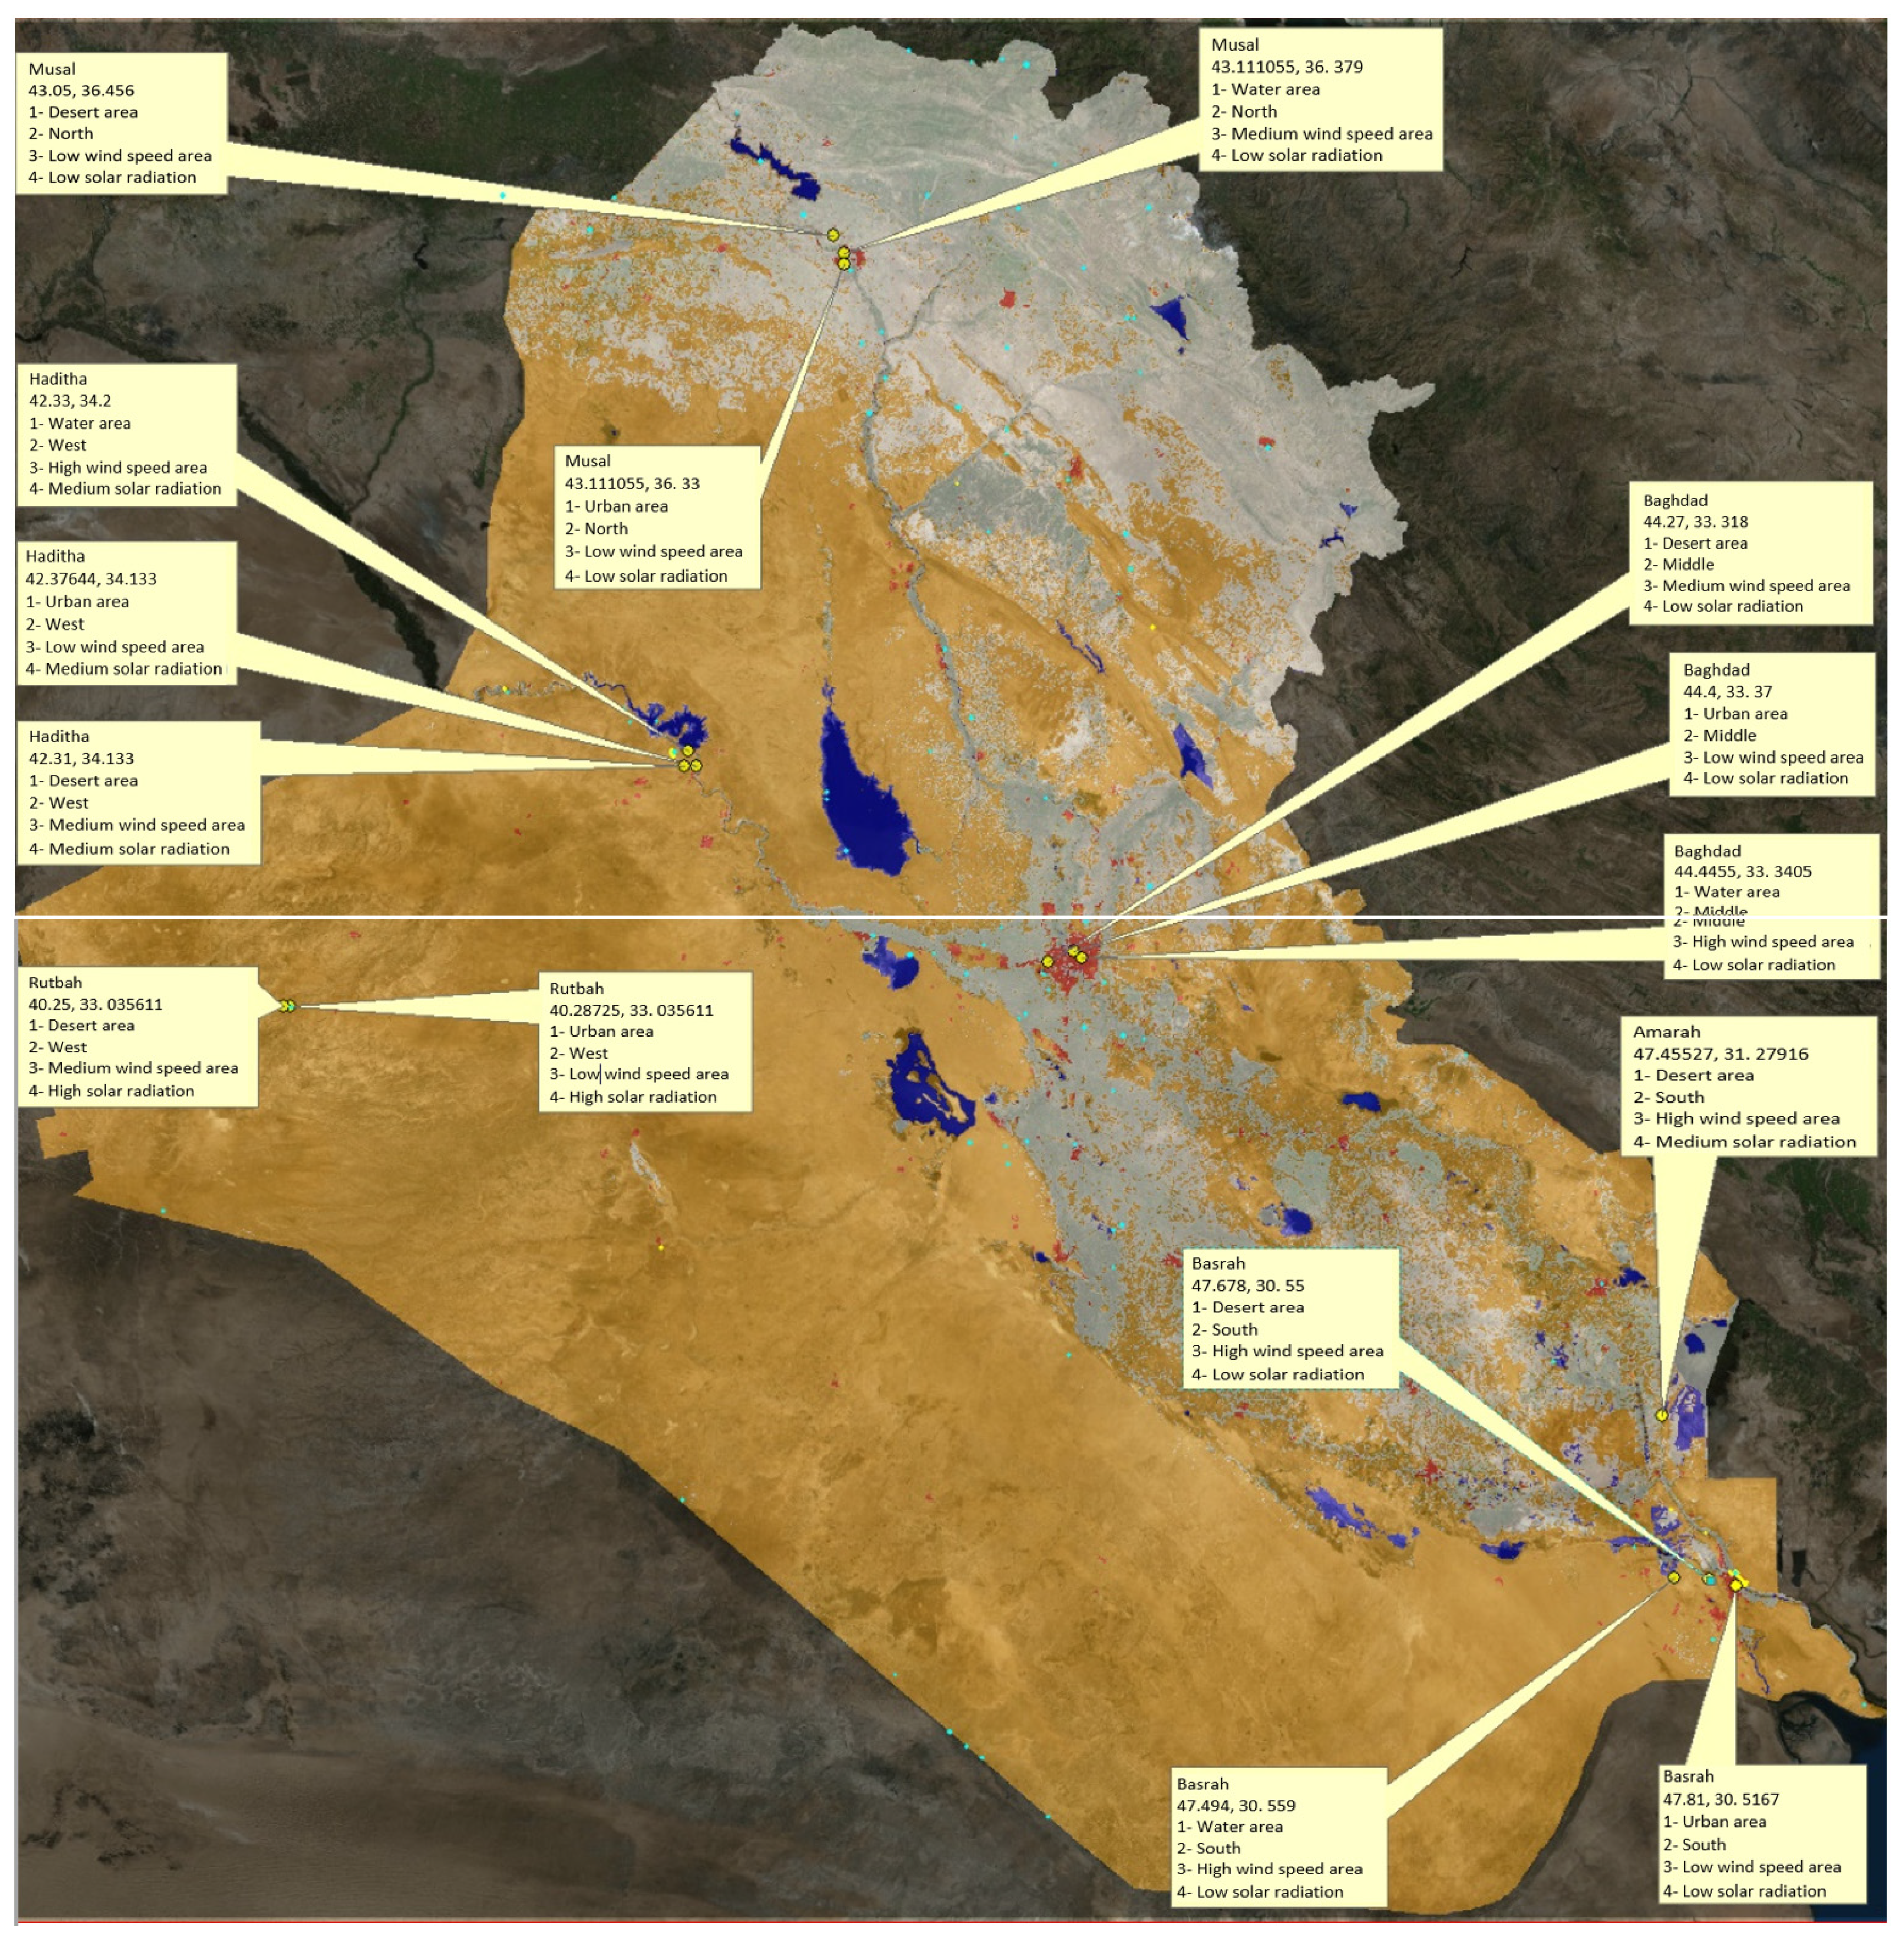
To verify our On–off-grid Op-HRES model, we compared the data with those produced using the Homer Pro® microgrid software (Version 3.14.5), developed by National Renewable Energy Laboratory (NREL), USA, [66] with consistent constraints of Renewable Fraction (RF) and total Net Present Cost (NPC) [49]. Varying component sizes were employed in both models, including different wind turbine sizes (2 kW to 10 kW), PV sizes (3.12 kW to 10.4 kW), and Li-ion battery sizes (11.7 kWh and 23.4 kWh). BG on-grid demand as detailed in Section 2.1, and shown by Figure 2 has been used in this verification based on the Amarah location as shown in Figure 6 [36]. The results exhibited strong agreement overall, except for a discrepancy in PV production. This difference arose from Homer model’s lack of consideration for the cooling effect due to wind speed (Table 2).
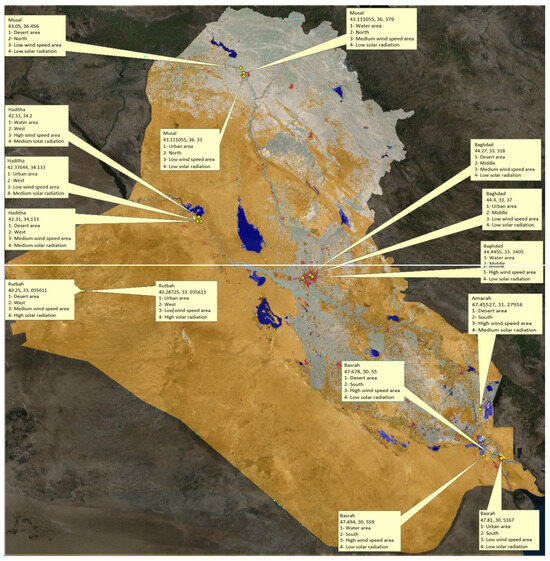
Figure 6.
Showcases six selected locations for potential HRES based on wind speed and solar radiation variability. Four of them comprise three sites each, categorized by land cover types (water, desert, and urban), while the remaining locations feature both desert and urban areas.

Table 2.
Verification between On–off-grid Op-HRES and Homer models.
6. Results and Discussion
The optimal design of HRES in Iraq is evaluated based on six selected locations (Figure 6). The geographical spots in Figure 6 are chosen based on critical factors, including land cover type, solar radiation, and wind speed. These features are mentioned in each label to describe the characteristics of each location (Figure 6). The section discusses several key aspects related to HRES design and performance. Firstly, it examines the evaluation of the energy flow management (EFM) and IBT prices. Secondly, it explores the effect of different land use cover on the optimal configuration of HRES. Additionally, it discusses the impact of weather variation on the performance of HRES in Iraq.
6.1. Evaluation of Energy Flow Management and IBT Prices
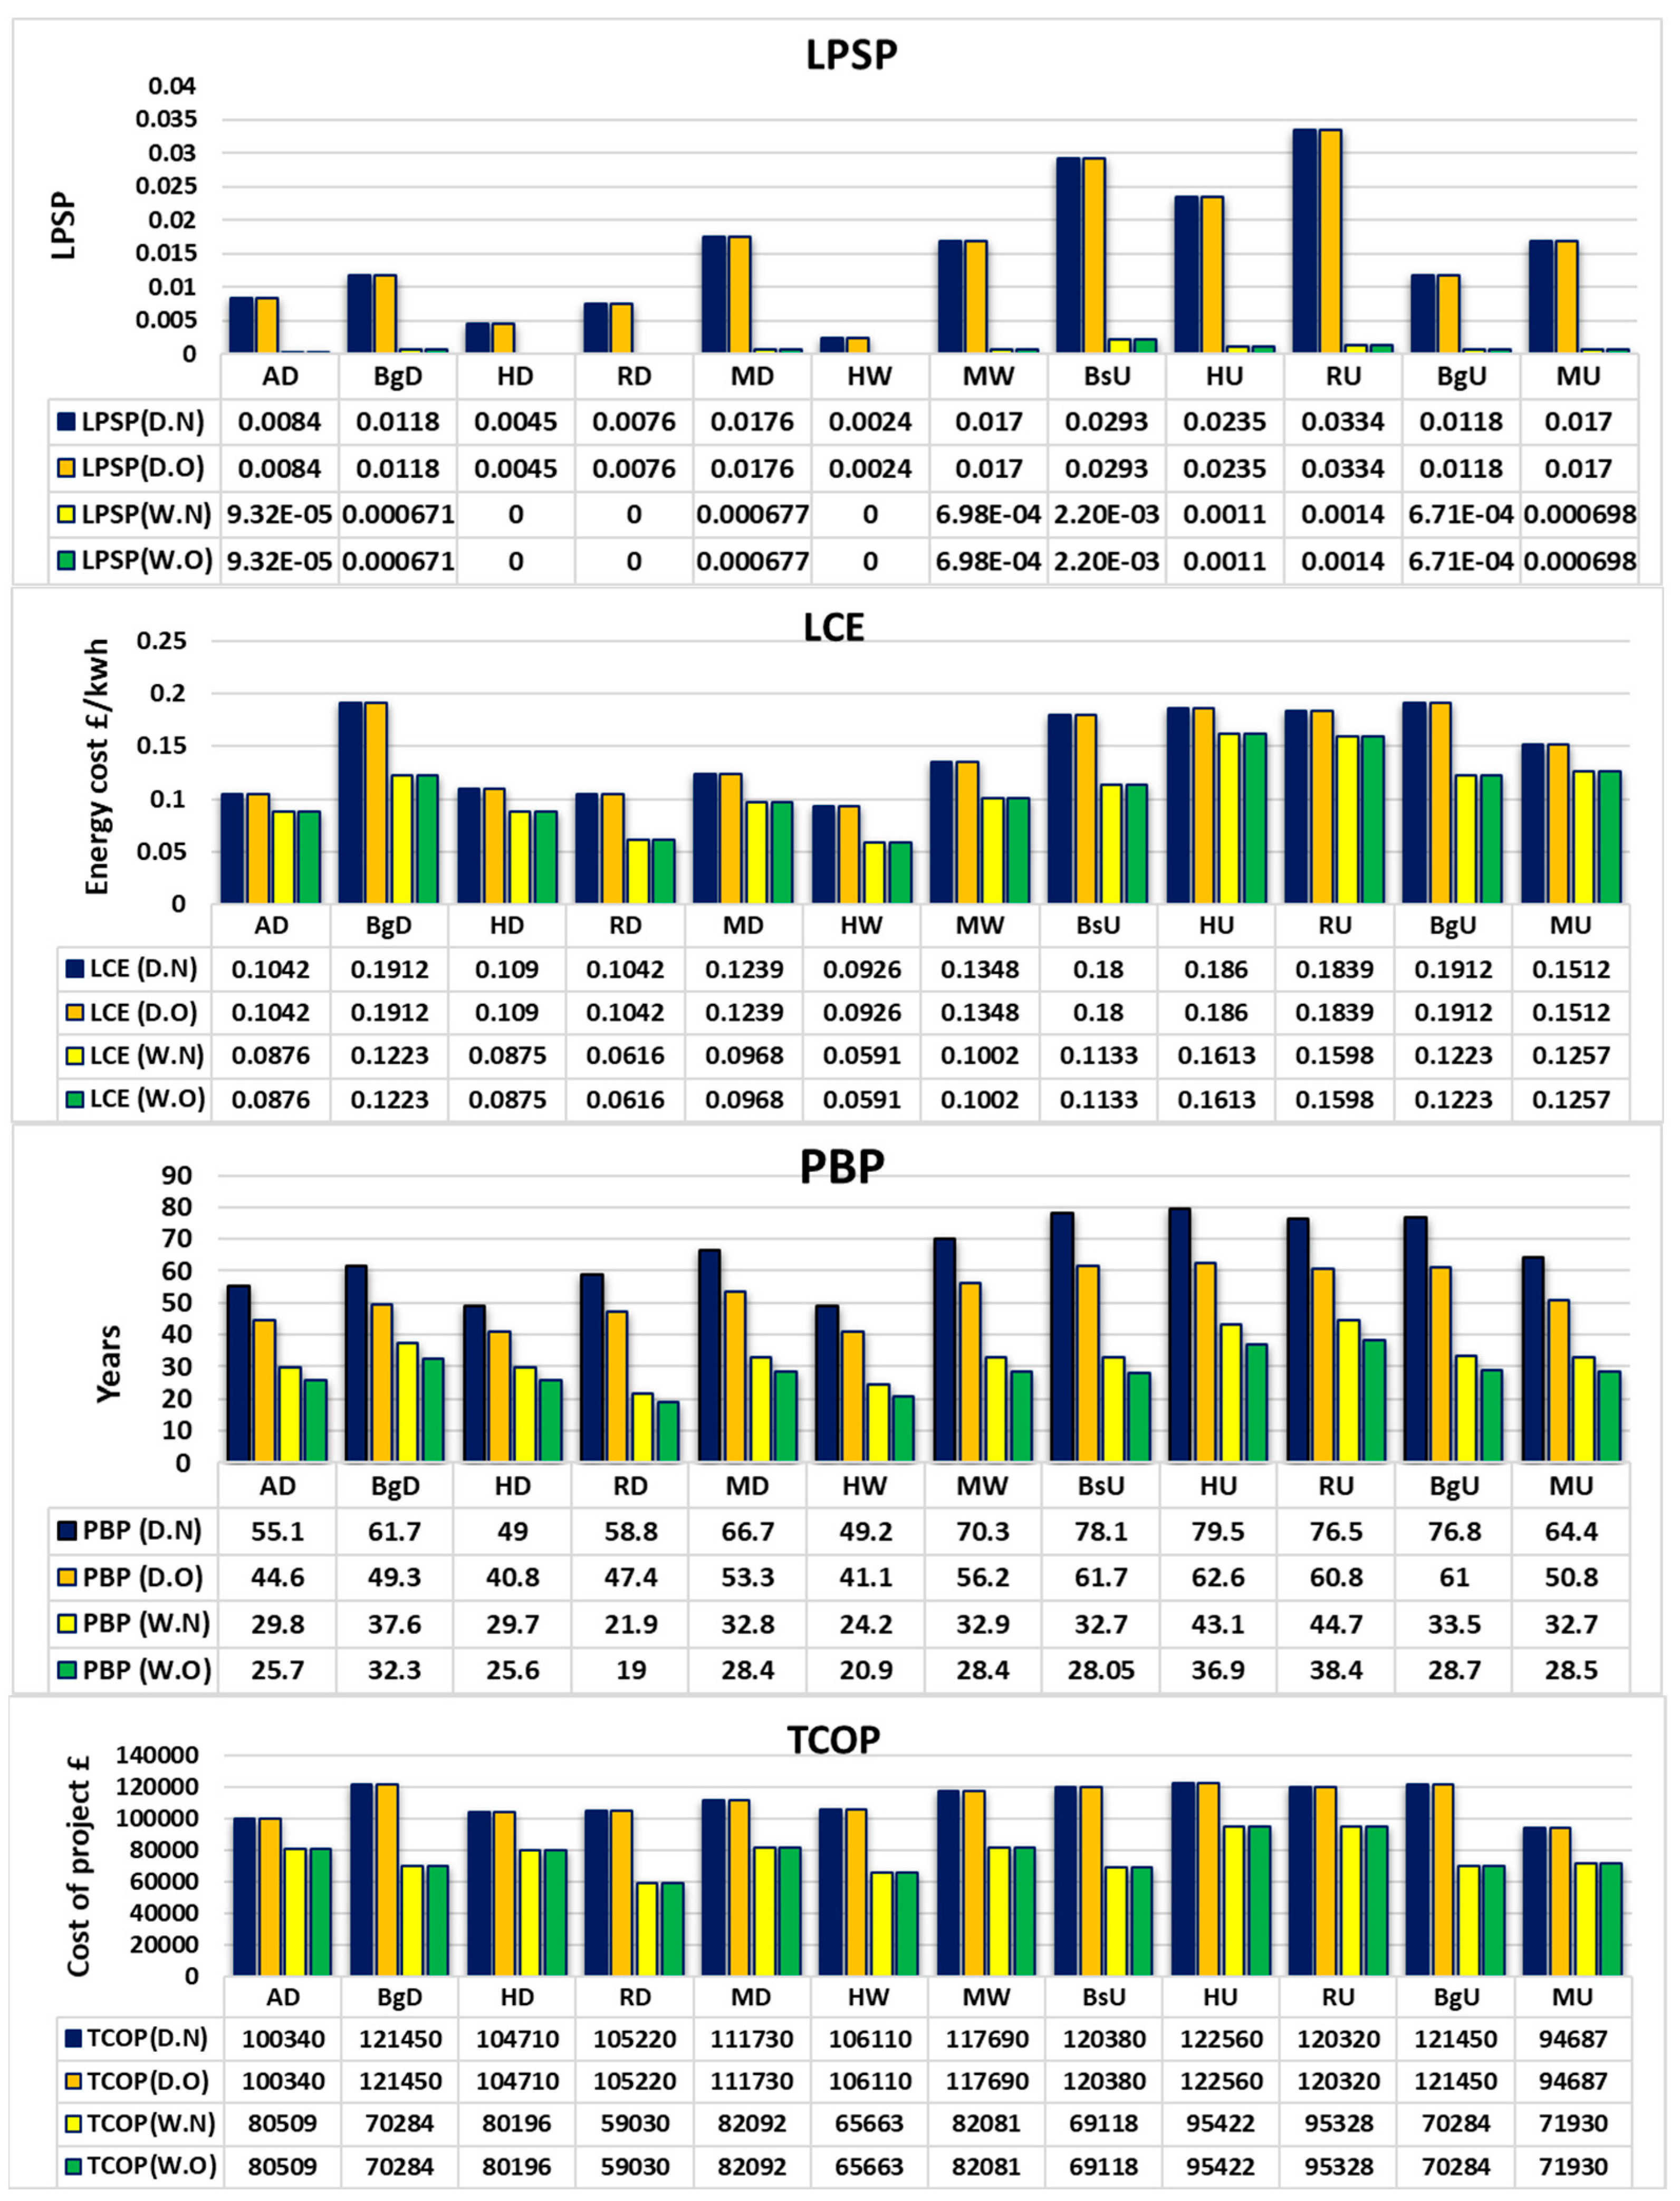
The prioritization of off-grid demand coverage holds utmost importance in terms of ensuring reliability. The EFM and IBT prices play a significant role in optimizing the performance and selecting the most cost-effective configuration for the HRES. To determine the effectiveness of different energy flow management strategies, Scenario B on-grid with discharging (D) and Scenario C on-grid without discharging (W) were examined based on grid demand. Various objectives and constraints, such as LPSP, GPAP, LCE, PBP, TCOP, and CSZ, were utilized to identify the optimal configuration using 2D analyses. Regarding the LPSP and LCE objectives, the results indicate a high level of reliability and lower cost of energy when the battery is not discharged (Scenario C during on-grid mode) for both the 2015 and 2017 IBT prices (W.N and W.O), as depicted in Figure 7. Furthermore, the findings reveal that Scenario C exhibits the lowest LPSP and LCE values. Consequently, Scenario C is deemed the most favorable choice.
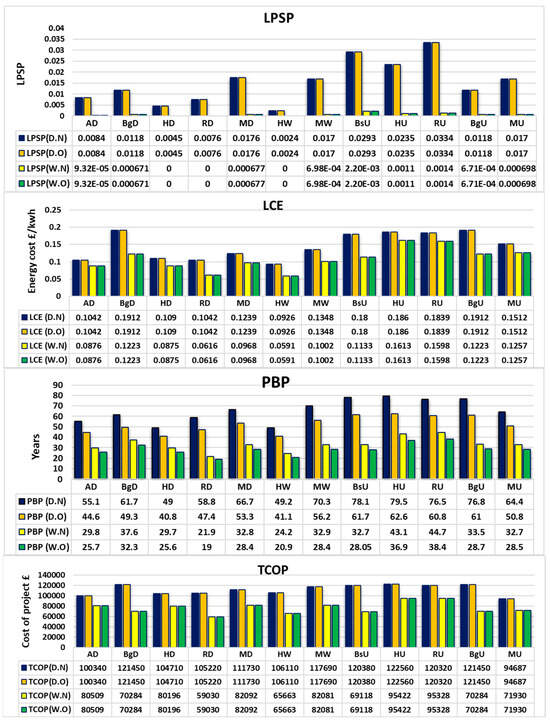
Figure 7.
Evaluation of LPSP, LCE, PBP, and TCOP for different optimal configurations across 12 locations in Iraq using BG demand and the 2D strategy. Abbreviations: D.N (Discharging battery, 2017 IBT price), D.O (Discharging battery, 2015 IBT price), W.N (Without discharging battery, 2017 IBT price), W.O (Without discharging battery, 2015 IBT price). Locations: AD (Amara Desert), BsU (Basra Urban), RU (Rutbah Urban), MU (Musal Urban), HD (Haditha Desert), BgU (Baghdad Urban), MW (Musal Water), MD (Musal Desert), HW (Haditha Water), HU (Haditha Urban), BgD (Baghdad Desert), RD (Rutbah Desert).
In addition to Scenario C, the influence of land cover, specifically desert and water areas, plays a crucial role in positively affecting the reliability and cost of energy by facilitating a high availability of wind energy due to higher wind speeds, for example, in Haditha, with water and desert areas, and Rutba, characterized by desert areas. According to Figure 7, the payback period (PBP) has demonstrated a consistent and gradual decline, which can be attributed to three key factors: changes in the scenario, alterations in the IBT pricing policy, and variations in land cover types such as desert, water, and urban areas. Specifically, the PBP is significantly influenced by the modified Annual Saving (AS) method (Equation (34)), replacing Equation (28) utilized for estimating the PBP.
The transition of EFM from the (D) to (W) scenario type has yielded noteworthy outcomes in terms of TCOP, as illustrated in Figure 7. This reduction in TCOP can be primarily attributed to the decrease in the CSZ resulting from the extended lifespan of the battery, as a result of reducing the frequency of charging and discharging cycles and subsequently mitigating the need for battery replacement. In addition to the TCOP reduction, the shift in EFM from (D) to (W) has exhibited a substantial decrease in LCE across all locations, in comparison to both (D.N) and (D.O) scenarios.
6.2. Effect of Land Cover
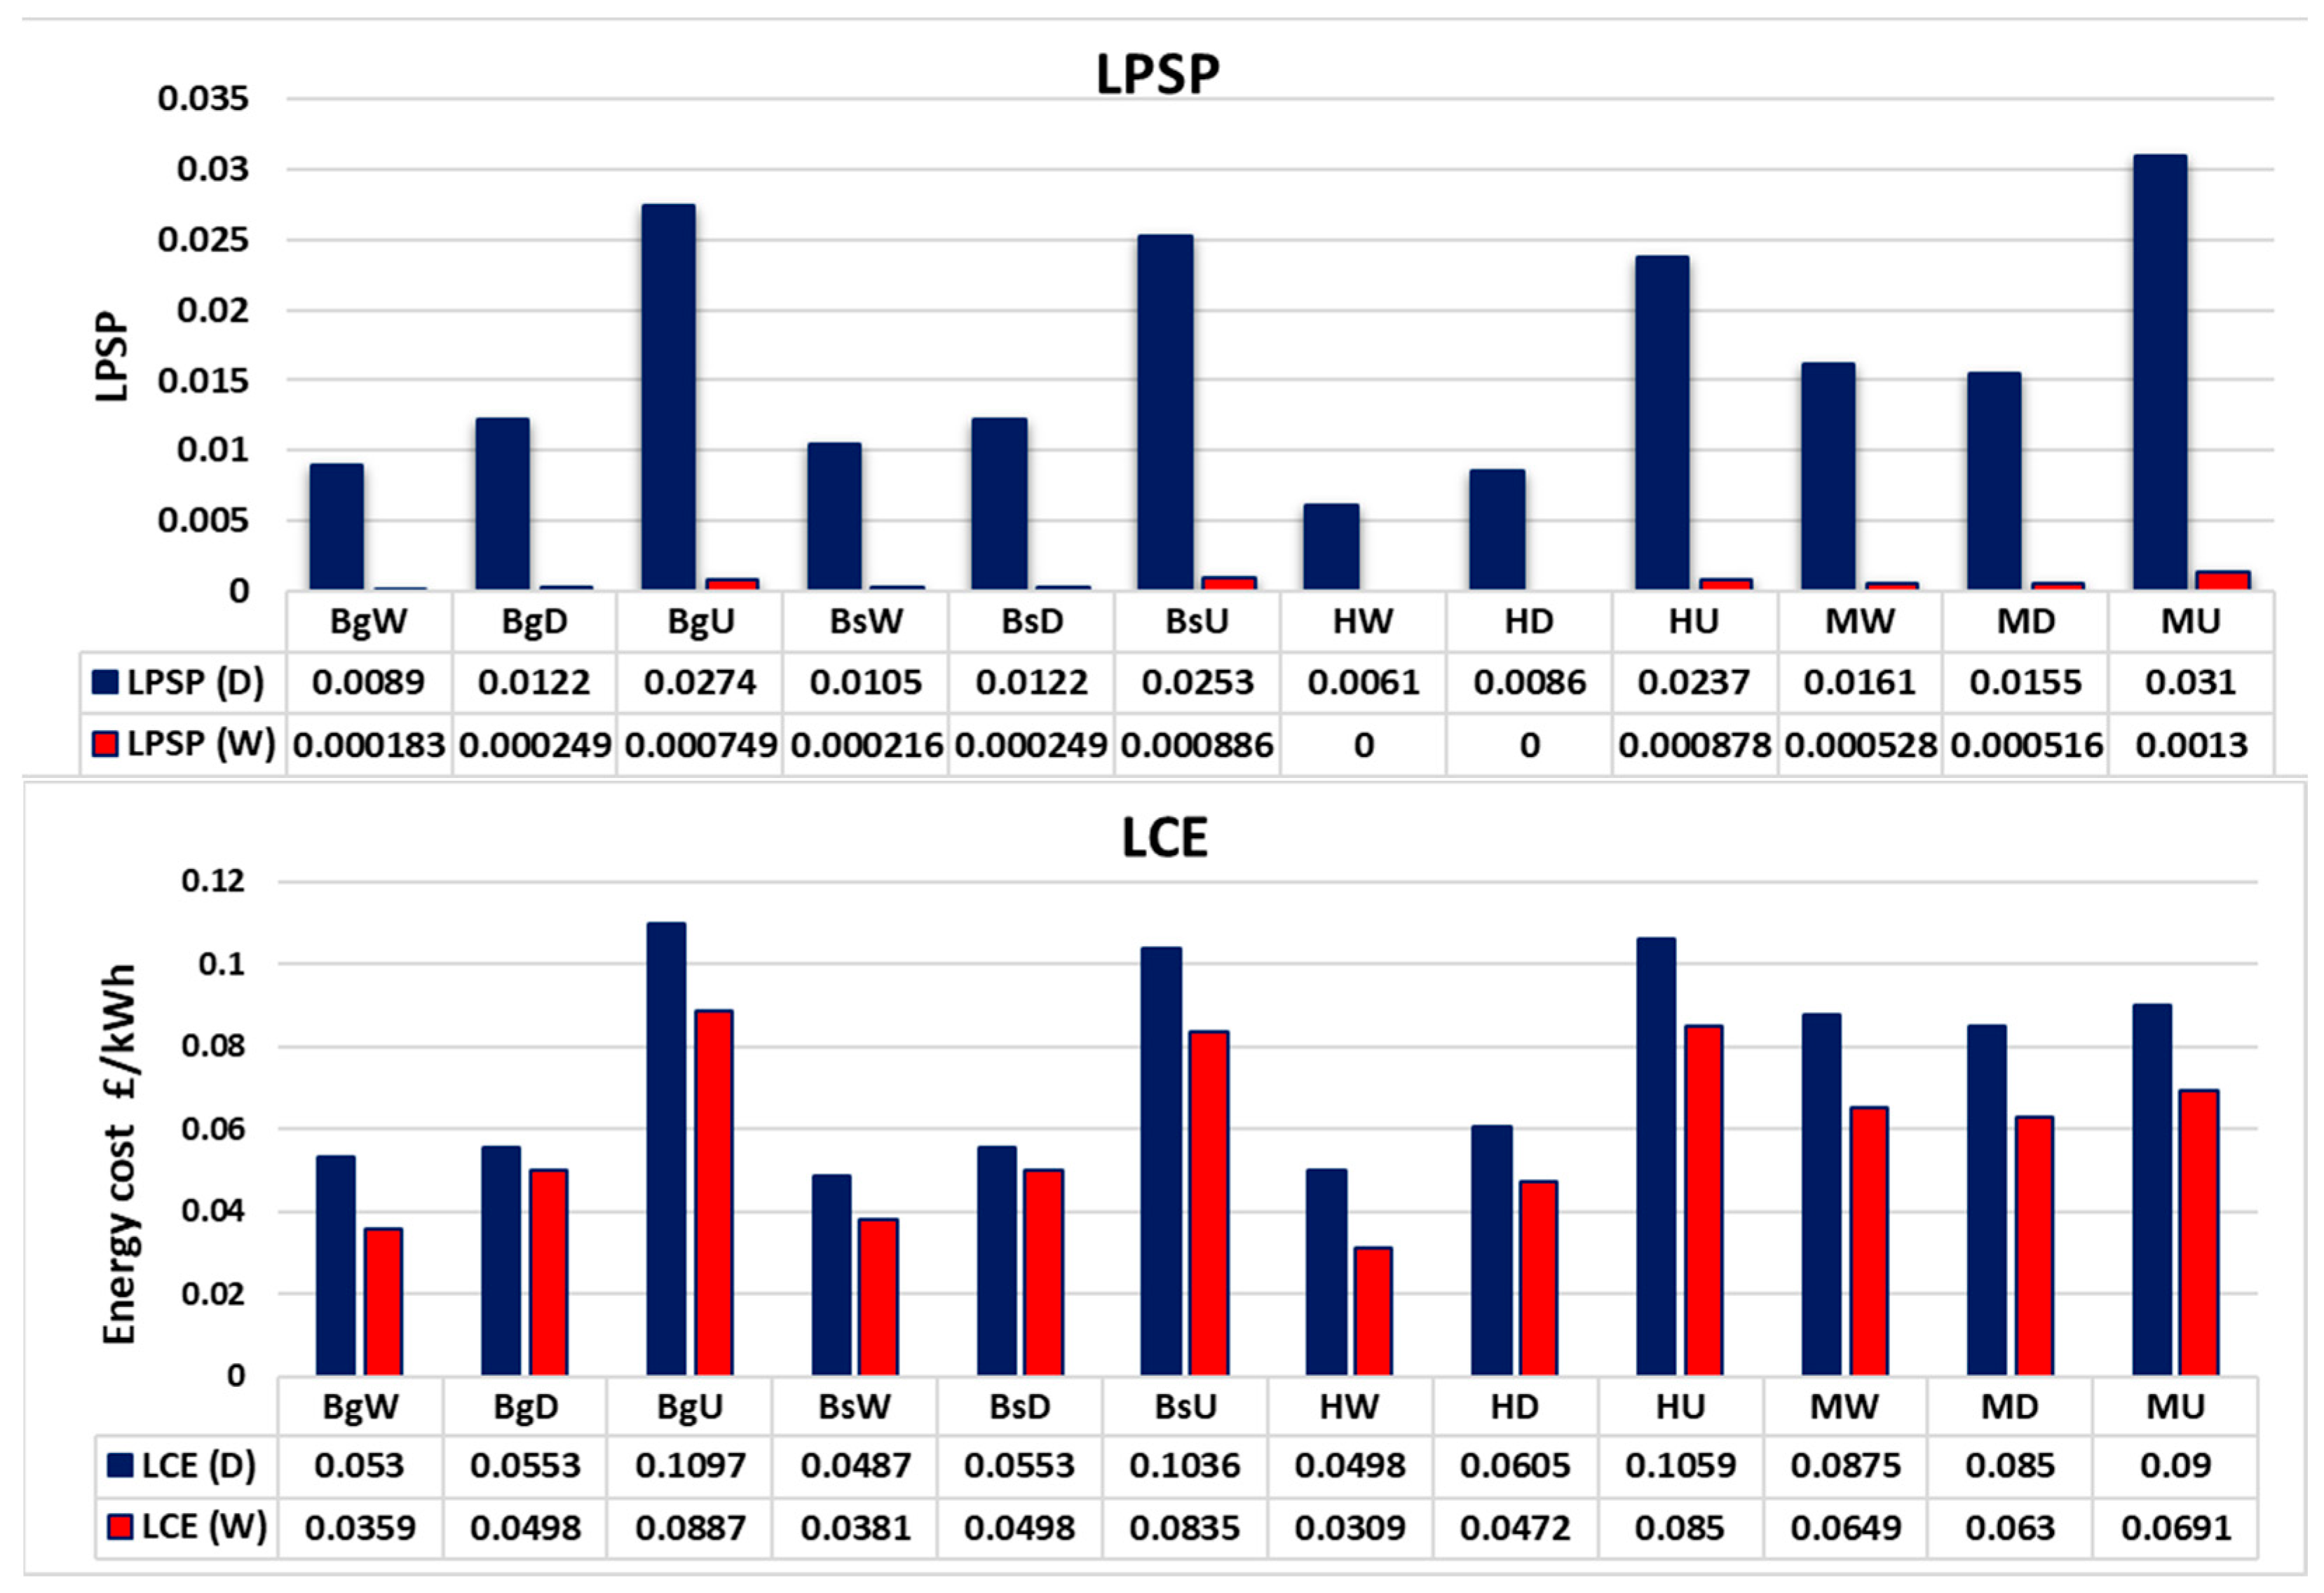
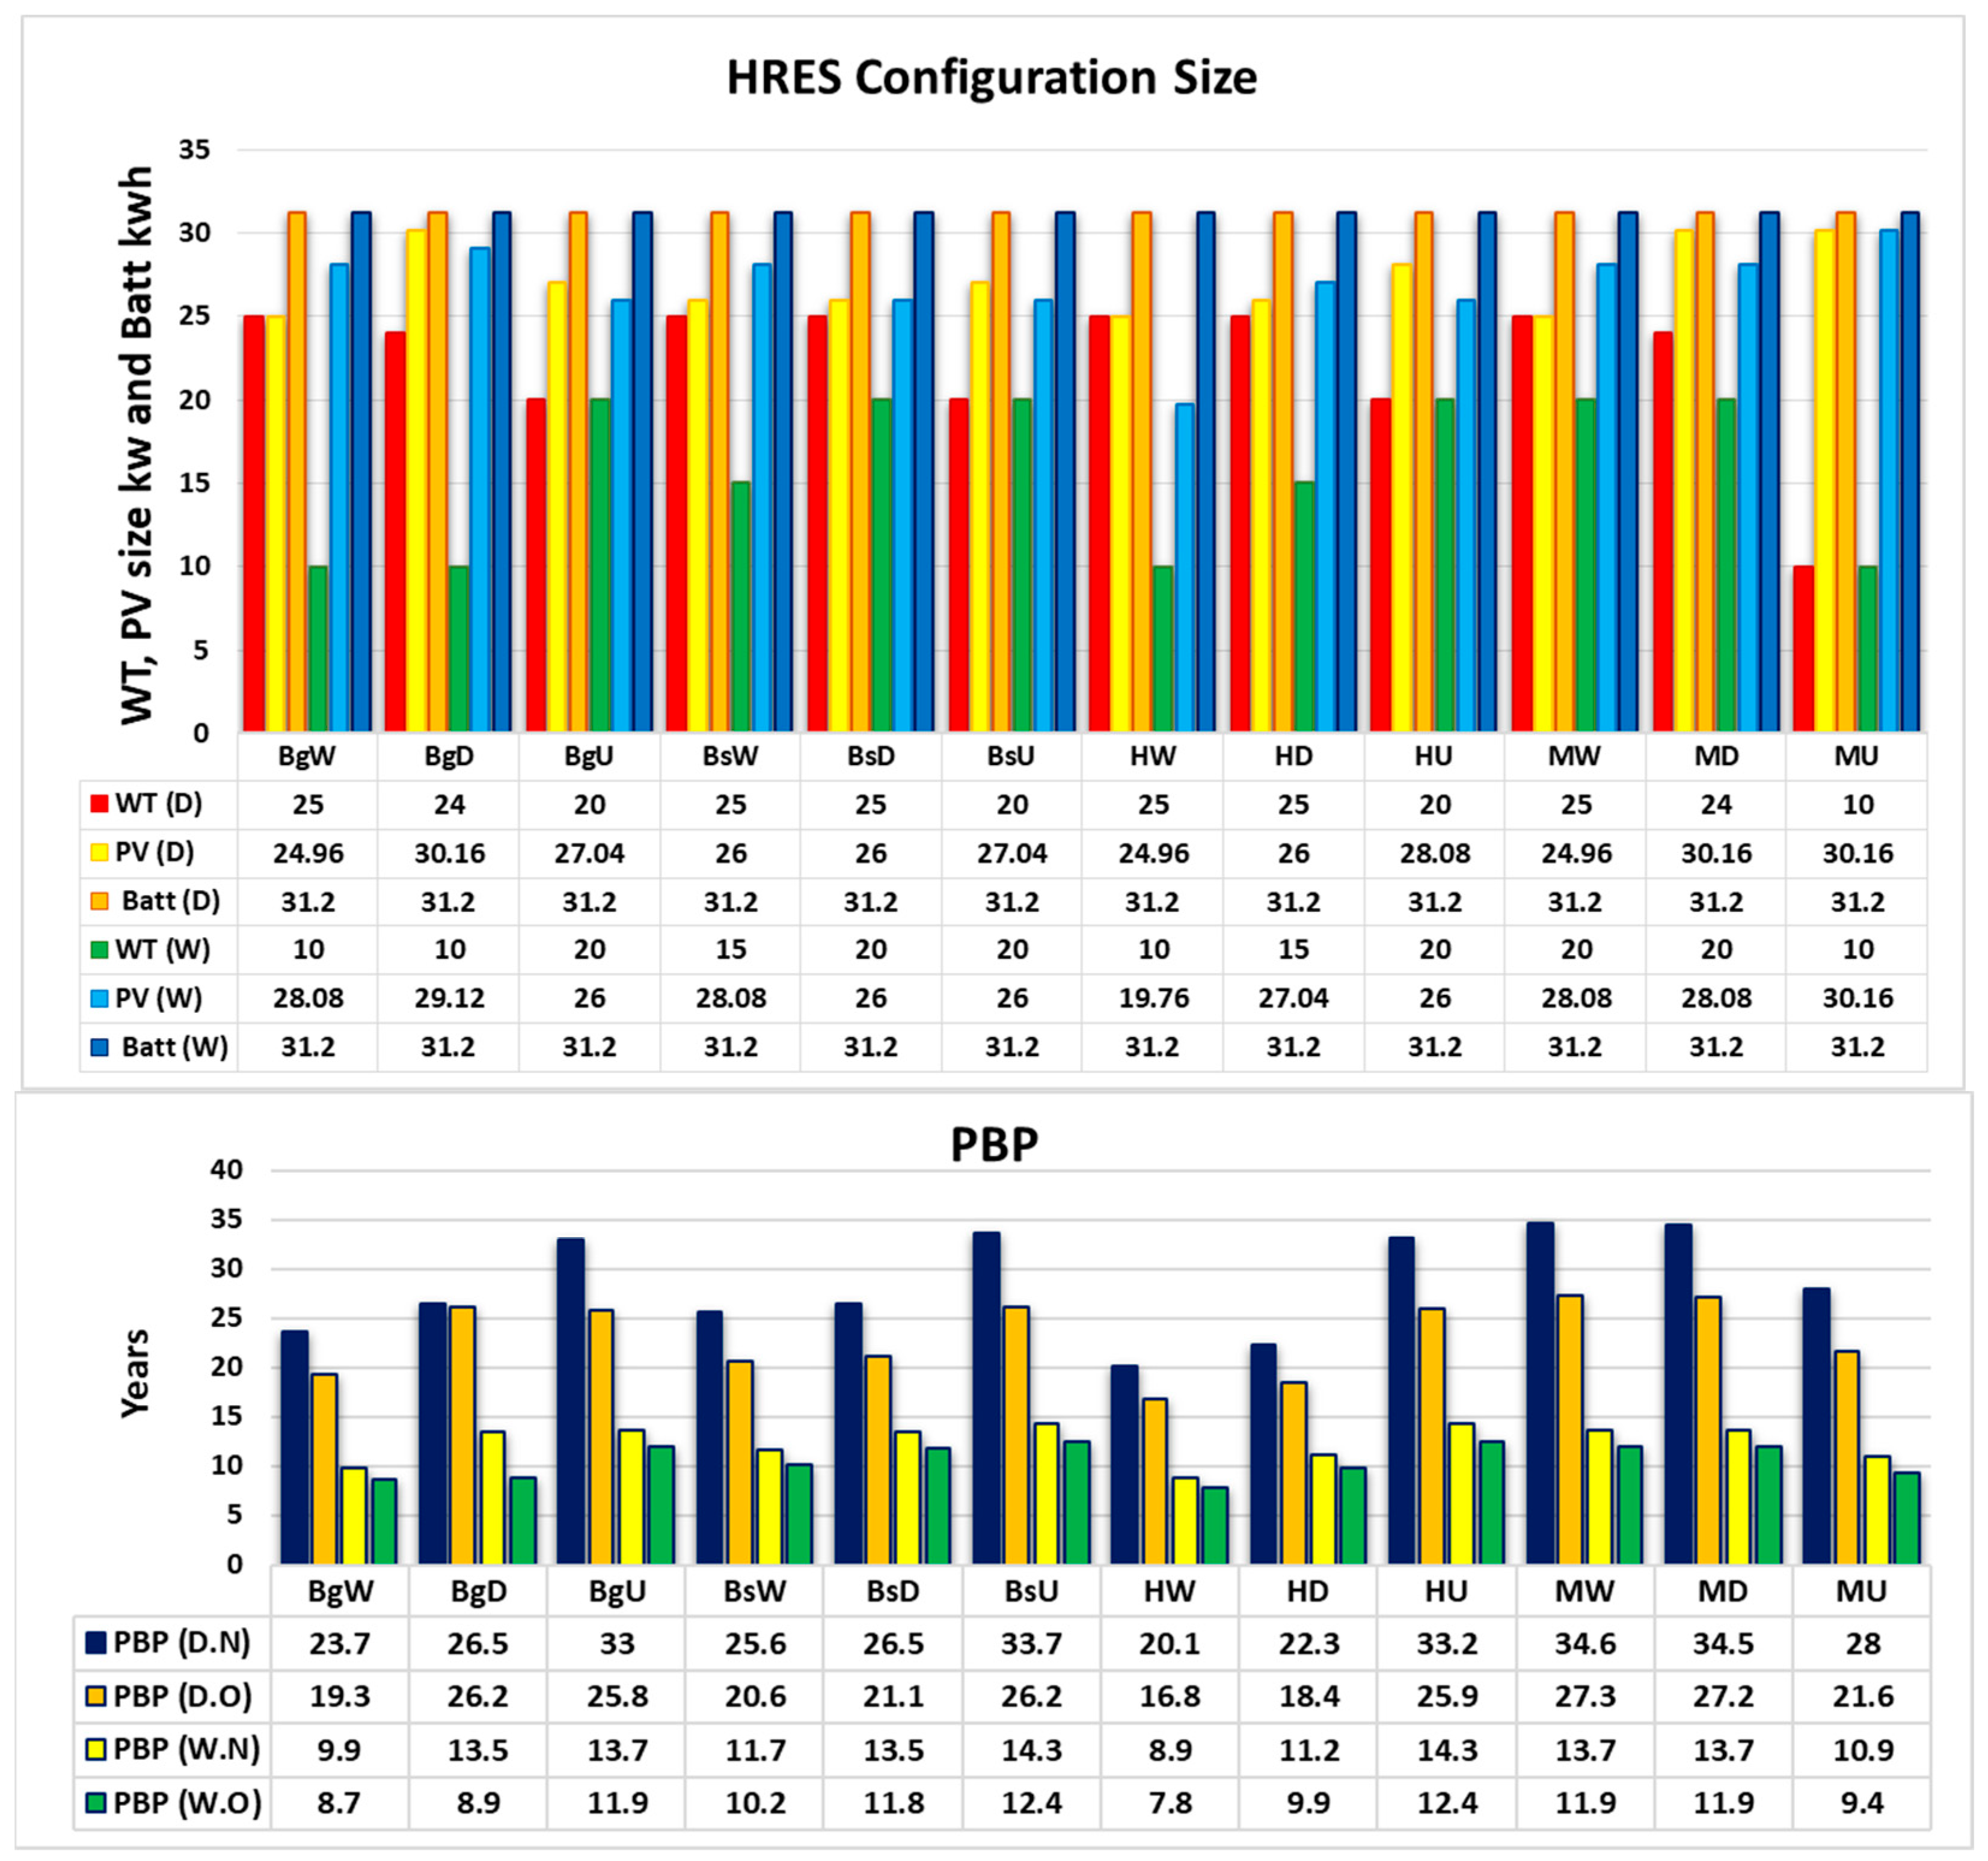
The availability of wind speed is crucial in determining the size of the HRES and its components (PV and wind turbines). The roughness length plays a significant role in influencing wind speed availability across different types of land covers. In water areas, characterized by minimal surface obstructions, near surface wind speeds tend to be higher. Similarly, in desert regions with lower surface roughness, wind speeds can be relatively high. However, urban areas with numerous buildings and structures experience increased surface roughness and turbulence, leading to lower mean wind speeds compared to water areas and deserts. Figure 8 illustrates the impact of land cover on the size of the HRES configuration, LPSP, LCE, and PBP in KR demand based on the 2D scenario.
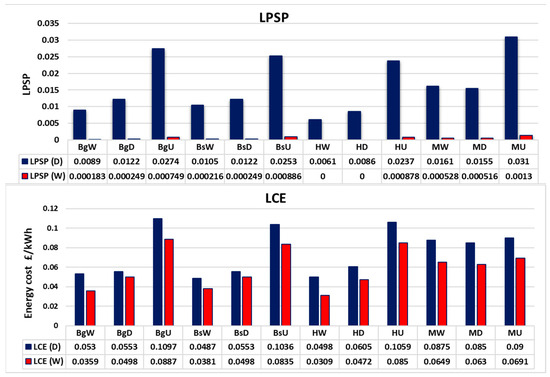
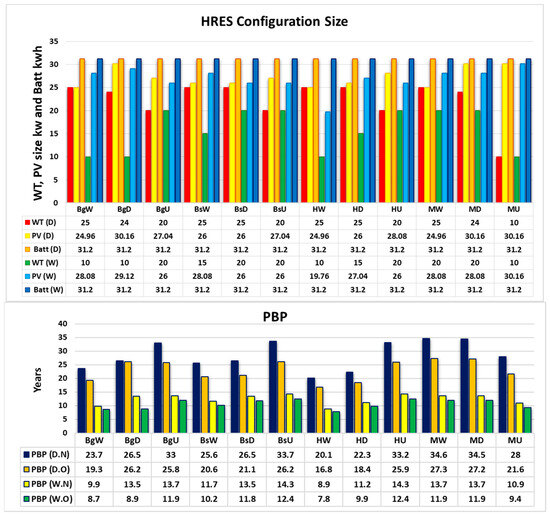
Figure 8.
Predicted LPSP, LCE, PBP, and HRES size used to evaluate the performance of different optimal configurations that were determined for different land use covers (water, desert, and urban) for four locations in Iraq (Baghdad, Basra, Haditha, and Mosul) using KR demand and applying the 2D strategy. D.N, D.O, W.N, and W.O have been used. BgW: Baghdad Water, BgD: Baghdad Desert, BgU: Baghdad Urban, BsW, BsD and BsU: Basra locations, Water, Desert Urban areas. HW: Hadiata Water. HD: Haditha Desert. HU: Haditha Urban, MW: Mosul Water, MD: Mosul Desert. MU: Mosul Urban.
In Figure 8, the reliability of HRES gradually decreases from water to desert to urban areas, as previously mentioned. Conversely, LCE demonstrates an increasing trend with changing land cover, as also depicted in Figure 8, due to the reasons mentioned earlier. The PBP is affected by the same aforementioned factors, including scenario changes, modifications in the IBT pricing policy, and variations in land cover types. For instance, in Baghdad, the PBP is highest in urban areas, followed by desert areas, and finally, the lowest in water areas. This is owing to the roughness length (RL) influencing wind speed availability across different types of land covers: in BgW (RL = 0.0002 m), while in BgD (RL = 0.029 m) and for BgU (RL = 1.1 m).
The conflicting trend in PBP from water to urban areas in Mosul is due to the smaller size of the HRES. This smaller size results from the lower availability of wind and solar radiation in the northern region of Iraq, where Mosul is situated. Consequently, increasing the HRES size to enhance production is impractical due to limited renewable energy resources and the constraints of efficiency and cost. The size of the HRES, specifically the wind turbine, decreases from urban to desert to water areas, which reduces the overall project cost. To compensate for this size reduction, a possible solution is to replace the battery more frequently than before due to the limited number of discharge cycles that a battery can undergo during its lifespan. This need for more frequent battery replacements arises particularly in regions with lower renewable energy input like urban areas.
6.3. Effect of Weather Variation on HRES Performance in Iraq
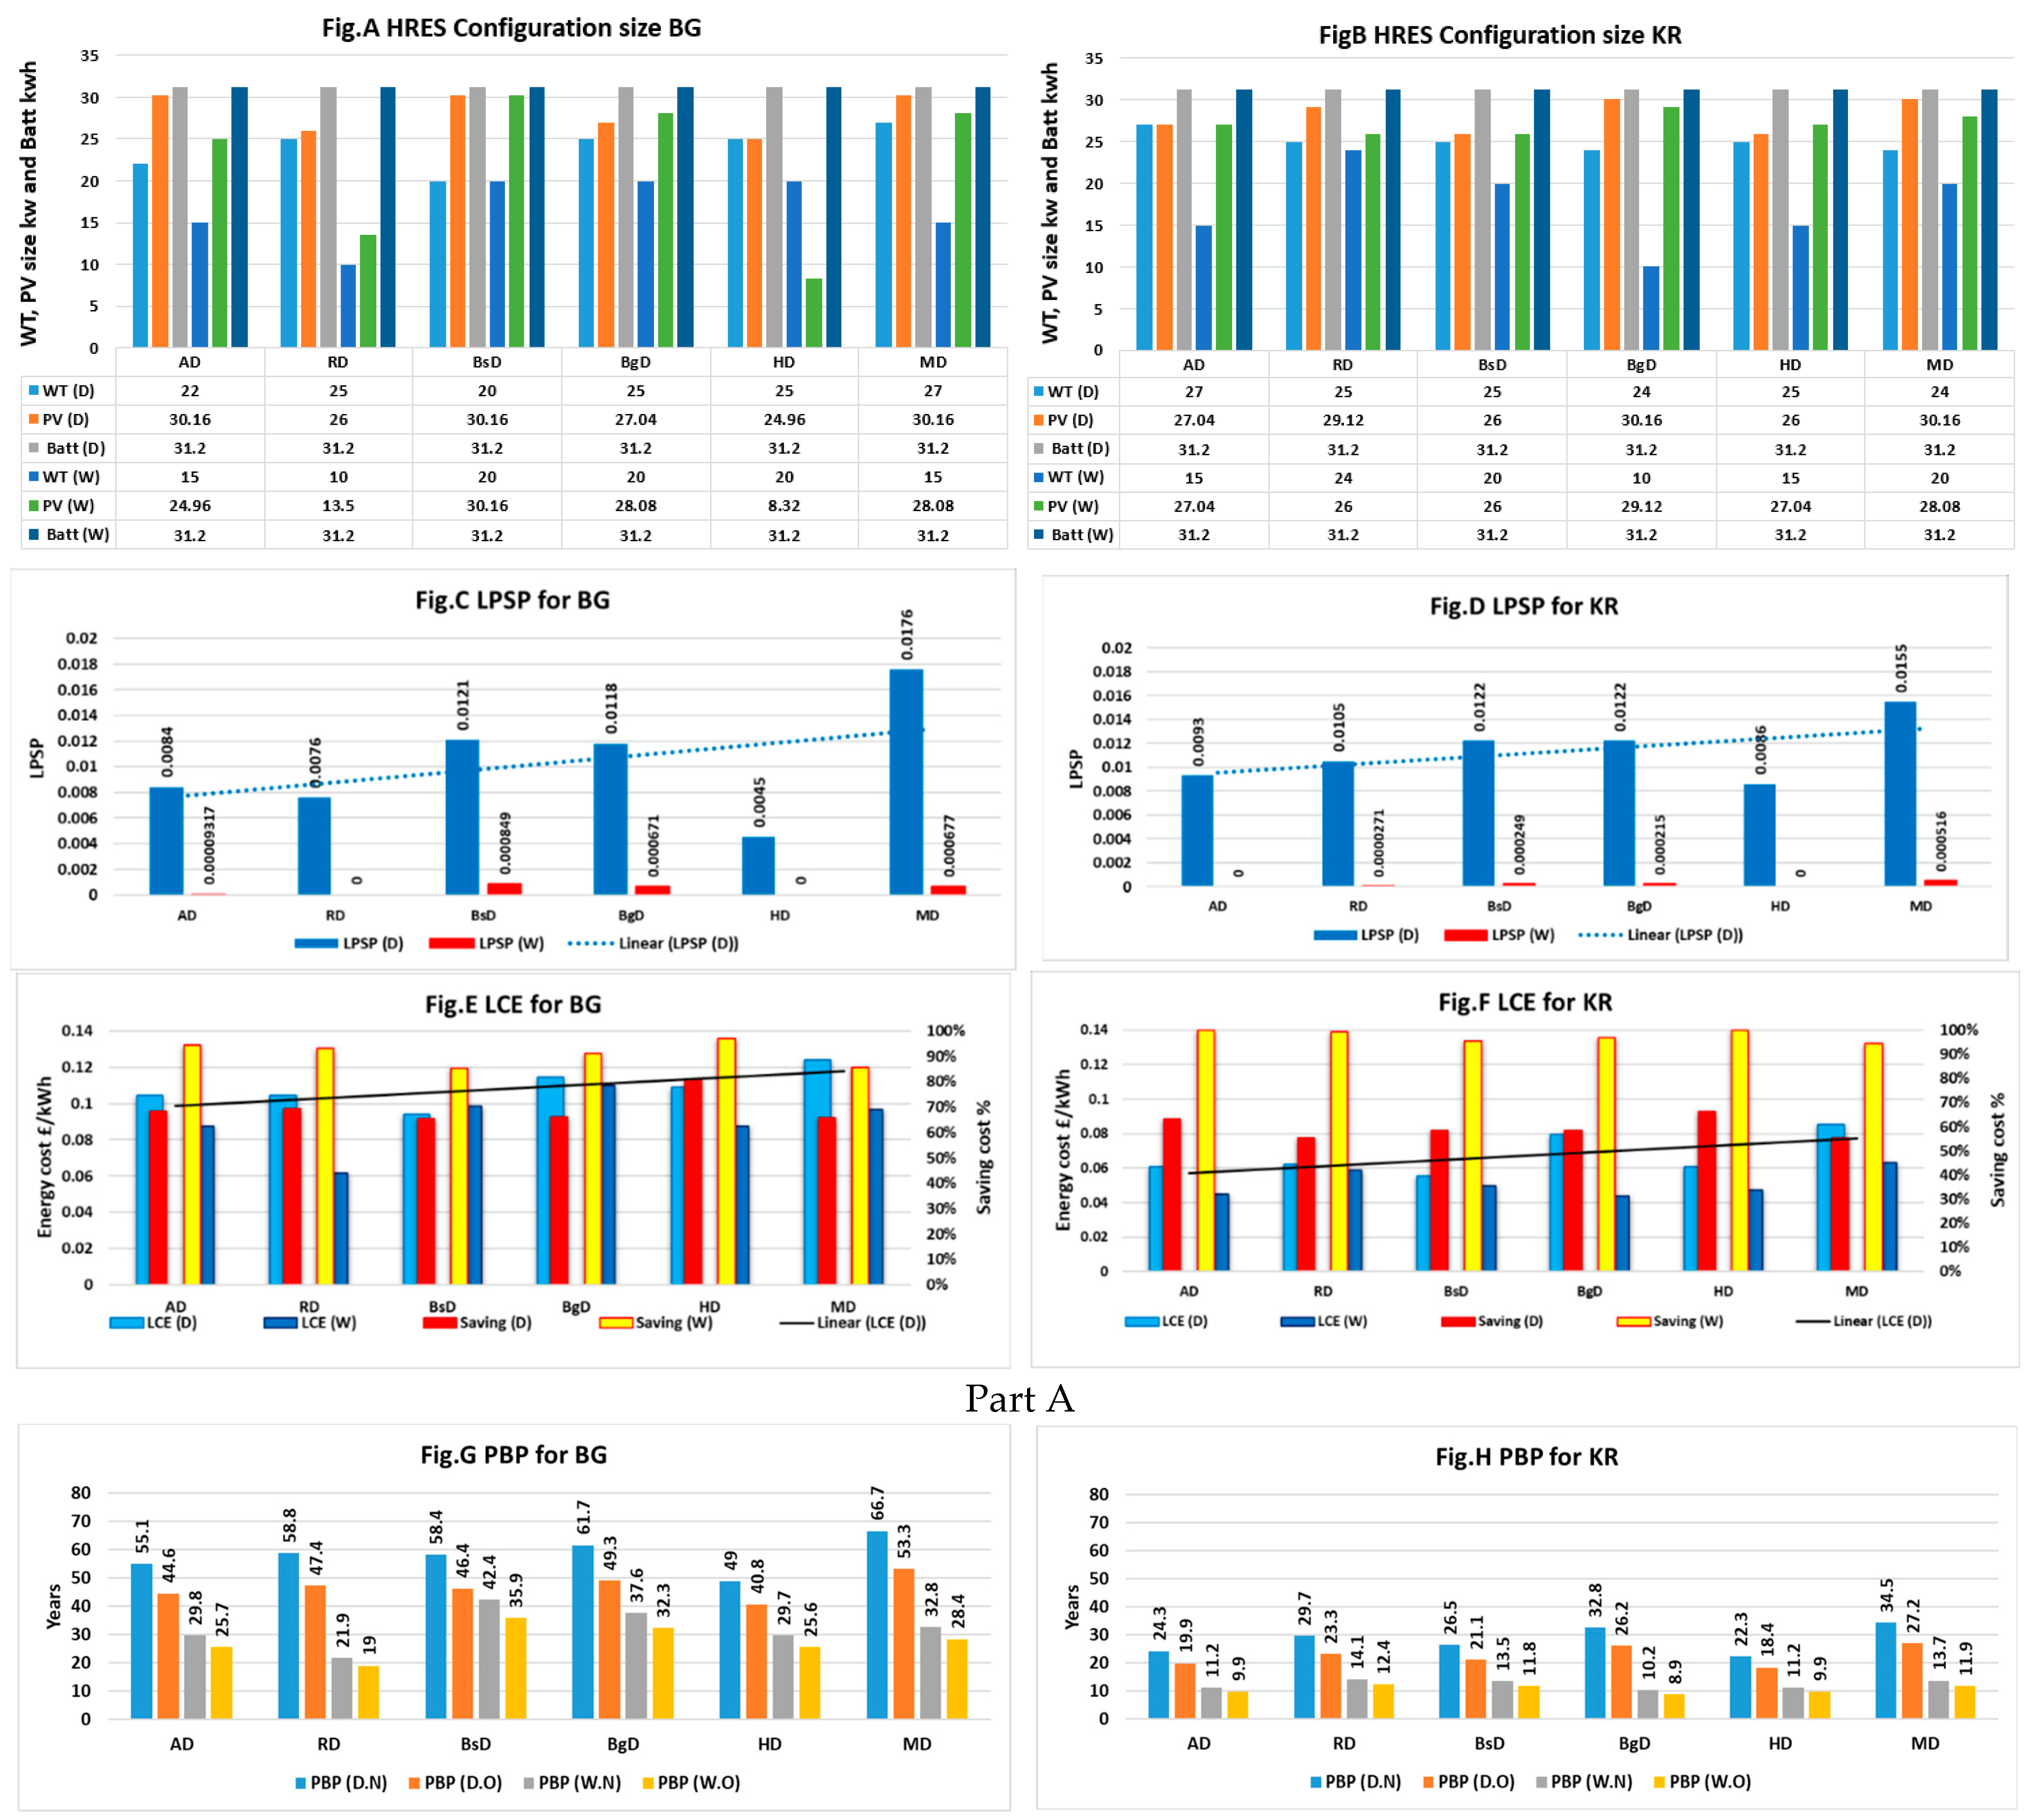
We chose desert areas for this comparison because they provide diverse wind speeds across different locations, offering a realistic representation of weather-induced changes. Urban areas were excluded due to complex airflow patterns, while water areas were not considered because of their stable and minimal wind speed fluctuations. BG and KR demands are utilized in a 2D scenario analysis (as detailed in Section 3.1), considering six desert locations: AD, RD, BsD, BgD, HD, and MD. The performance of different optimal configurations is illustrated in Figure 9.
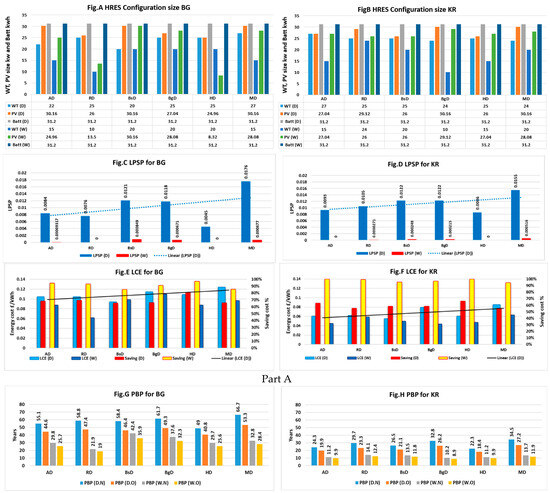

Figure 9.
Results of LPSP, LCE, Saving, and the HRES Size in (Part A) and PBP in (Part B), to evaluate the performance of different optimal configurations that have been determined based on desert areas at Haditha HD, Amara AD, Basra BsD, Baghdad BgD, and Mosul MD using KR and BG demand and applying 2D strategy. D.N, D.O, W.N, and W.O have been used. (Annual Wind energy density and Solar radiation availability) and (Sum of annual wind energy and solar radiation normalization) in (Part B) shows the weight of solar and wind resource equally at each location to determine the availability of solar and wind energy.
The impact of decreasing wind and solar energy from AD to MD is evident in the LPSP and LCE results. LPSP shows a linear gradient increase from AD to MD for both BG and KR demands (Figure 9C,D). Likewise, the LCE results exhibit the same trend, as seen in LCE (D) for both BG and KR demands (Figure 9E,F). These findings highlight the correlation between higher availability of wind and solar energy, leading to increased reliability (LPSP) and reduced energy costs (LCE), consequently resulting in shorter payback periods (PBP).
Despite the lower solar radiation in the HD location (Figure 9F,I), the reliability of HD for meeting both BG and KR demands remains surprisingly high. This can be credited to the presence of strong wind speeds in HD and the use of a 20 kW wind turbine positioned at a height of 20 m. This setup enables the generation of substantial energy throughout the day, effectively compensating for the lower solar radiation levels. Moreover, the KR demand exhibits lower LCE and PBP compared to BG demand, even though both demands have the same size of systems. This difference arises from the fact that the KR demand, being higher than BG, results in a higher utilization of the energy generated, leaving less waste of power compared to BG. As a result, the findings show that the high availability of wind and solar energy, especially in locations with strong wind speeds like HD, combined with the demand management strategy, leads to enhanced system performance and significant cost savings in KR demand compared to BG demand.
7. Conclusions
On–off-grid Op-HRES is the technique for identifying optimal combinations of wind, solar, and battery technologies for domestic scale utilization in Iraq. A key innovation in this approach is how it is designed, which fits the unique features of the electricity grid in Iraq (on–off-grid) due to the unreliable supplies, meaning that the resultant system must have the flexibility to cover the frequent interruptions in grid supply. The technique has been applied to different scenarios and structured according to multi-objectives of cost and reliability, as well as different EFM strategies. Calculations have been carried out for six locations in Iraq, demonstrating that the optimal system configuration varies significantly with location, wind speed, land cover, and according to cost/reliability trade-off.
The local wind speed has a major impact on the feasibility and efficiency of the HRES for application in Iraq. In high wind speed areas, the HRES is readily able to improve supply reliability at a reasonable cost. However, in low wind speed areas, typically within cities, much larger and more expensive systems are required to overcome grid unreliability, which leads to limited feasibility of the HRES systems in Iraq’s urban areas. The high availability of wind speed and solar radiation in the southeast of Iraq (Amara) and west of Iraq (Rutbah) has shown marked efficiency in the performance of the HRES in terms of improving supply reliability at a reduced cost with a short payback period. Otherwise, the reduction in wind and solar resources has led to reduction in the feasibility of HRES dramatically in the north of Iraq (Mosul).
The technique of not discharging the battery when connected to the grid will extend the battery lifecycle and reduce the cost of replacement. Additionally, the relatively high prices for electricity supply have shown the most significant impact on the HRES performance for the 2D optimization strategy, as it reduces the payback period. Accordingly, HRES has gained the ability to improve supply reliability at a reduced cost of energy and payback period, with a reasonable total capital cost for the project. However, future research can further enhance this work by the following:
- Expanding the optimization strategy: While this study employed a well-proven iterative technique, exploring the effectiveness of various optimization approaches, including 2D, 3D, and 4D techniques, could be a valuable next step. A comprehensive comparison of these techniques would identify the most suitable optimization strategy for HRES design in the Iraqi context. This would provide a deeper understanding of the optimization landscape and potentially lead to even more efficient HRES configurations.
- Incentivize Renewable Energy Adoption: By providing subsidized loans and fair pricing for renewable energy fed back to the grid, policymakers can significantly increase renewable energy production and make it more accessible for residential, commercial, and industrial users. This not only benefits the environment but also reduces reliance on expensive national grid imports and polluting diesel generators.
- Promote Energy Efficiency: Educating consumers based on findings like unsuitable wind turbine locations can help avoid investment mistakes. Additionally, the research suggests energy management strategies that can lower energy system costs and extend battery life, leading to significant long-term savings for consumers. This study has shown that implementing these strategies can lead to reducing the payback period by 60.2% for consumers and extending battery life by 10 years.
- Target Consumer Support: Policymakers can consider offering rebates or tax breaks specifically for low-income consumers to help them overcome the initial investment barrier of renewable energy systems. This promotes energy equity and ensures everyone can benefit from this technology.
- Data-Driven Grid Management: The research findings can inform grid operators on strategies to integrate more renewable energy sources efficiently. Predicting high and low renewable energy production periods can help optimize grid management and reduce reliance on traditional sources.
Overall, the research supports policies encouraging a shift towards renewable energy and empowers consumers to make informed decisions for greater energy efficiency and cost savings. By implementing these recommendations, policymakers and energy providers can create a sustainable and affordable energy future.
Author Contributions
Conceptualization, H.A.; methodology, H.A., A.S.T. and T.C.; software, H.A.; validation, H.A., A.S.T. and T.C.; formal analysis, H.A.; resources, H.A. and M.A.Q.; data curation, H.A., M.A.-D. and M.A.Q.; writing—original draft preparation, H.A.; writing—review and editing, M.A.Q., M.A.-D. and A.S.T.; visualization, M.A.Q.; supervision, T.C. and A.S.T.; project administration, A.S.T. All authors have read and agreed to the published version of the manuscript.
Funding
This research was previously funded by the Iraqi Ministry of Higher Education as part of the PhD studies of H.A. at the University of Leeds.
Data Availability Statement
No new data were created.
Conflicts of Interest
The authors declare no conflicts of interest.
References
- Ruble, I.; Nader, P. Transforming shortcomings into opportunities: Can market incentives solve Lebanon’s energy crisis? Energy Policy 2011, 39, 2467–2474. [Google Scholar] [CrossRef]
- Alaskari, M.; Kadhim, A.M.; Farhan, A.A.; Al-Damook, M.; Al Qubeissi, M. Performance Evaluation of Roughened Solar Air Heaters for Stretched Parameters. Clean Technol. 2022, 4, 555–569. [Google Scholar] [CrossRef]
- Al-Damook, M.; Abid, K.W.; Mumtaz, A.; Dixon-Hardy, D.; Heggs, P.J.; Al Qubeissi, M. Photovoltaic module efficiency evaluation: The case of Iraq. Alex. Eng. J. 2022, 61, 6151–6168. [Google Scholar] [CrossRef]
- Al-Damook, M.; Khatir, Z.; Al Qubeissi, M.; Dixon-Hardy, D.; Heggs, P.J. Energy efficient double-pass photovoltaic/thermal air systems using a computational fluid dynamics multi-objective optimisation framework. Appl. Therm. Eng. 2021, 194, 117010. [Google Scholar] [CrossRef]
- IEA—International Energy Agency. Available online: https://www.iea.org/publications/iraqenergyoutlook (accessed on 6 October 2022).
- Wang, R.; Xiong, J.; He, M.; Gao, L.; Wang, L. Multi-objective optimal design of hybrid renewable energy system under multiple scenarios. Renew. Energy 2020, 151, 226–237. [Google Scholar] [CrossRef]
- Ramli, M.A.; Bouchekara, H.; Alghamdi, A.S. Optimal sizing of PV/wind/diesel hybrid microgrid system using multi-objective self-adaptive differential evolution algorithm. Renew. Energy 2018, 121, 400–411. [Google Scholar] [CrossRef]
- Al Qubeissi, M.; El-kharouf, A.; Soyhan, H.S. (Eds.) Renewable Energy–Resources, Challenges and Applications; IntechOpen: London, UK, 2020. [Google Scholar] [CrossRef]
- Askarzadeh, A.; Coelho, L.D.S. A novel framework for optimization of a grid independent hybrid renewable energy system: A case study of Iran. Sol. Energy 2015, 112, 383–396. [Google Scholar] [CrossRef]
- Maleki, A.; Askarzadeh, A. Optimal sizing of a PV/wind/diesel system with battery storage for electrification to an off-grid remote region: A case study of Rafsanjan, Iran. Sustain. Energy Technol. Assess. 2014, 7, 147–153. [Google Scholar] [CrossRef]
- Maleki, A.; Khajeh, M.G.; Ameri, M. Optimal sizing of a grid independent hybrid renewable energy system incorporating resource uncertainty, and load uncertainty. Int. J. Electr. Power Energy Syst. 2016, 83, 514–524. [Google Scholar] [CrossRef]
- Luo, Y.; Shi, L.; Tu, G. Optimal sizing and control strategy of isolated grid with wind power and energy storage system. Energy Convers. Manag. 2014, 80, 407–415. [Google Scholar] [CrossRef]
- Nadjemi, O.; Nacer, T.; Hamidat, A.; Salhi, H. Optimal hybrid PV/wind energy system sizing: Application of cuckoo search algorithm for Algerian dairy farms. Renew. Sustain. Energy Rev. 2017, 70, 1352–1365. [Google Scholar] [CrossRef]
- Mohammed, Y.S.; Mustafa, M.W.; Bashir, N. Hybrid renewable energy systems for off-grid electric power: Review of substantial issues. Renew. Sustain. Energy Rev. 2014, 35, 527–539. [Google Scholar] [CrossRef]
- Sinha, S.; Chandel, S.S. Review of software tools for hybrid renewable energy systems. Renew. Sustain. Energy Rev. 2014, 32, 192–205. [Google Scholar] [CrossRef]
- Bahramara, S.; Moghaddam, M.P.; Haghifam, M.R. Optimal planning of hybrid renewable energy systems using HOMER: A review. Renew. Sustain. Energy Rev. 2016, 62, 609–620. [Google Scholar] [CrossRef]
- Seeling-Hochmuth, G.C. A combined optimisation concet for the design and operation strategy of hybrid-PV energy systems. Sol. Energy 1997, 61, 77–87. [Google Scholar] [CrossRef]
- Yang, H.; Zhou, W.; Lu, L.; Fang, Z. Optimal sizing method for stand-alone hybrid solar–wind system with LPSP technology by using genetic algorithm. Sol. Energy 2008, 82, 354–367. [Google Scholar] [CrossRef]
- Bapat, R.S.; Mhaisalkar, V.A.; Ralegaonkar, R.V. Design optimisation of hybrid energy systems: A case study. Proc. Inst. Civ. Eng. Energy 2015, 168, 229–236. [Google Scholar] [CrossRef]
- Mokheimer, E.M.; Al-Sharafi, A.; Habib, M.A.; Alzaharnah, I. A new study for hybrid PV/wind off-grid power generation systems with the comparison of results from homer. Int. J. Green Energy 2015, 12, 526–542. [Google Scholar] [CrossRef]
- Nacer, T.; Nadjemi, O.; Hamidat, A. Optimal sizing method for grid connected renewable energy system under Algerian climate. In Proceedings of the IREC2015 The Sixth International Renewable Energy Congress, Sousse, Tunisia, 24–26 March 2015; pp. 1–5. [Google Scholar]
- Kaabeche, A.; Belhamel, M.; Ibtiouen, R. Sizing optimization of grid-independent hybrid photovoltaic/wind power generation system. Energy 2011, 36, 1214–1222. [Google Scholar] [CrossRef]
- Belmili, H.; Haddadi, M.; Bacha, S.; Almi, M.F.; Bendib, B. Sizing stand-alone photovoltaic–wind hybrid system: Techno-economic analysis and optimization. Renew. Sustain. Energy Rev. 2014, 30, 821–832. [Google Scholar] [CrossRef]
- Mukhtaruddin, R.; Rahman, H.A.; Hassan, M.Y.; Jamian, J.J. Optimal hybrid renewable energy design in autonomous system using Iterative-Pareto-Fuzzy technique. Int. J. Electr. Power Energy Syst. 2015, 64, 242–249. [Google Scholar] [CrossRef]
- Fonseca, C.M.; Fleming, P.J. Multiobjective optimization and multiple constraint handling with evolutionary algorithms. I. A unified formulation. IEEE Trans. Syst. Man Cybern. Part A Syst. Hum. 1998, 28, 26–37. [Google Scholar] [CrossRef]
- Dufo-Lopez, R.; Bernal-Agustín, J.L. Multi-objective design of PV–wind–diesel–hydrogen–battery systems. Renew. Energy 2008, 33, 2559–2572. [Google Scholar] [CrossRef]
- Dufo-López, R.; Bernal-Agustín, J.L.; Yusta-Loyo, J.M.; Domínguez-Navarro, J.A.; Ramírez-Rosado, I.J.; Lujano, J.; Aso, I. Multi-objective optimization minimizing cost and life cycle emissions of stand-alone PV–wind–diesel systems with batteries storage. Appl. Energy 2011, 88, 4033–4041. [Google Scholar] [CrossRef]
- Zitzler, E.; Thiele, L. Multiobjective evolutionary algorithms: A comparative case study and the strength Pareto approach. IEEE Trans. Evol. Comput. 1999, 3, 257–271. [Google Scholar] [CrossRef]
- Srinivas, N.; Deb, K. Muiltiobjective optimization using nondominated sorting in genetic algorithms. Evol. Comput. 1994, 2, 221–248. [Google Scholar] [CrossRef]
- Katsigiannis, Y.A.; Georgilakis, P.S.; Karapidakis, E.S. Multiobjective genetic algorithm solution to the optimum economic and environmental performance problem of small autonomous hybrid power systems with renewables. IET Renew. Power Gener. 2010, 4, 404–419. [Google Scholar] [CrossRef]
- Iraq Substation Fire Causes Major Power Outage—DW–30 July 2023, Dw.Com. Available online: https://www.dw.com/en/iraq-substation-fire-causes-major-power-outage/a-66386036 (accessed on 28 August 2023).
- Zaidoon, W.J.; Azizan, M.M.; Rahman, A.S.F.; Hasikin, K. Flexible hybrid renewable energy system design for a typical remote city in Iraq: A case study. In Proceedings of the AIP Conference Proceedings, Green Design and Manufacture 2020, Arau, Malaysia, 23–24 July 2020; AIP Publishing: College Park, MD, USA, 2021. Available online: https://pubs.aip.org/aip/acp/article-abstract/2339/1/020011/1027857 (accessed on 26 March 2024).
- Dihrab, S.S.; Sopian, K. Electricity generation of hybrid PV/wind systems in Iraq. Renew. Energy 2010, 35, 1303–1307. [Google Scholar] [CrossRef]
- Al-Shammari, Z.W.; Azizan, M.M.; Rahman, A.S.F.; Hasikin, K. Analysis on renewable energy sources for electricity generation in remote area of Iraq by using HOMER: A case study. In Proceedings of the AIP Conference Proceedings, Green Design and Manufacture 2020, Arau, Malaysia, 23–24 July 2020; AIP Publishing: College Park, MD, USA, 2021. Available online: https://pubs.aip.org/aip/acp/article-abstract/2339/1/020007/1028008 (accessed on 26 March 2024).
- Al-Shammari, Z.W.; Azizan, M.M.; Rahman, A.S.F. Feasibility of PV–Wind–Diesel Hybrid Renewable Energy Power System for Off-Grid Rural Electrification in Iraq: A Case Study. J. Eng. Sci. Technol. 2021, 16, 2594–2609. [Google Scholar]
- Alshamri, H.A.H. Optimal Sizing of Hybrid Renewable Systems to Improve Electricity Supply Reliability in Iraqi Domestic Dwellings. Ph.D. Thesis, University of Leeds, Leeds, UK, 2019. [Google Scholar]
- Arul, P.G.; Ramachandaramurthy, V.K.; Rajkumar, R.K. Control strategies for a hybrid renewable energy system: A review. Renew. Sustain. Energy Rev. 2015, 42, 597–608. [Google Scholar] [CrossRef]
- Ahmed, N.A.; Al-Othman, A.K.; AlRashidi, M.R. Development of an efficient utility interactive combined wind/photovoltaic/fuel cell power system with MPPT and DC bus voltage regulation. Electr. Power Syst. Res. 2011, 81, 1096–1106. [Google Scholar] [CrossRef]
- Liu, X.; Wang, P.; Loh, P.C. A hybrid AC/DC microgrid and its coordination control. IEEE Trans. Smart Grid 2011, 2, 278–286. [Google Scholar]
- China Small Wind Turbine, Wind Power Generator, Wind Turbine Manufacturers, Inverter, Small Wind Turbine-Senwei-China Best Wind Turbine, Wind Turbine for Home, Wind Turbine Manufacturers. Available online: http://www.windpowercn.com/ (accessed on 16 October 2022).
- AC Battery Storage, Sofar Solar ME3000SP Battery Storage Systems Supplier|UK’s Premium Distributor. Available online: http://www.stealthenergy.co.uk/stealth-tile-system/stealthenergytm-growatt-inverter/so-far-solar/index.shtml (accessed on 26 October 2022).
- Diaf, S.; Diaf, D.; Belhamel, M.; Haddadi, M.; Louche, A. A methodology for optimal sizing of autonomous hybrid PV/wind system. Energy Policy 2007, 35, 5708–5718. [Google Scholar] [CrossRef]
- Engage Platform–Demo. Available online: https://engage.efergy.com/dashboard (accessed on 7 November 2022).
- Al-Damook, M.; Dixon-Hardy, D.; Heggs, P.J.; Al Qubeissi, M.; Al-Ghaithi, K.; Mason, P.E.; Cottom, J. CFD analysis of a one-pass photovoltaic/thermal air system with and without offset strip fins. MATEC Web Conf. EDP Sci. 2018, 240, 03002. [Google Scholar] [CrossRef]
- HOMER Pro 3.12, How HOMER Calculates the PV Array Power Output. Available online: https://www.homerenergy.com/products/pro/docs/3.12/how_homer_calculates_the_pv_array_power_output.html (accessed on 28 October 2022).
- Complete Solar Power System, Poly and Mono Solar Panel, Solar Battery. Available online: https://www.bluesunpv.com/?fbclid=IwAR2yf3Pw4TtOZLMCM1Wb1smrM3THW0GLd_3UpEiY4LeJxF7n4SazCPJfy0 (accessed on 28 October 2022).
- The European Commission’s Science and Knowledge Service, Photovoltaic Geographical Information System (PVGIS). 2020. Available online: https://ec.europa.eu/jrc/en/pvgis (accessed on 28 October 2022).
- HelioClim-1, SoDa. Available online: https://www.soda-pro.com (accessed on 28 October 2022).
- GES DISC Dataset: MERRA-2 tavgM_2d_ocn_Nx: 2d,Monthly Mean, Time-Averaged, Single-Level, Assimilation, Ocean Surface Diagnostics V5.12.4 (M2TMNXOCN 5.12.4). Available online: https://disc.gsfc.nasa.gov/datasets/M2TMNXOCN_5.12.4/summary?keywords=MERRA2 (accessed on 29 October 2022).
- Mohamed, M.A.; Eltamaly, A.M.; Alolah, A.I. PSO-based smart grid application for sizing and optimization of hybrid renewable energy systems. PLoS ONE 2016, 11, e0159702. [Google Scholar] [CrossRef]
- Pimm, A.J.; Cockerill, T.T.; Taylor, P.G. Time-of-use and time-of-export tariffs for home batteries: Effects on low voltage distribution networks. J. Energy Storage 2018, 18, 447–458. [Google Scholar] [CrossRef]
- Sinha, S.; Chandel, S.S. Review of recent trends in optimization techniques for solar photovoltaic–wind based hybrid energy systems. Renew. Sustain. Energy Rev. 2015, 50, 755–769. [Google Scholar] [CrossRef]
- Seong, W.M.; Park, K.-Y.; Lee, M.H.; Moon, S.; Oh, K.; Park, H.; Lee, S.; Kang, K. Abnormal self-discharge in lithium-ion batteries. Energy Environ. Sci. 2018, 11, 970–978. [Google Scholar] [CrossRef]
- China Suntree Electric, China Suntree Electric. Available online: https://www.chinasuntree.com (accessed on 29 October 2022).
- Nema, P.; Nema, R.K.; Rangnekar, S. A current and future state of art development of hybrid energy system using wind and PV-solar: A review. Renew. Sustain. Energy Rev. 2009, 13, 2096–2103. [Google Scholar] [CrossRef]
- Normalization|Machine Learning, Google Developers. Available online: https://developers.google.com/machine-learning/data-prep/transform/normalization (accessed on 7 November 2022).
- Nogueira, C.E.C.; Vidotto, M.L.; Niedzialkoski, R.K.; de Souza, S.N.M.; Chaves, L.I.; Edwiges, T.; Santos, D.B.D.; Werncke, I. Sizing and simulation of a photovoltaic-wind energy system using batteries, applied for a small rural property located in the south of Brazil. Renew. Sustain. Energy Rev. 2014, 29, 151–157. [Google Scholar] [CrossRef]
- Xu, L.; Ruan, X.; Mao, C.; Zhang, B.; Luo, Y. An improved optimal sizing method for wind-solar-battery hybrid power system. IEEE Trans. Sustain. Energy 2013, 4, 774–785. [Google Scholar]
- Schwingshackl, C.; Petitta, M.; Wagner, J.E.; Belluardo, G.; Moser, D.; Castelli, M.; Zebisch, M.; Tetzlaff, A. Wind effect on PV module temperature: Analysis of different techniques for an accurate estimation. Energy Procedia 2013, 40, 77–86. [Google Scholar] [CrossRef]
- Prasad, A.R.; Natarajan, E. Optimization of integrated photovoltaic–wind power generation systems with battery storage. Energy 2006, 31, 1943–1954. [Google Scholar] [CrossRef]
- Jacobson, M.Z. Review of solutions to global warming, air pollution, and energy security. Energy Environ. Sci. 2009, 2, 148–173. [Google Scholar] [CrossRef]
- Kazem, H.A.; Chaichan, M.T. Status and future prospects of renewable energy in Iraq. Renew. Sustain. Energy Rev. 2012, 16, 6007–6012. [Google Scholar] [CrossRef]
- Kaygusuz, K. Renewable energy: Power for a sustainable future. Energy Explor. Exploit. 2001, 19, 603–626. [Google Scholar] [CrossRef]
- Khatib, H. Economic Evaluation of Projects in the Electricity Supply Industry; IET: Stevenage, UK, 2003. [Google Scholar]
- Payback Period Explained, with the Formula and How to Calculate It, Investopedia. Available online: https://www.investopedia.com/terms/p/paybackperiod.asp (accessed on 7 November 2022).
- Lilienthal, P. HOMER Software. 2023. Available online: https://www.homerenergy.com/ (accessed on 7 November 2022).
Disclaimer/Publisher’s Note: The statements, opinions and data contained in all publications are solely those of the individual author(s) and contributor(s) and not of MDPI and/or the editor(s). MDPI and/or the editor(s) disclaim responsibility for any injury to people or property resulting from any ideas, methods, instructions or products referred to in the content. |
© 2024 by the authors. Licensee MDPI, Basel, Switzerland. This article is an open access article distributed under the terms and conditions of the Creative Commons Attribution (CC BY) license (https://creativecommons.org/licenses/by/4.0/).

