Article

Optimizing Renewable Energy Integration through Innovative Hybrid Microgrid Design: A Case Study of Najran Secondary Industrial Institute in Saudi Arabia

Department of Electrical and Computer Engineering, Oakland University, Rochester, MI 48309, USA
*
Author to whom correspondence should be addressed.
Clean Technol. 2024, 6(2), 397-417; https://doi.org/10.3390/cleantechnol6020020
Submission received: 27 November 2023 / Revised: 6 March 2024 / Accepted: 20 March 2024 / Published: 25 March 2024

Abstract

:
Amidst a growing global focus on sustainable energy, this study investigates the underutilization of renewable resources in the southern region of Saudi Arabia, with a specific emphasis on the Najran Secondary Industrial Institute (NSII). This research presents an in-depth analysis of installing a hybrid microgrid (MG) system on the roofs of NSII buildings, exploring six cases with varying tilt and azimuth angles. The study innovatively integrates architectural design and system administration, a novel approach for this location, and benchmarks the optimal angles against Hybrid Optimization of Multiple Energy Resources (HOMER) software defaults. The proposed system consists of solar photovoltaic (PV) panels, a battery storage system (BSS), a converter, a diesel generator (DG), and a grid. The selected model balances technological and economic viability with environmental considerations, ensuring a reliable power supply within the NSII’s roof area constraints. An extensive sensitivity analysis evaluates the system’s resilience across different scenarios. The current system, which is grid-only, has an estimated Net Present Cost (NPC) of about USD 7.02M and emits 1.81M kg/yr of CO2. The findings point to installing a microgrid with a 20.97° tilt and 50° azimuth angle as optimal, demonstrating 54.69% lower NPC and 92% lower CO2 emissions, along with zero kWh/year unmet electrical load when applying the resilience assessments. This outcome highlights Saudi Arabia’s southern region’s renewable energy potential, aligning with national mega-projects and energy initiatives.

1. Introduction

The global rise in demand for power due to globalization has led to an increased reliance on diverse power sources, which has required the addressing of environmental challenges like reducing carbon dioxide (CO
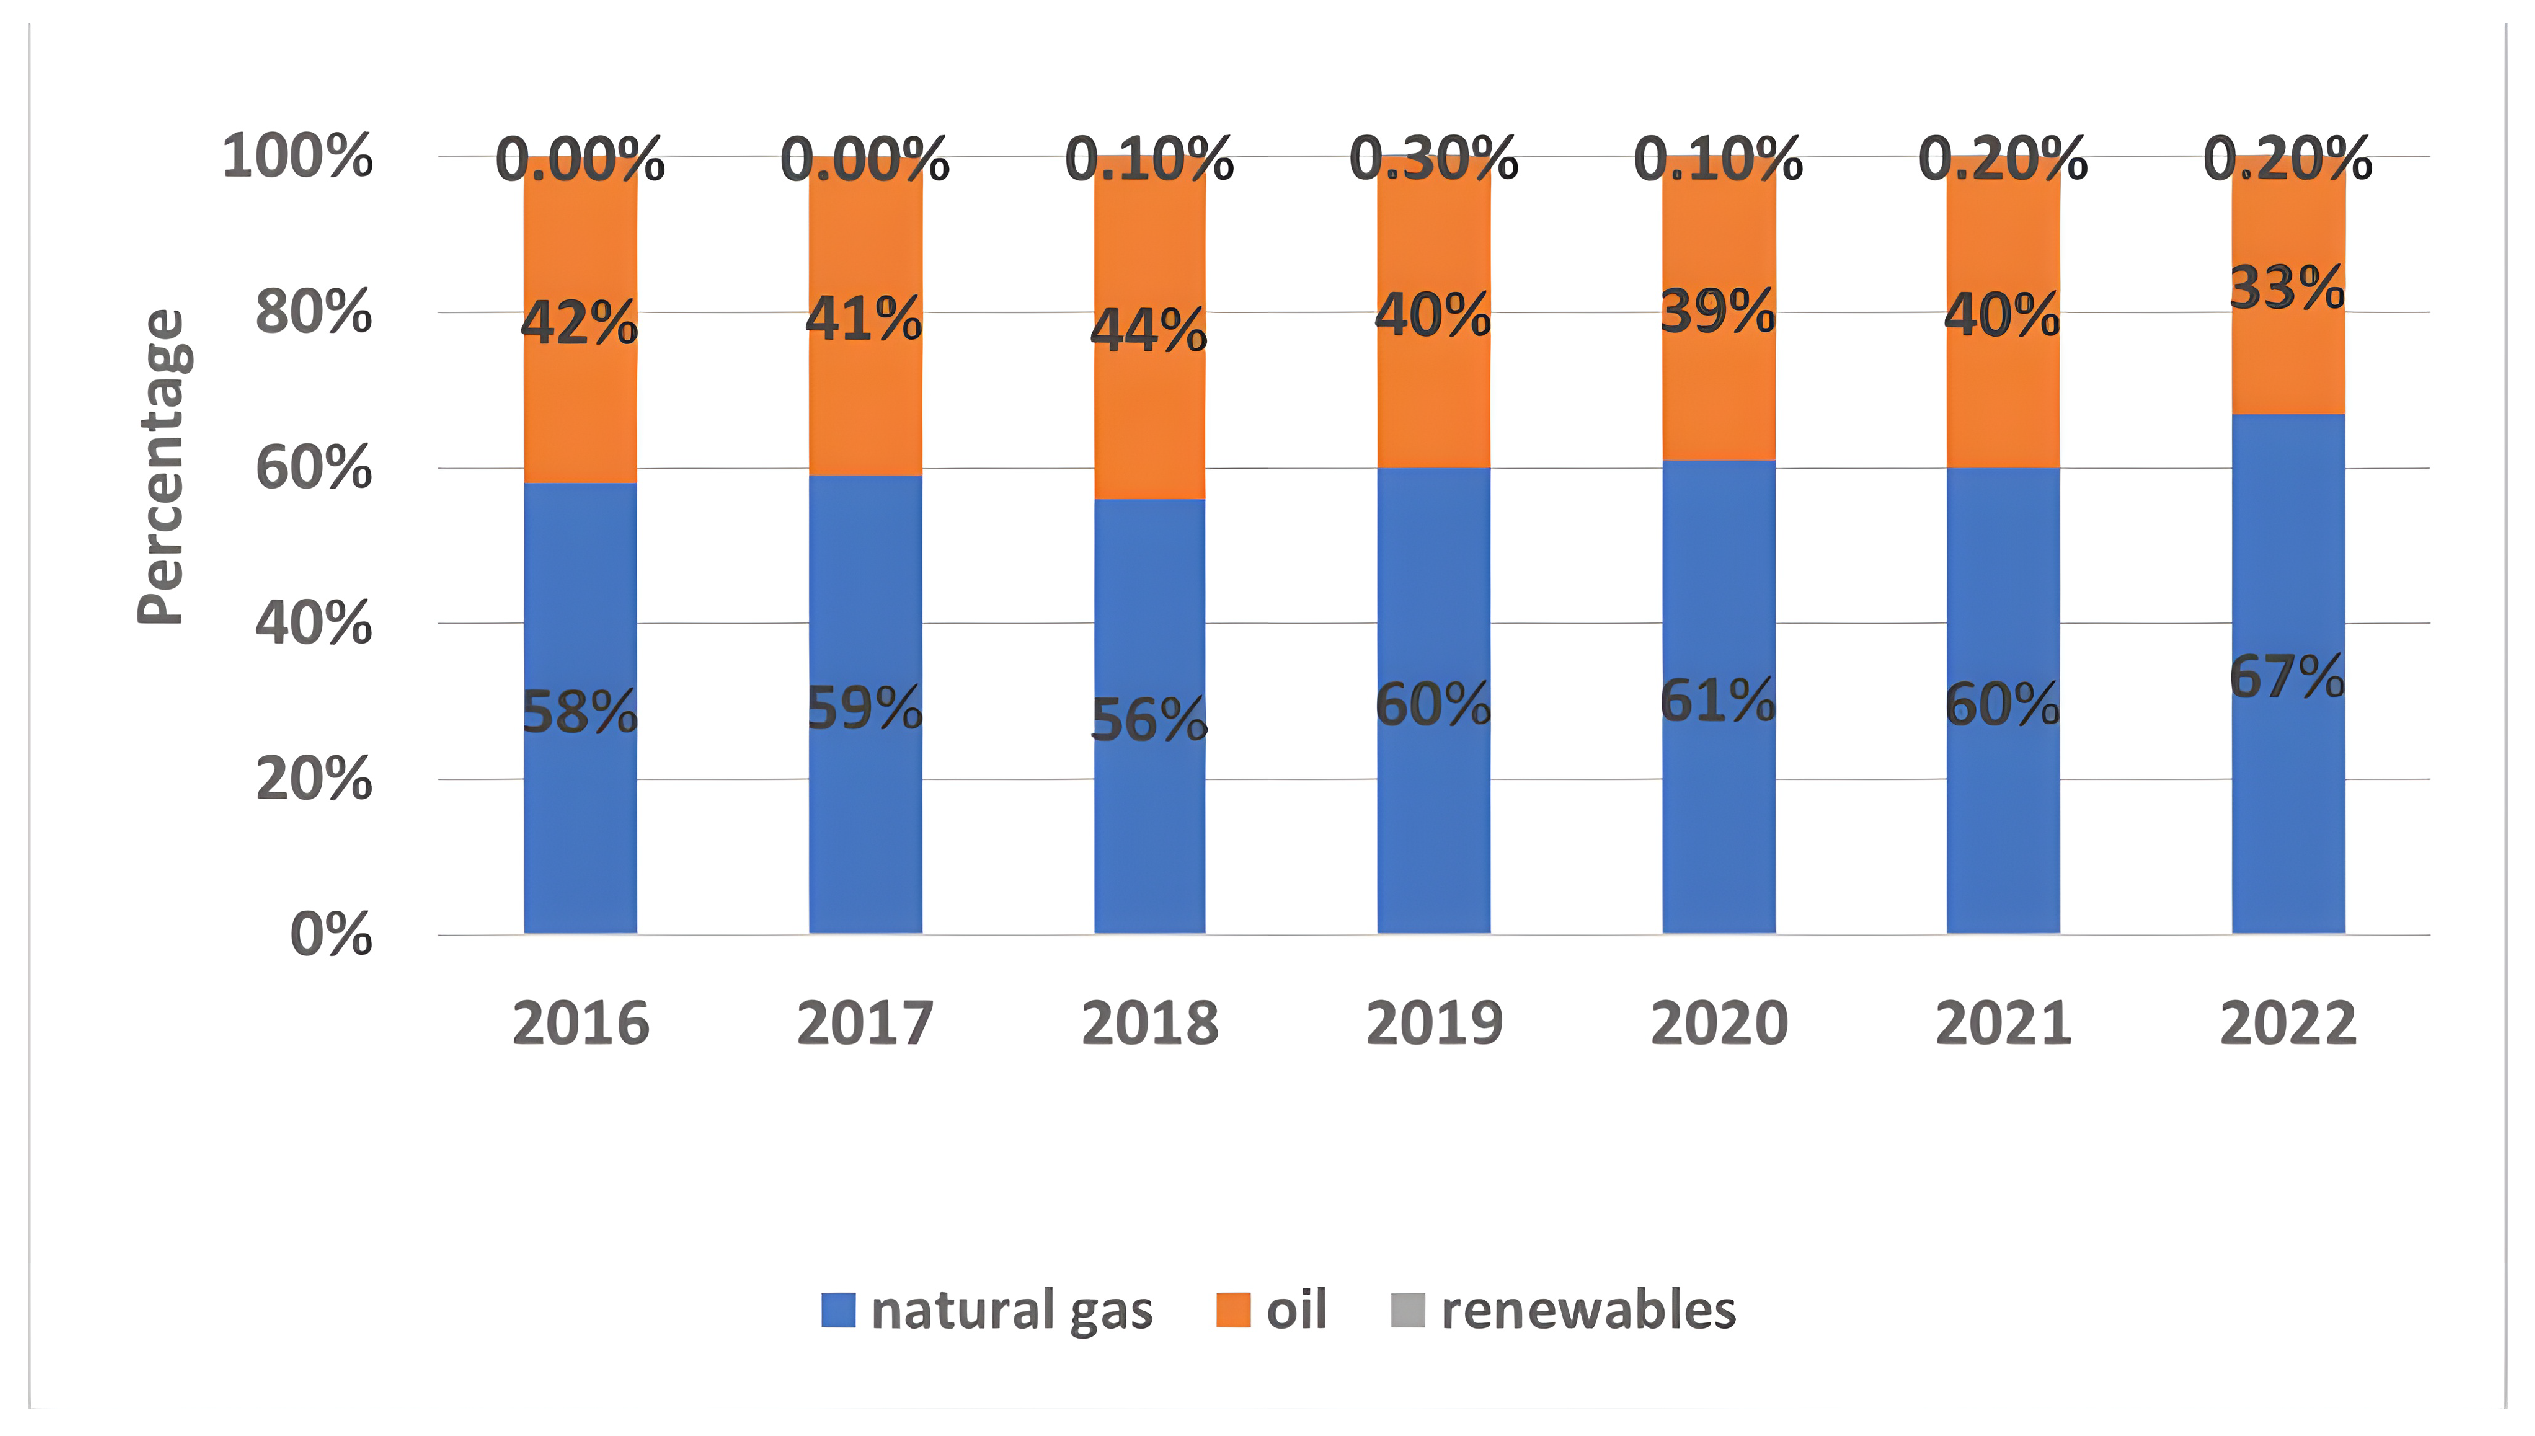
2) emissions and its associated costs. This underscores the importance of microgrids (MGs) as a sustainable solution. Saudi Arabia is unique in its direct use of crude oil for power generation, with nearly 60% of its electricity coming from oil, while the remainder is sourced from natural gas, as shown in Figure 1. The power generation sector, with other energy sectors, contributed to CO2 emissions rising by 300% between 1990 and 2019 [1]. Despite this reliance on fossil fuels, the country possesses significant untapped potential in renewable energy sources, including solar, wind, geothermal, and waste-to-energy resources. This potential represents a compelling opportunity for Saudi Arabia to diversify its energy mix and reduce its carbon footprint in line with global sustainability goals [2]. Saudi Arabia’s Vision 2030 focuses on the growth of energy and the expansion of non-associated natural gas. The goal is to decrease the country’s dependence on oil (including natural gas) in favor of generating electricity using preferable (i.e., renewable) sources. The Saudi National Renewable Energy Program (NREP) aims to achieve 50% of the nation’s electricity generation from renewables by 2030 [3,4]. The NREP consists of 13 projects, with a combined capacity of 4870 MW. Solar energy dominates, accounting for 91.8% of this total, with wind energy accounting for the remaining 8.2%. By 2024, these projects aim to produce a total of 15,108,701 MWh of electricity per year, which is enough to cover the electricity demand for 692,557 households. These projects assume a reduction in fossil fuel consumption that will lead to an annual decrease of approximately 9,828,156 tons in CO2 emissions by 2024 [5]. The Kingdom of Saudi Arabia is working to lead the global energy sustainability campaign to reach net zero greenhouse gas emissions by 2060.
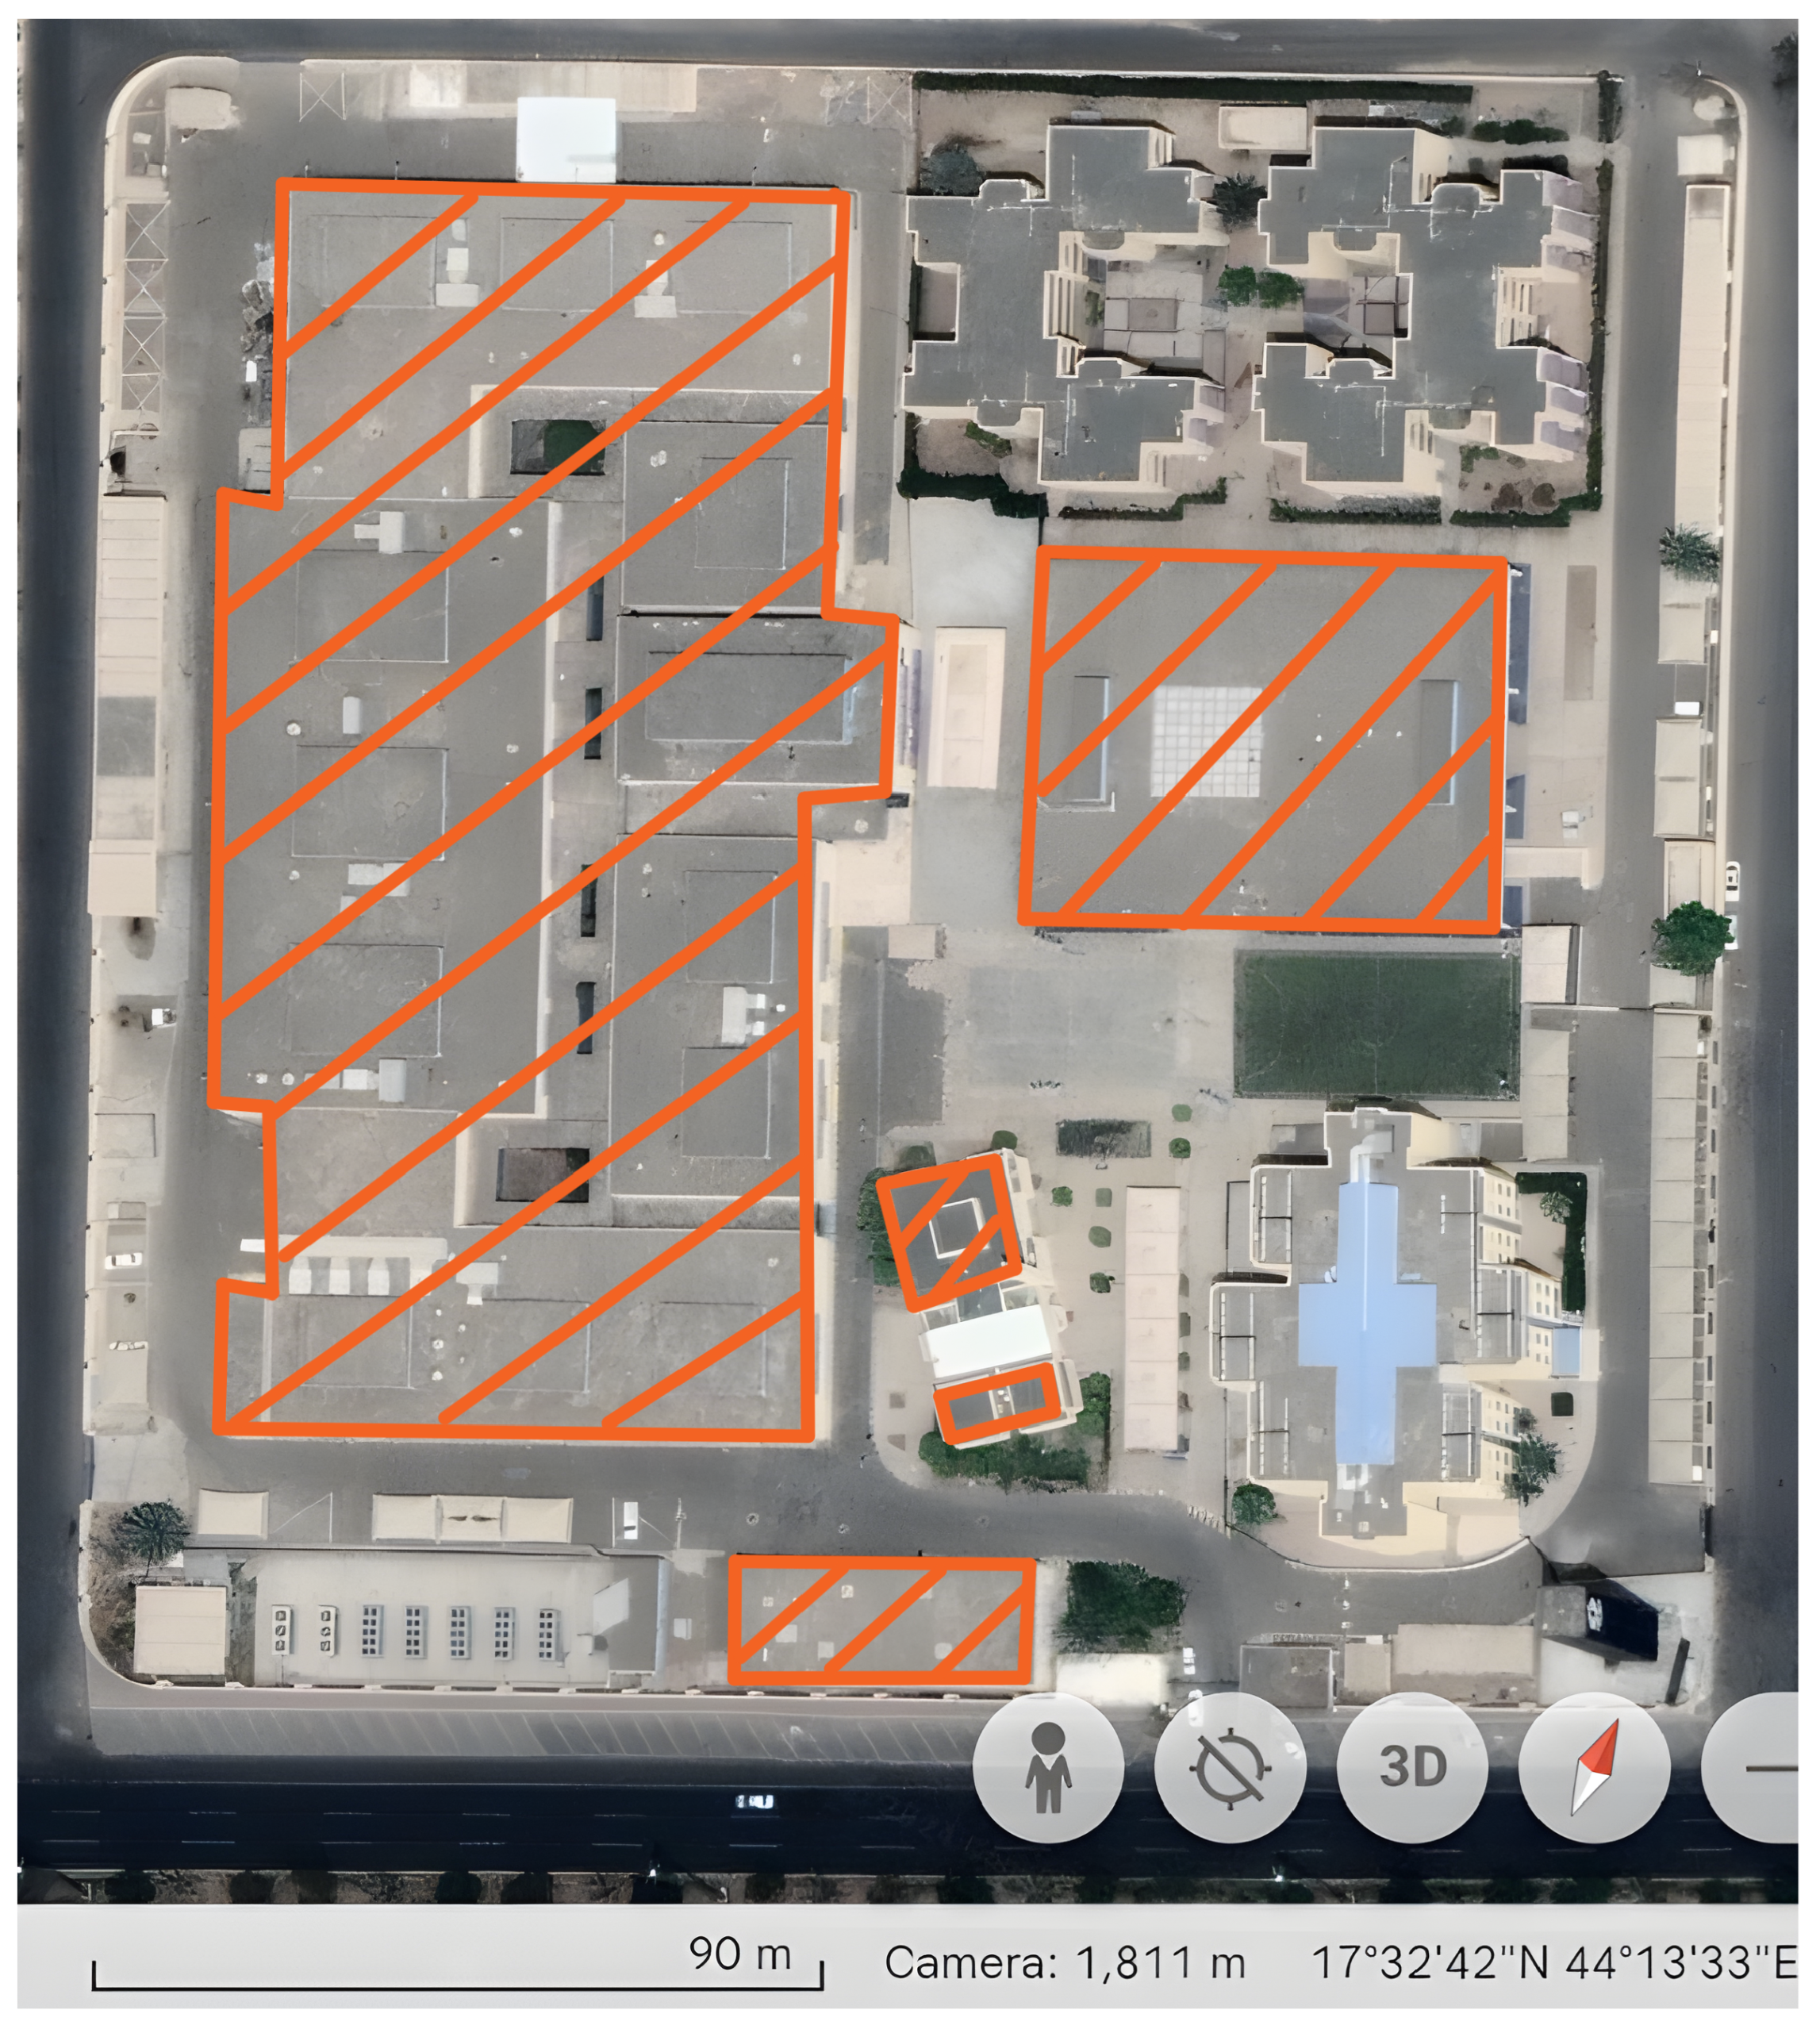
In this study, the underutilization of renewable resources in Saudi Arabia, with a case study on the Najran Secondary Industrial Institute (NSII), is investigated by an in-depth analysis of a hybrid MG system at NSII, exploring six cases with varying tilt and azimuth angles. A benchmark study of the optimal angles against Hybrid Optimization of Multiple Energy Resources (HOMER) software defaults was conducted. Considering the NSII’s roof area constraints, an approach ensuring a reliable power supply is presented for the selected model that balances technological and economic viability with environmental considerations.

2. Literature Review

The case study in [7] involved designing a solar photovoltaic (PV) microgrid for a hospital in Dhaka. The electrical load and solar profiles were assessed. An optimization problem minimizing cost and emissions while maximizing reliability was solved using HOMER software. In reference [8], amid Saudi Arabia’s escalating energy demands, the authors evaluated a grid-connected PV–wind system for a 15,000 kWh/day community electrical load. Using HOMER software and King Abdullah City for Atomic and Renewable Energy (KACARE) data, four cities were assessed, with Yanbu proving the most viable, with minimal costs and emissions, thereby suggesting a global potential for similar climates. Alhawsawi, in [9], used HOMER to design optimal hybrid renewable energy systems for an MG at Oakland University, whereby meeting unmet electrical loads and reducing greenhouse gas emissions were emphasized. The systems incorporated solar PV, energy storage system (ESS), combined heat and power (CHP), and wind turbines (WT), thus aiming for flexibility and scalability. The results showcased a sustainable energy solution with a peak electrical load of 9.958 MW, a net present cost (NPC) of USD 30M, and a levalized cost of energy (LCOE) at 0.00274 USD/kWh. The authors of [10] found that integrating renewable energy sources (RESs), specifically solar PV and wind energy, helped with achieving strategic objectives in Saudi Arabia. An optimal MG system for the Islamic University of Madinah was studied with the following three alternatives analyzed: PV, WT, and hybrid systems. Using real weather data, the results indicated that the PV system could provide up to 3.03% of the university’s annual electrical consumption with an LCOE of 0.051 USD/kWh. The WT and hybrid options had different benefits and costs, but all contributed to reducing emissions, thus aligning with Saudi Arabia’s strategic goals. To address the challenges posed by an increasing number of electric vehicles, specifically their energy sourcing and grid load, the researchers used HOMER software. A PV–WT hybrid energy-charging station was designed and optimized with applicability for worldwide use. The best solution comprised 44.4% wind and 55.6% solar energy, which produced an annual electricity of 843,150 kWh at a cost of 0.064 USD/kWh [11]. The authors of [12] conducted a study focusing on New Sohag University in Egypt, and two MG systems based on renewable energy sources were compared. The first system comprised PV, a diesel generator (DG), and a converter. The second improved on this by incorporating ESS, including batteries for long-term storage and flywheels for short-term use. Utilizing HOMER software, the economic and environmental outcomes of both systems were assessed, including the costs, CO2 emissions, and degree of diesel consumption. Dahiru et al. [13], utilized HOMER for a techno-economic evaluation in various tropical regions in order to conduct a performance analysis of renewable-energy-based distributed grids. Specifically, in the Sudan Savannah region of Nigeria, six scenarios with grid-connected nanogrids were proposed to meet a daily residential demand of 355 kWh and a per capita energy consumption of 150 kWh. The outcomes demonstrated an LCOE between 0.0110 USD/kWh and 0.0095 USD/kWh, as well as an NPC between USD 366,210 and USD 288,680, as negative values, thereby indicating potential for significant grid export. Remarkably, a renewable energy fraction of up to 98% was attained with greenhouse gas emissions as low as 2328 tons/year.
Islam et al. [14] explored the rarely investigated hybridized PV/wind/hydro system with pumped hydro storage (PHS) for community electricity demand in Newfoundland, Canada. This PHS-based hybrid system was contrasted with battery-based configurations, with comprehensive assessments of techno-economic and environmental potentials over traditional battery and diesel-only systems. The findings highlighted the hybrid system’s ability to provide electricity at a notably reduced cost (0.136 USD/kWh) compared to diesel-only setups (0.355 USD/kWh), resulting in significant diesel and CO2 savings annually. The PHS-based hybrid demonstrated cost and energy advantages over BSS, with hydro integration further reducing energy costs by 58% compared to PV/wind/PHS alone. The authors of [15] aimed to optimally size hybrid energy storage using a fuel cell (FC) system and supercapacitor (SC) for off-grid renewable applications, thus focusing on reliability and cost effectiveness. The optimal system, which was designed for a 20-year lifespan, consisted of 1351 kW PV panels and a 80 kW fuel cell stack, as well as other specified components, with the PV panels accounting for 98.2% of the electricity production. The NPC stood at USD 26.5M and the LCOE at 4.78 USD/kWh. A sensitivity analysis highlighted the significant impact of hydrogen storage costs on the overall system. The six cases studied in [16] were assessed with respect to their feasibility in a hybridized energy system with PV, WT, and DGs with BSS for a remote village in northern Bangladesh. Utilizing HOMER software, the optimal system was identified, which consisted of 73 kW PV arrays, a 57 kW DG, and a 387 kWh BSS. This system, with an LCOE of 0.37 USD/kWh and an NPC of USD 357,284, reduced CO2 emissions by approximately 62% compared to the kerosene used in the current system and 67% versus the grid system. Utilizing the advanced capabilities of HOMER software, the authors of [17] innovatively integrated distributed and centralized generation, thereby incorporating a solar thermal system with five other technologies. Focusing on a seldom-addressed CHP microgrid design for a remote community in Newfoundland, the study found that renewable sources can supply all electric and majority thermal loads, thus proving to be more cost-effective than a diesel-only basis. A study that focused on the island of Favignana in Italy [18] employed HOMER software to explore sustainable energy solutions, particularly in terms of evaluating the integration of hydrogen and battery storage for both electricity and public transportation through electric FC and hydrogen–compressed natural gas vehicles. The results revealed that a hybrid storage system, one that utilizes batteries and an electrolyzer, emerged as a viable option to enhance energy independence and to decarbonize the transport sector in small islands, thereby aligning with both economic and environmental sustainability objectives.
In a study by Islam [19], the integration of a hybrid renewable energy system (HRES) in a large office building was examined in terms of minimizing grid electricity use and assessing the economic impacts of incorporating green vehicles. Utilizing HOMER software, it was found that implementing solar PV curtails grid electricity consumption by 43% and decreases the unit electricity cost by 10%, while also reducing emissions by over 90%. Another grid-connected system was introduced in [20] as an economical and technologically advanced solution for electrifying a rural village in India, and this was achieved by focusing on the optimal sizing of an integrated renewable energy system (IRES) coupled with a grid for consistent power. Through utilizing PV, BSS, and a grid, the system design and its sensitivity, as well as techno-economic analyses, were constructed using HOMER software, and this was achieved considering various electrical load profiles via a demand response strategy. Notably, the configuration boasting LCOE and TNPC alongside the highest renewable fraction was identified as optimal, thereby ensuring minimized CO2 emissions and demonstrating effectiveness in offering a reliable 24/7 power supply, even with restricted grid availability. A techno-economic performance study of grid-connected PV power systems across five different climate zones in China, utilizing HOMER software for evaluation, was evaluated in [21]. Through considering aspects like monthly average electric production, economics, and environmental impact, the study underscored that grid/PV systems are technically, economically, and environmentally viable across all investigated zones.
In a study addressing the resilience of a proposed MG [22], which encompassed PV, WT, ESS, DG, and converters, HOMER software played a crucial role in evaluating its operational robustness. Through the simulation of various challenges via randomized power outages across numerous days throughout the annual cycle, the software provided insights into the MG’s performance amidst potential real-world disruptions. Additionally, a novel resilience index was introduced, thereby offering a metric to gauge the extent of unmet electrical load demands during such perturbations. The authors of [23] utilized HOMER software to explore the potential of significant renewable energy integration in a remote, sub-tropical island’s power system. The study focused on contrasting the hybrid MG’s benefits against a solely diesel-based configuration in terms of technical, financial, and environmental aspects. The findings revealed that the existing diesel system was economically burdensome for island inhabitants. However, a PV/wind/diesel/battery hybrid MG emerged as the most cost-effective solution, as it was notably cheaper in terms of NPC and per-unit electricity cost while achieving a 56% renewable energy share and reducing CO2 emissions by 23%. Sawle et al. [24] studied an electrical load around 900 kWh/d with almost 100 kW peak in Ukai City, India. In that study, HOMER software was able to determine the most feasible hybrid system from four configurations, thereby settling on a PV, WT, MH (micro hydro), converter, battery, DG, and BG (biodiesel generator) hybrid system. This system offered the lowest COE and NPC at USD 0.196 and USD 831,217, respectively. Additionally, it boasted a high renewable factor of 81.2% and fewer emissions, thus making it more environmentally friendly. Table 1 summarizes most of the recent studies cited in this literature review.

3. System Description and System Mathematics Modeling

3.1. System Description

3.1.1. PV

A photovoltaic cell is a device that directly transforms energy into usable electricity through a physical and chemical phenomenon known as the photovoltaic effect. These cells fall under the category of devices, which means that they undergo changes in properties (such as current, voltage, and resistance) when exposed to light from natural sunlight or artificial sources. Solar cells play a role as components in PV modules, which are commonly known as solar panels. Furthermore, they have the ability to function as photo detectors by sensing light or electromagnetic radiation within the spectrum, and they can also measure its intensity [25].

3.1.2. ESS

Energy storage refers to the process of capturing and storing the energy to be released when a system needs it. It has a critical role in addressing the challenges associated with supply–demand fluctuations and supporting the integration of RES into the grid. Energy storage serves both short- and long-term needs, thereby offering frequency control, stability, and energy management. It complements primary generation by providing reserve power, thus enhancing the effectiveness of the electric supply network [26]. Various energy storage systems have been developed to include pumped hydro power, compressed air energy storage, batteries, flywheel super capacitors, and hydrogen.

3.1.3. Electrical Load

The concept of electrical load refers to the quantity of power or energy used by devices and systems in a particular circuit or network. It indicates the demand imposed on the supply. The electrical load is usually measured in terms of electrical current (amperes) or power (watts). Having knowledge about electrical loads and their effective handling is crucial for ensuring the stability and effectiveness of systems.

3.1.4. DG

In a hybrid MG, a diesel generator often serves several key purposes such as backup power, supply stability, peak shaving, energy cost optimization, or as emergency services (especially in critical facilities like hospitals). Overall, the role of a DG in a hybrid MG is to complement RESs by ensuring that the power supply is both reliable and continuous.

3.2. System Mathematics Modeling

3.2.1. PV Modeling

The PV system plays a crucial role in harnessing electricity from solar energy. Various environmental factors, including the surrounding temperature and the intensity of solar radiation, significantly influence the PV system’s power output. To accurately model and predict the performance of the PV system, the following equation was employed [27,28]:
P PV = Y PV · f PV G T G T , STC 1 + α P T C T C , STC ,
where f PV is the PV derating factor (%); Y PV refers to the rated capacity of the PV array ( k W ); G T is the global solar radiation incident on the surface of the PV array in the current time step ( kW / m 2 ); G T , STC = 1   kW / m 2 is the standard amount of incident radiation at standard test conditions (STC), (25 °C); and α P is the temperature coefficient of power (%/°C). Meanwhile, T C and T C , STC are the PV cell temperature under operating conditions and the PV cell temperature under the STC, respectively. The PV cell temperature was determined by the following Equation [29]:
T C = T a + ( N O C T 20 ) 800 × G T ,
where T a indicates the surrounding temperature in (°C), and N O C T is the value of nominal operating cell temperature, which is typically between 45 °C and 47 °C.

3.2.2. BSS Modeling

In MG systems, RESs are subject to constant fluctuations and intermittence in power generation due to their dependence on environmental conditions. ESSs, particularly battery banks, play a pivotal role in stabilizing these irregularities and ensuring a reliable power supply. The battery bank acts as a buffer; moreover, it stores the excess energy produced during peak production periods and then supplies it during times of insufficient generation from RESs. This ensures continuous and balanced power delivery, thus mitigating the risks associated with unpredictable power generation. In extreme cases, where RESs are insufficient to meet the electrical load demands, the system can rely on alternative power sources like diesel generators to fill the gap. However, the integration of battery storage significantly reduces the dependency on such non-renewable backup sources, thus promoting a more sustainable and resilient energy ecosystem within the MG.
The following equation indicates the state of charge (SoC) of the BSS depending on the charging and discharging status [30,31]:
S o C ( t + Δ t ) = S o C ( t ) × ( 1 σ b ) + P PV ( t ) × η inv P L ( t ) η inv × η B C × Δ t
S o C ( t + Δ t ) = S o C ( t ) × ( 1 σ b ) P L ( t ) η B D P PV ( t ) × η inv × η B D × Δ t
where P L ( t ) is the electrical load demand; P PV ( t ) indicates the PV output power in kW; η inv refers to the efficiency of the inverter (%); σ b is the BSS rate of the self-discharge (%); and η C and η D represent the charging and discharging efficiencies of the BSS (%), respectively.
To preserve the operational longevity of ESSs, it is imperative to maintain the SoC within the established maximum SoC max and minimum SoC min thresholds as per the following:
SoC min SoC SoC max .

3.2.3. Converter Modeling

Converters play a crucial role in MG systems by facilitating the energy flow between different components. They can function both as inverters, converting direct current (DC) to alternative current (AC), and as rectifiers, transforming AC to DC. This is particularly vital in hybrid systems to ensure a steady energy exchange between DC and AC parts. The inverter’s capacity and limits, P inv , are detailed in the following Equations [22,32]:
P inv = E L ( max ) η dc / ac ,
η dc / ac P BSS , ch / dis ( t ) + P PV ( t ) P inv ,
η ac / dc P G ( t ) P inv ,
where P inv indicates the converter capacity in kW and E L ( max ) is the maximum electrical load demand in Wh, while η dc / ac and η ac / dc are the converter efficiencies for DC to AC and AC to DC current conversion, respectively. Moreover, P BSS , ch / dis is the charge/discharge of the BSS, whereas P PV and P G are the PV and import/export grid powers, respectively.

3.2.4. DG Modeling

An automatically sized genset generator was incorporated utilizing the HOMER library. The generator automatically sizes its capacity to meet the electrical load, which leads to avoiding the capacity shortages in all sensitivity cases.

3.3. Simulation Methodology

HOMER serves as a pivotal tool for formulating various hybrid energy configurations, which span renewable MGs, grid-connected energy systems, and islanded hybrid energy systems, among others [33]. HOMER’s central aim is to ascertain the minimal economic objectives such as the NPC [34] and the LCOE. This is in addition to possessing the ability to assess the reliability and objectives of the system. Users input data including types of energy sources, the components for energy storage, the electrical load, and the costs associated with these components. In response, HOMER outputs crucial parameters such as the NPC, LCOE, surplus energy, fuel consumption, and the utilization of renewable energy. Moreover, the software aids in selecting the optimal control strategy for the system, wherein it provides options like load following (LF) and cycle charging (CC) control [35]. Figure 2 illustrates the flowchart of HOMER optimization.

3.3.1. HOMER Software Dispatch Strategy (Controller)

A dispatch strategy in HOMER software defines the operational rules for generators and battery banks within a power system. The software can simulate two main strategies (with the optimal choice depending on various factors): CC and LF. These factors include the size of generators and battery banks, as well as fuel prices, the operation and maintenance (O&M) costs of the generators, the quantity of renewable energy in the system, and the nature of renewable resources.
  • LF Strategy: The LF strategy ensures that generators produce just enough power to meet immediate electrical demand, thus leaving the charging of the storage banks to the renewable energy sources. This approach proves optimal in systems that are rich in renewable energy sources, particularly when these sources sometimes generate power more than the demand;
  • CC Strategy: The CC strategy drives generators to operate at full capacity, directing surplus power to charge the battery bank. This strategy shows its strengths in systems with minimal to no renewable energy sources, thus making the most of the available generator capacity to store energy for future use.

3.3.2. HOMER Software Optimization Criteria

  • Economic:
    Total NPC: This represents the financial performance, which accounts for all incurred costs and generated revenues over the system’s lifespan. It includes initial capital costs, costs for replacements, (O&M) expenses, fuel expenditures, possible emissions penalties, and the costs associated with purchasing power from the main grid. On the revenue side, it considers any salvage value and income from selling power back to the main grid [33]:
    C NPC , tot = C ann , tot CRF ( i , N ) ,
    CRF ( i , N ) = i ( 1 + i ) N ( 1 + i ) N 1 ,
    where C NPC , tot represents the total NPC, C ann , tot is the total of annualized costs in (USD/yr), CRF ( ) is the capital recovery factor, N is the project lifetime, and i indicates the discount rate;
    LCOE: This is a widely utilized indicator in the field of energy. HOMER describes LCOE as the mean cost per kWh for the useful electrical power generated by the system [33,36]:
    LCOE = C ann , tot C boiler H served E served ,
    where C boiler is the marginal cost of the boiler in (USD/kWh), H served is the total of the served thermal load in (kWh/yr) (this term is equal to zero in systems that do not have thermal loads), and E served indicates the total electrical load (kWh/yr);
  • Environmental:
    HOMER has the ability to estimate the emissions of six pollutants: carbon dioxide ( CO 2 ), sulfur dioxide ( SO 2 ), nitrogen oxides ( NO x ), particulate matter (PM), unburned hydrocarbons (UHC), and carbon monoxide (CO). This functionality is essential in designing MGs in terms of reducing the emissions of toxic gases [37];
  • Reliability:
    Unmet load: In MGs, insufficient generation leads to unserved electrical load. The fraction of the unmet electrical load f unmet is given by the proportion of that unserved electrical load E unmet to the total annual electrical load E demand , as per the following [33]:
    f unmet = E unmet E demand ;
    Capacity shortage: This is the amount of shortfall when the system’s actual operating capacity is less than the required operating capacity, for both electrical load and reserve load, in a specific period. The capacity shortage fraction f cs is the total amount of capacity shortage E cs that occurs through the year, which is then divided by the total annual electrical load, as per the following [33]:
    f cs = E cs E demand .

3.3.3. Constraints

  • Maximum Annual Capacity Shortage: The percentage of the permissible value of the f cs ;
  • Minimum Renewable Fraction: This constraint limits the fraction of the energy that serves the electrical load from only the renewable energy components:
    f ren = 1 E nonren + H nonren E served + H served ,
    where f ren indicates the renewable fraction in (%), E nonren is the production in kWh/yr from non-renewable sources, E served is the total electrical served load for the system in kWh/yr, and H nonren and H served are the thermal production from nonrenewable sources and the thermal served load, respectively, [33]. The terms for thermal Served load and thermal production are equal to zero in systems that do not have thermal production.

4. Case Study

In this study, a hybrid MG system was applied to a Saudi government facility, TVTC (Technical and Vocational Training Corporation)’s NSII, and then evaluated. The current system, grid-only, has an NPC of USD 7.02M and an LCOE of 0.098 USD/kWh. The proposed work was intended to establish the outcomes of the most economic, reliable, and environmental configuration while satisfying all the economic and technical constraints. The sensitivity was assessed using multiple grid outages in the system. Figure 3 illustrates the schematic of the proposed system, while Figure 4 shows an aerial view of the site indicating the roofs under study. The total roof area was determined as 12,000 m 2 .
The contributions of this work involve the following:
To meet the escalating renewable energy demands across Saudi Arabia, it is essential to leverage this type of research, which bolsters the renewable energy sector in the Najran region;
This study encompasses both an enhanced architectural design and administration of the selected site in an approach that has not been previously executed;
Most of the recent studies that obtained optimal tilt and azimuth angles were compared to HOMER’s default angles for the benefit of the proposed location;
The proposed model picks the most feasible techno-economic, environmental, and technical architectures that satisfy the electrical load demand and available roof area;
The proposed system was subjected to an extensive analysis that included a sensitivity analysis of the system’s resilience.

4.1. Input Data

4.1.1. Meteorological Data

NSII ( 17 32.4 N , 44 13.6 E ) is located in the heart of Najran City, which lies in the southern region of Saudi Arabia. This area experiences a humid–subtropical climate with a dry-winter zone (classified as “CWa” by the Köppen–Geiger system) [38]. It receives ample solar energy throughout the year [39], thus making it highly suitable for solar energy utilization, as shown in Figure 5. For more accurate input data, global horizontal irradiance (GHI) data were imported from KACARE. Figure 6 and Figure 7 show the GHI and clearness index data, as well as the annual average ambient temperature. The annual average received GHI at NSII was 7.07 kWh / m 2 / day .

4.1.2. Electrical Load Data

The electrical load data for the site under study were collected based on the electricity bills for an entire year. Figure 8 illustrates the average monthly electrical load data of the NSII. It can be seen that there is an increase in the electrical load demand during the warmer months of the year due to increased air–conditioning usage. September is the peak month. Therefore, it is important to make sure that the design is capable of meeting the high electricity needs during this time. Table 2 provides additional information about the electrical load. According to Table 2, the peak electrical load and hourly average electrical load were 2160 kW and 327.32 kWh , respectively. The total amount of the electrical load demand was 2 , 865 , 749 kW . The electrical load factor was 0.15 , which is a dimensionless number calculated by dividing the electrical load average by the peak load.

4.1.3. Technical and Economic Data for System Components

In Saudi Arabia, the electricity generation cost for government facilities is set at 0.098 USD/kWh, including VAT. The Arab Petroleum Investments Corporation (APICORP), owned by the Organization of Arab Petroleum Exporting Countries (OAPEC), reported no change in the governmental electrical use tariff [41]. Although the proposed MG is expected to generate excess energy, this study does not include the selling back of energy to the main grid, making this study a conservative estimate of viability. Table 3 summarizes the most important financial and technical specifications of the system components.

4.1.4. Constraints

  • Economic constraints: For the economic constraints, due to the recent chaos in both political and economic affairs around the region, the authors prefer to keep the value of inflation rate equal to zero, as well as the discount rate, while the project lifetime is set at 25 years. The tariff for for government sector is 0.098 USD/KWh including VAT [42];
  • Power reliability constraints: The reliability of the proposed system is constrained by limiting the annual f cs and the f ren as expressed below:
    max ( f cs ) = 0 % ,
    min ( f ren ) = 0 % .
    With respect to the maximum capacity shortage, HOMER eliminates systems that do not serve 100% of the electrical load. With respect to the renewable energy fraction limitation, HOMER will display all the possible systems that can serve the entire electrical load with or without renewable energy components (e.g., with or without the grid);
  • BSS constraints: Over-charging and over-discharging are harmful. Thus, the boundaries of the battery state of charge, SoC max and SoC min , were limited to 100% and 20%, respectively;
  • The nubmer of PV panels ( N PV ):
    N PV , min N PV N PV , max ,
    where N PV , max is the maximum number of PV panels that are equivalent to the roof area.

4.1.5. Roof Area and Inter-Row Distance

For limited-area PV systems, it is essential to know the inter-row distance, to avoid or limit the shadow cast by one PV row on another. To effectively assess shading throughout the year, it is crucial to track the sun’s path at the system’s location, particularly on 21 December (which is the day of maximum potential shading in the northern hemisphere [43]).
The inter-row distance D was calculated as follows:
Δ H = L sin θ tilt ,
D = Δ H cos θ az tan θ elev ,
where Δ H is the PV height from the lower terminal; L is the PV length; and θ tilt , θ az , and θ elev are the angles for the PV array tilt, the azimuth angle, and the sun elevation angle, respectively, as illustrated in Figure 9.

4.2. Cases under Study

This study was controlled by the (CC) strategy. Under this strategy, the generator is run at a higher power level than the immediate demand, and the excess power generated is used to charge the batteries until the batteries are fully charged or reach SoC max . In a recent study [40], the tilt angle was evaluated in Najran City in all seasons. According to that study, the optimal annual angle for all seasons was obtained as 20 . 97 . In our study, the system was examined under various tilt angles that were based on [40] and HOMER software default values, while the azimuth angles were chosen as 0 and 50 degrees.
The NSII total roof area was established as 12,000 m 2 after excluding 5–8% from each roof for maintenance purposes. Based on this (and the equation for the inter-row distance), N PV , max for each case was equivalent to the total roof area. Table 4 shows the different cases for the examined system under various tilt and azimuth angles, as well as values for N PV , max .

4.3. Results

This section details the simulation and optimization outcomes obtained with the HOMER software. For a comprehensive evaluation of these results, three distinct analyses were delivered: economic, environmental, and reliability assessments. Within the economic analysis, the focus was on identifying the most cost-effective system setups, using NPC and LCOE as the determining factors. The environmental analysis ranked the optimal cases by the emissions of CO 2 and the f ren metrics. Lastly, the reliability assessment determined the best system configurations by examining the extent of the electrical load that was not served.
Table 5 illustrates the economic analysis for the cases under study. It shows that all cases recorded a significant saving in the NPC in comparison with the current system, grid-only, configuration. The current system has an NPC of USD 7.02M and an LCOE of 0.098 USD/kWh. Case 6 has the minimum NPC and LCOE values, which are USD 3.18M and 0.0442 USD/kWh, respectively, and this was found to be 2% lower than the HOMER default case, which had NPC and LCOE that were equal to USD 3.2M and 0.04523 USD/kWh, respectively.
For the environmental comparison, especially with respect to measuring the amount of CO 2 emissions, there was a huge difference in favor of the hybrid system for all the cases compared to the current grid-only system (which emits 1,812,134 kg/yr of CO 2 ). Case 6 reduced the emissions of CO 2 by 92 % at 142,410 kg/yr compared to the grid-only system, and this reduction relied on its high f ren , which was 92.1 % . In contrast, Case 3 had the lowest f ren at 80.7 % , as well as reduced emissions in CO 2 of 81 % at 350,413 kg/yr. Table 6 outlines the environmental comparison for all the configurations when compared with the current grid-only system.
For the reliability assessment, and due to the constraint f cs , an excess energy is expected. Excess energy refers to the energy that cannot be utilized or stored, thereby resulting in the need to discard or reduce it. This situation arises when there is an excess of power generated, either from RESs or when the generator produces more electricity than required, and the batteries are unable to absorb all of it. All cases showed an unmet load of zero; meanwhile, there was a significant amount of surplus that also varied between all cases. However, the study does not include selling back of energy to the main grid, in which case, producing excess electricity would be an advantage of the system. The excess electricity fraction, f excess , refers to the ratio of the total excess electricity to the total produced electricity. Therefore, Case 6 showed the greatest surplus compared to the other cases, as Table 7 indicates, while Case 3 had the lowest f excess .
Among all the cases under this study, Case 6, with a 20 . 97 tilt angle and a 50 azimuth angle, shows superiority in the economic, environmental, and reliability criteria assessments compared to the current system. Case 6 achieved a lower NPC at USD 3,184,478 reducing the total cost by 54.67%. In the environmental evaluation, Case 6 emitted only 142,410 kg/yr of CO 2 reducing the emissions by 92%. For the reliability assessments, and despite selling back the excess electricity to the main grid is not considered in the study, Case 6 shows 1,154,073 KWh/yr excess energy, which might be converted to profits by participating in other systems. Table 8 shows the optimal cases based on the three criteria assessments.

4.4. Sensitivity

Resilience

On 22 September, a day that was characterized by significant electrical demand, every component of the system was actively involved in handling the electrical load demand continuously for the entire 24 h. A thorough resilience evaluation was conducted using four principal scenarios. These were then applied to Case 6, as this was deemed the most effective among all the cases studied. As depicted in Table 9, these scenarios encompassed situations of grid outage, planned downtime for battery maintenance, and planned downtime for PV maintenance, as well as instances where all conditions occurred simultaneously.
Figure 10 demonstrates how the various elements of the system engaged. It is notable that the DG did not operate continuously over a 24-h period. Conversely, the BSS uniquely addressed the electrical load requirements from 7 PM until the early morning hours. During the peak load period from 6 AM to 6 PM, all system components, excluding the DG, were actively involved in meeting the load demand.
The ideal system configuration, i.e., one that balances both economic efficiency and resilience, can be determined through optimization. The optimization results were classified and grouped according to the resilience assessment scenarios presented in Table 10. When comparing the normal operation, i.e., Case 6, to Scenarios 1, 2, and 3, it was notable that the NPC increased by approximately 0.2%, 0.16%, and 0.72%, respectively. However, Scenario 4 showed a significant change in the NPC, with a 2.68% increase compared to normal operation.
In Scenario 1, the DG system served as a backup during grid absence, as shown in Figure 11. In Scenario 2, the grid acted as a substitute for the BSSs when they were under maintenance, as depicted in Figure 12. Scenario 3 addressed the PV power absence by increasing the grid purchases. Furthermore, from Figure 13, it is evident that the BSSs did not draw power from the grid. Scenario 4 represents the worst−case scenario, where there was an energy shortfall due to grid, PV, and BSS supply absence. Notably, during this comprehensive outage period, the DG demonstrated its capacity to meet the load demand for a day, as illustrated in Figure 14. Furthermore, it was notable that all the scenarios resulted in meeting load demands with 0 kWh/year unmet load, which matched the operating conditions.

5. Conclusions

In this study, the application of a hybrid MG system at the NSII, which is located in Najran City in the southern region of Saudi Arabia, was investigated with a focus on assessing its economic, environmental, and reliability aspects under various tilt and azimuth angles. This research contributes to the renewable energy sector in the Najran region, thereby addressing the growing demand for renewable energy sources across Saudi Arabia. A novel aspect of this study lies in the comprehensive approach it takes, whereby it integrates both innovative architectural design and effective system management for the chosen site. Additionally, the study incorporated the latest research findings to determine the optimal tilt and azimuth angles for the specific location, which was achieved by comparing them to the default angles from the HOMER software.
The proposed model selects technically and economically feasible configurations, which were achieved by analyzing environmental considerations while ensuring the reliable supply of electrical load demands within the available roof area. The study also conducted an extensive sensitivity analysis, and it assessed the system’s resilience under various scenarios.
Among the six different cases considered, the configuration in Case 6, with a tilt angle of 20.97° and an azimuth angle of 50°, emerged as the most favorable in terms of economic considerations, environmental impact, and system reliability. It achieved reductions of 54.69% in NPC and 92% in CO 2 compared with the current grid-only system, all while meeting the entire electrical demand for all of the applied resilience scenarios.
In summary, this research builds upon recent studies and real input data to provide a robust and well-supported evaluation of the proposed hybrid MG system. It highlights the potential of the Najran region in contributing to Saudi Arabia’s renewable energy endeavors, and it also underscores the importance of further research and investment in this promising area.

Author Contributions

Conceptualization, M.A. and M.A.Z.; methodology, M.A.; software, M.A.; validation, M.A.Z.; formal analysis, M.A. and M.A.Z. investigation, M.A.Z.; resources, M.A.; data curation, M.A; writing—original draft preparation, M.A.; writing—review and editing, M.A. and M.A.Z.; visualization, M.A.; supervision, M.A.Z. project administration, M.A.Z. All authors have read and agreed to the published version of the manuscript.

Funding

This research received no external funding.

Data Availability Statement

Data are contained within the article.

Conflicts of Interest

The authors declare no conflicts of interest.

References

  1. Akinpelu, A.; Alam, M.S.; Shafiullah, M.; Rahman, S.M.; Al-Ismail, F.S. Greenhouse Gas Emission Dynamics of Saudi Arabia: Potential of Hydrogen Fuel for Emission Footprint Reduction. Sustainability 2023, 15, 5639. [Google Scholar] [CrossRef]
  2. Ahmad, W.; Ahmad, I.; Abdurraqeeb, A.M. Renewable Energy in Kingdom of Saudi Arabia: Opportunities and Prospects. In Proceedings of the 2017 9th IEEE-GCC Conference and Exhibition (GCCCE), Manama, Bahrain, 8–11 May 2017; pp. 1–9. [Google Scholar] [CrossRef]
  3. Saudi Vision 2030. Available online: http://www.vision2030.gov.sa/en/ (accessed on 30 October 2023).
  4. Country Analysis Executive Summary: Saudi Arabia. Available online: https://www.eia.gov/international/analysis/country/SAU (accessed on 30 October 2023).
  5. Saudi General Authority for Statistics. Available online: https://www.stats.gov.sa/en/1081 (accessed on 30 October 2023).
  6. Energy Institute. Available online: https://www.energyinst.org/ (accessed on 30 October 2023).
  7. Mathew, M.; Hossain, M.S.; Saha, S.; Mondal, S.; Haque, M.E. Sizing approaches for solar photovoltaic-based microgrids: A comprehensive review. IET Energy Syst. Integr. 2022, 4, 1–27. [Google Scholar] [CrossRef]
  8. Alharthi, Y.; Siddiki, M.; Chaudhry, G. Resource Assessment and Techno-Economic Analysis of a Grid-Connected Solar PV-Wind Hybrid System for Different Locations in Saudi Arabia. Sustainability 2018, 10, 3690. [Google Scholar] [CrossRef]
  9. Alhawsawi, E.Y.; Habbi, H.M.D.; Hawsawi, M.; Zohdy, M.A. Optimal Design and Operation of Hybrid Renewable Energy Systems for Oakland University. Energies 2023, 16, 5830. [Google Scholar] [CrossRef]
  10. AlKassem, A.; Draou, A.; Alamri, A.; Alharbi, H. Design Analysis of an Optimal Microgrid System for the Integration of Renewable Energy Sources at a University Campus. Sustainability 2022, 14, 4175. [Google Scholar] [CrossRef]
  11. Ekren, O.; Hakan Canbaz, C.; Güvel, Ç.B. Sizing of a solar-wind hybrid electric vehicle charging station by using HOMER software. J. Clean. Prod. 2021, 279, 123615. [Google Scholar] [CrossRef]
  12. Aly, A.M.; Kassem, A.M.; Sayed, K.; Aboelhassan, I. Design of Microgrid with Flywheel Energy Storage System Using HOMER Software for Case Study. In Proceedings of the 2019 International Conference on Innovative Trends in Computer Engineering (ITCE), Aswan, Egypt, 2–4 February 2019; pp. 485–491. [Google Scholar] [CrossRef]
  13. Dahiru, A.T.; Tan, C.W. Optimal sizing and techno-economic analysis of grid-connected nanogrid for tropical climates of the Savannah. Sustain. Cities Soc. 2020, 52, 101824. [Google Scholar] [CrossRef]
  14. Islam, M.; Das, B.K.; Das, P.; Rahaman, M.H. Techno-economic optimization of a zero emission energy system for a coastal community in Newfoundland, Canada. Energy 2021, 220, 119709. [Google Scholar] [CrossRef]
  15. Luta, D.N.; Raji, A.K. Optimal sizing of hybrid fuel cell-supercapacitor storage system for off-grid renewable applications. Energy 2019, 166, 530–540. [Google Scholar] [CrossRef]
  16. Mandal, S.; Das, B.K.; Hoque, N. Optimum sizing of a stand-alone hybrid energy system for rural electrification in Bangladesh. J. Clean. Prod. 2018, 200, 12–27. [Google Scholar] [CrossRef]
  17. Elsaraf, H.; Jamil, M.; Pandey, B. Techno-Economic Design of a Combined Heat and Power Microgrid for a Remote Community in Newfoundland Canada. IEEE Access 2021, 9, 91548–91563. [Google Scholar] [CrossRef]
  18. Groppi, D.; Astiaso Garcia, D.; Lo Basso, G.; Cumo, F.; De Santoli, L. Analysing economic and environmental sustainability related to the use of battery and hydrogen energy storages for increasing the energy independence of small islands. Energy Convers. Manag. 2018, 177, 64–76. [Google Scholar] [CrossRef]
  19. Islam, M.S. A techno-economic feasibility analysis of hybrid renewable energy supply options for a grid-connected large office building in southeastern part of France. Sustain. Cities Soc. 2018, 38, 492–508. [Google Scholar] [CrossRef]
  20. Kumar, J.; Suryakiran, B.; Verma, A.; Bhatti, T. Analysis of techno-economic viability with demand response strategy of a grid-connected microgrid model for enhanced rural electrification in Uttar Pradesh state, India. Energy 2019, 178, 176–185. [Google Scholar] [CrossRef]
  21. Li, C.; Zhou, D.; Zheng, Y. Techno-economic comparative study of grid-connected PV power systems in five climate zones, China. Energy 2018, 165, 1352–1369. [Google Scholar] [CrossRef]
  22. Liu, J.; Jian, L.; Wang, W.; Qiu, Z.; Zhang, J.; Dastbaz, P. The role of energy storage systems in resilience enhancement of health care centers with critical loads. J. Energy Storage 2021, 33, 102086. [Google Scholar] [CrossRef]
  23. Masrur, H.; Howlader, H.O.R.; Elsayed Lotfy, M.; Khan, K.R.; Guerrero, J.M.; Senjyu, T. Analysis of Techno-Economic-Environmental Suitability of an Isolated Microgrid System Located in a Remote Island of Bangladesh. Sustainability 2020, 12, 2880. [Google Scholar] [CrossRef]
  24. Sawle, Y.; Jain, S.; Babu, S.; Nair, A.R.; Khan, B. Prefeasibility Economic and Sensitivity Assessment of Hybrid Renewable Energy System. IEEE Access 2021, 9, 28260–28271. [Google Scholar] [CrossRef]
  25. Mohammad Bagher, A. Types of Solar Cells and Application. Am. J. Opt. Photonics 2015, 3, 94. [Google Scholar] [CrossRef]
  26. Joseph, A.; Shahidehpour, M. Battery storage systems in electric power systems. In Proceedings of the 2006 IEEE Power Engineering Society General Meeting, Montreal, QC, Canada, 18–22 June 2006; p. 8. [Google Scholar] [CrossRef]
  27. Yimen, N.; Hamandjoda, O.; Meva’a, L.; Ndzana, B.; Nganhou, J. Analyzing of a Photovoltaic/Wind/Biogas/Pumped-Hydro Off-Grid Hybrid System for Rural Electrification in Sub-Saharan Africa—Case study of Djoundé in Northern Cameroon. Energies 2018, 11, 2644. [Google Scholar] [CrossRef]
  28. Li, J.; Liu, P.; Li, Z. Optimal design and techno-economic analysis of a solar-wind-biomass off-grid hybrid power system for remote rural electrification: A case study of west China. Energy 2020, 208, 118387. [Google Scholar] [CrossRef]
  29. Traoré, A.; Elgothamy, H.; Zohdy, M.A. Optimal Sizing of Solar/Wind Hybrid Off-Grid Microgrids Using an Enhanced Genetic Algorithm. J. Power Energy Eng. 2018, 6, 64–77. [Google Scholar] [CrossRef]
  30. Faraji, J.; Babaei, M.; Bayati, N.; A.Hejazi, M. A Comparative Study between Traditional Backup Generator Systems and Renewable Energy Based Microgrids for Power Resilience Enhancement of a Local Clinic. Electronics 2019, 8, 1485. [Google Scholar] [CrossRef]
  31. Eltamaly, A.M.; Mohamed, M.A. A Novel Design and Optimization Software for Autonomous PV/Wind/Battery Hybrid Power Systems. Math. Probl. Eng. 2014, 2014, 637174. [Google Scholar] [CrossRef]
  32. Atia, R.; Yamada, N. Sizing and Analysis of Renewable Energy and Battery Systems in Residential Microgrids. IEEE Trans. Smart Grid 2016, 7, 1204–1213. [Google Scholar] [CrossRef]
  33. HOMER Pro. 2017. Available online: https://www.homerenergy.com/ (accessed on 30 October 2023).
  34. Santos, L.H.S.; Silva, J.A.A.; Lopez, J.C.; Arias, N.B.; Rider, M.J.; Da Silva, L.C.P. Integrated Optimal Sizing and Dispatch Strategy for Microgrids Using HOMER Pro. In Proceedings of the 2021 IEEE PES Innovative Smart Grid Technologies Conference—Latin America (ISGT Latin America), Lima, Peru, 15–17 September 2021; pp. 1–5. [Google Scholar] [CrossRef]
  35. Cristian, H.; Bizon, N.; Alexandru, B. Design of hybrid power systems using HOMER simulator for different renewable energy sources. In Proceedings of the 2017 9th International Conference on Electronics, Computers and Artificial Intelligence (ECAI), Targoviste, Romania, 29 June–1 July 2017; pp. 1–7. [Google Scholar] [CrossRef]
  36. Bracco, S.; Delfino, F.; Laiolo, P.; Pagnini, L.; Piazza, G. Evaluating LCOE in sustainable microgrids for smart city applications. E3S Web Conf. 2019, 113, 03006. [Google Scholar] [CrossRef]
  37. Niringiyimana, E.; Wanquan, S.; Dushimimana, G.; Niyigena, J.B. Hybrid Renewable Energy System Design and Optimization for Developing Countries Using HOMER Pro: Case of Rwanda. In Proceedings of the 2023 7th International Conference on Green Energy and Applications (ICGEA), Singapore, 10–12 March 2023; pp. 72–76. [Google Scholar] [CrossRef]
  38. Mustafa, J.; Alqaed, S.; Almehmadi, F.A.; Jamil, B. Development and comparison of parametric models to predict global solar radiation: A case study for the southern region of Saudi Arabia. J. Therm. Anal. Calorim. 2022, 147, 9559–9589. [Google Scholar] [CrossRef]
  39. Global Solar Atlas—Saudi Arabia. Available online: https://globalsolaratlas.info/ (accessed on 3 November 2023).
  40. Alqaed, S.; Mustafa, J.; Almehmadi, F.A.; Jamil, B. Estimation of ideal tilt angle for solar-PV panel surfaces facing south: A case study for Najran City, Saudi Arabia. J. Therm. Anal. Calorim. 2023, 148, 8641–8654. [Google Scholar] [CrossRef]
  41. APICORP. Saudi Energy Price Reform Getting Serious; APICORP Energy Research: Riyadh, Saudi Arabia, 2018; Volume 3, p. 5. [Google Scholar]
  42. Mikayilov, J. How Have Electricity Tariffs Evolved in Saudi Arabia Over the Last Half Century (1974–2023)? Data Insight; KAPSARC: Riyadh, Saudi Arabia, 2023. [Google Scholar]
  43. Al-Quraan, A.; Al-Mahmodi, M.; Alzaareer, K.; El-Bayeh, C.; Eicker, U. Minimizing the Utilized Area of PV Systems by Generating the Optimal Inter-Row Spacing Factor. Sustainability 2022, 14, 6077. [Google Scholar] [CrossRef]
Figure 1. Electric power generation by sources in Saudi Arabia from 2016 to 2022 [6].
Cleantechnol 06 00020 g001
Figure 2. HOMER flowchart.
Cleantechnol 06 00020 g002
Figure 3. A schematic of the proposed system.
Cleantechnol 06 00020 g003
Figure 4. An aerial view of NSII’s roofs (source: Google Earth).
Cleantechnol 06 00020 g004
Figure 5. Map of the global horizontal solar irradiation of Saudi Arabia [40].
Cleantechnol 06 00020 g005
Figure 6. Annual GHI and clearness index.
Cleantechnol 06 00020 g006
Figure 7. Annual average ambient temperature.
Cleantechnol 06 00020 g007
Figure 8. The average monthly electrical load.
Cleantechnol 06 00020 g008
Figure 9. Schematic of the proposed system’s calculated angles.
Cleantechnol 06 00020 g009
Figure 10. System components participation across 22 September.
Cleantechnol 06 00020 g010
Figure 11. System performance during grid outage.
Cleantechnol 06 00020 g011
Figure 12. System performance on a BSS maintenance schedule.
Cleantechnol 06 00020 g012
Figure 13. System performance on a PV maintenance schedule.
Cleantechnol 06 00020 g013
Figure 14. System performance during a comprehensive outage.
Cleantechnol 06 00020 g014
Table 1. Survey of previous works.
Reference/ LocationGrid DependencyHRES ComponentsObjectivesMain ConstraintsResilience/ ReliabilitySensitivity
[7], BangladeshON-GridPV DG BSSEconomic Environmental Reliability P grid , P G , Cap , P inv , Cap , P PV , Cap , E Bat , Cap , SoCUnmet Load, Loss of Energy Probability (LEP)-
[8], Saudi ArabiaON-GridPV WTEconomic Environmental P PV , Cap   P WT , Cap --
[9], MI, USAON-Grid, OFF-GridPV CHP WT BSSEconomicSoCUnmet Load-
[10], Saudi ArabiaON-gridPV WTEconomic Environmental P PV , Cap   P WT , Cap , f RE -Variation in initial LCOE
[11], TurkyOFF-GridPV WT BSSEconomicRoof Area--
[13], NigeriaOn-GridPV DG BSSEconomic Environmental ReliabilityDepth of Discharge (DoD)Unmet LoadRE fraction
[14], CanadaOFF-GridPV WT Hydro BSS PHS DGEconomic EnvironmentalCapacity Shortage, Load Operating Reserve, Emissions PenaltiesUnmet LoadVariation in irradiance, wind speed, PV cost, water flow rates, load demand, and pipe losses flow
[15], South AfricaOFF-GridPV SC FCEconomic ReliabilityCapacity Shortage, Economics Constraints, SoCUnmet LoadVariation in the cost of hydrogen storage
[16], BangladeshOFF-GridPV WT DG BSSEconomic Environmental ReliabilitySoC, DG Starting Threshold-Variation in economical parameters
[17], CanadaOFF-GridPV WT FC HydroEconomic P inv , Cap , P PV , Cap , P WT , Cap , P FC , Cap --
[18], ItalyOFF-GridPV BSS FC DGEconomic Environmental Reliability P PV , Cap , f RE -Variation in economic and technical parameters
[19], FranceON-GridPV HydroEconomic Environmental Reliability f RE , Capacity Shortage, Operating Reserve-Variation in Electric load, H2 load, economic and technical parameters
[20], IndiaON-GridPV BSSEconomic Environmental ReliabilityGrid Time Constrained, Initial Cost, Load Demand Balance, P BSS , SoC, f RE -Variation in grid price against the economic parameters
[22], IranON-GridPV WT BSS DGEconomic Environmental ReliabilitySoCEmerging electric outagesVariation in economic and technical parameters
Table 2. Annual electrical load data.
MetricValue
Peak load2160 KW
Load average327.32 KWh
Load factor0.15
Total annual load demand2,865,749 KW
Table 3. Technical and economic data.
ComponentParameterDetailsValueUnit
PVManufacturer
Measurements 2.238m
Measurements 1.3m
Rated Capacity (YPV)Trina Solar0.66kW
Temperature Coefficient ( α P )Length−0.34%/°C
Operating Temperature (NOCT)Width43°C
Efficiency (fPV) 21.25%
Panel lifetime 25Year
Capital Cost 147$/kWh
Replacement cost 110$/kWh
O&M cost 10$/Year
BSSManufacturerHOMER Generic
Nominal voltage600V
Nominal capacity100kWh
Nominal Capacity167Ah
Roundtrip efficiency90%
Maximum charge current167A
Initial SOC100%
Minimum SOC20%
Maximum discharge current500A
Lifetime5Year
Capital Cost100$/kWh
Replacement cost100$/kWh
O&M cost10$/Year
ConverterManufacturerSchneider
Capacity (Pinv)1kW
Capital Cost280$
Replacement cost280$
O&M cost10$/Year
Efficiency ( η dc / ac )97%
Lifetime25Year
DGManufacturerAutosize Genset
Capital Cost500$/KW
Replacement cost500$/KW
O&M cost0.030$/op.h
Lifetime15,000h
ProjectLifetime (N) 25year
Table 4. System cases based on tilt and azimuth angles.
CaseTiltAzimuth N PV , max Tilt Angle Reference
117.5503185[33] HOMER default
2003878[40] Summer
347.702938[40] Winter
447.7502938
520.9703115[40] Optimal
620.97503115
Table 5. Economic comparative optimization results based on the current system (grid-only).
CasePVBSSConverterDGGridNPCLCOEReduction
(Unit) (Unit) (KW) (KW) (KW) ($) ($/KWh) (%)
63030659850225,3333,184,478.000.044254.67
13168809520249,3643,242,472.000.0452353.84
531067510040269,3903,266,806.000.0455753.50
232738610000237,8263,268,012.000.0455953.48
42924998880296,8523,347,622.000.046752.35
32892799240554,4523,673,245.000.0512447.71
Table 6. Environmental comparative optimization results based on the current system (grid-only).
CasePVBSSConverterDGGridRF CO 2 Reduction
(Unit) (Unit) (KW) (KW) (KW) (%) (Kg/yr) (%)
63030659850225,33392.1142,41092
232738610000237,82691.7150,30692
13168809520249,36491.3157,59891
531067510040269,39090.6170,25591
42924998880296,85289.6187,61190
32892799240554,45280.7350,41381
Table 7. Reliability comparative optimization results.
CasePVBSSConverterDGGridExcess Electricity f excess
(Unit) (Unit) (KW) (KW) (KW) (KWh/yr) (%)
63030659850225,3331,154,07327.4
13168809520249,3641,088,18926.3
531067510040269,3901,037,57725.4
232738610000237,8261,032,19725.3
42924998880296,8521,016,52024.9
32892799240554,452806,48921.1
Table 8. Comparative analysis based on economic, environmental, and reliability criteria.
CasePVBSSConverterDGGridNPC CO 2 f excess
(Unit) (Unit) (kW) (kW) (kW) (Reduction) (Reduction) (%)
63030659850225,33354.67%92%27.4
13168809520249,36453.84%91%26.3
531067510040269,39053.50%91%25.4
232738610000237,82653.48%92%25.3
42924998880296,85252.35%90%24.9
32892799240554,45247.71%81%21.1
Table 9. Resilience Evaluation Scenarios.
ScenarioOutageDuration
Scenario 1Grid24 h
Scenario 2BSS24 h
Scenario 3PV24 h
Scenario 4Grid BSS PV24 h
Table 10. The resilience assessment results.
ScenarioPVBSSConverterDGGridNPCLCOEUnmet Load
(Unit) (Unit) (KW) (KW) (KW) ($) ($/KWh) (KWh/yr)
Base case3030659850225,3333,184,4780.04420
Scenario 131087010002400195,3033,190,9980.044520
Scenario 23086649910216,7233,189,4680.044490
Scenario 33030659850236,0023,207,3890.044740
Scenario 43097629982400202,5623,269,8050.045620
Disclaimer/Publisher’s Note: The statements, opinions and data contained in all publications are solely those of the individual author(s) and contributor(s) and not of MDPI and/or the editor(s). MDPI and/or the editor(s) disclaim responsibility for any injury to people or property resulting from any ideas, methods, instructions or products referred to in the content.

