The Application of UAVs in the Evaluation of Thermal Comfort Levels in Buildings Equipped with Internal Greenhouses
Abstract
:1. Introduction
1.1. Internal Environment Variables
1.2. UAVs in the Environmental Monitoring Task
1.2.1. The Implementation of UAVs in Environmental Monitoring Missions
1.2.2. Indoor Flight Challenges
2. Objectives
3. Equipment and Methods
- The first one, BTS, is able to perform a comprehensive assessment of buildings, calculating the impacts of several environmental variables and weather conditions;
- The second one, UAV DS, can predict the movement of UAVs in indoor environments. This numerical model is capable of registering the mission associated with three-dimensional trajectory and the environmental variables associated with the environmental sensors used in the mission.
3.1. Building Design Generation
- Trapezoidal flat surfaces in cylindrical coordinates (with the radius, angle, and height), considering vertical, horizontal, and inclined surfaces;
- Trigonometric equations used in the auditorium surfaces and the greenhouse surface generation;
- Three-dimensional ellipsoid equation used in the dome surface generation.
- Vertical and horizontal trapezoidal surfaces, using flat and cylindrical surfaces;
- Radius, angle, and height (cylindrical coordinates).
- Vertical trapezoidal surfaces constituted through four points, using cylindrical surfaces;
- Radius, angle, and height (cylindrical coordinates).
- Inclined trapezoidal surfaces, using an ellipsoidal surface;
- Angle and height;
- Ellipsoidal equation considers the radius of the greenhouse in the X and Y direction;
- Ellipsoidal equation considers the height of the dome in the Z direction.
- Auditorium with double brick in the lateral areas in contact with the outside environment;
- Auditorium with a single brick in the areas in contact with the central space (in the central area);
- Auditorium with a door located between the auditorium and the greenhouse;
- Auditorium with an upper covering in contact with the outside environment;
- Auditorium with a floor in contact with the ground;
- Auditorium with a glazed surface placed opposite the wall in contact with the central space;
- Greenhouse with a glazed surface in contact with the external environment;
- Dome with a glazed surface in contact with the external environment.
- One that considers the roof of the greenhouse to be flat;
- Another that considers the roof of the greenhouse to be a dome;
- In both situations, the ceilings are constructed of transparent glazed surfaces.
- A total of 100 people between 8 am and 12 pm;
- A total of 100 people between 2 pm and 6 pm.
- In the double bricks used as a boundary between the lateral external and internal environments, eleven layers were considered;
- In the single bricks used as a boundary between the central greenhouse and the auditoriums, seven layers were considered;
- In the ground used as a boundary between the internal environment and the soil, ten layers were considered;
- In the roof used as a boundary between the top external and internal environment, nine layers were considered.
- In the window located in the external area of the auditorium, a single glass is considered;
- In the dome located in the ceiling of the central greenhouse, a single glass is considered.
- Auditorium spaces were limited by the opaque and transparent surfaces;
- Central greenhouse were limited by the opaque and transparent surfaces.
3.2. IAQ and Airflow Rate
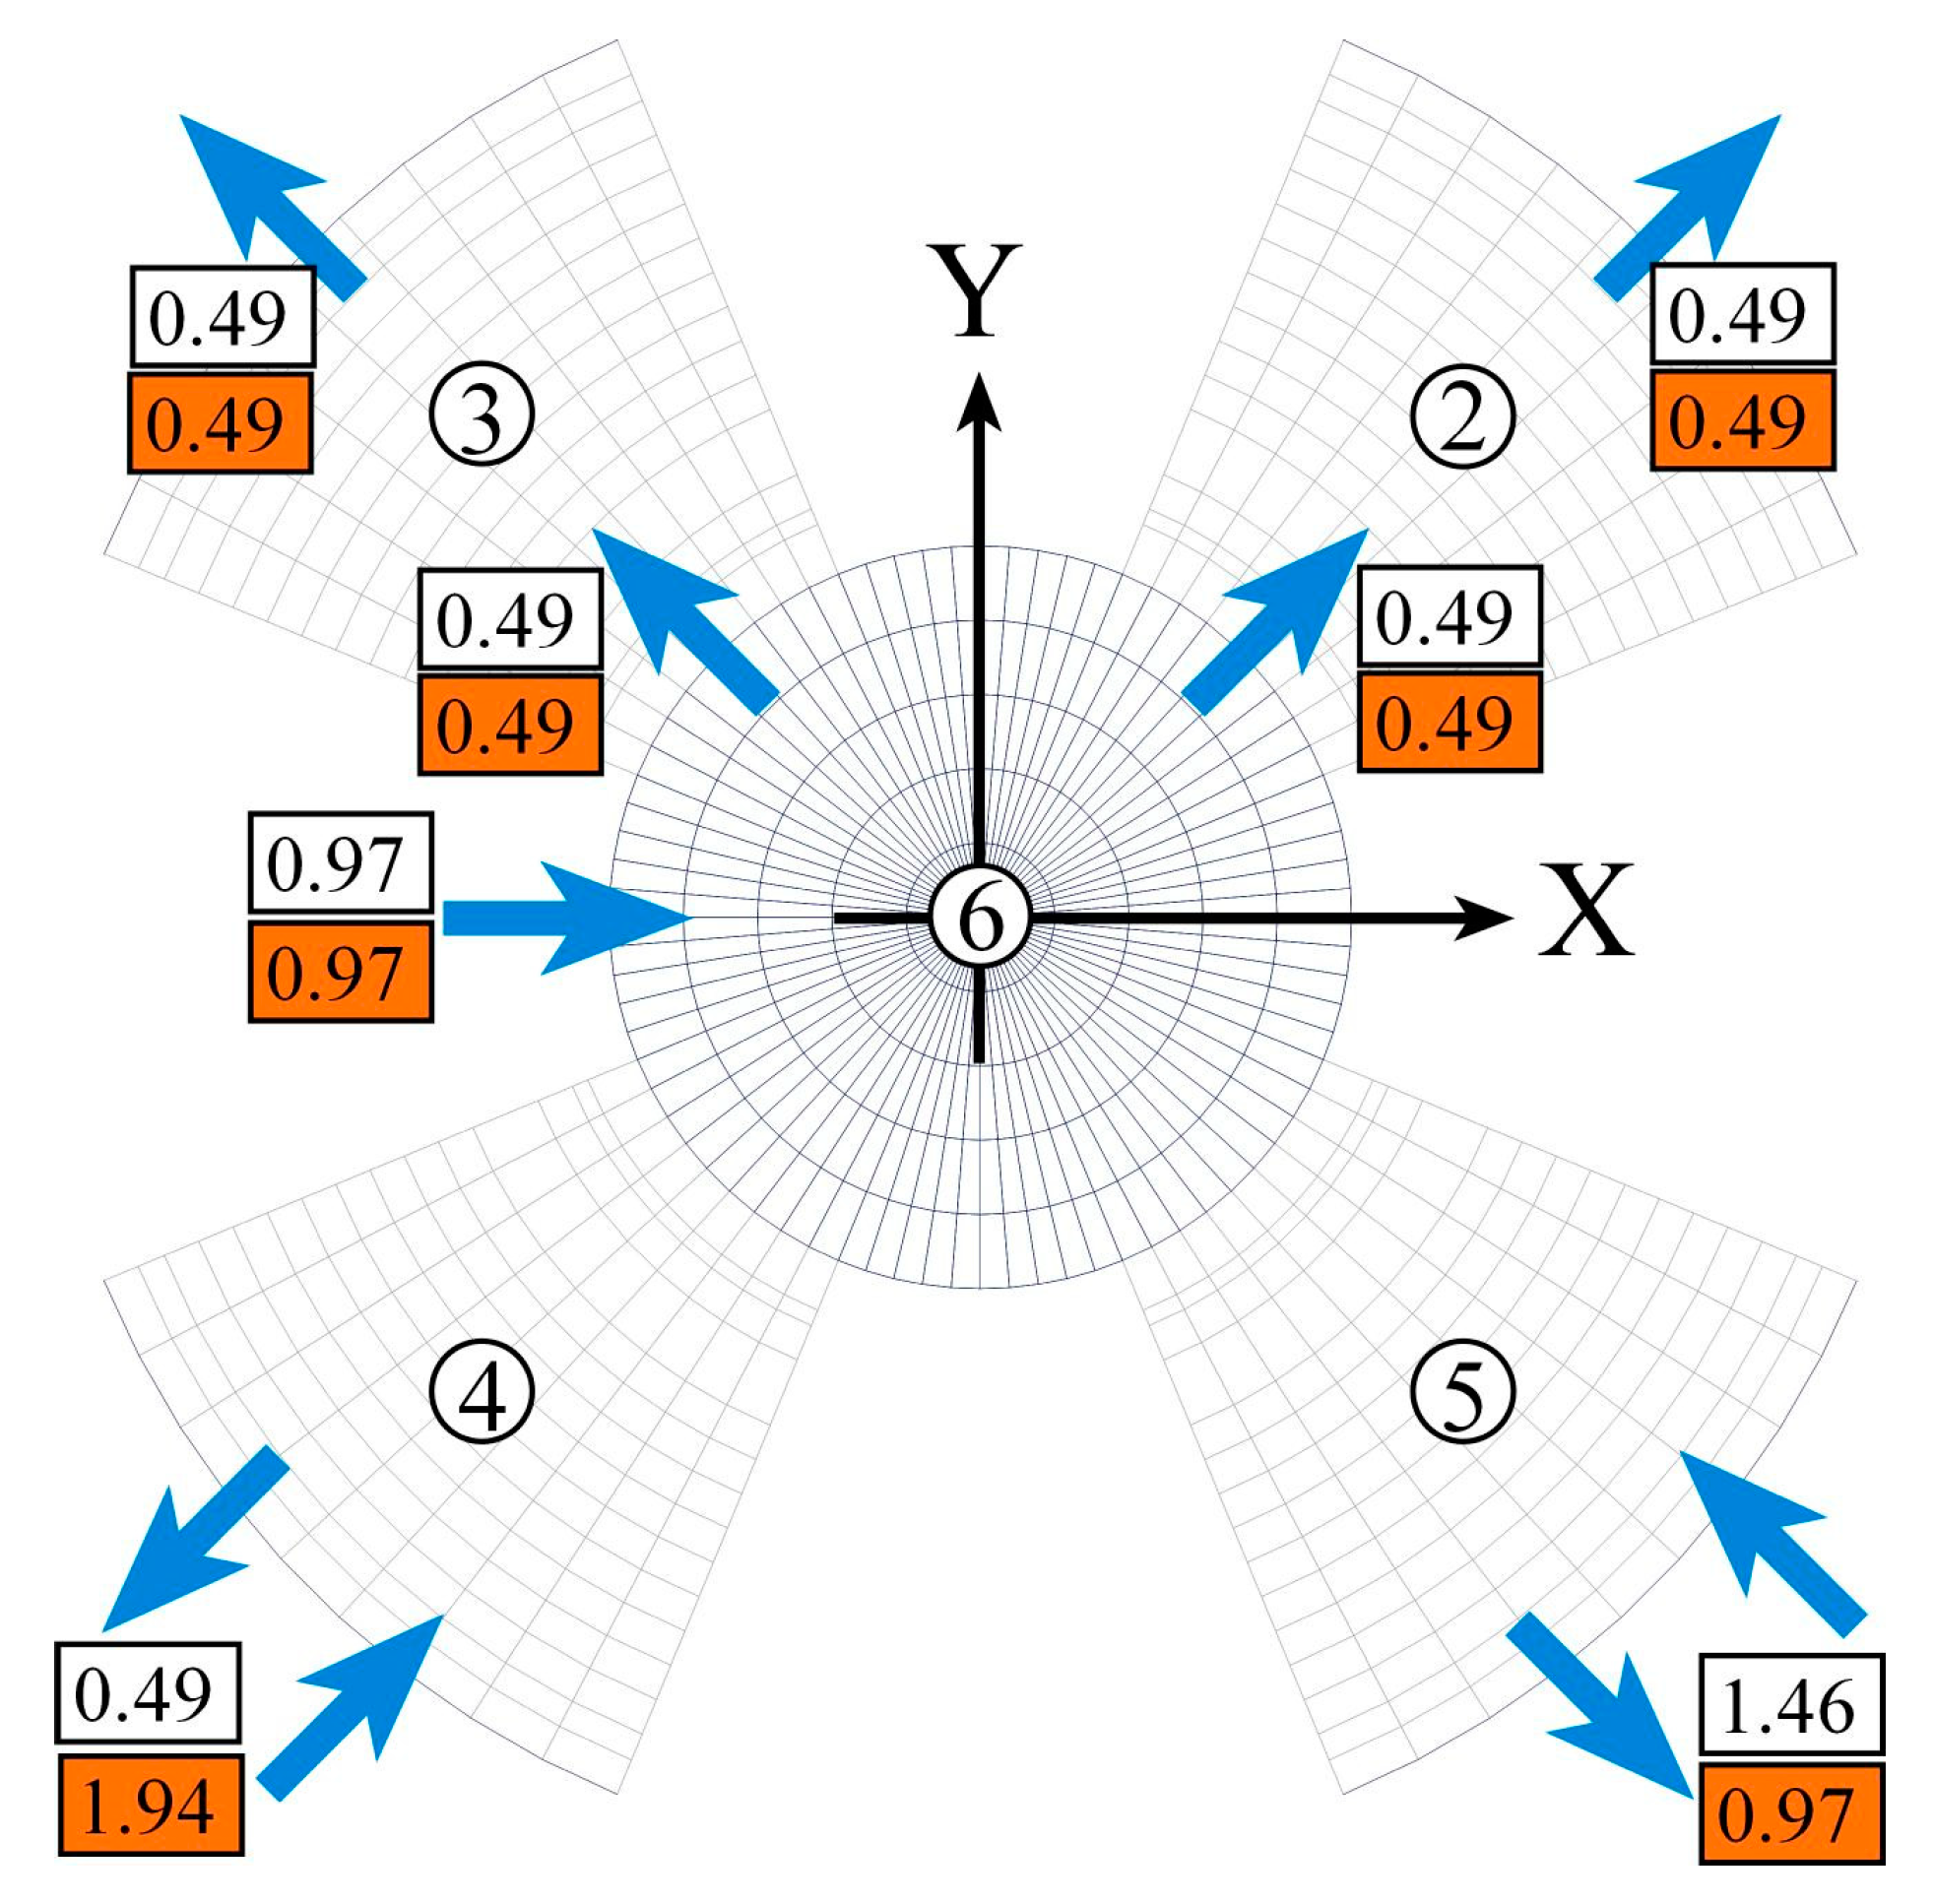
- In the space facing south-east the airflow rate is higher in the morning than in the afternoon, because the space is subjected to solar radiation in the morning;
- In the space facing south–west the airflow rate is higher in the afternoon than in the morning, because the space is subjected to solar radiation in the afternoon.
- From the external environment to the central greenhouse;
- From the central greenhouse to the north auditoriums;
- From the north auditoriums to the external environment;
- From the external environment to the south auditoriums;
- From the south auditoriums to the external environment.
3.3. Thermal Comfort and PMV Numerical Model
3.3.1. PMV Evaluation by the BTS
- A group of environmental variables and a group of personal parameters;
- The environmental variables group considers the indoor air temperature, the indoor air velocity, the indoor air relative humidity, and the indoor mean radiant temperature (MRT);
- A group of personal parameters considers the clothing level and the activity level.
- The air temperature, which is calculated using the BTS numerical model;
- The air velocity, which is calculated using numerical methodologies based on the numerical simulation of airflow around the occupants;
- The MRT of the surrounding surfaces. This temperature is calculated by the BTS numerical model on the basis of the weighted average of the surrounding space surfaces;
- The relative humidity of the air, which is calculated using the BTS numerical model;
- Personal parameters, such as the level of activity and clothing of the people.
3.3.2. PMV Evaluation by the UAV
- The air temperature is registered by the environmental air temperature virtual sensors, using the BTS information, in the same space and at the same instant. The space and the time instant are determined by the adopted mission;
- The air velocity, which is calculated using numerical methodologies based on the numerical simulation of airflow around the occupants;
- The MRT, which is associated with the surrounding surfaces, considers four different parameters:
- ○
- The floor temperature;
- ○
- The lateral walls’ temperatures;
- ○
- The ceiling temperature;
- ○
- Correlation with the air temperature registered by the UAV sensor, as an approximation;
- The relative humidity of the air, which is registered by the air relative humidity virtual sensors, using the BTS information, in the same space and at the same instant. The space and the instantaneous values are determined by the adopted mission;
- Personal parameters, such as the level of activity and clothing of people.
3.4. BTS Numerical Model
- Occupied and non-occupied internal spaces;
- Opaque bodies, such as the internal and external walls, the ceiling, the floor, and others;
- Transparent bodies, such as windows, doors, and others.
- Conduction: The conduction is observed in opaque bodies, namely between the different layers. Fourier’s law of conduction is used. The conduction, calculated between the different layers using Cartesian coordinates, evaluates the flux in transient conditions;
- Convection: Convection is used between the surfaces and the surrounding environment calculated using Newton’s law of convection. In this calculation, the surface area, surrounding fluid, and convective heat transfer coefficient are used. This phenomenon is calculated for both surfaces of the opaque, transparent, and interior bodies. The convection is evaluated on both sides of the surfaces. In the opaque, transparent, and interior bodies, horizontal, vertical, and inclined surfaces are included. In all bodies, natural, forced, and mixed convections are considered;
- Radiation: In radiation, two phenomena are considered: solar incident radiation and heat exchange by radiation. This calculation considers the main building geometry. All calculations consider the generated grid and its elements. When the grid increases, the calculated values become closer to the real values. However, a high grid concentration requires a longer calculation time. In all calculations, the shading devices are considered, as well as all opaque, transparent, and indoor surfaces. The solar incident radiation is observed on inside and outside surfaces. This calculation is evaluated all day. The location of the sun and the direct, indirect, and reflected solar radiation are considered, as well as the presence of the cloudy sky. The internal solar radiation entering transparent bodies is distributed around the opaque and indoor bodies. Solar radiation contributes to increasing the temperature of the body’s external and internal layers. Heat gain by radiation is calculated for each internal space. This calculation depends on the temperatures of the surfaces and the view factors calculated between all the surfaces. Two methods can be applied: The Radiosity method and the MRT method;
- Evaporation and condensation: Water evaporation and condensation are calculated between the opaque, transparent, and indoor body surfaces and the environment. In this case, the water vapor flux and the evaporation and condensation latent heat are considered. The water vapor flux, caused by convection and diffusion between the surfaces and the environment, is considered. For mass convection, the area, the water mass concentration on the surface and the air, and the convection mass transfer coefficient are used;
- Adsorption and desorption: Water vapor can be adsorbed and desorbed in opaque bodies, namely on both surfaces that are in contact with the interior spaces. In this case, when the mass concentration inside the space is higher than that on the surface, adsorption is considered; however, when the mass concentration inside the space is lower than that on the surface, desorption is considered;
- Energy transport: The energy transported depends on the airflow rate and the difference in temperature (between the temperature of the airflow in the source and the space). This transport can be made directly in adjacent spaces.
- Air inside the spaces;
- Different layers of the opaque bodies;
- Transparent bodies;
- Interior bodies.
- Adsorption and desorption of water vapor;
- Water vapor and the carbon dioxide concentration (or other contaminants) inside the spaces.
- Airflow rate or the air exchange rate;
- Mass exchange between the different indoor spaces;
- Mass exchange between the indoor spaces and the outdoor spaces. In this case, the inlet (from indoor spaces or outdoor spaces) and the outlet (to other indoor spaces or outdoor spaces) are considered.
- In the first one in a steady-state situation, the building geometry and the building materials’ thermal proprieties are used, while in the transient situation, the occupation and airflow variations that were presented previously, are considered;
- In the simulation related to the geographical parameters, the building was considered for the Mediterranean environment, namely in the south of Portugal at sea level;
- Finally, the environmental variables were measured at a meteorological station for a typical winter day (December 21st), and the external air temperature, the external air relative humidity, and the wind speed were used. The external air temperature changed between 4.5 and 13.5 °C; the external air relative humidity changed between 37.2 and 65%; and the wind speed changed between 0.01 and 6.25 m/s.
- A total of 1616 opaque bodies built with double bricks, single bricks, the roof, and the floor;
- A total of 456 transparent bodies built with windows and dome glasses;
- A total of 5 indoor spaces, considering the interior air of the spaces, with the boundaries of the opaque and transparent surfaces.
3.5. UAV DS Numerical Model
- The inertial frame {I}, a static global frame positioned in the building’s central area;
- The reference frame {A}, a local mobile frame attached to the UAV center of mass;
- The body frame {B}, a local rotated mobile frame attached to the UAV center of mass.
- The position p of the origin of {A} and {B} relative to {I};
- The linear velocity v of the origin of {A} and {B} relative to {I};
- The yaw angle ψ that {B} observes regarding {A};
- The fixed angular velocity r of {B} relative to {A};
- The fixed ascending vertical linear velocity a of {B} relative to {I};
- The fixed descending vertical linear velocity a of {B} relative to {I}.
- The limitations of the UAV under study, namely the average duration of its battery, according to the payload to be implemented;
- The time required for the measurement of environmental variables, which affects the time that the UAV must stay in the hover position and depends on the implemented sensors;
- A third important factor is the priority of spaces with greater measurement amplitudes and dynamics of the environmental variables compared to spaces with more constant parameters.
- The average Cartesian coordinate of each space;
- The mean Cartesian coordinate of the passage gates that define the boundary between the spaces to be traversed. For each door, the simulator calculates the average coordinate of this passage point, which will be taken into account when calculating the UAV trajectory.
- The internal air temperature;
- The internal relative humidity;
- The surface temperature.
- The measuring representation when a higher environment variation level is observed, namely when the occupants enter or leave the space or when the airflow rate changes;
- The simplification applied in the PMV evaluation.
- The higher environment variation is assessed. In this case, the TC is compared using one and two UAV missions;
- The mean radiant temperature (MRT) methodology used in PMV evaluation is assessed. In this case, the MRT measuring methodology, using the floor temperature, the lateral walls temperatures, the ceiling temperatures and the air temperature, is applied.
4. Results and Discussion
4.1. BTS Results
4.1.1. Solar Radiation
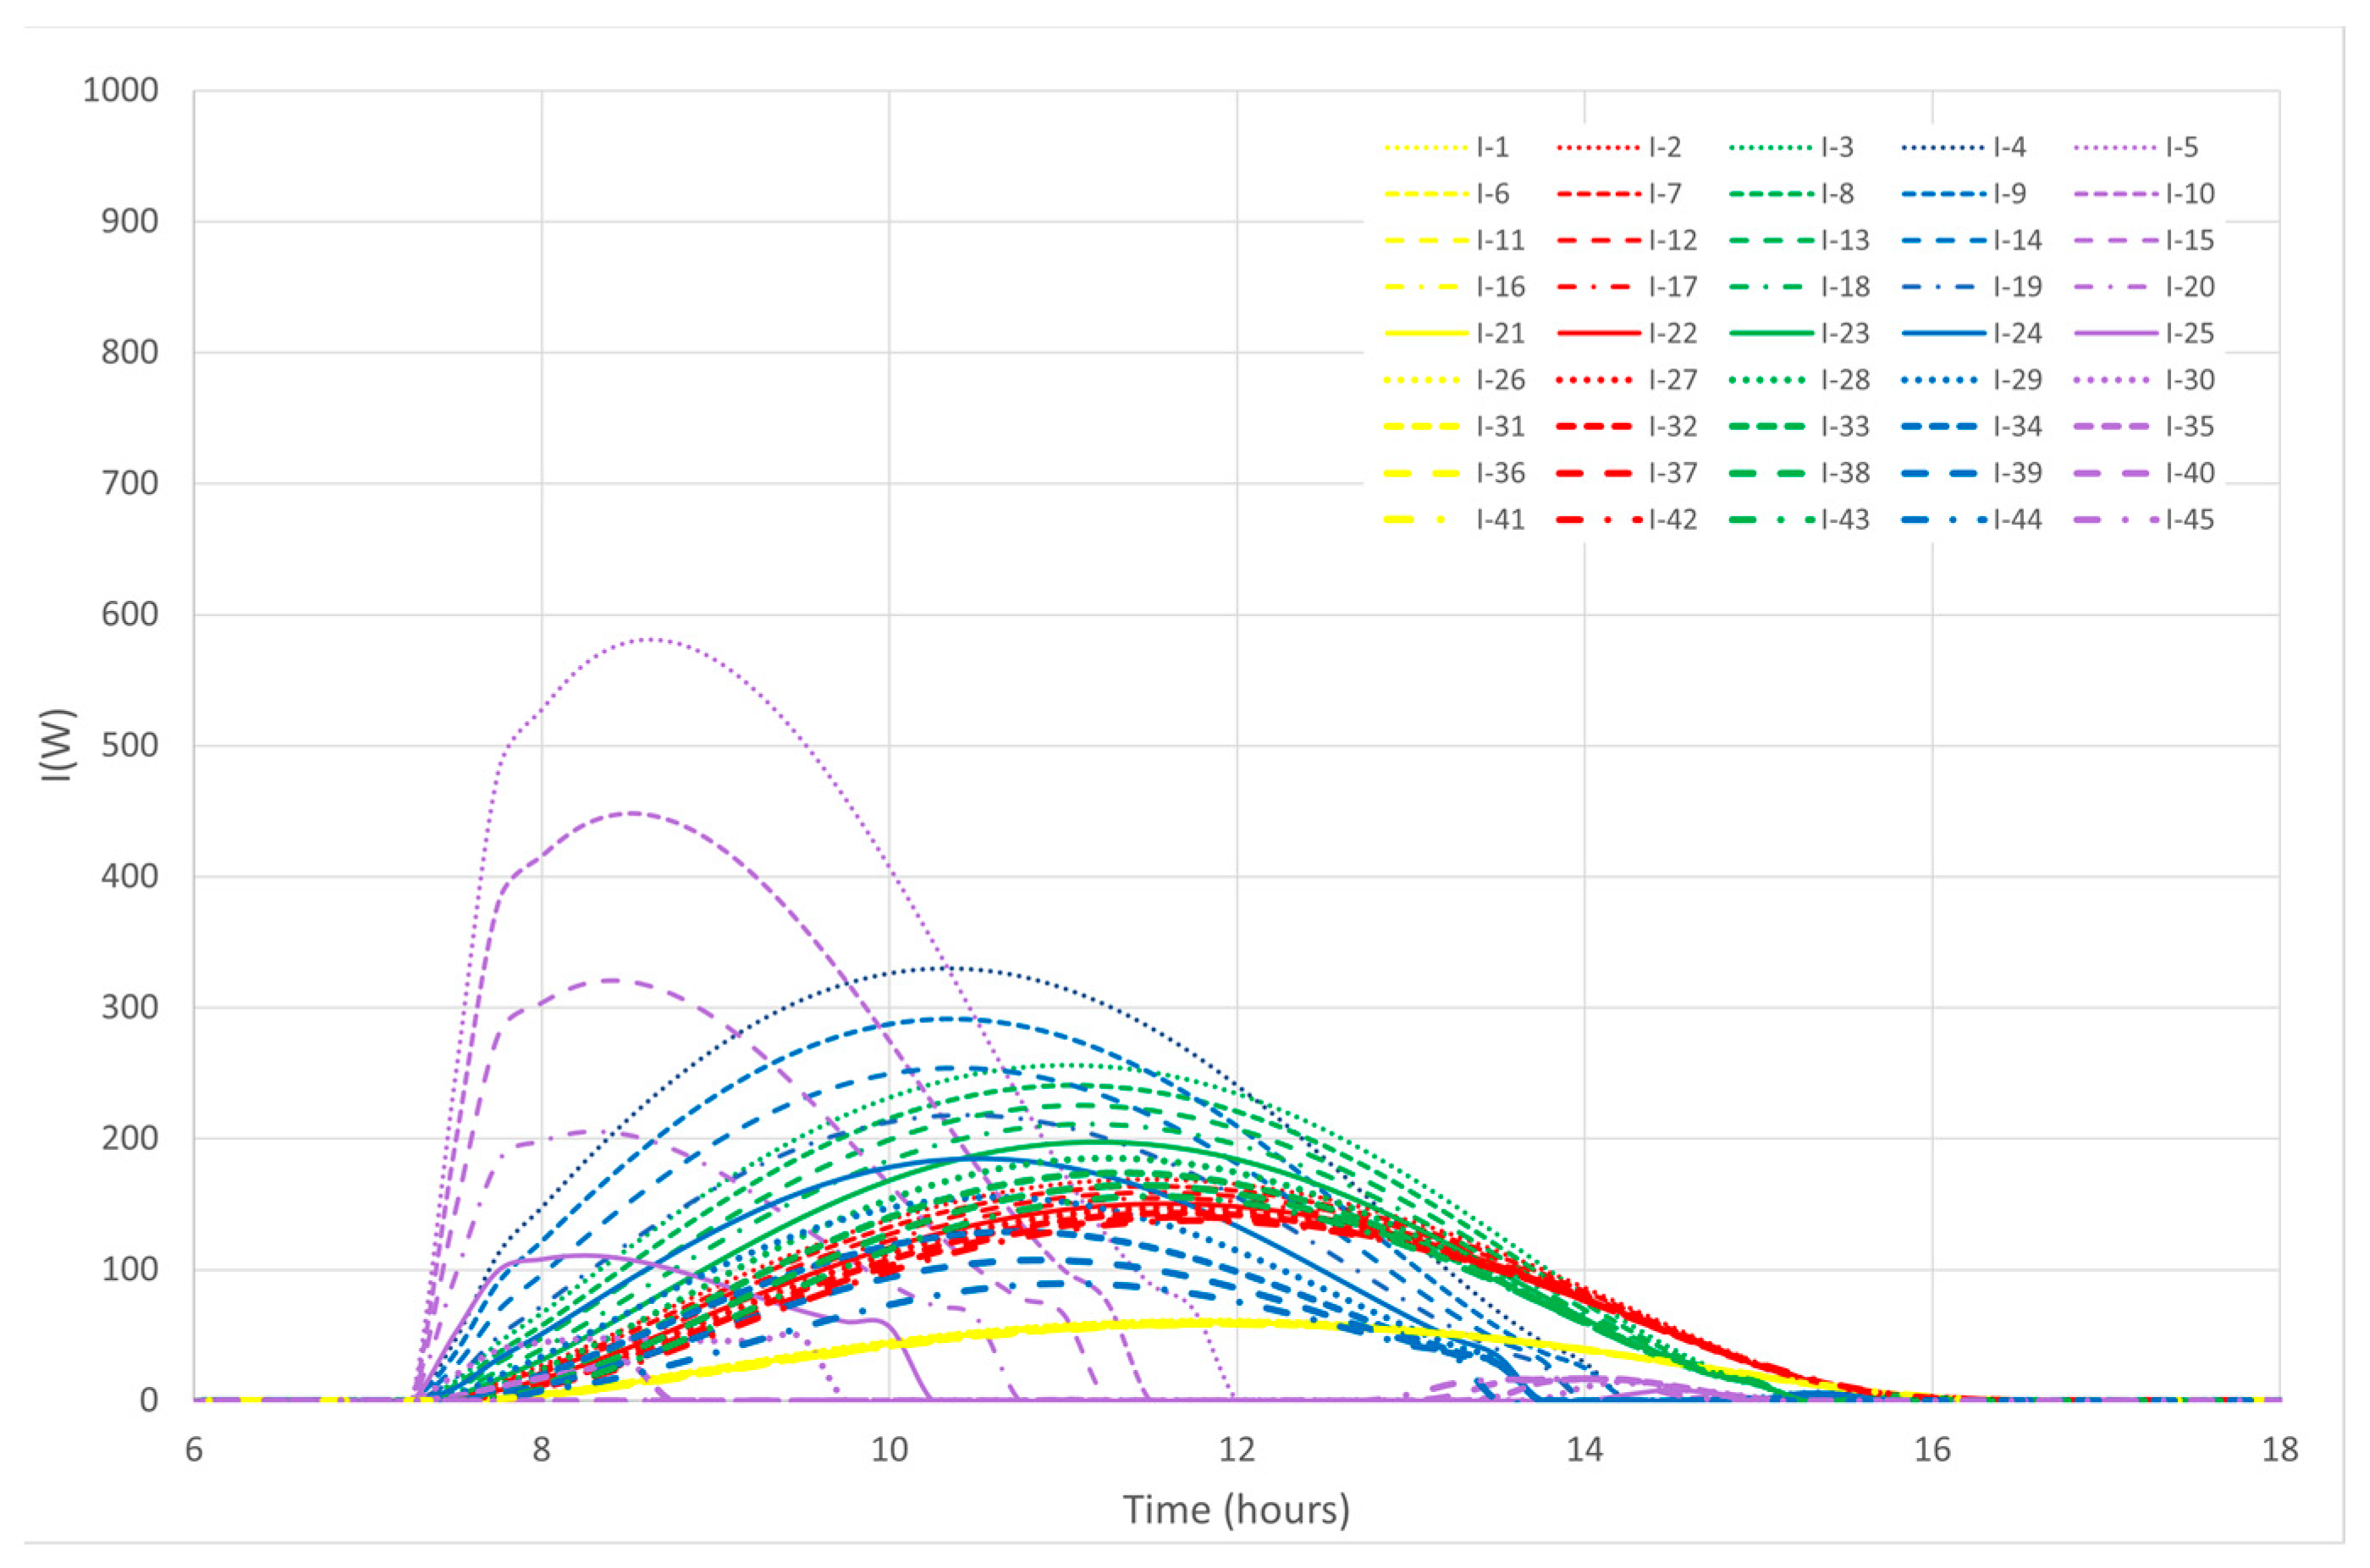
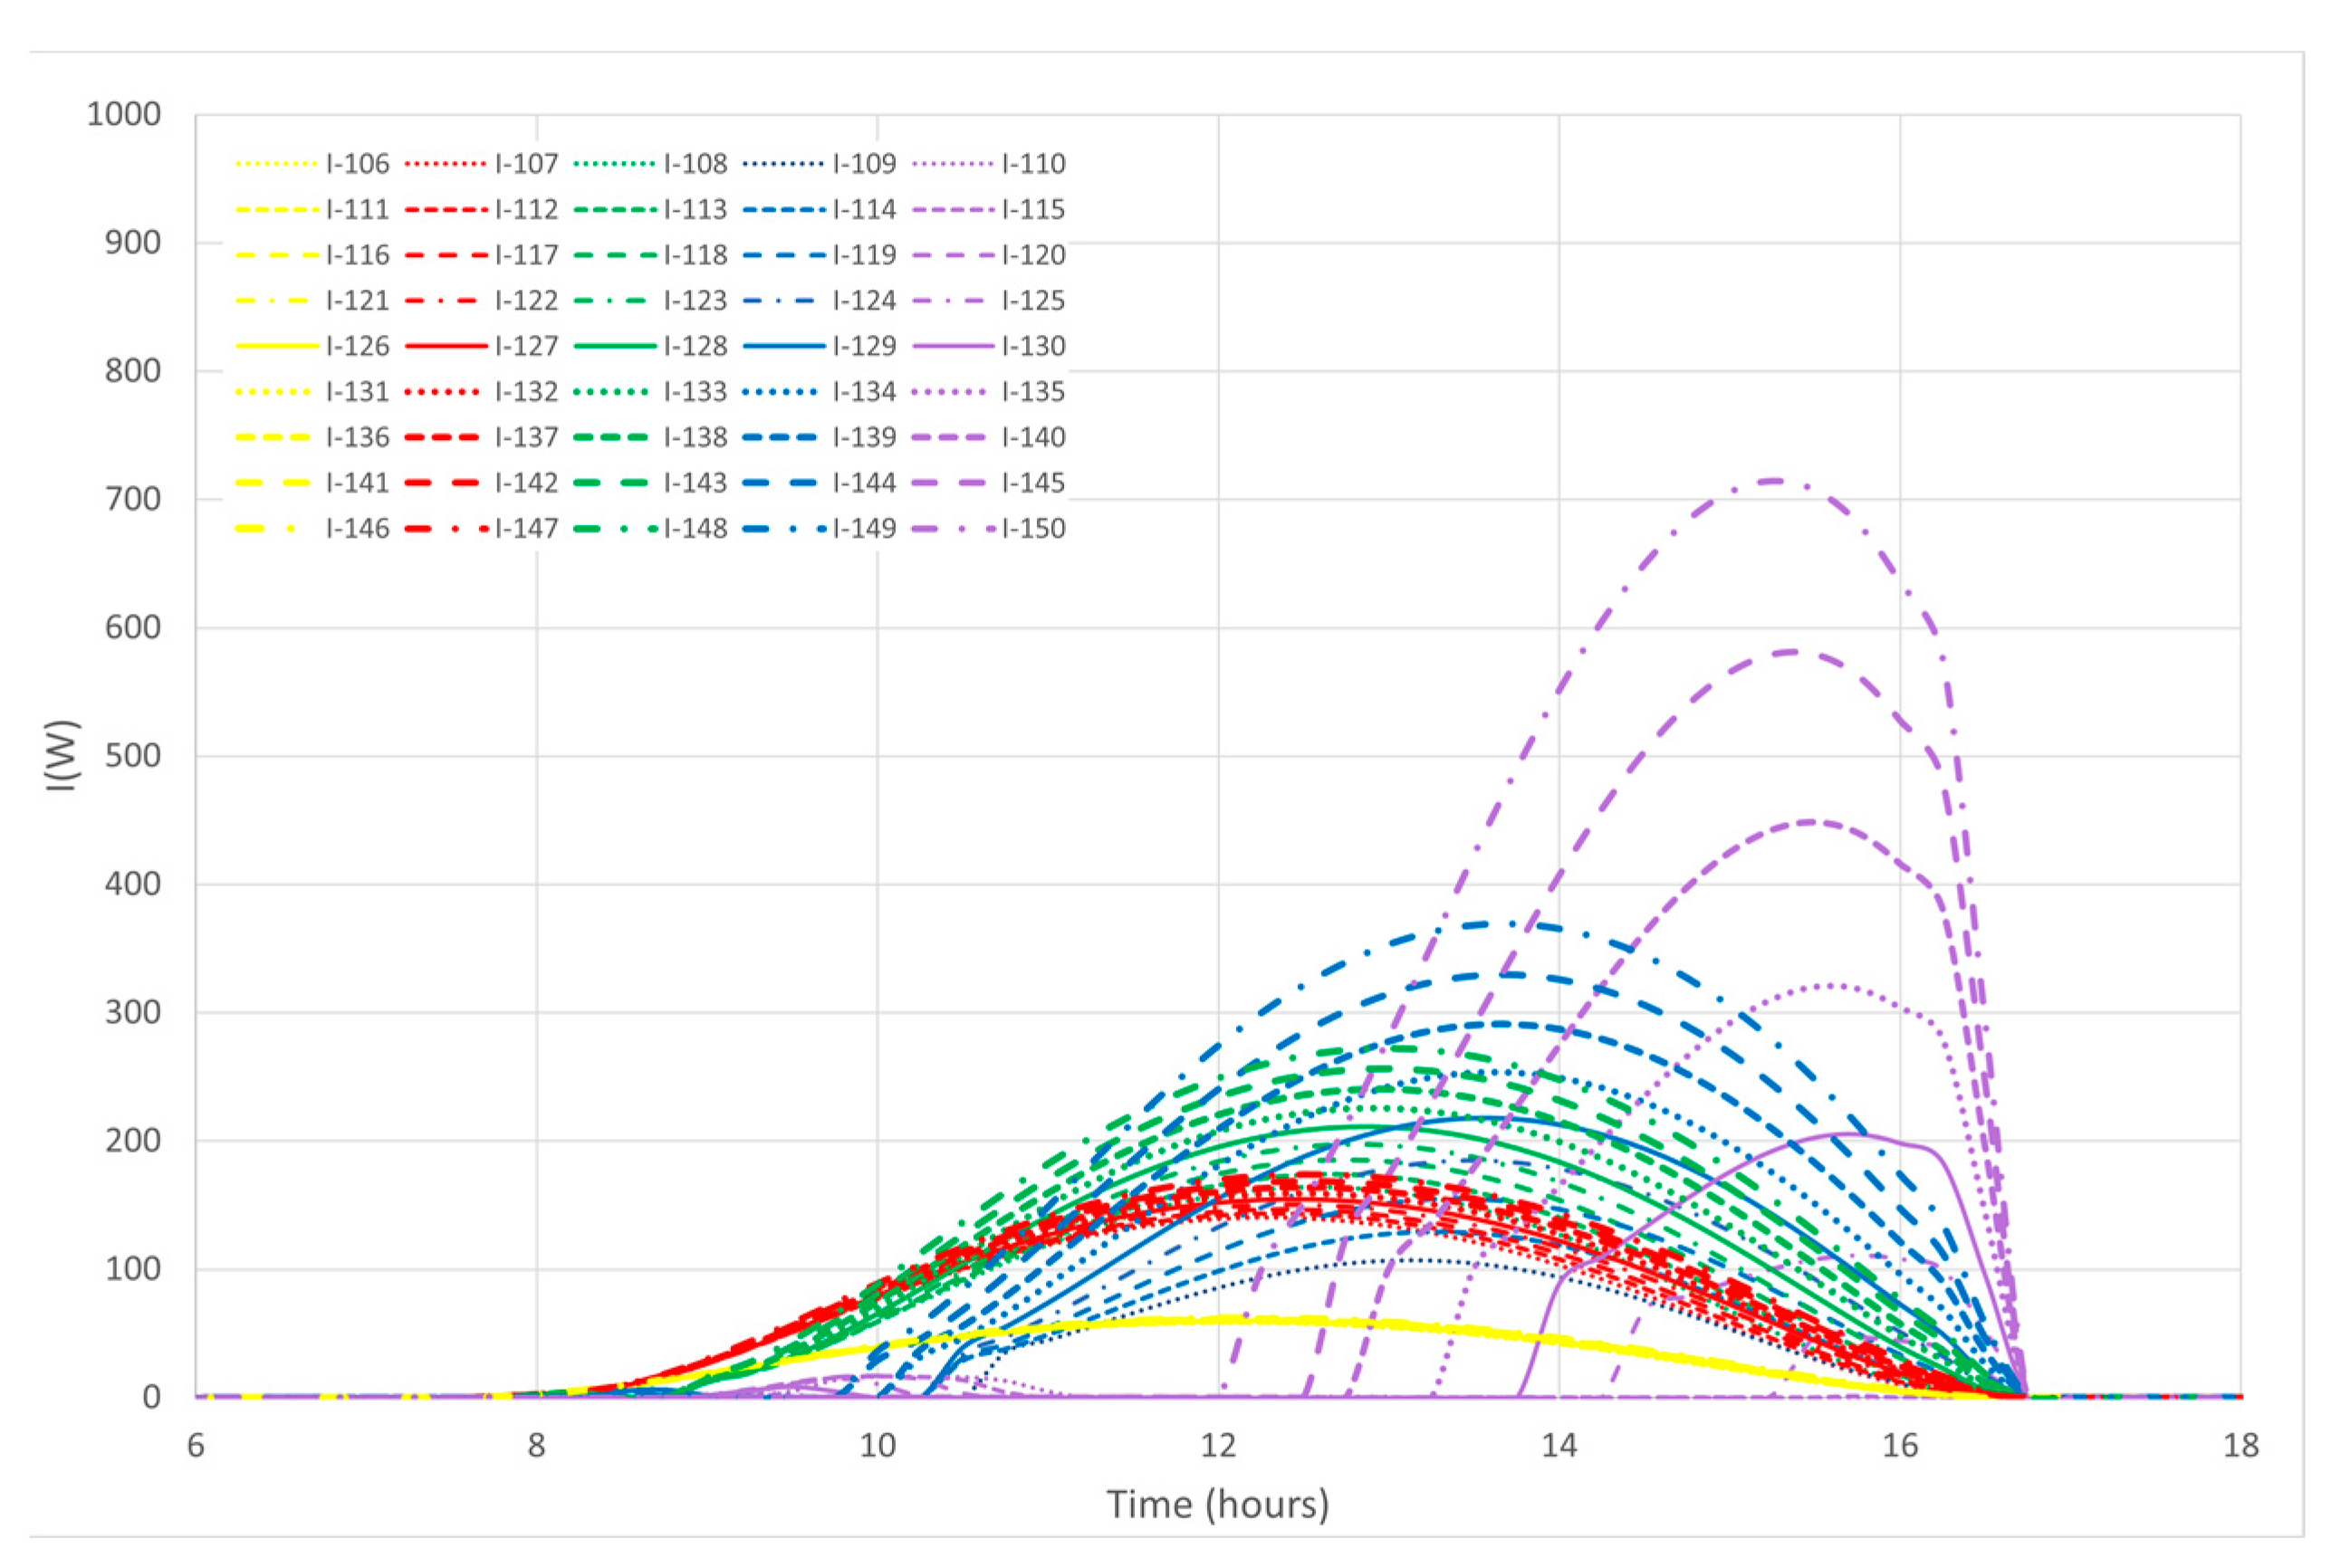
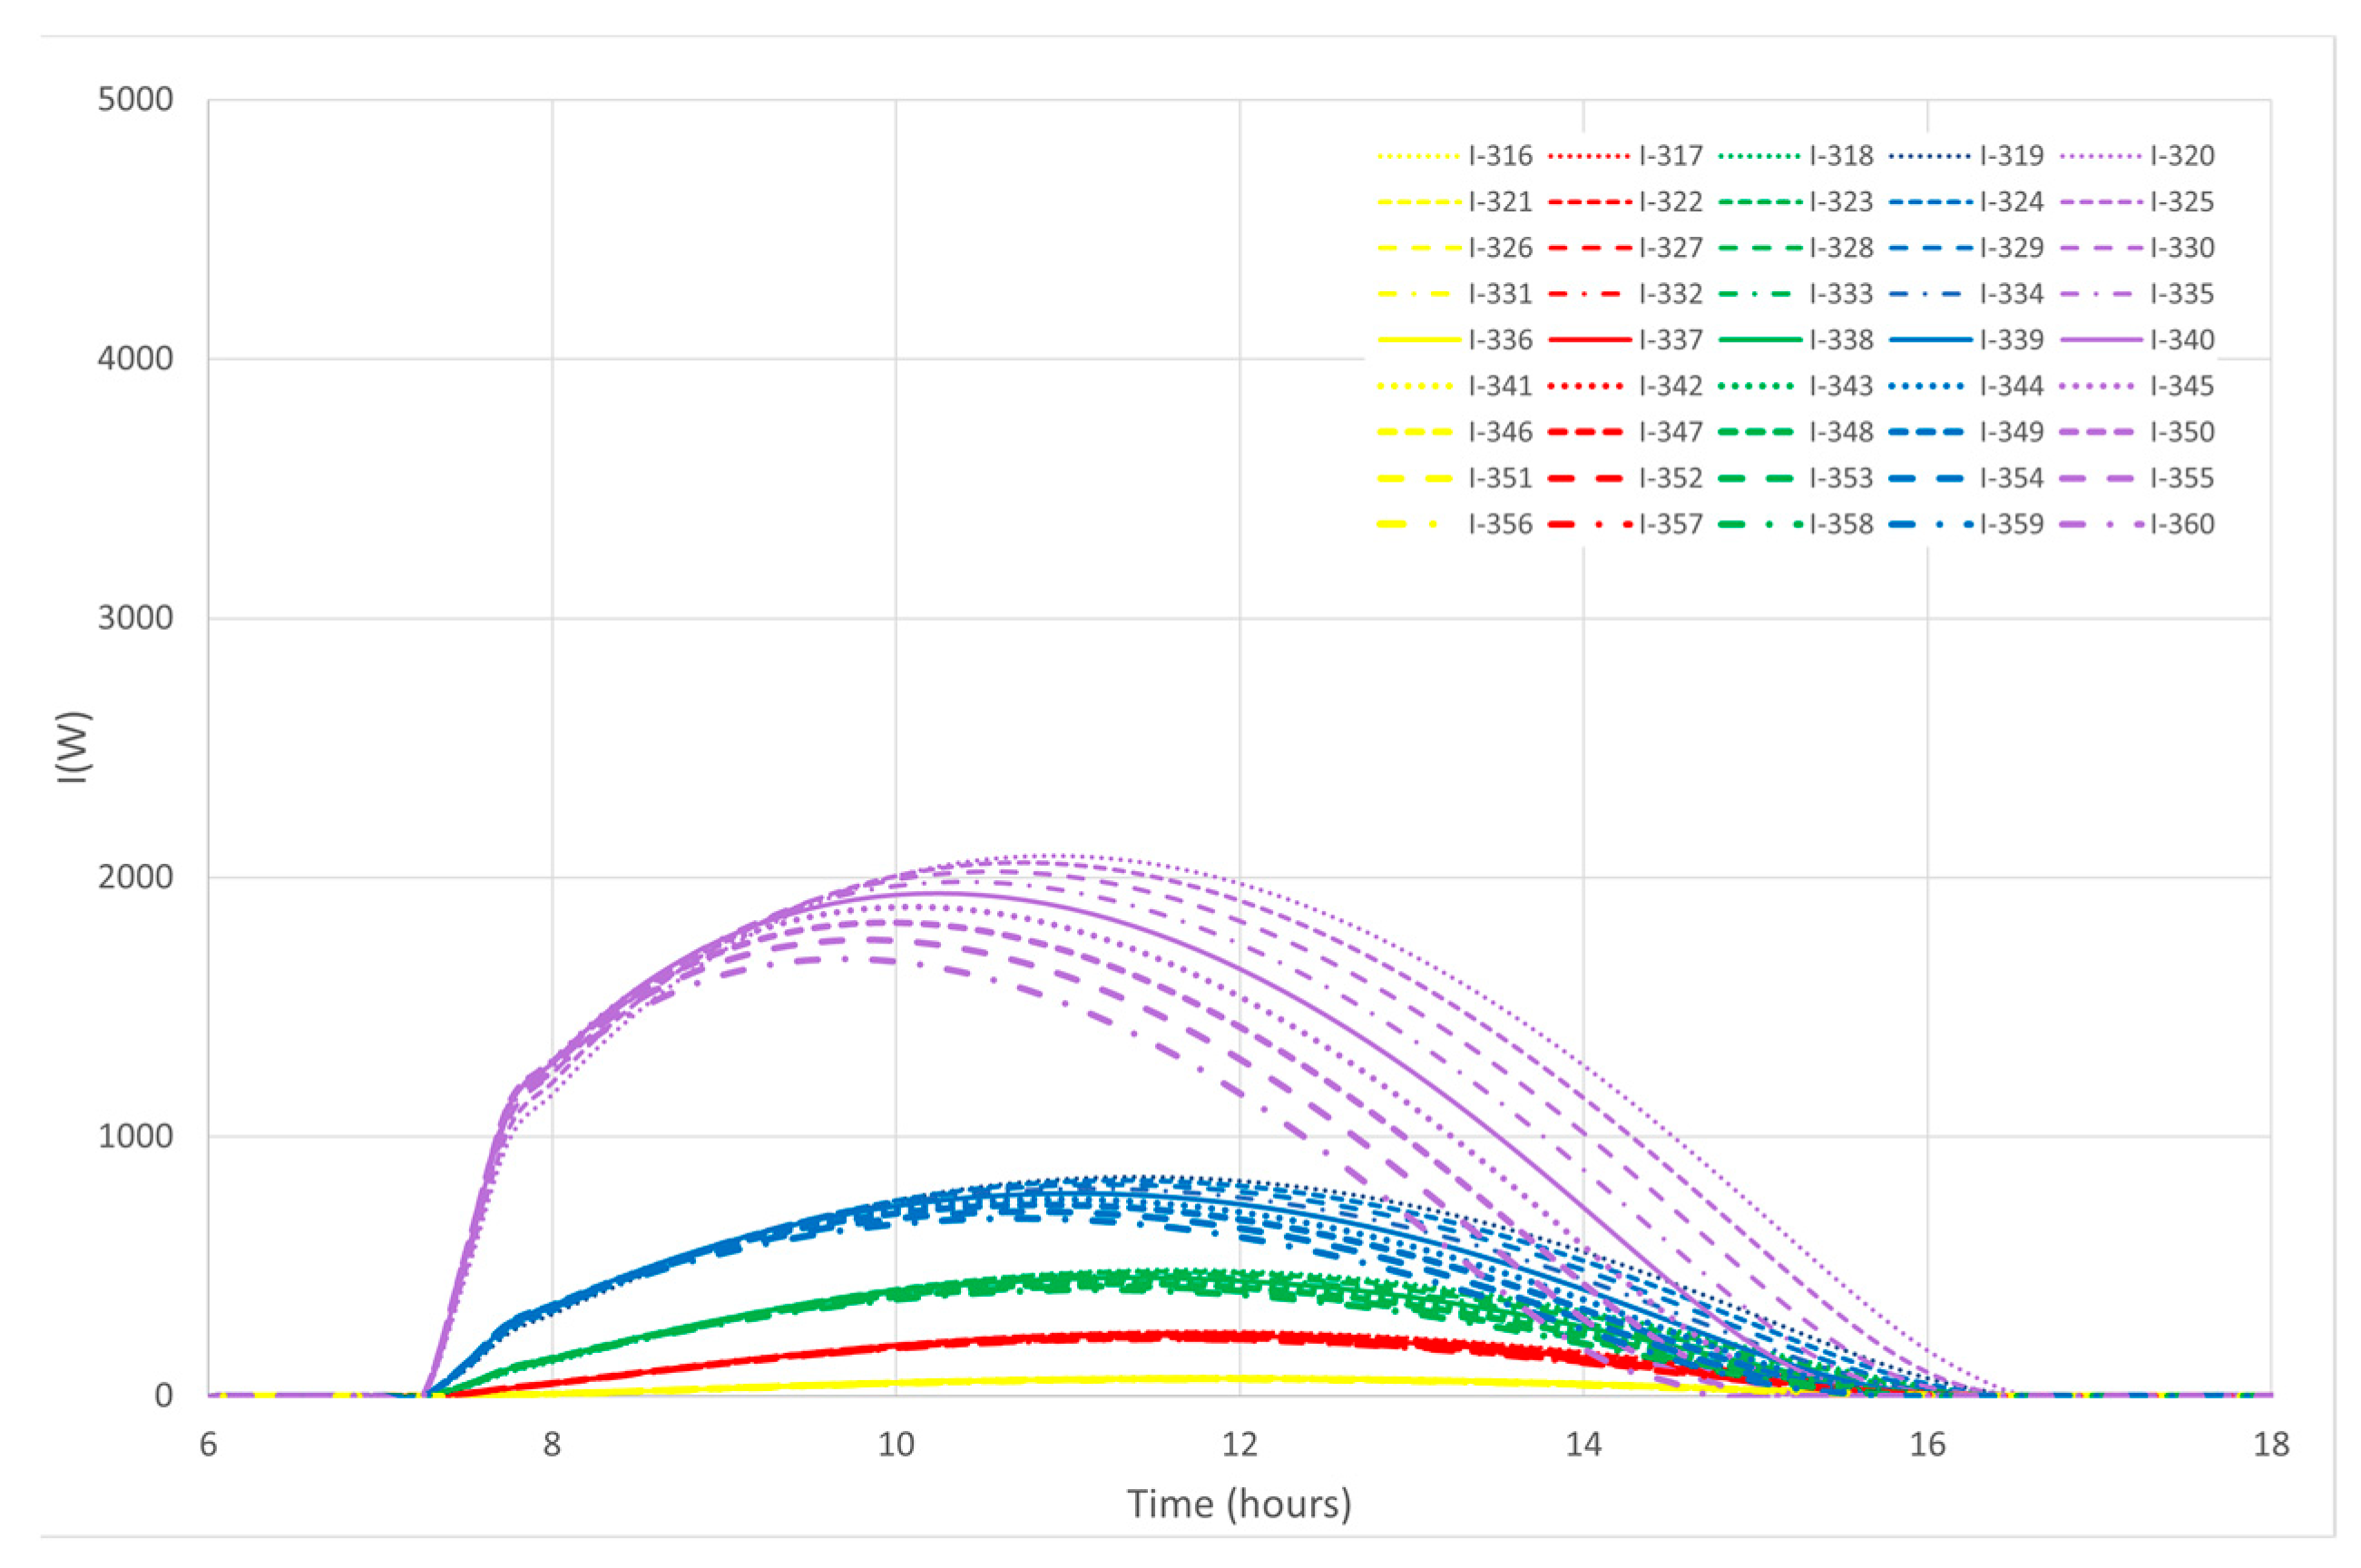
- Yellow is associated with the fifth level;
- Red is associated with the fourth level;
- Green is associated with the third level;
- Blue is associated with the second level;
- Purple is associated with the first level.
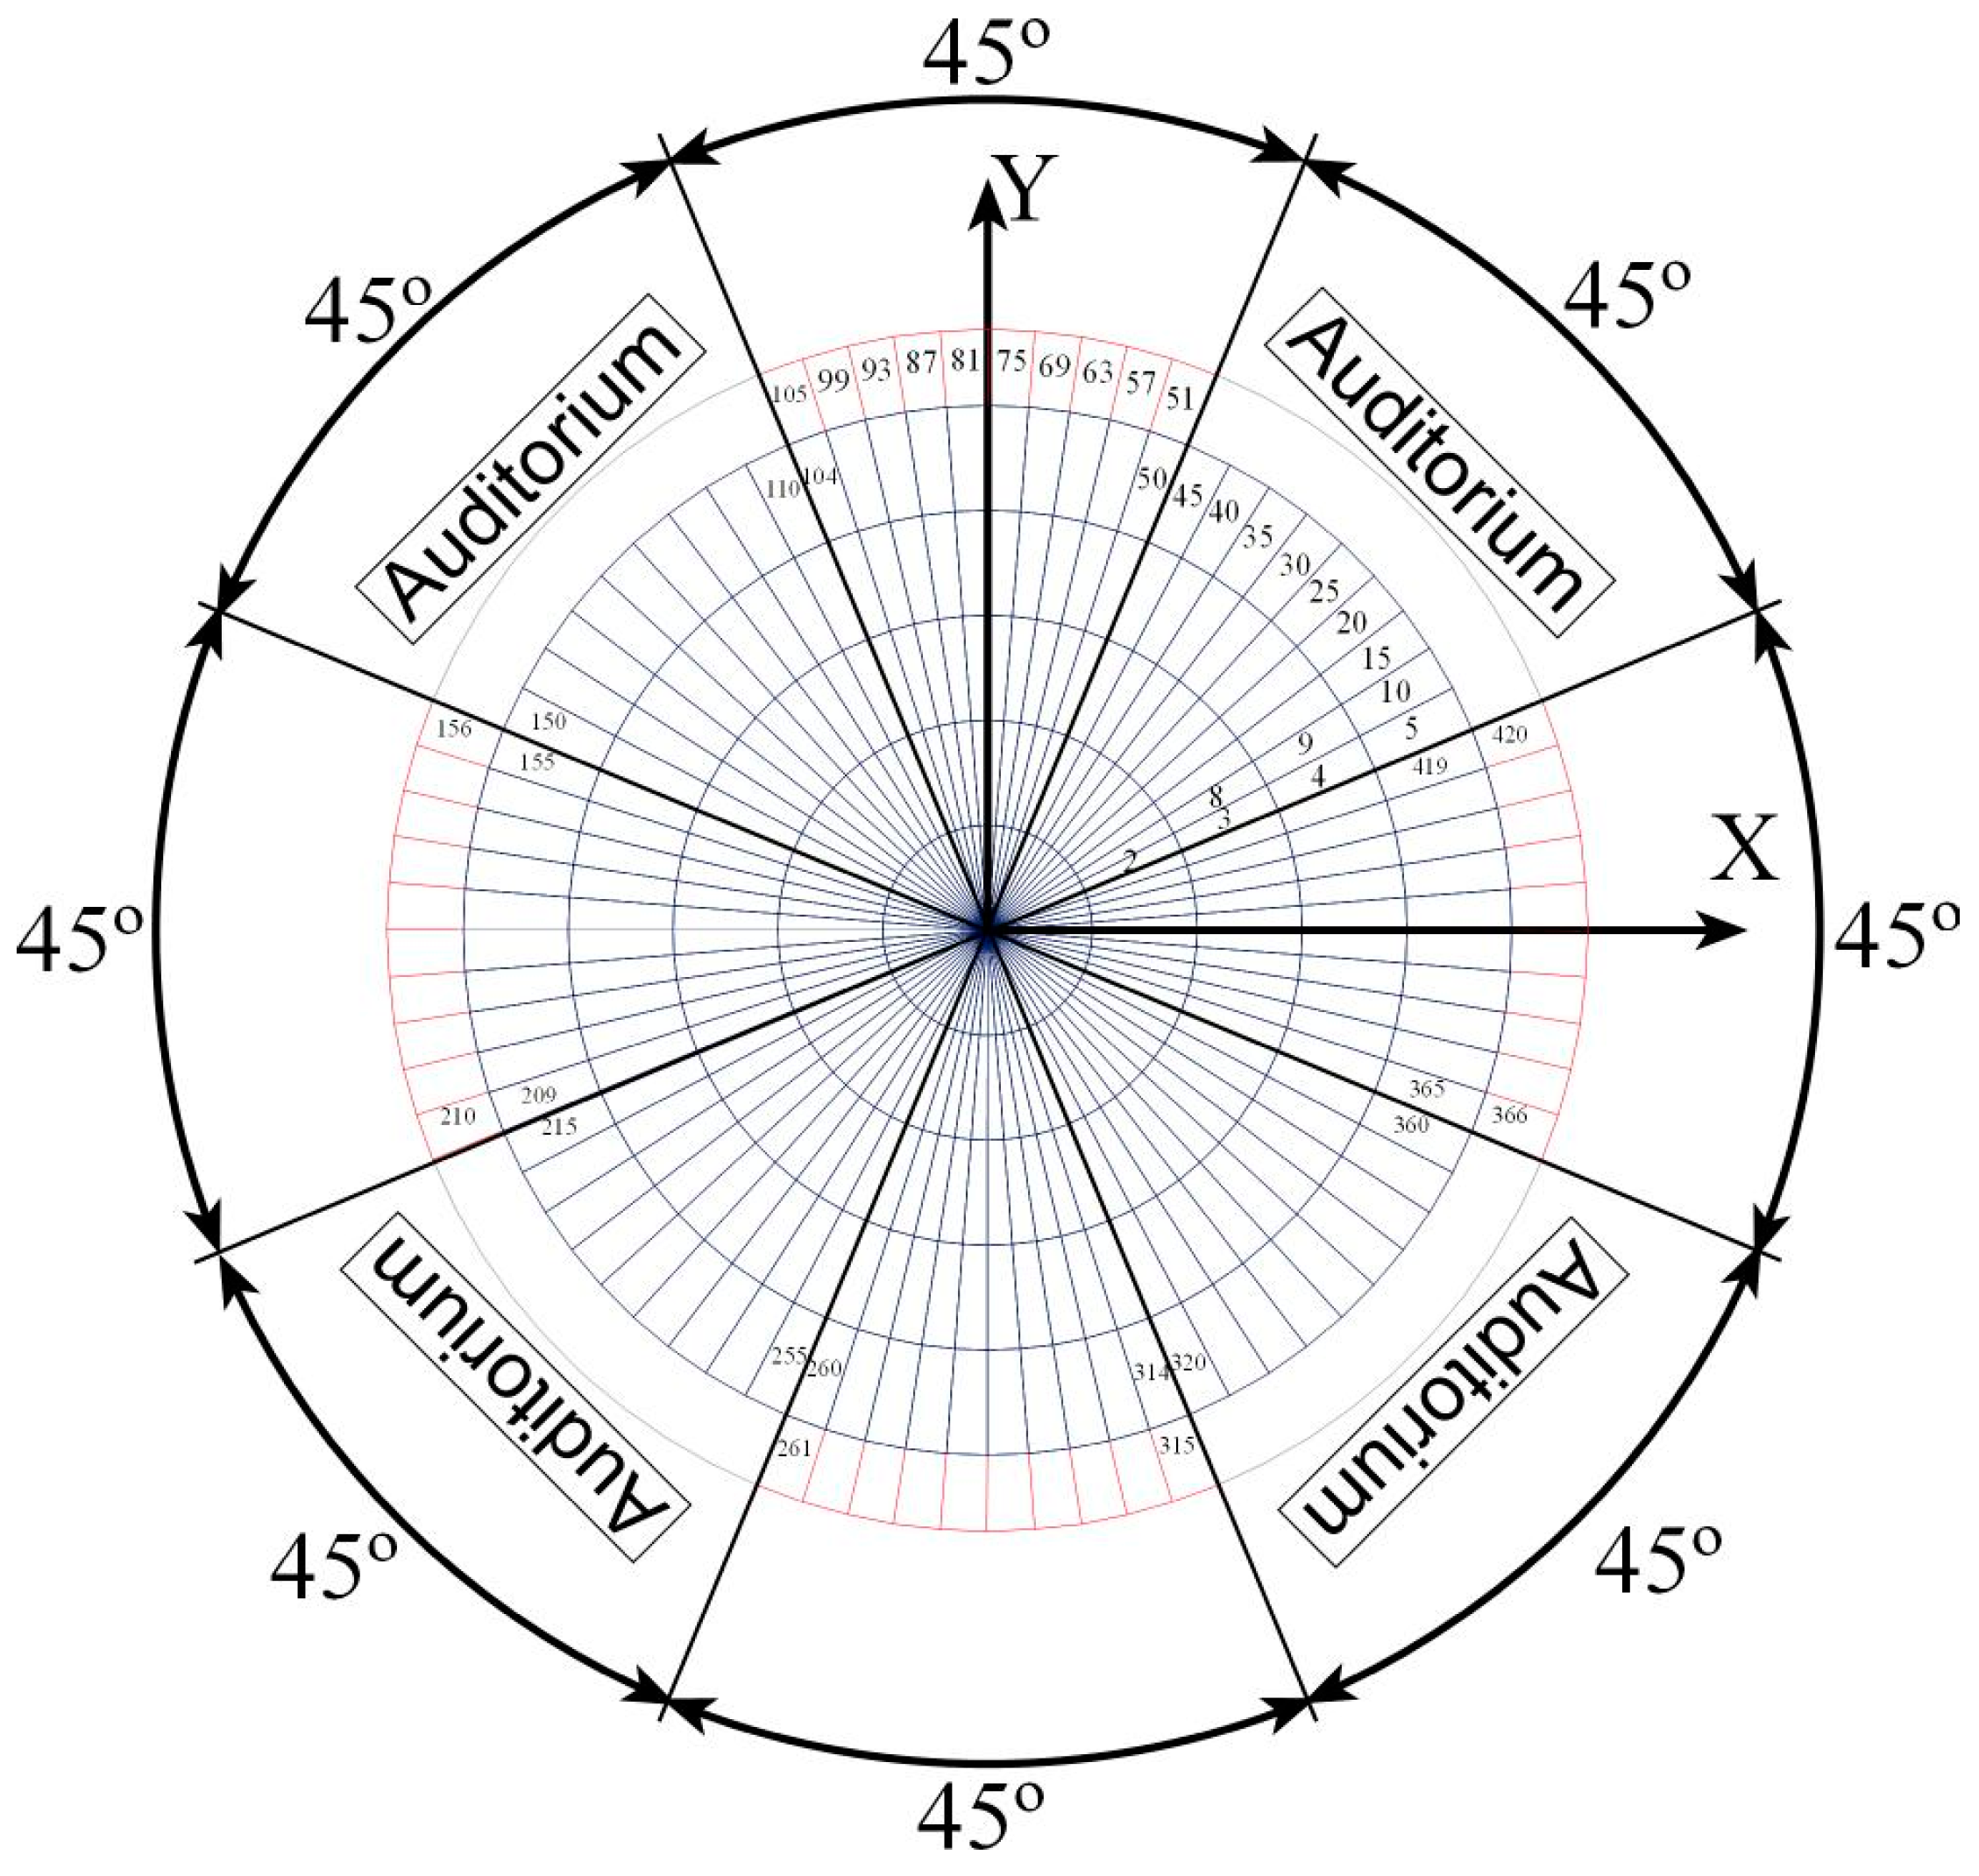
- In the south section, from surfaces 256 to 315 (see Figure 10), six levels of transmitted incident solar radiation are presented. The vertical glasses (greenhouse) present higher solar radiation values than the inclined glasses (dome). The first level of the dome presents highest solar radiation levels than the fifth level of the dome;
- In the south-west section, from surfaces 211 to 255 (see Figure 9), and the south-east section, from surfaces 316 to 360 (see Figure 11), five levels of transmitted incident solar radiation are presented. The first level of the dome presents the highest solar radiation values, while the fifth level of the dome presents the lowest solar radiation levels. In the south-west section, the highest solar radiation values are presented in the afternoon, while in the south-east section, the highest solar radiation values are presented in the morning;
- In the west section, from surfaces 151 to 210 (see Figure 8), and in the east section, from surfaces 361 to 420 (see Figure 12), six levels of transmitted incident solar radiation are observed. In the west section and the east section, the first level of the dome presents the highest solar radiation values compared with the fifth solar radiation level on the dome. The west section of the vertical glass surface presents the highest solar radiation levels at the end of the afternoon. The east section of the vertical glass surface presents the highest solar radiation levels at the beginning of the morning;
- In the north-west section, from surfaces 106 to 150 (see Figure 7), and in the north-east section, from surfaces 1 to 45 (see Figure 5), five levels of transmitted incident solar radiation are presented. In the north-west section, the first level of the dome presents the highest solar radiation values in the afternoon, mainly on surfaces that are facing the south direction. In the north-east section, the first level of the dome presents the highest solar radiation values in the morning, mainly on surfaces more located in the south direction. In the north-west section and the north-east section, the second level of the dome presents the highest solar radiation values all day;
- Finally, in the north section, from surfaces 46 to 105 (see Figure 6), six levels of transmitted incident solar radiation are presented. The vertical glass presents null values. The second, third, and fourth levels of the dome present the highest solar radiation values, mainly at midday. However, these low values are comparable with the other directions.
4.1.2. IAQ results
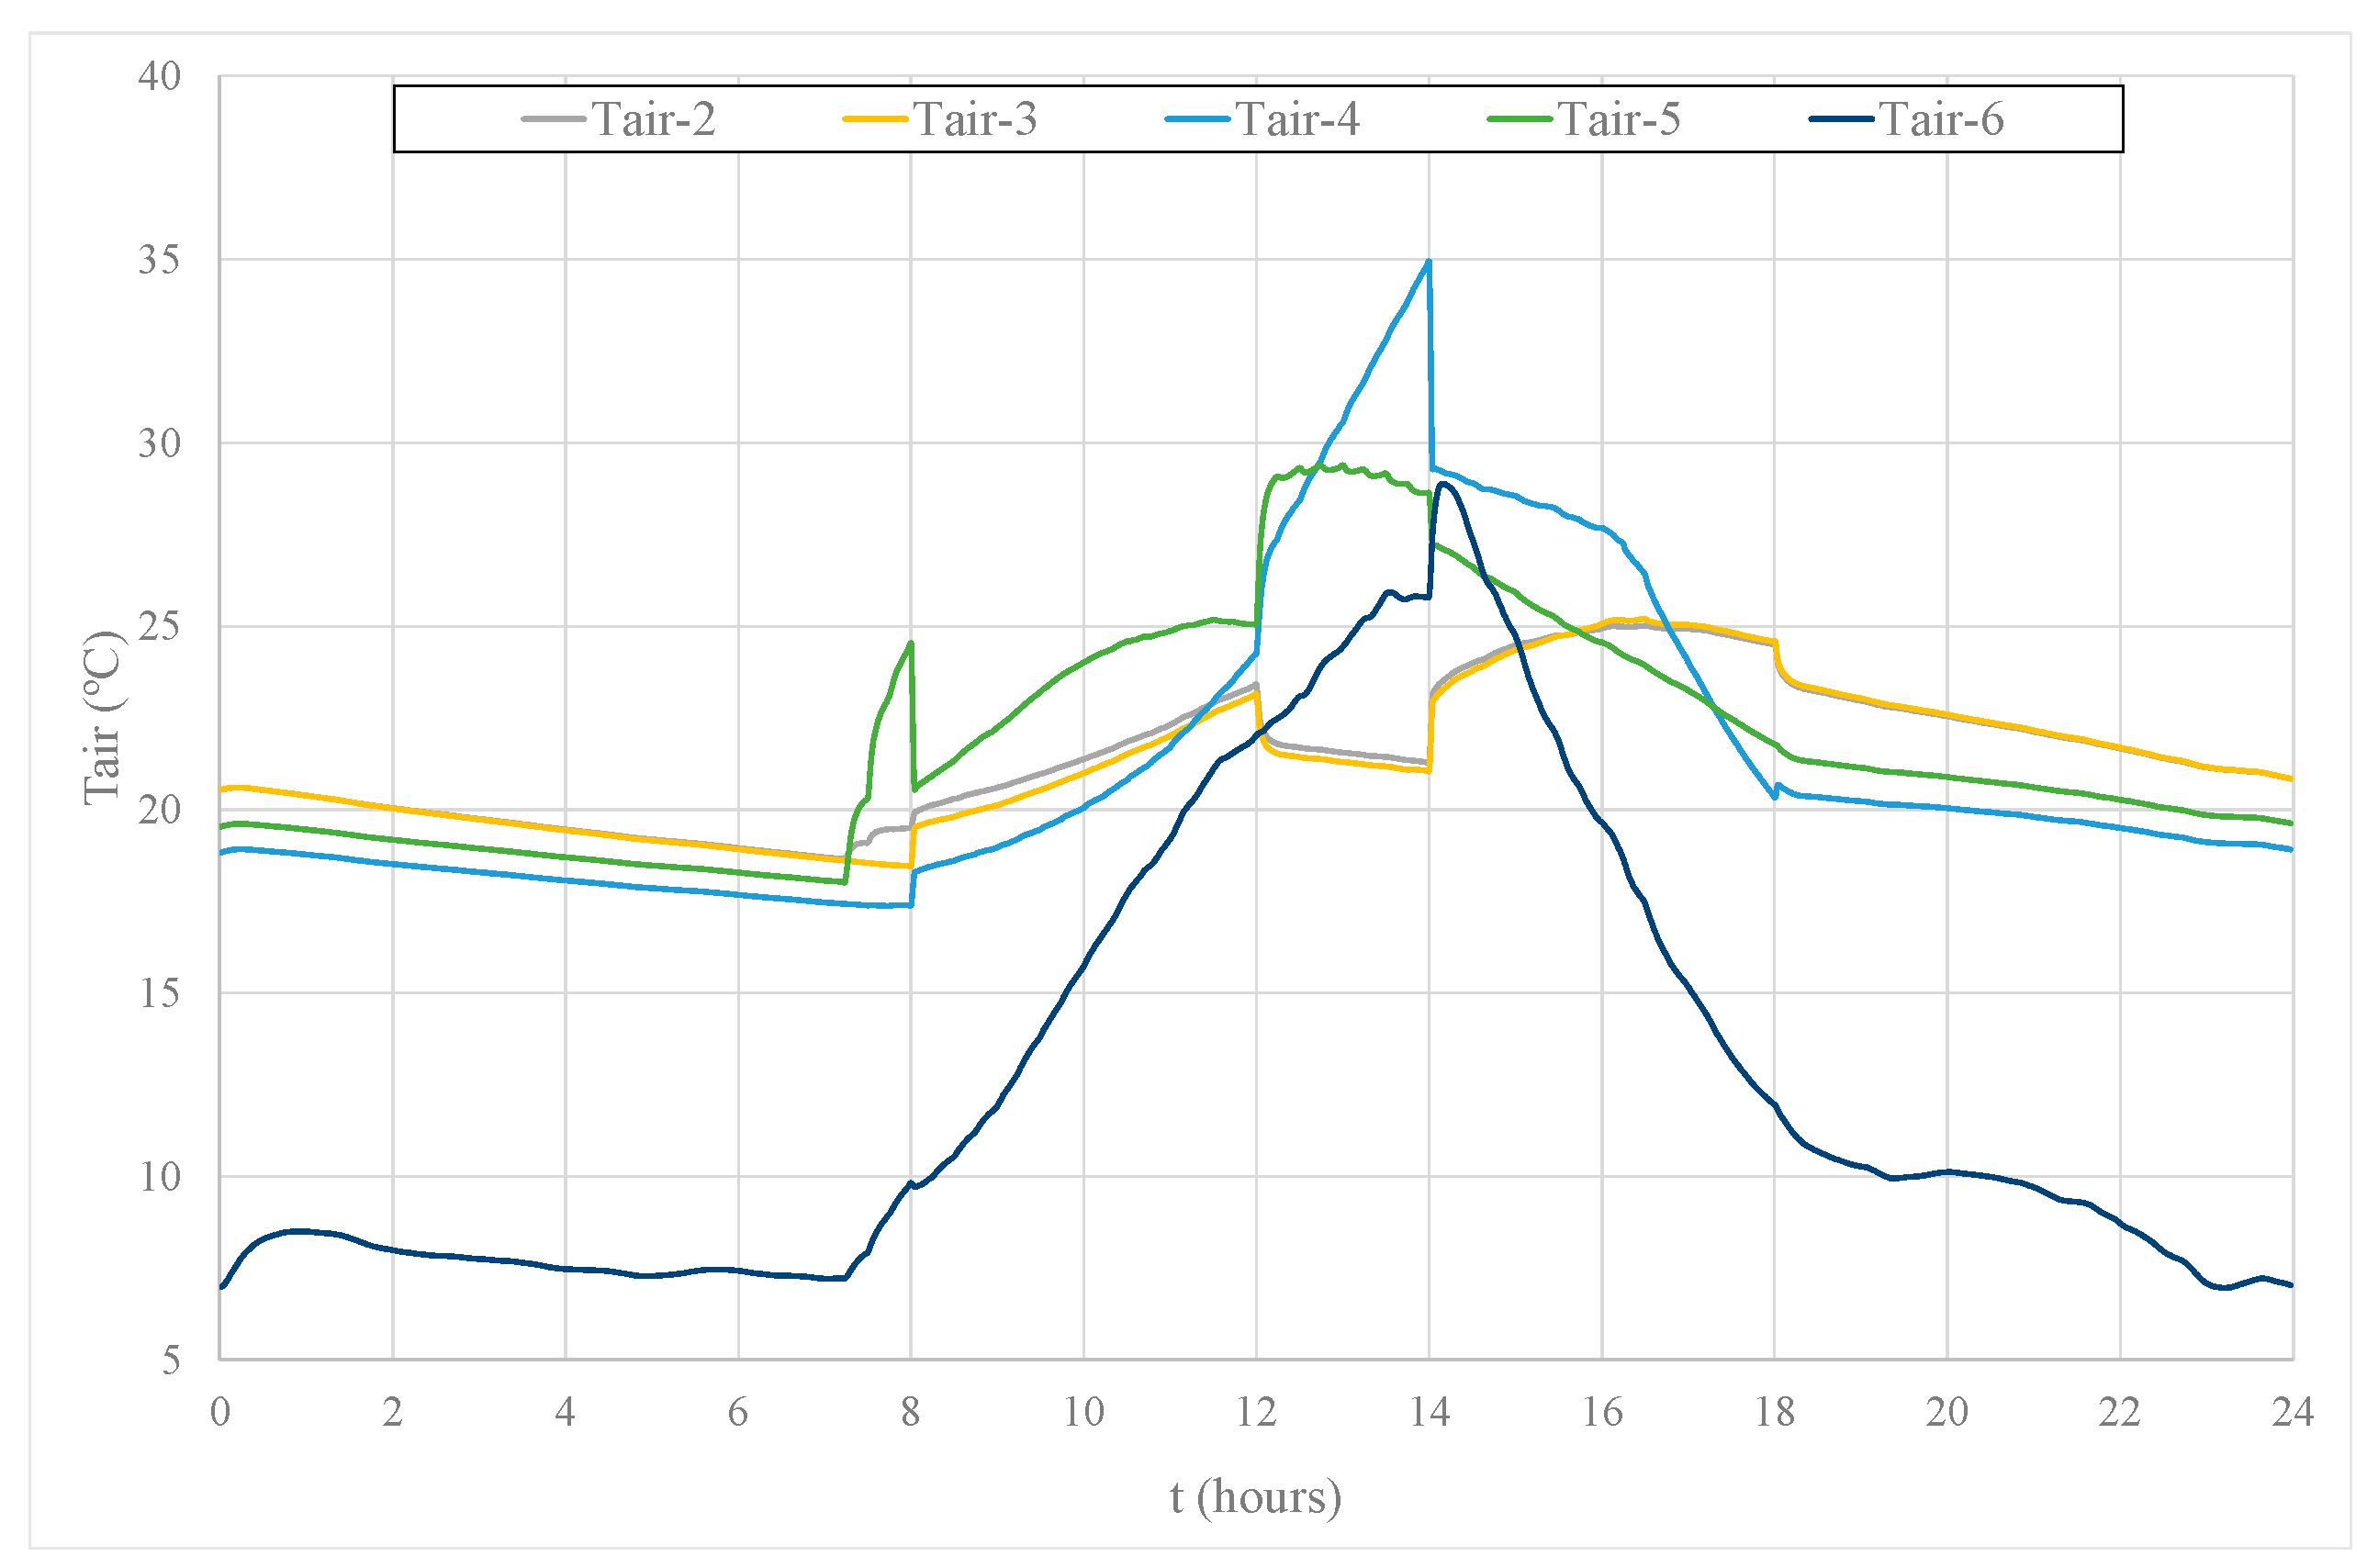
4.1.3. Air Temperature
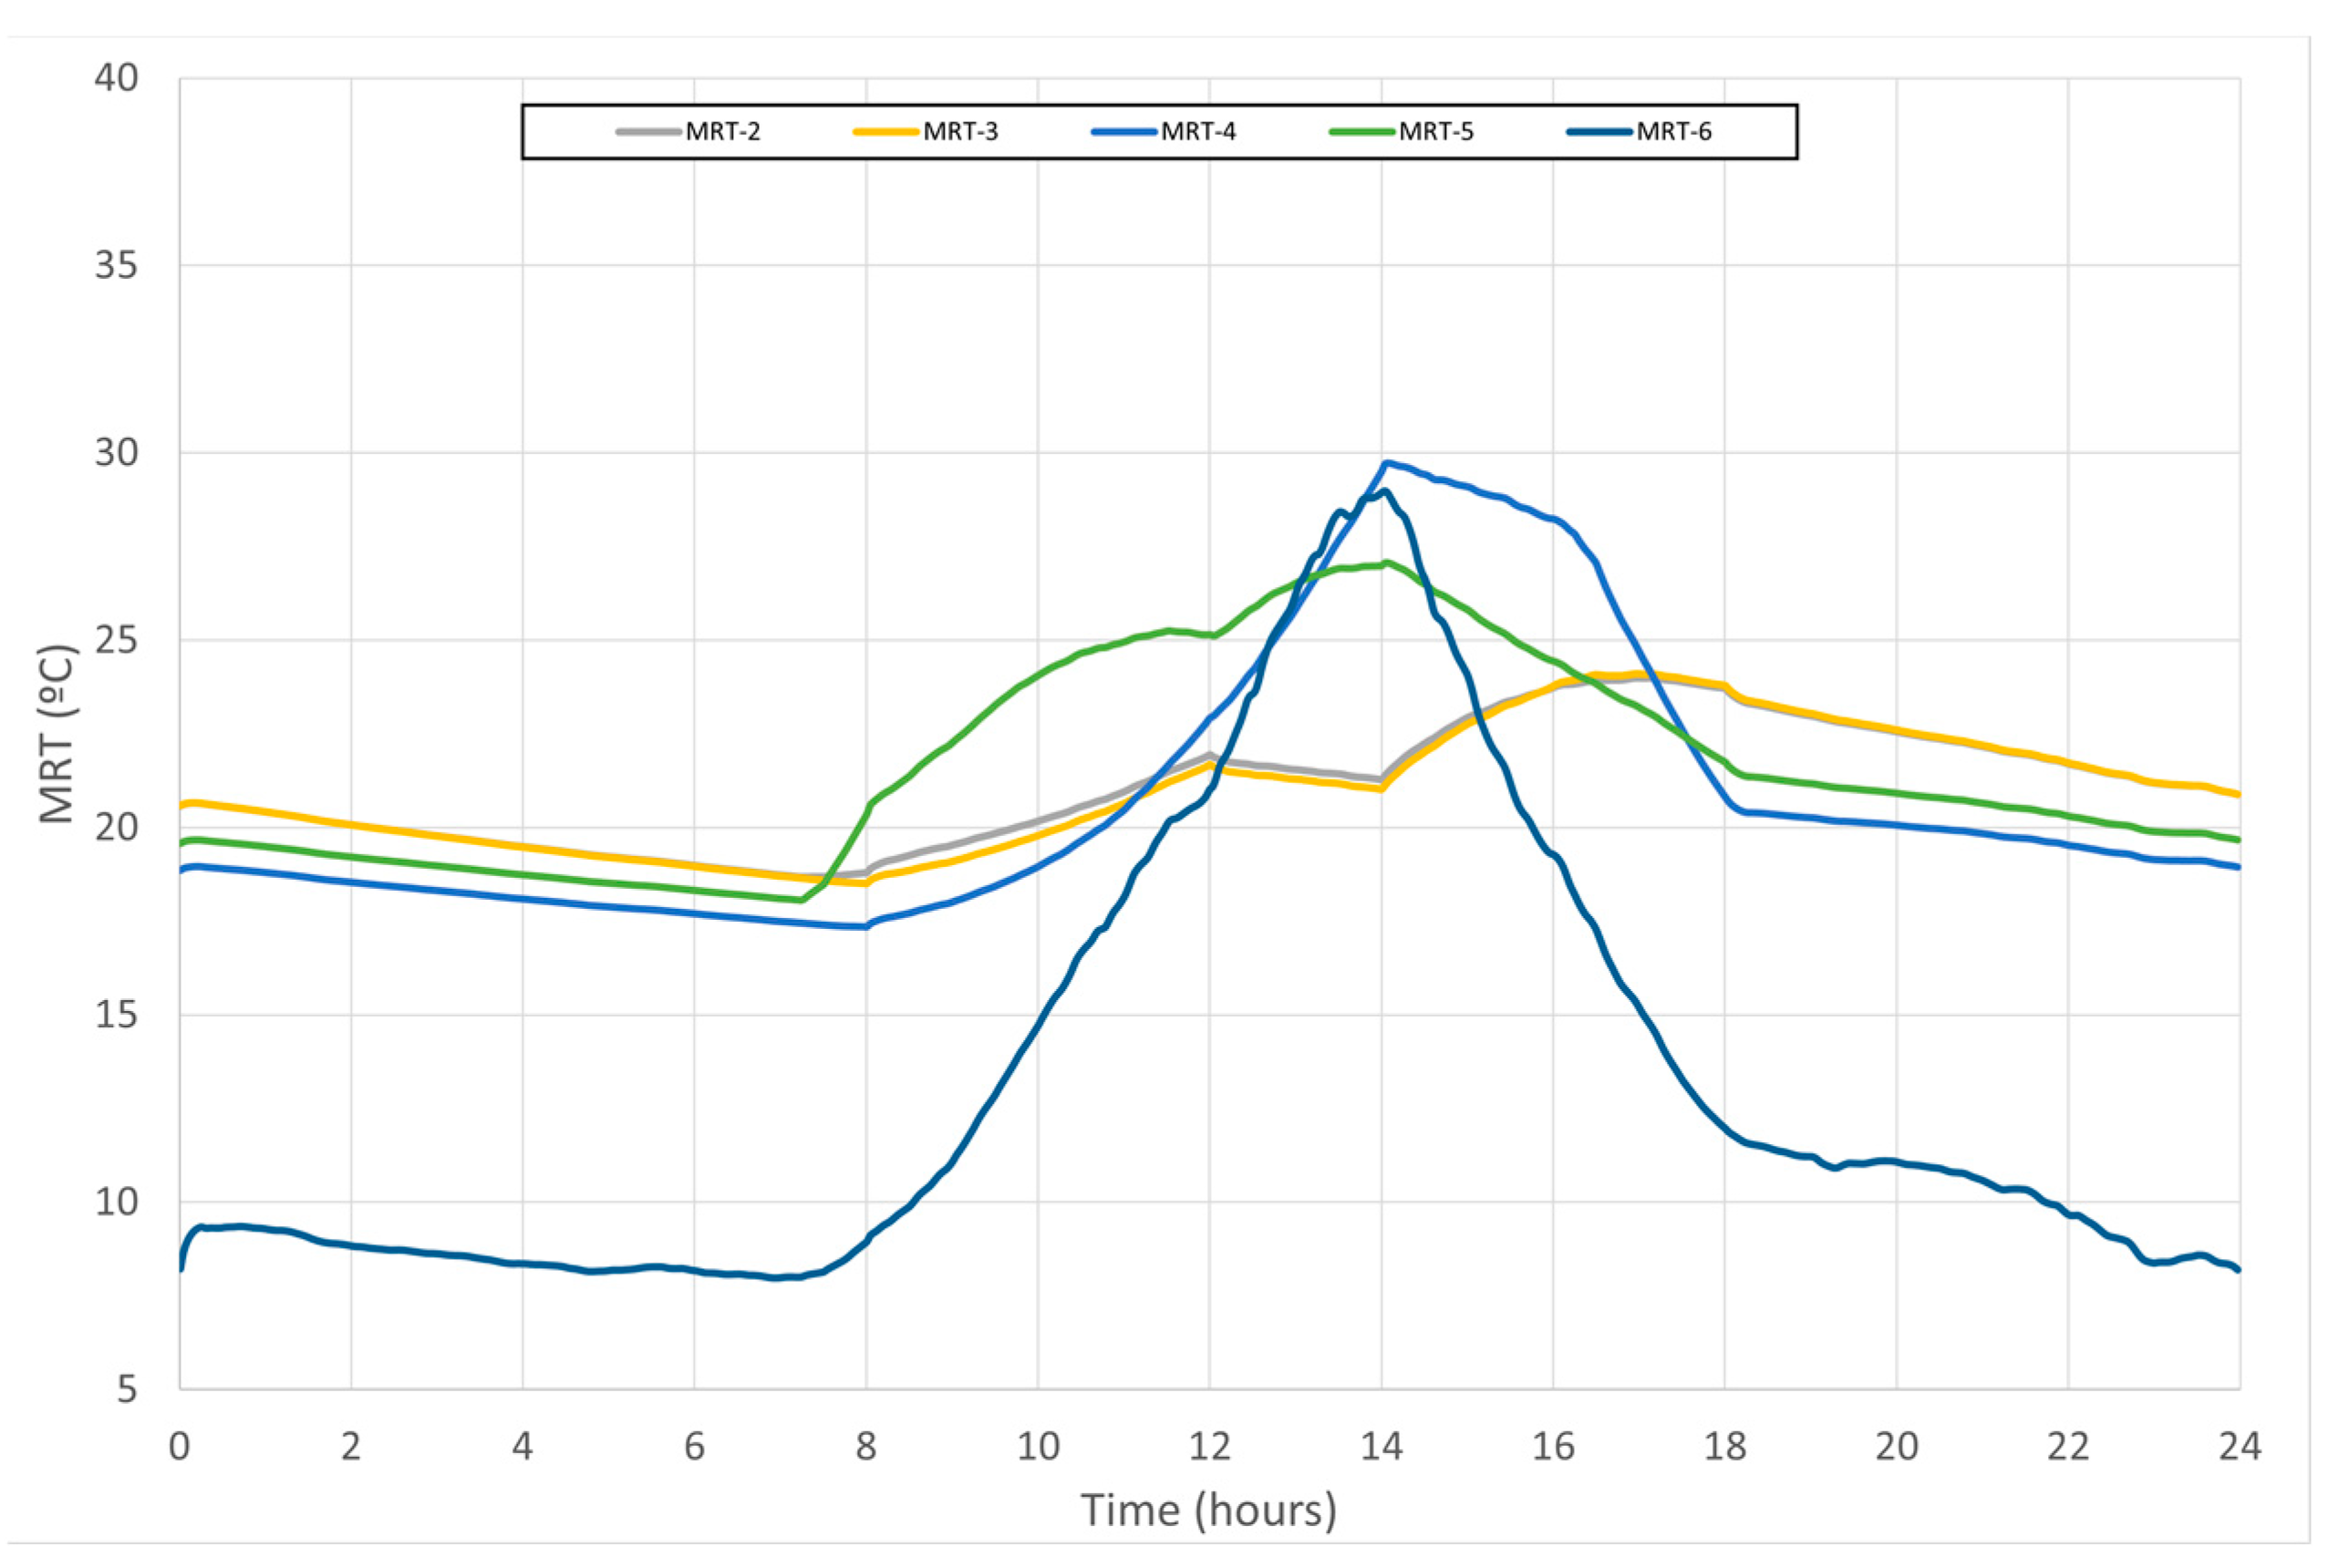
4.1.4. MRT of the Surfaces and Air Temperature of the Spaces
- In the central space, representing the greenhouse (space 6), the internal air temperature in the morning shows a slightly higher value than the MRT. This phenomenon is associated with the temperature of the surrounding surfaces being slightly lower than the internal air temperature. In the afternoon, the two temperatures have similar values;
- The internal air temperatures in the spaces facing north-east (space 2) and north-west (space 3) present slightly higher values than the MRT in the morning and afternoon. This phenomenon is also associated with the temperature of the surrounding surfaces being slightly lower than the internal air temperature;
- The internal air temperature in spaces facing south-east (space 5) presents the same value as the MRT. This phenomenon is associated with the fact that this space is subjected to solar radiation, mainly during the morning;
- The internal air temperature in a space facing south-west (space 4) in the morning was slightly higher than the MRT, while the internal air temperature evolution in a space facing south-west (space 4) in the afternoon was slightly lower than the MRT. This phenomenon is associated with the fact that this space is not subjected to solar radiation in the morning but rather in the afternoon.
4.1.5. PMV
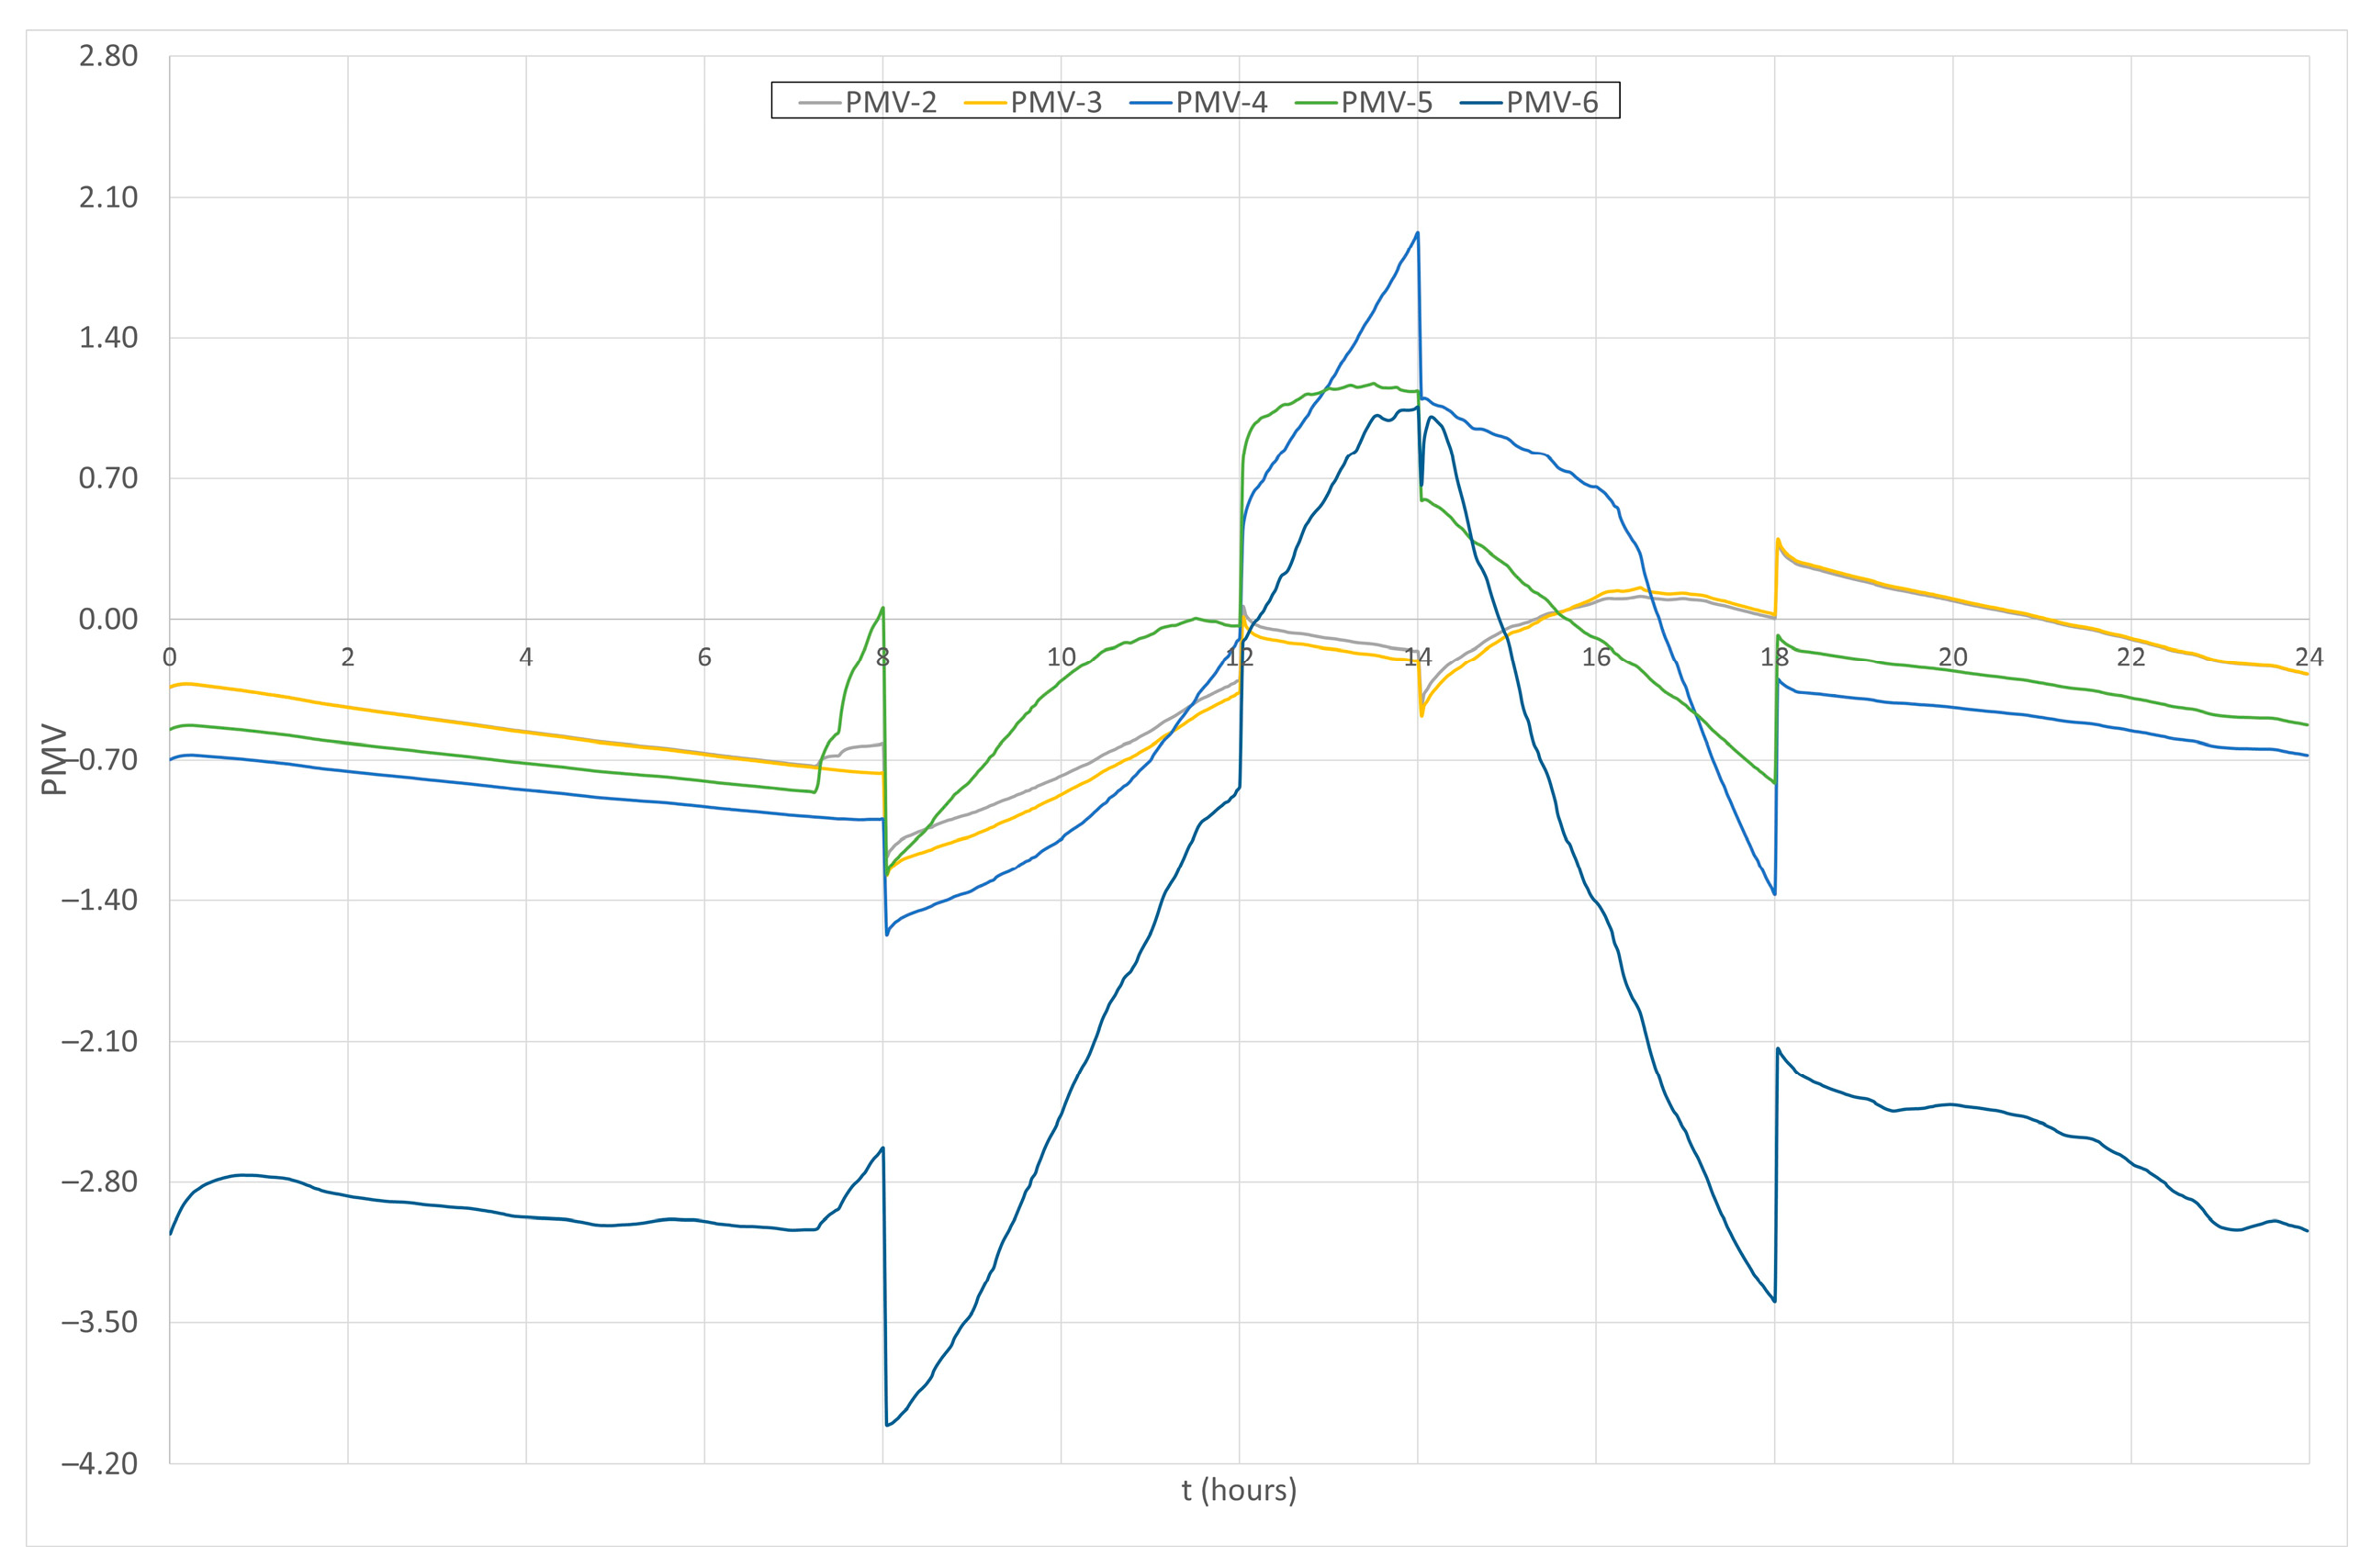
- A slightly uncomfortable thermal comfort level (PMV values lower than −0.7) due to negative PMV values at the beginning of the morning;
- A comfortable thermal level due to the slightly negative PMV values (PMV values higher than −0.7) at the end of the morning;
- A slightly uncomfortable thermal level due to positive PMV values (PMV values lower than 0.7) at the beginning of the afternoon;
- A comfortable thermal level due to the positive PMV values (PMV values lower than 0.7) at the end of the afternoon.
- A slightly uncomfortable thermal level with negative PMV values (PMV values lower than −0.7) at the beginning of the morning;
- A comfortable thermal level with negative PMV values (PMV values higher than −0.7) at the end of the morning;
- A slightly uncomfortable thermal level in the afternoon with positive PMV values at the beginning of the afternoon (PMV values higher than 0.7) and negative PMV values at the end of the afternoon (PMV values lower than −0.7).
4.1.6. Influence of the Solar Radiation on the TC Levels
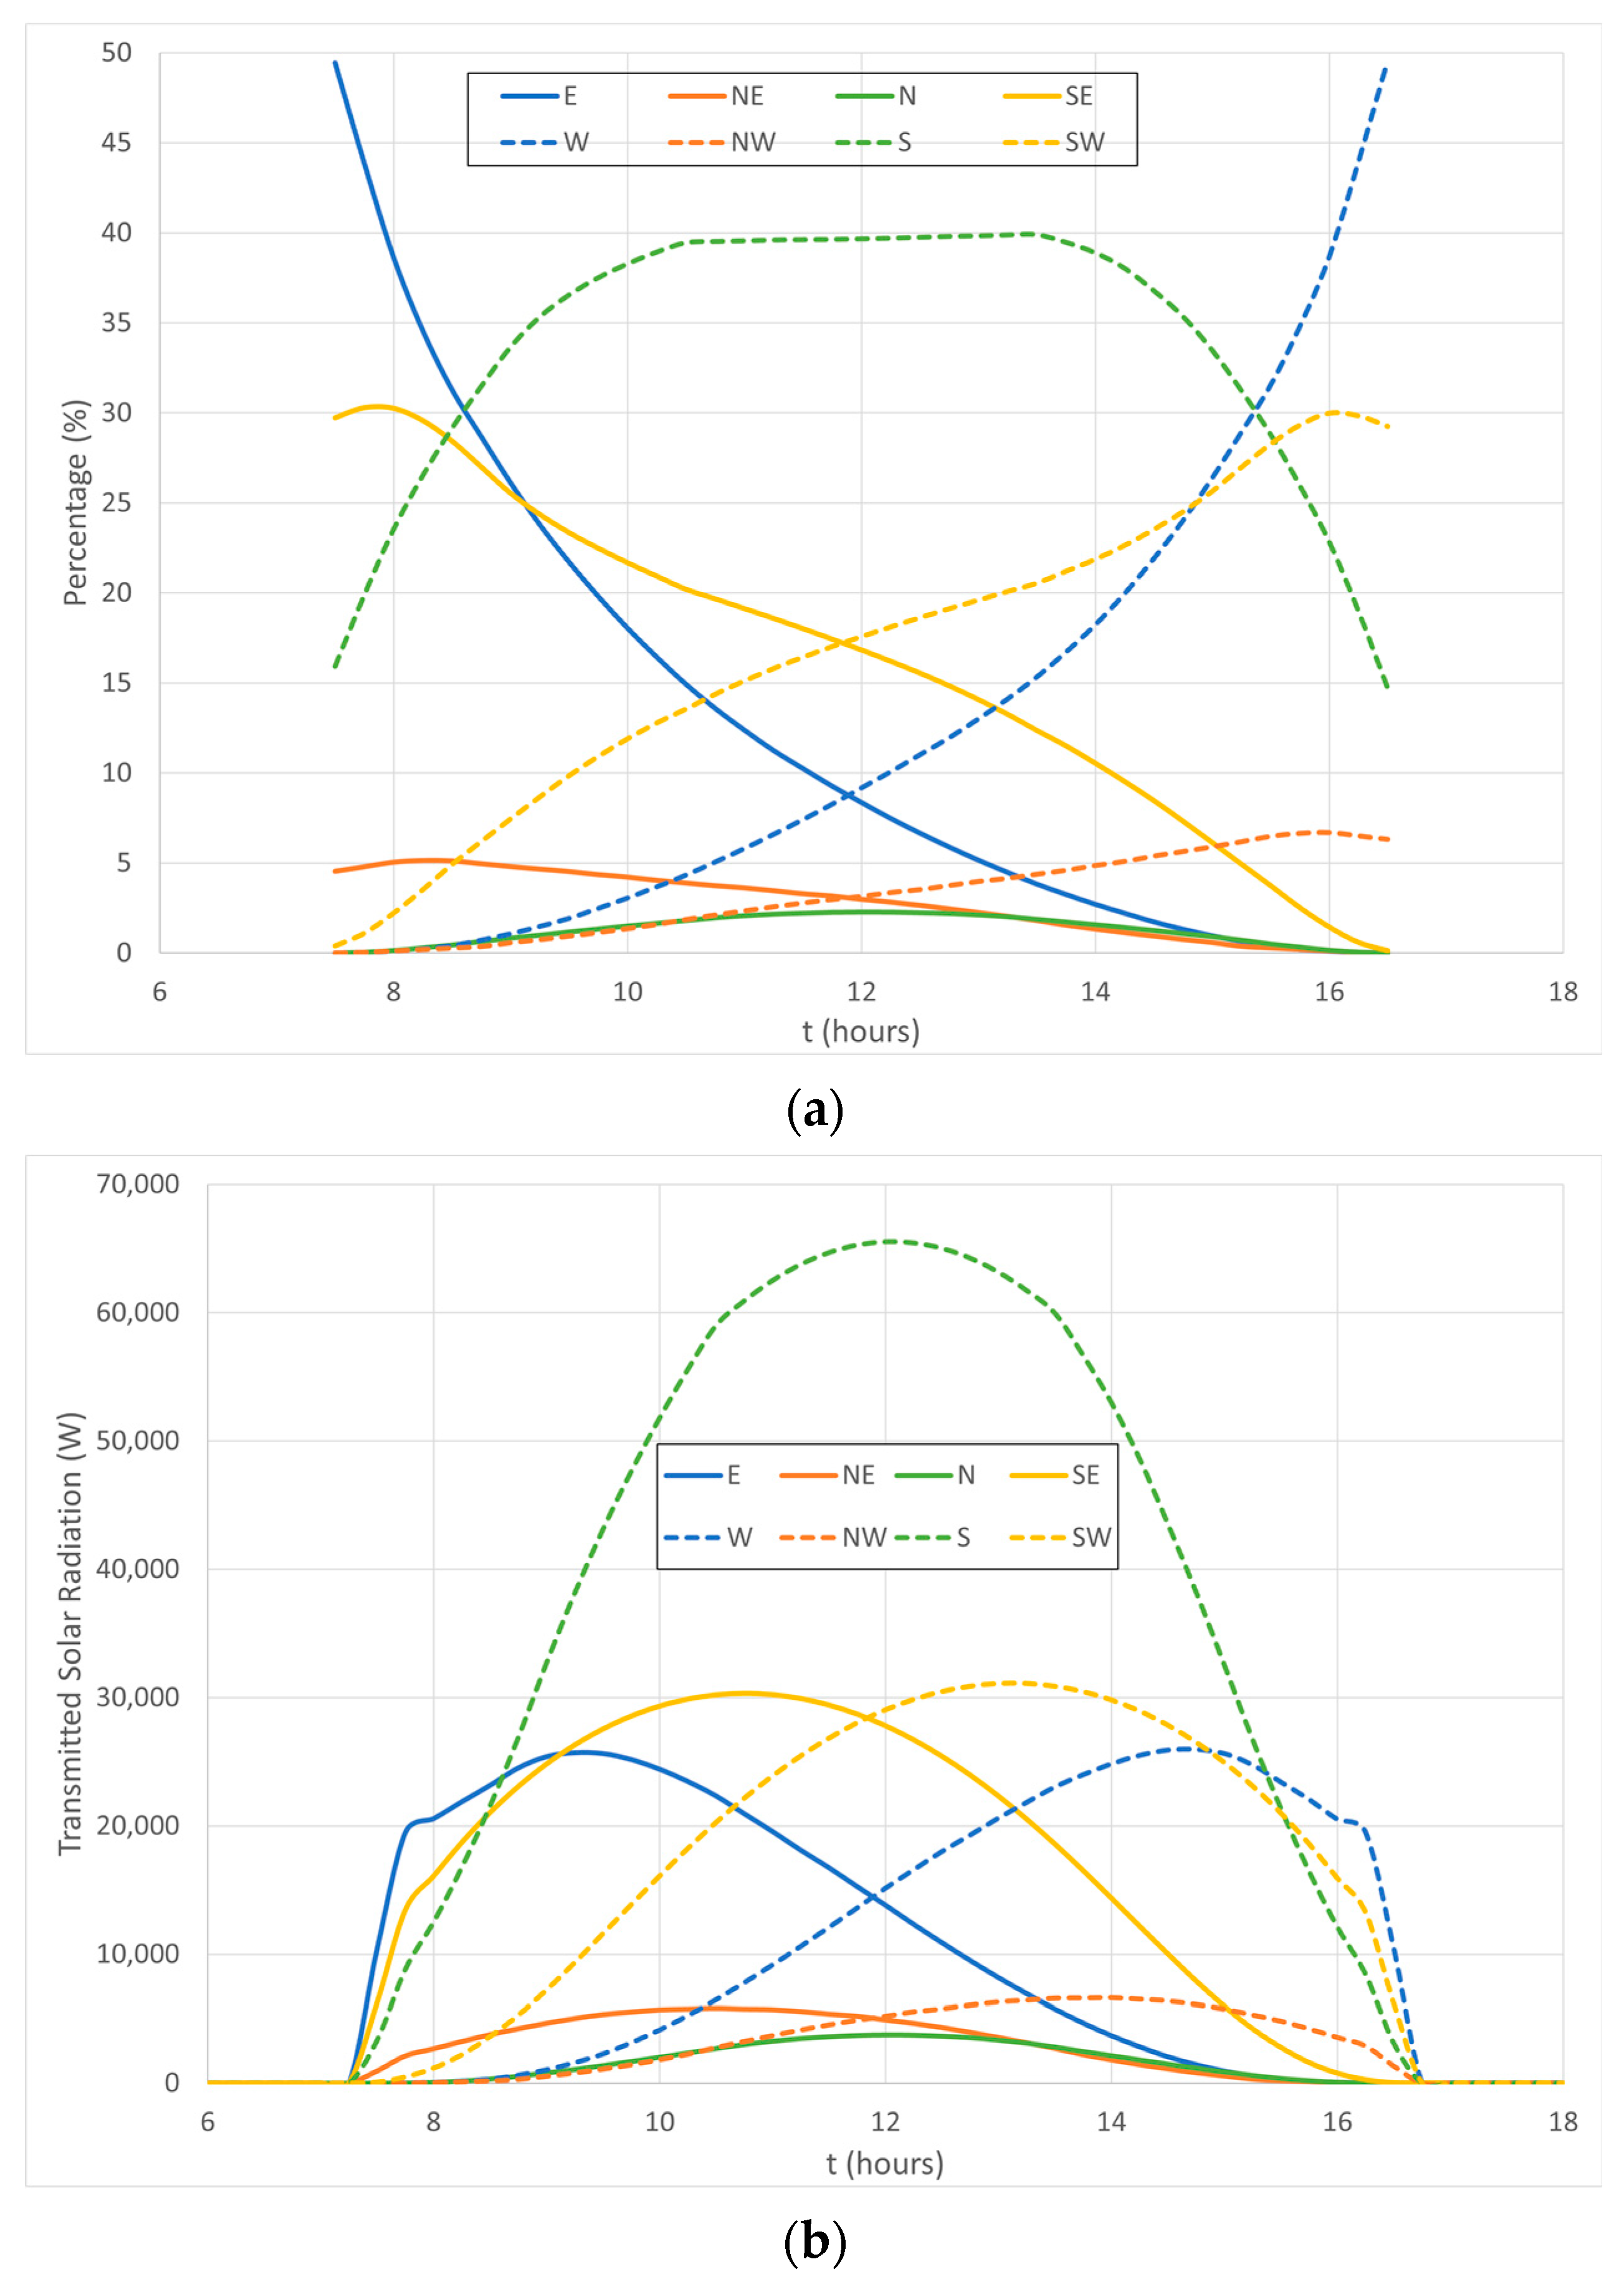
- The east section: This section presents an important contribution, mainly at the beginning of the morning in the heating process, and a consecutively and relatively high contribution to the TC level;
- The north-east section, north section, and north-west section: These sections present low contributions in the heating process and consecutively low contributions in the TC level;
- The west section: This section presents an important contribution, mainly at the end of the afternoon in the heating process, and a consecutively and relatively high contribution to the TC level;
- The south-west section: This section presents an important contribution, mainly in the afternoon to the heating process, and a consecutively and relatively high contribution to the TC level;
- The south section: This section presents the most important contribution to the heating process and a consecutively high contribution to the TC level during the whole day, but mainly at the end of the morning and beginning of the afternoon;
- The south-east section: This section presents an important contribution, mainly in the morning, to the heating process, and a consecutively and relatively high contribution to the TC level.
- The south-west section auditorium (space 4): The windows located in this space are subjected, in general, to transmitted solar radiation all day. However, in the afternoon, they present the highest contribution to the heating process and consequently to an uncomfortable TC level due to positive PMV values higher than 0.7;
- The south-east section auditorium (space 5): The windows located in this space are subjected, in general, to transmitted solar radiation all day. However, in the morning, they present the highest contribution to the heating process and consequently to a comfortable TC level due to negative PMV values higher than −0.7.
4.1.7. Influence of the Airflow Rate on the TC and IAQ
4.2. UAV Results
4.2.1. UAV Indoor Movement and Surface Measurements
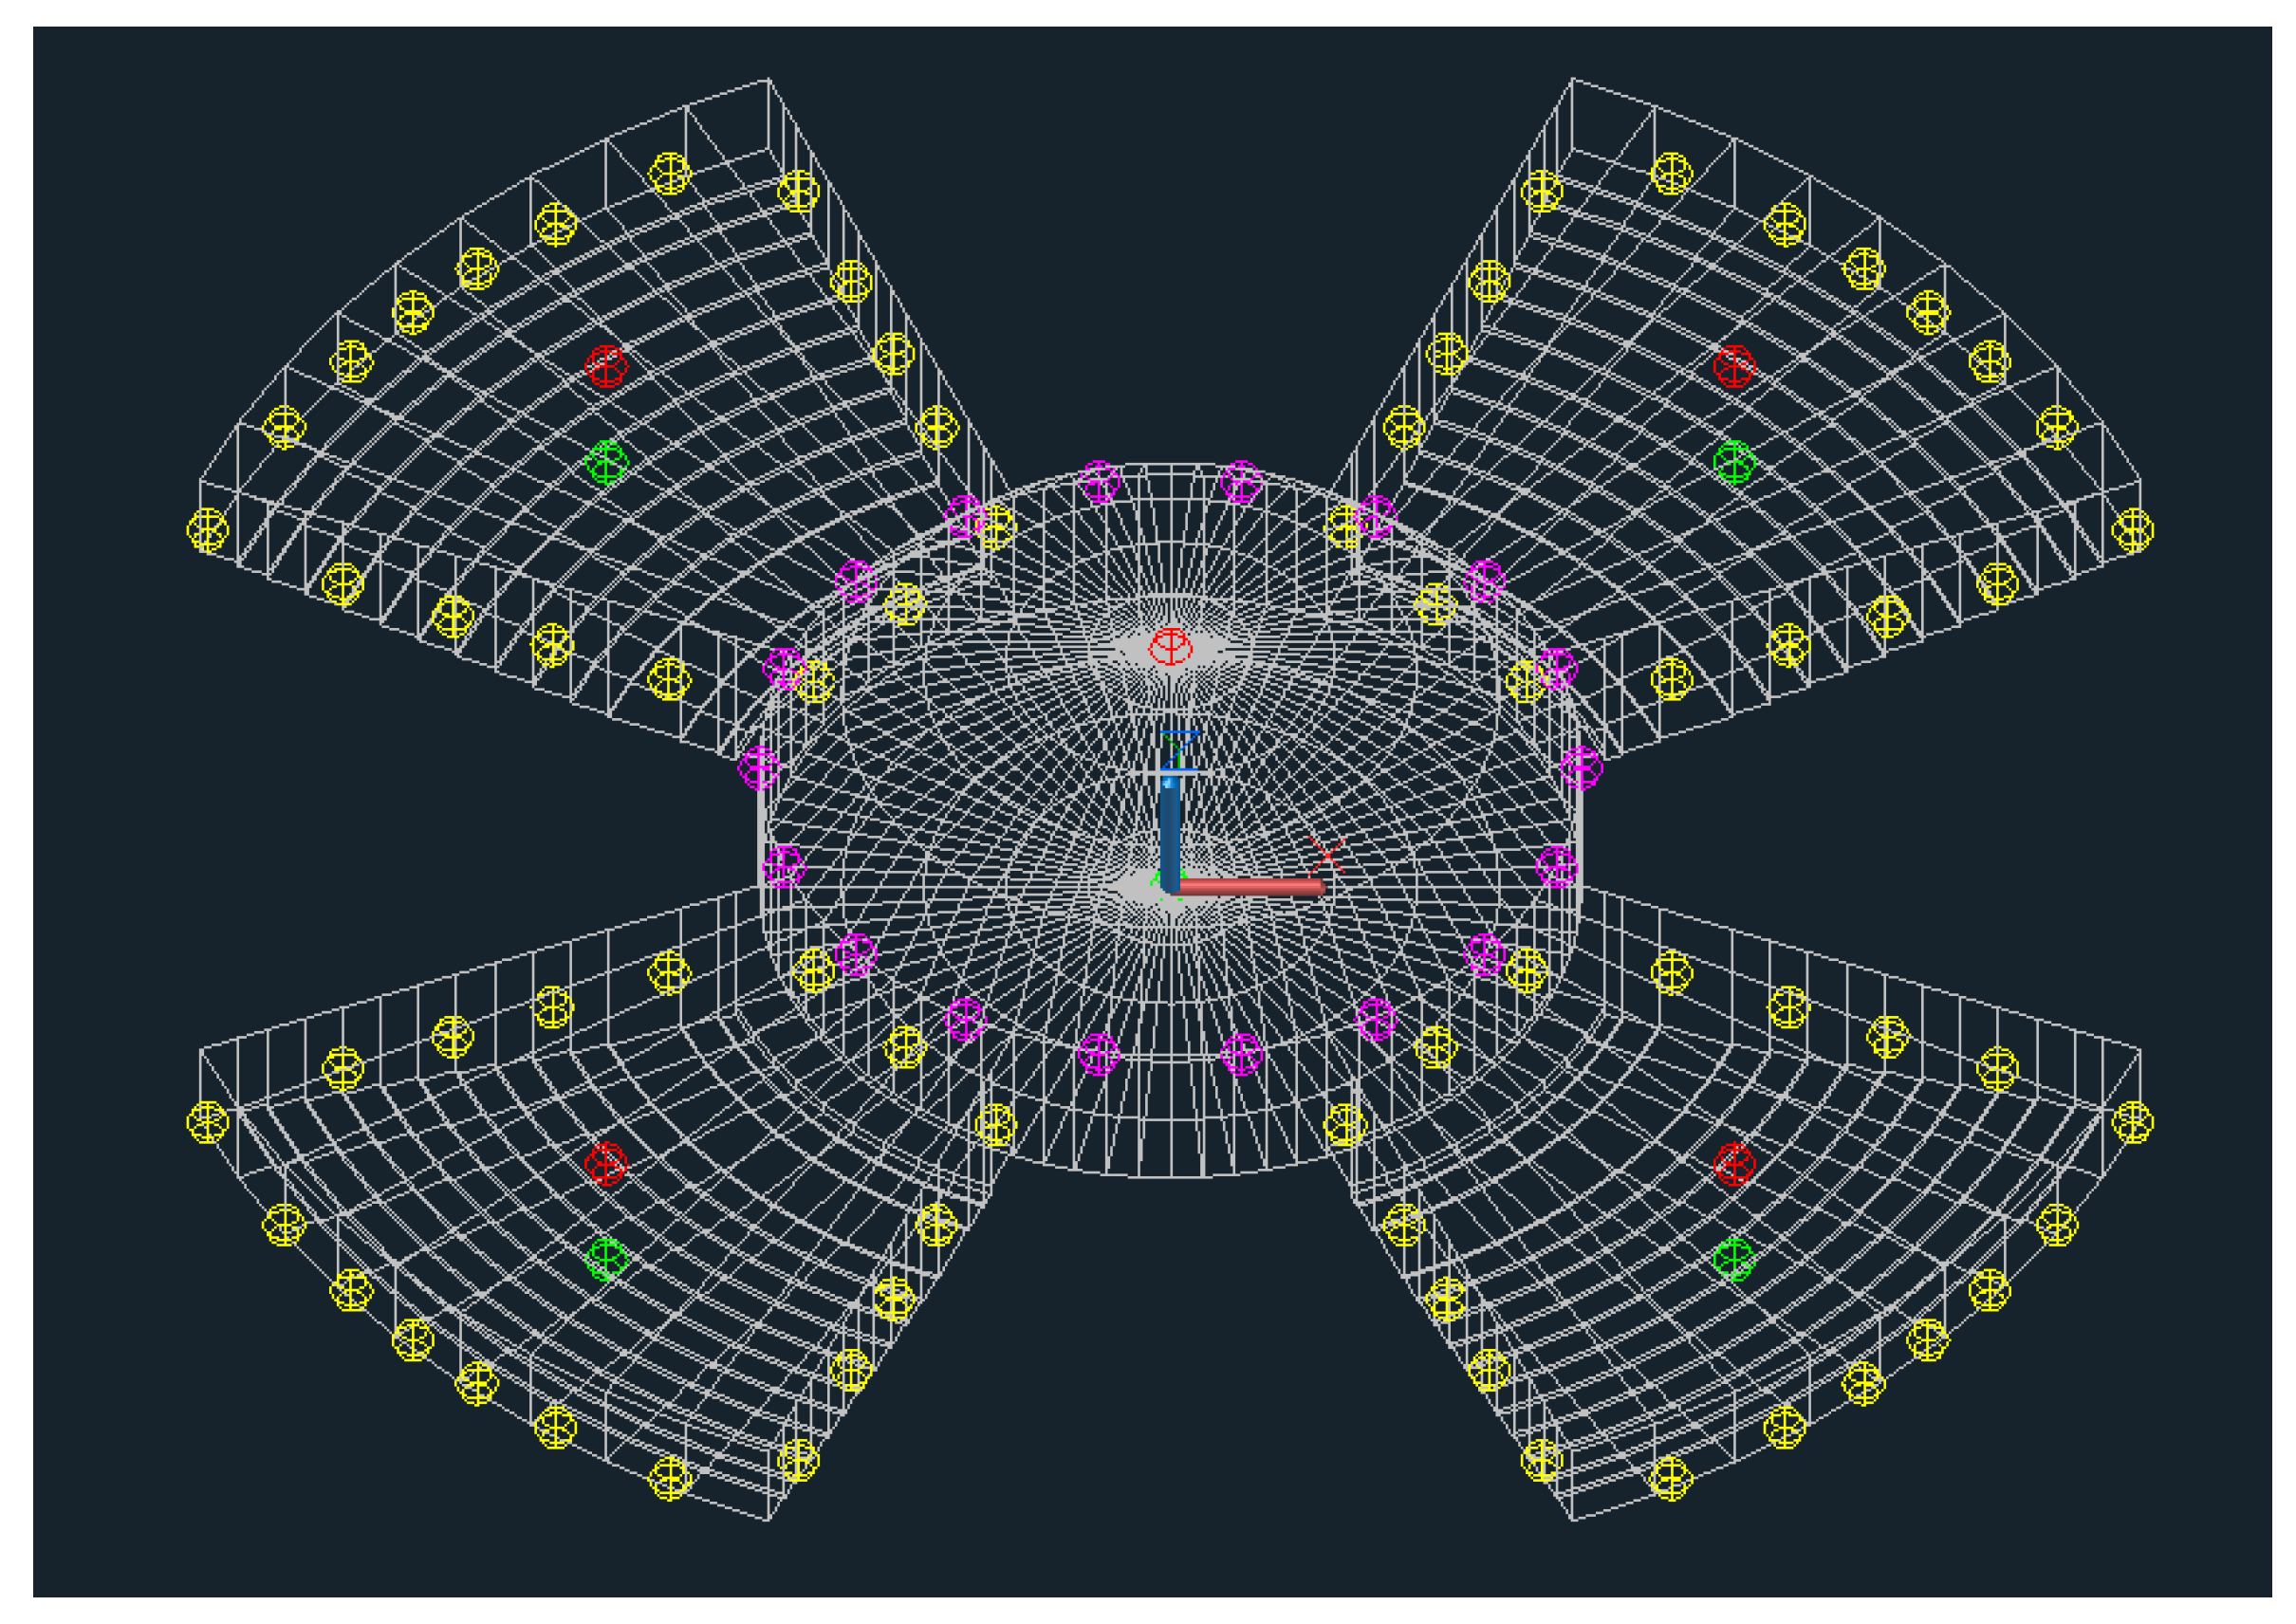
- Red, for the ceiling surface measurement location;
- Green, for the floor surface measurement location;
- Yellow, for the lateral wall surface measurement location in the auditorium;
- Magenta, for the lateral wall surface in the measurement location in the greenhouse.
- Approach A considers a single cycle composed of an 8-min measuring period and a 2-min resting period repeated continuously during the morning and afternoon testing periods. It considers a single-UAV mission, where the UAV monitors the entire building in the following order of spaces: 6, 2, 6, 3, 6, 4, 6, 5, and 6. This approach will measure across all spaces during the mission duration. Therefore, it will be adequate for monitoring environments with low variability;
- Approach B considers two complementary cycles. The first cycle is composed of the same measuring time and a lower resting time. It is performed by two UAVs simultaneously, where each one visits two adjacent spaces and the central space. The first UAV considers the following order of spaces: 6, 2, 6, and 3, while the second UAV considers the following order of spaces: 6, 4, 6, and 5. The UAV flights are desynchronized to avoid unwanted collisions. This cycle can provide more measurements per time unit and is therefore more suitable for high environmental variability. The second cycle is equal to the single cycle of approach A regarding measurement, resting times, and the order in which the spaces are visited. It is also implemented by a single UAV. In this approach, the first cycle is implemented in periods where more measurements are required for an accurate environmental representation, while the second cycle is implemented in more environmentally stable periods. The proportion of first and second-cycle implementation periods throughout the day should be personalized to the building under analysis so that the first cycle is performed during the high environmental variation time period and the second cycle is performed during the remaining evaluation time.
4.2.2. UAV TC
- In spaces 2 and 3, during the morning and afternoon periods, the calculated MTR using the floor surface, ceiling surface, and indoor air temperatures is slightly higher than the MRT simulation values. Thus, the TC level obtained by the UAV is slightly higher than that of the BTS simulation. This phenomenon is associated with the UAV considering a slightly higher value of the MRT than the BTS simulation;
- In spaces numbers 2 and 3, during the morning and afternoon periods, the calculated MTR using the lateral wall temperatures is lower than the simulated MRT value. Thus, the TC level obtained by the UAV is lower than that of the BTS simulation. This phenomenon is associated with the UAV considering a lower value of the MRT than the BTS simulation, mainly due to the lower window glass temperatures facing north;
- Thus, in accordance with the obtained results, in the north-facing auditorium, without incident solar radiation, the floor and ceiling surface temperatures present an acceptable value for the MRT estimation.
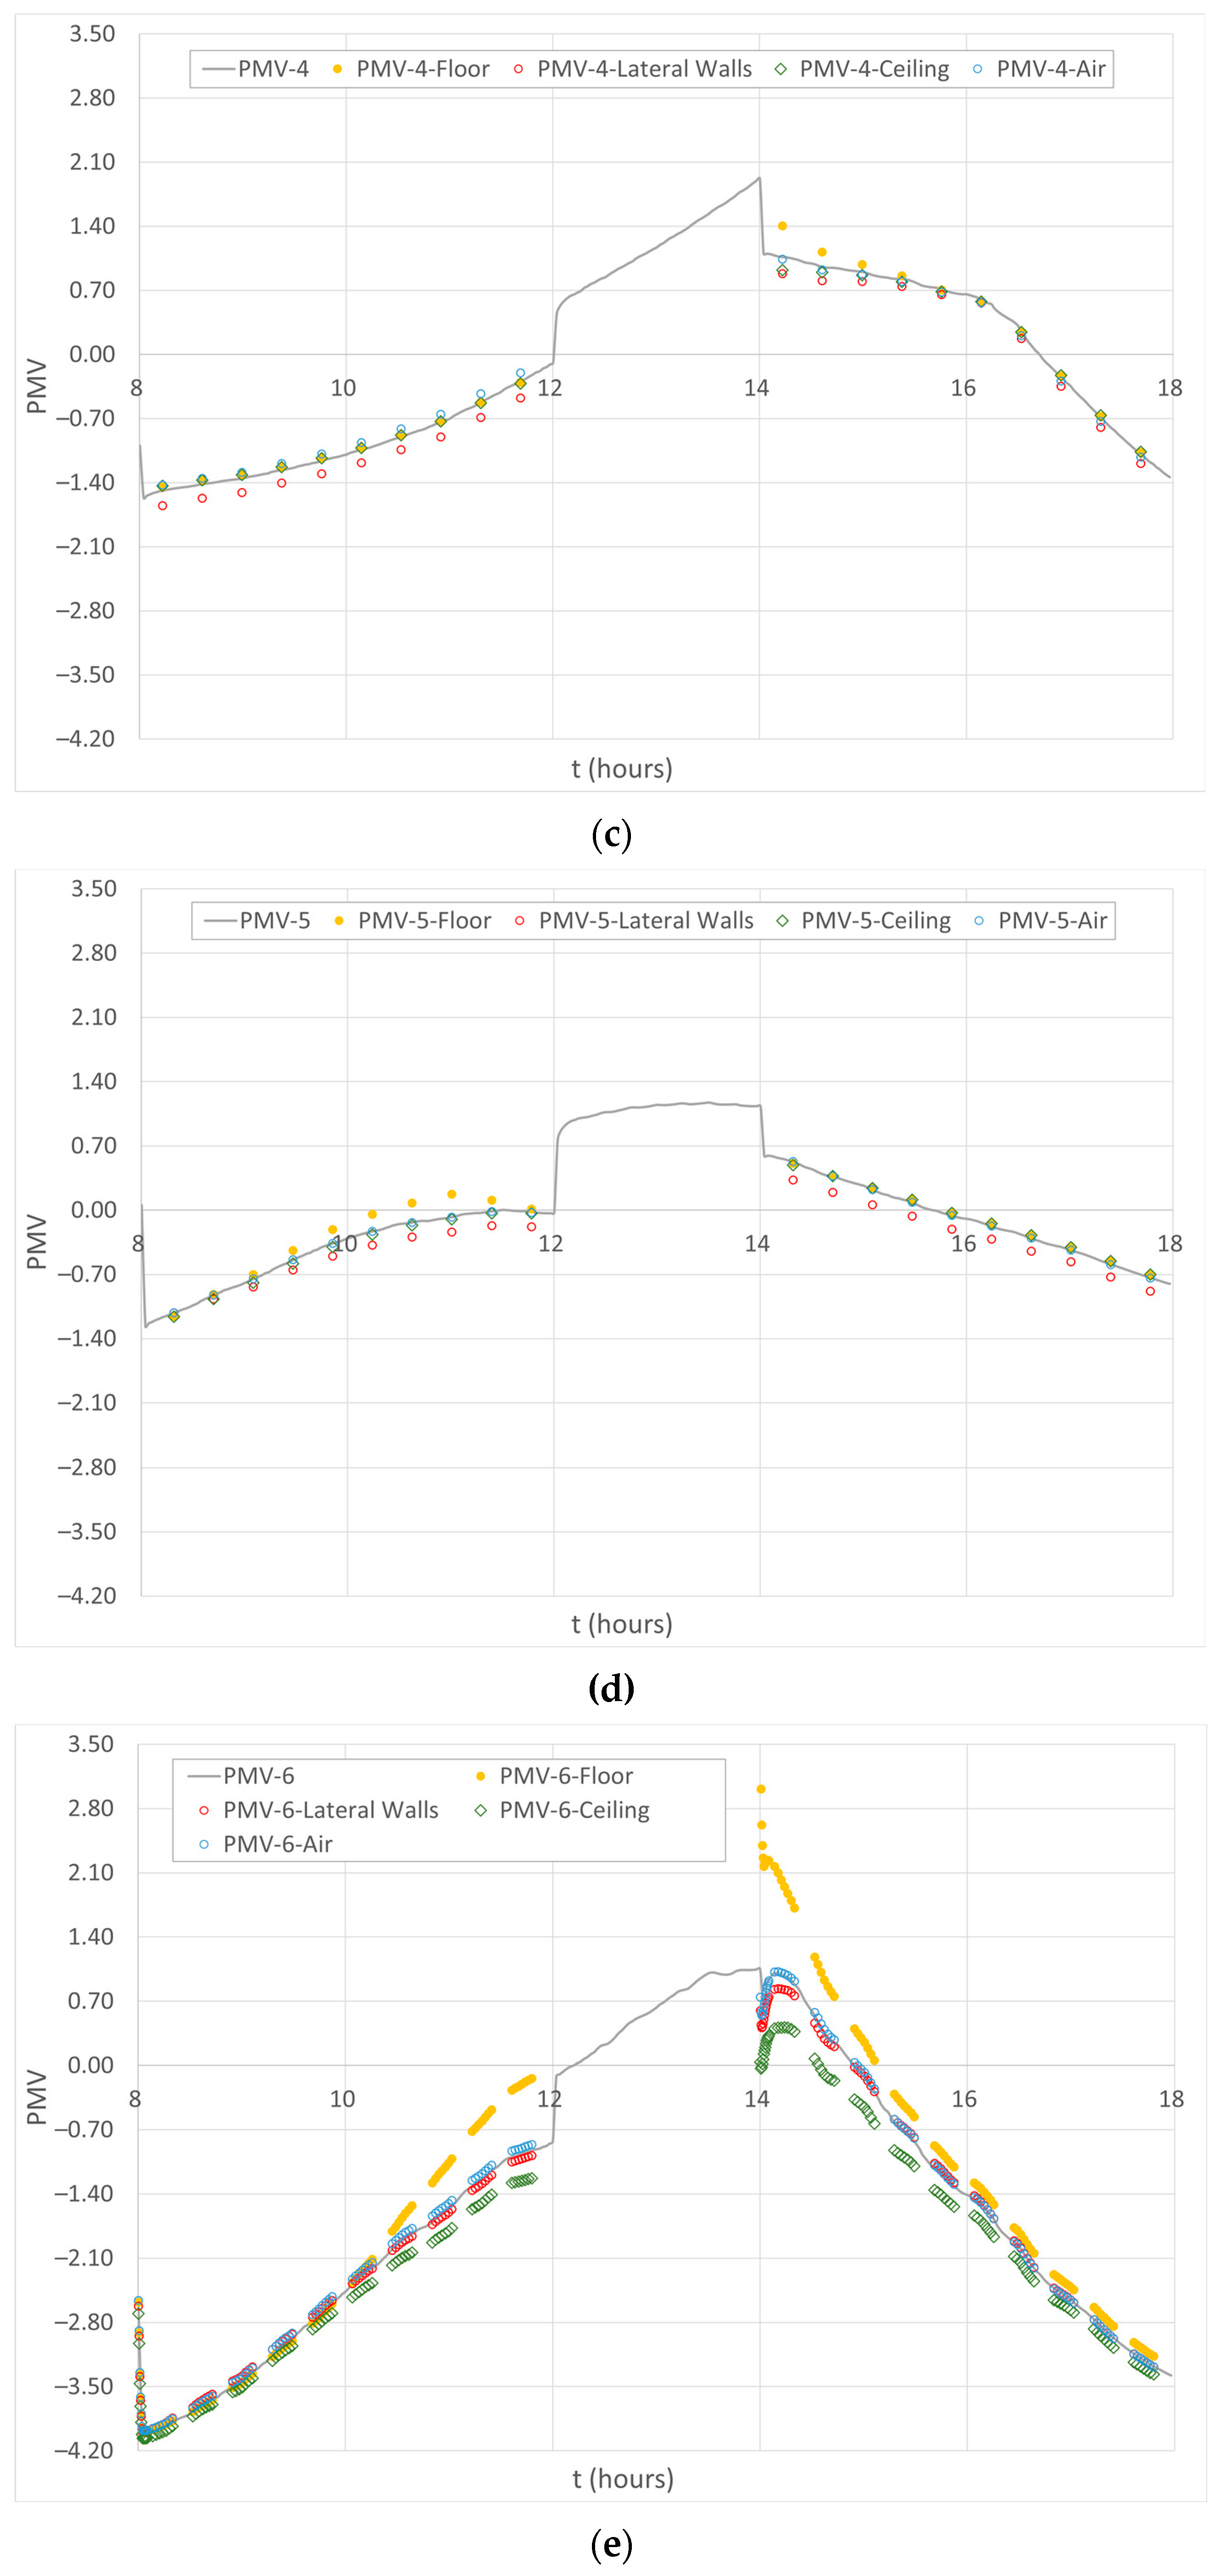
- In space 4, during the morning period, the calculated MTR using the floor surface and ceiling surface temperatures is equal to the MRT simulation value. In space 5, during the afternoon period, the calculated MTR using the floor surface, ceiling surface, and indoor air temperatures is equal to the simulated MRT value. During the morning period, the MTR calculated using the floor surface and indoor air temperatures is equal to the simulated MRT value. Thus, the TC level obtained by the UAV is similar to the one obtained by the BTS simulation;
- In space 4, during the morning period, the MTR was calculated using the indoor air temperatures that were slightly higher than the simulated MRT value, and in space 4, during the afternoon period, and in spaces 5, during the morning period, the MTR was calculated using the floor surface temperature that was slightly higher than the MRT simulation value. Thus, the TC level obtained by the UAV is slightly higher than the value obtained by the BTS simulation. This phenomenon is associated with the UAV considering a higher value of the MRT on the floor surface than the BTS simulation because the floor is subjected to incident solar radiation;
- In spaces 4 and 5, during the morning and afternoon periods, the MTR calculated using the lateral wall temperatures is lower than the MRT simulation value. Thus, the TC level obtained by the UAV is lower than that of the BTS simulation;
- Thus, in accordance with the obtained results, for the south-facing auditorium with incident solar radiation, the ceiling surface temperatures and sometimes the indoor air temperature present an acceptable value for the MRT estimation value.
- In space 6, during the morning and afternoon periods, the lateral wall temperature is similar to the MRT value. During the afternoon period, the indoor air temperature is similar to the MRT value. Thus, the UAV measurements obtained are similar to the BTS simulation;
- In space 6, in the morning and afternoon periods, the ceiling surface temperature is slightly lower than the MRT value. Thus, the TC level obtained by the UAV is slightly lower than that of the BTS simulation. This phenomenon is associated with the UAV considering a lower value of the MRT on the ceiling surface than the BTS simulation because the central ceiling surface is subjected to low incident solar radiation;
- In space 6, during the morning and afternoon periods, the MTR calculated using the floor surface temperatures is lower than the MRT simulation value. Thus, the TC level obtained by the UAV is lower than that of the BTS simulation. This phenomenon is associated with the incident solar radiation verified all day on the floor surface;
- Thus, in accordance with the results obtained in the greenhouse, with incident solar radiation, the lateral wall surface temperatures and sometimes the indoor air temperature present an acceptable value for the MRT estimation value.
5. Conclusions
Author Contributions
Funding
Institutional Review Board Statement
Informed Consent Statement
Data Availability Statement
Conflicts of Interest
Nomenclature
| BTS | building thermal simulator |
| CFD | computational fluids dynamic |
| CO2 IoT | carbon dioxide concentration internet of things |
| MRT | mean radiant temperature |
| PMV | predicted mean vote |
| TC | thermal comfort |
| UAV | unmanned aerial vehicle |
| UAV DS | UAV dynamic simulator |
References
- ASHRAE Standard 62-1989; Ventilation for Acceptable Indoor Air Quality. American Society of Heating, Refrigerating, and Air-Conditioning Engineers, Inc.: Atlanta, GA, USA, 1990.
- Ministérios do Ambiente; Ordenamento do Território e Energia; da Saúde e da Solidariedade. Regulamento de Desempenho Energético dos Edifícios de Comércio e Serviços (RECS)—Requisitos de Ventilação e Qualidade do Ar Interior; no. 353-A/2013; Diário da República: Lisboa, Portugal, 2013; pp. 6644-(2)–6644-(9). [Google Scholar]
- Korsavi, S.S.; Montazami, A.; Mumovic, D. Indoor air quality (IAQ) in naturally-ventilated primary schools in the UK: Occupant-related factors. Build. Environ. 2020, 180, 106992. [Google Scholar] [CrossRef]
- Abdullah, S.; Hamid, F.F.A.; Ismail, M.; Ahmed, A.N.; Mansor, W.N.W. Data on Indoor Air Quality (IAQ) in kindergartens with different surrounding activities. Data Brief 2019, 25, 103969. [Google Scholar] [CrossRef] [PubMed]
- Conceição, E.; Silva, M.C.; Viegas, D.X. Air quality inside the passenger compartment of a bus. J. Expo. Anal. Environ. Epidemiol. 1997, 7, 521–534. [Google Scholar] [PubMed]
- Fanger, P.O. Thermal Comfort. Analysis and Applications in Environmental Engineering; Danish Technical Press: Copenhagen, Denmark, 1970. [Google Scholar]
- ANSI/ASHRAE Standard 55-2017; Thermal Environmental Conditions for Human Occupancy. ASHRAE Inc.: Atlanta, GA, USA, 2017.
- ISO 7730; Ergonomics of the Thermal Environment Analytical Determination and Interpretation of Thermal Comfort Using Calculation of the PMV and PPD Indices and Local Thermal Comfort Criteria. International Standard Organization: Geneva, Switzerland, 2005.
- Conceição, E.Z.; Lúcio, M.M.J. Evaluation of thermal comfort conditions in a localized radiant system placed in front and behind two students seated nearby warmed curtains. Build. Environ. 2010, 45, 2100–2110. [Google Scholar] [CrossRef]
- Conceição, E.Z.E.; Lúcio, M.M.J.R. Numerical simulation of passive and active solar strategies in buildings with complex topology. Build. Simul. 2010, 3, 245–261. [Google Scholar] [CrossRef]
- Conceição, E.Z.E.; Lúcio, M.M.J.R. Numerical Simulation of the Application of Solar Radiant Systems, Internal Airflow and Occupants’ Presence in the Improvement of Comfort in Winter Conditions. Buildings 2016, 6, 38. [Google Scholar] [CrossRef]
- Chaturvedi, A.; Shrivastava, L. IOT Based Wireless Sensor Network for Air Pollution Monitoring. In Proceedings of the 2020 IEEE 9th International Conference on Communication Systems and Network Technologies (CSNT), Gwalior, India, 10–12 April 2020. [Google Scholar] [CrossRef]
- Hu, Z.; Bai, Z.; Yang, Y.; Zheng, Z.; Bian, K.; Song, L. UAV Aided Aerial-Ground IoT for Air Quality Sensing in Smart City: Architecture, Technologies, and Implementation. IEEE Netw. 2019, 33, 14–22. [Google Scholar] [CrossRef]
- Zhi, S.D.; Wei, Y.B.; Yu, Z.H. Air quality monitoring platform based on remote unmanned aerial vehicle with wireless communication. In Proceedings of the International Conference on Future Networks and Distributed Systems, Cambridge, UK, 19–20 July 2017; ACM International Conference Proceeding Series. Volume Part F130522. [Google Scholar] [CrossRef]
- Bolla, G.M.; Casagrande, M.; Comazzetto, A.; Moro, R.D.; Destro, M.; Fantin, E.; Colombatti, G.; Aboudan, A.; Lorenzini, E.C. ARIA: Air Pollutants Monitoring Using UAVs; ARIA: Air Pollutants Monitoring Using UAVs. In Proceedings of the 2018 5th IEEE International Workshop on Metrology for AeroSpace (MetroAeroSpace), Rome, Italy, 20–22 June 2018. [Google Scholar] [CrossRef]
- Takei, Y.; Kanazawa, Y.; Hirasawa, K.; Nanto, H. Development of 3D gas source localization using multi-copter with gas sensor array. In Proceedings of the ISOCS/IEEE International Symposium on Olfaction and Electronic Nose, Fukuoka, Japan, 26–29 May 2019. [Google Scholar] [CrossRef]
- Burgués, J.; Hernández, V.; Lilienthal, A.; Marco, S. Smelling Nano Aerial Vehicle for Gas Source Localization and Mapping. Sensors 2019, 19, 478. [Google Scholar] [CrossRef]
- Tuzson, B.; Graf, M.; Ravelid, J.; Scheidegger, P.; Kupferschmid, A.; Looser, H.; Morales, R.P.; Emmenegger, L. A compact QCL spectrometer for mobile, high-precision methane sensing aboard drones. Atmos. Meas. Tech. 2020, 13, 4715–4726. [Google Scholar] [CrossRef]
- Hussain, A.M.; Azmy, S.B.; Abuzrara, A.; Al-Hajjaji, K.; Hassan, A.; Khamdan, H.; Ezzin, M.; Hassani, A.; Zorba, N. UAV-based Semi-Autonomous Data Acquisition and Classification. In Proceedings of the 2018 14th International Wireless Communications and Mobile Computing Conference, IWCMC 2018, Limassol, Cyprus, 25–29 June 2018; Institute of Electrical and Electronics Engineers Inc.: Piscataway, NJ, USA, 2018; pp. 1273–1277. [Google Scholar] [CrossRef]
- Babaan, J.B.; Ballori, J.P.; Tamondong, A.M.; Ramos, R.V.; Ostrea, P.M. Estimation of PM 2.5 vertical distribution using customized UAV and mobile sensors in Brgy. UP Campus, Diliman, Quezon City. Int. Arch. Photogramm. Remote Sens. Spat. Inf. Sci. 2018, 42, 89–103. [Google Scholar] [CrossRef]
- Hemamalini, R.R.; Vinodhini, R.; Shanthini, B.; Partheeban, P.; Charumathy, M.; Cornelius, K. Air quality monitoring and forecasting using smart drones and recurrent neural network for sustainable development in Chennai city. Sustain. Cities Soc. 2022, 85, 104077. [Google Scholar] [CrossRef]
- Zhao, X.; Luo, Y.; He, J. Analysis of the Thermal Environment in Pedestrian Space Using 3D Thermal Imaging. Energies 2020, 13, 3674. [Google Scholar] [CrossRef]
- Rodríguez, M.V.; Melgar, S.G.; Márquez, J.M.A. Assessment of aerial thermography as a method of in situ measurement of radiant heat transfer in urban public spaces. Sustain. Cities Soc. 2022, 87, 104228. [Google Scholar] [CrossRef]
- Rüdisser, D.; Weiss, T.; Unger, L. Spatially Resolved Analysis of Urban Thermal Environments Based on a Three-Dimensional Sampling Algorithm and UAV-Based Radiometric Measurements. Sensors 2021, 21, 4847. [Google Scholar] [CrossRef] [PubMed]
- Rodríguez, M.V.; Melgar, S.G.; Cordero, A.S.; Márquez, J.M.A. A Critical Review of Unmanned Aerial Vehicles (UAVs) Use in Architecture and Urbanism: Scientometric and Bibliometric Analysis. Appl. Sci. 2021, 11, 9966. [Google Scholar] [CrossRef]
- Stokowiec, K.; Sobura, S. Hand-Held and UAV Camera Comparison in Building Thermal Inspection Process. J. Phys. Conf. Ser. 2022, 2339, 012017. [Google Scholar] [CrossRef]
- Wang, R.; Zhou, Z.; Shen, Y. Robust landing control and simulation for flying wing UAV. In Proceedings of the 26th Chinese Control Conference, CCC 2007, Zhangjiajie, China, 26–31 July 2007; pp. 600–604. [Google Scholar] [CrossRef]
- de Croon, G.; de Wagter, C. Challenges of Autonomous Flight in Indoor Environments. In Proceedings of the IEEE International Conference on Intelligent Robots and Systems, Madrid, Spain, 1–5 October 2018; pp. 1003–1009. [Google Scholar] [CrossRef]
- Badrloo, S.; Varshosaz, M.; Pirasteh, S.; Li, J. A novel region-based expansion rate obstacle detection method for MAVs using a fisheye camera. Int. J. Appl. Earth Obs. Geoinf. 2022, 108, 102739. [Google Scholar] [CrossRef]
- Chen, S.; Wang, L.; Chen, W. Research on optimization of visual navigation algorithm for real-time obstacle avoidance of uav moving target tracking. In Proceedings of the 2019 IEEE 1st International Conference on Civil Aviation Safety and Information Technology, ICCASIT 2019, Kunming, China, 17–19 October 2019; pp. 315–320. [Google Scholar] [CrossRef]
- Xue, Z.; Gonsalves, T. Monocular Vision Obstacle Avoidance UAV: A Deep Reinforcement Learning Method. In Proceedings of the 2021 2nd International Conference on Innovative and Creative Information Technology (ICITech), Salatiga, Indonesia, 23–25 September 2021. [Google Scholar] [CrossRef]
- Park, J.; Cho, N.; Lee, S. Reactive Collision Avoidance Algorithm for UAV Using Bounding Tube against Multiple Moving Obstacles. IEEE Access 2020, 8, 218131–218144. [Google Scholar] [CrossRef]
- Mao, Y.; Chen, M.; Wei, X.; Chen, B. Obstacle Recognition and Avoidance for UAVs under Resource-Constrained Environments. IEEE Access 2020, 8, 169408–169422. [Google Scholar] [CrossRef]
- Yilmaz, K.; Kaya, O.F.; Uslu, E. Indoor UAV Localization and 3D Mapping Using Visual Odometry. In Proceedings of the 2020 Innovations in Intelligent Systems and Applications Conference (ASYU), Istanbul, Turkey, 15–17 October 2020; pp. 1–5. [Google Scholar] [CrossRef]
- Eckert, J.; German, R.; Dressler, F. On autonomous indoor flights: High-quality real-time localization using low-cost sensors. In Proceedings of the 2012 IEEE International Conference on Communications (ICC), Ottawa, ON, Canada, 10–15 June 2012; pp. 7093–7098. [Google Scholar] [CrossRef]
- Gupta, A.; Fernando, X. Simultaneous Localization and Mapping (SLAM) and Data Fusion in Unmanned Aerial Vehicles: Recent Advances and Challenges. Drones 2022, 6, 85. [Google Scholar] [CrossRef]
- Neumann, P.P.; Hirschberger, P.; Baurzhan, Z.; Tiebe, C.; Hofmann, M.; Hullmann, D.; Bartholmai, M. Indoor Air Quality Monitoring using flying Nanobots: Design and Experimental Study. In Proceedings of the 2019 IEEE International Symposium on Olfaction and Electronic Nose (ISOEN), Fukuoka, Japan, 26–29 May 2019. [Google Scholar] [CrossRef]
- Neumann, P.P.; Hüllmann, D.; Bartholmai, M. Concept of a gas-sensitive nano aerial robot swarm for indoor air quality monitoring. Mater. Today Proc. 2019, 12, 470–473. [Google Scholar] [CrossRef]
- Yungaicela, N.M.; Garza-Castañón, L.E.; Mendoza, A.; Minchala, I. Design and Implementation of an UAV-Based Platform for Air Pollution Monitoring and Source Identification. 2017. Available online: https://www.researchgate.net/publication/321294786 (accessed on 10 March 2023).
- Conceicao, E.; Da Silva, M.; Andre, J.; Viega, D. Thermal behaviour simulation of the passenger compartment of vehicles. Int. J. Veh. Des. 2000, 24, 372. [Google Scholar] [CrossRef]









Disclaimer/Publisher’s Note: The statements, opinions and data contained in all publications are solely those of the individual author(s) and contributor(s) and not of MDPI and/or the editor(s). MDPI and/or the editor(s) disclaim responsibility for any injury to people or property resulting from any ideas, methods, instructions or products referred to in the content. |
© 2023 by the authors. Licensee MDPI, Basel, Switzerland. This article is an open access article distributed under the terms and conditions of the Creative Commons Attribution (CC BY) license (https://creativecommons.org/licenses/by/4.0/).
Share and Cite
Conceição, M.I.; Conceição, E.; Grilo, A.; Basiri, M.; Awbi, H. The Application of UAVs in the Evaluation of Thermal Comfort Levels in Buildings Equipped with Internal Greenhouses. Clean Technol. 2023, 5, 1080-1114. https://doi.org/10.3390/cleantechnol5030055
Conceição MI, Conceição E, Grilo A, Basiri M, Awbi H. The Application of UAVs in the Evaluation of Thermal Comfort Levels in Buildings Equipped with Internal Greenhouses. Clean Technologies. 2023; 5(3):1080-1114. https://doi.org/10.3390/cleantechnol5030055
Chicago/Turabian StyleConceição, Maria Inês, Eusébio Conceição, António Grilo, Meysam Basiri, and Hazim Awbi. 2023. "The Application of UAVs in the Evaluation of Thermal Comfort Levels in Buildings Equipped with Internal Greenhouses" Clean Technologies 5, no. 3: 1080-1114. https://doi.org/10.3390/cleantechnol5030055
APA StyleConceição, M. I., Conceição, E., Grilo, A., Basiri, M., & Awbi, H. (2023). The Application of UAVs in the Evaluation of Thermal Comfort Levels in Buildings Equipped with Internal Greenhouses. Clean Technologies, 5(3), 1080-1114. https://doi.org/10.3390/cleantechnol5030055


