Article

State of Charge and Capacity Tracking in Vanadium Redox Flow Battery Systems

Electrical and Computer Engineering, University of Alberta, Edmonton, AB T6G 1H9, Canada
*
Author to whom correspondence should be addressed.
Clean Technol. 2022, 4(3), 607-618; https://doi.org/10.3390/cleantechnol4030037
Submission received: 18 April 2022 / Revised: 2 June 2022 / Accepted: 13 June 2022 / Published: 28 June 2022

Abstract

:
The vanadium redox flow battery electrolyte is prone to several capacity loss mechanisms, which must be mitigated to preserve electrolyte health and battery performance. This study investigates a simple and effective technique for the recovery of capacity loss arising from symmetrical mechanisms via automatic electrolyte rebalancing. However, chemical or electrochemical techniques must be used to mitigate capacity loss from asymmetrical mechanisms (e.g., air oxidation of V 2 + ), which requires knowledge of the oxidation states present in the electrolytes. As such, this study assesses the suitability of SOC tracking via electrolyte absorption for independent monitoring of the anolyte and catholyte within an existing VRFB system. Testing is performed over cycling of a 40 cell, 2.5 kW with 40 L of electrolyte. Optical monitoring is performed using a custom-made flow cell with optical paths (interior cavity thicknesses) ranging from 1/4 to 1/16 . Light transmitted through the cell by a 550 lumen white light source is monitored by a simple photodiode. The electrolyte rebalancing mechanism displayed success in recovering symmetrical capacity losses, while optical monitoring was unsuccessful due to the high absorbance of the electrolyte. Potential improvements to the monitoring system are presented to mitigate this issue.

1. Introduction

In recent years, electricity production has been shifting towards renewable energy sources which commonly have a smaller ecological footprint. Among these are wind and solar, additions of which have generally taken a priority [1]. Contributions from these sources are expected to account for 20% of the EU’s gross energy consumption in 2020 and grow to 60% by 2050 [2]. Although economically and environmentally appealing, these sources are prone to intermittency. Possibly manifesting as mismatches in capacity, this has a negative impact on grid performance and reliability, which must be maintained to avoid equipment damage or blackouts. One approach to mitigate these issues is the integration of energy storage devices, such as batteries, into the grid.
Vanadium redox flow batteries (VRFBs) are an emerging form of energy storage with many attractive properties such as their high cycle life and round-trip energy efficiency. Vanadium’s two soluble redox couples allow a fully liquid state system to be created. Although this results in a poor energy density, the cycle life and maintenance requirements are improved due to the absence of degradation normally caused by solid-state reactions, and limited cross-contamination (a major issue with many types of flow batteries) due to the chemical similarities between the anolyte/catholyte [3]. Furthermore, these batteries are not susceptible to damage from undercharging. Importantly, VRFBs have high flexibility due to independent scaling of power and capacity (the electrolyte is stored in tanks and pumped into an electrochemical stack where the reduction–oxidation reactions occur).
During the charging process, the catholyte is converted from a V 4 + to V 5 + oxidation state (Equation (1)) while the anolyte is converted from a V 3 + to V 2 + oxidation state (Equation (2)).
V O ( a q ) 2 + + H 2 O ( l ) V O 2 ( a q ) + + 2 H ( a q ) + + e , E 0 = 1.0 V ,
V ( a q ) 3 + + e V ( a q ) 2 + , E 0 = 0.26 V .
Hence charging works to increase the difference between the redox-couple’s oxidation states according to:
V O ( a q ) 2 + + H 2 0 ( l ) + V ( a q ) 3 + V O 2 ( a q ) + + 2 H ( a q ) + + V ( a q ) 2 + , E 0 = 1.26 V ,
causing an increase in voltage as modelled by the Nernst Equation [3,4,5].
In the case of a balanced VRFB system (the anolyte and catholyte contain equal amounts of electrochemically available vanadium ions), the SOC may be expressed as [5,6,7,8,9]:
S O C = [ V ( a q ) 2 + ] [ V ( a q ) 2 + ] + [ V ( a q ) 3 + ] = [ V O ( a q ) 2 + ] [ V O ( a q ) 2 + ] + [ V O 2 ( a q ) + ] .
As such, the Nernst equation may be rewritten as
E = E 0 + R T F l n ( S O C 2 ( [ H + ] + S O C ) 2 ( 1 S O C ) 2 )
to allow for SOC estimation based on OCV measurements during battery cycling [5].
The amount of electrochemically available vanadium ions may degrade (manifesting as a capacity loss) in a symmetrical fashion, such as via bulk ion or water transport through the stack membranes [10,11]. Periodic or automatic remixing of the anolyte and catholyte may be used to recover performance degradation arising from these mechanisms, although resulting in a loss of usable energy [11]. However, the VRFB system is prone to many loss mechanisms that are asymmetrical, such as V(V) precipitation in the catholyte, V(II) oxidation in the anolyte, and gassing reactions at the positive and negative electrodes [5,10]. These types of imbalances cannot be mitigated via simple remixing of the electrolytes, with chemical or electrochemical techniques required to recover electrolyte health [10]. Furthermore, the equality of Equation (4) no longer holds true in the case of an imbalance, and OCV measurements deviate from those predicted by Equation (5). An optimal SOC monitoring system would thus be capable of performing SOC measurements on the anolyte/catholyte independently, such that the onset and extent of asymmetrical imbalances may be quantified and accounted for [5,10].
The addition of inert electrodes into each electrolyte reservoir would theoretically allow individual voltage measurements to be taken. However, this is impractical in large-scale applications due to drift in the measured potential and the need for frequent re-calibration to avoid SOC estimation errors [4,7,12]. Although improvements to SOC estimation models have been made to reduce the need for ex situ calibration, this method suffers from poor sensitivity due to the solution potential only changing slightly over wide SOC ranges [6,7,8,9]. Density measurements may also be used for SOCs, but similarly, they are subject to poor sensitivity [7,9]. A four-pole device has been created to monitor individual half-cell SOCs based on the voltage drop when current is applied through the outer poles [13]. However, this technique is prone to poor sensitivity when the applied current is low, and to inaccuracies when high. Conductivity measurements may similarly be used to monitor proton generation via Equation (1). However, this method has extensive calibration requirements due to dependence on the temperature and electrolyte chemistry [4,14,15].
Upon charging, the anolyte and catholyte undergo brilliant color changes from green to violet and blue to yellow, respectively, [16]. As such, capacity tracking may also be achieved via the electrolyte’s absorbance of light. However, the high absorbance of the electrolyte places a practical limit on the optical paths which may be used [4]. This paper aims to develop and assess the suitability of an optical monitoring system capable of simple, reliable, low cost, real-time SOC monitoring of each individual half-cell within an existing VRFB system. A clear flow cell with variable optical path lengths is integrated into a 2.5 kW VRFB system, inline between the electrolyte tanks and the inlets of the stack. A photodiode circuit is used to monitor the electrolyte’s transmittance of a 550 lumen white light source. This differs from other studies which typically use a spectrometer for the analysis of transmission spectra or the absorbance at certain wavelengths [4,5,10,14,16,17,18,19]. These methods may be cost-prohibitive as many commercially available spectrometer systems are in the thousands of dollars range (e.g., the approximately $15,000 ALS SEC2000 system utilized by Tang et al. [5,20]), while alternative self-developed spectrometers generally utilize CCD’s in the $1,000 range to allow for analysis at multiple wavelengths [17,19]. The proposed technique thus has the potential to reduce costs significantly by analyzing light transmitted through the electrolyte using an inexpensive photodiode [21]. This paper also investigates the inclusion of a hydraulic mechanism for the continuous mitigation of capacity loss arising from symmetrical mechanisms.

2. Materials and Methods
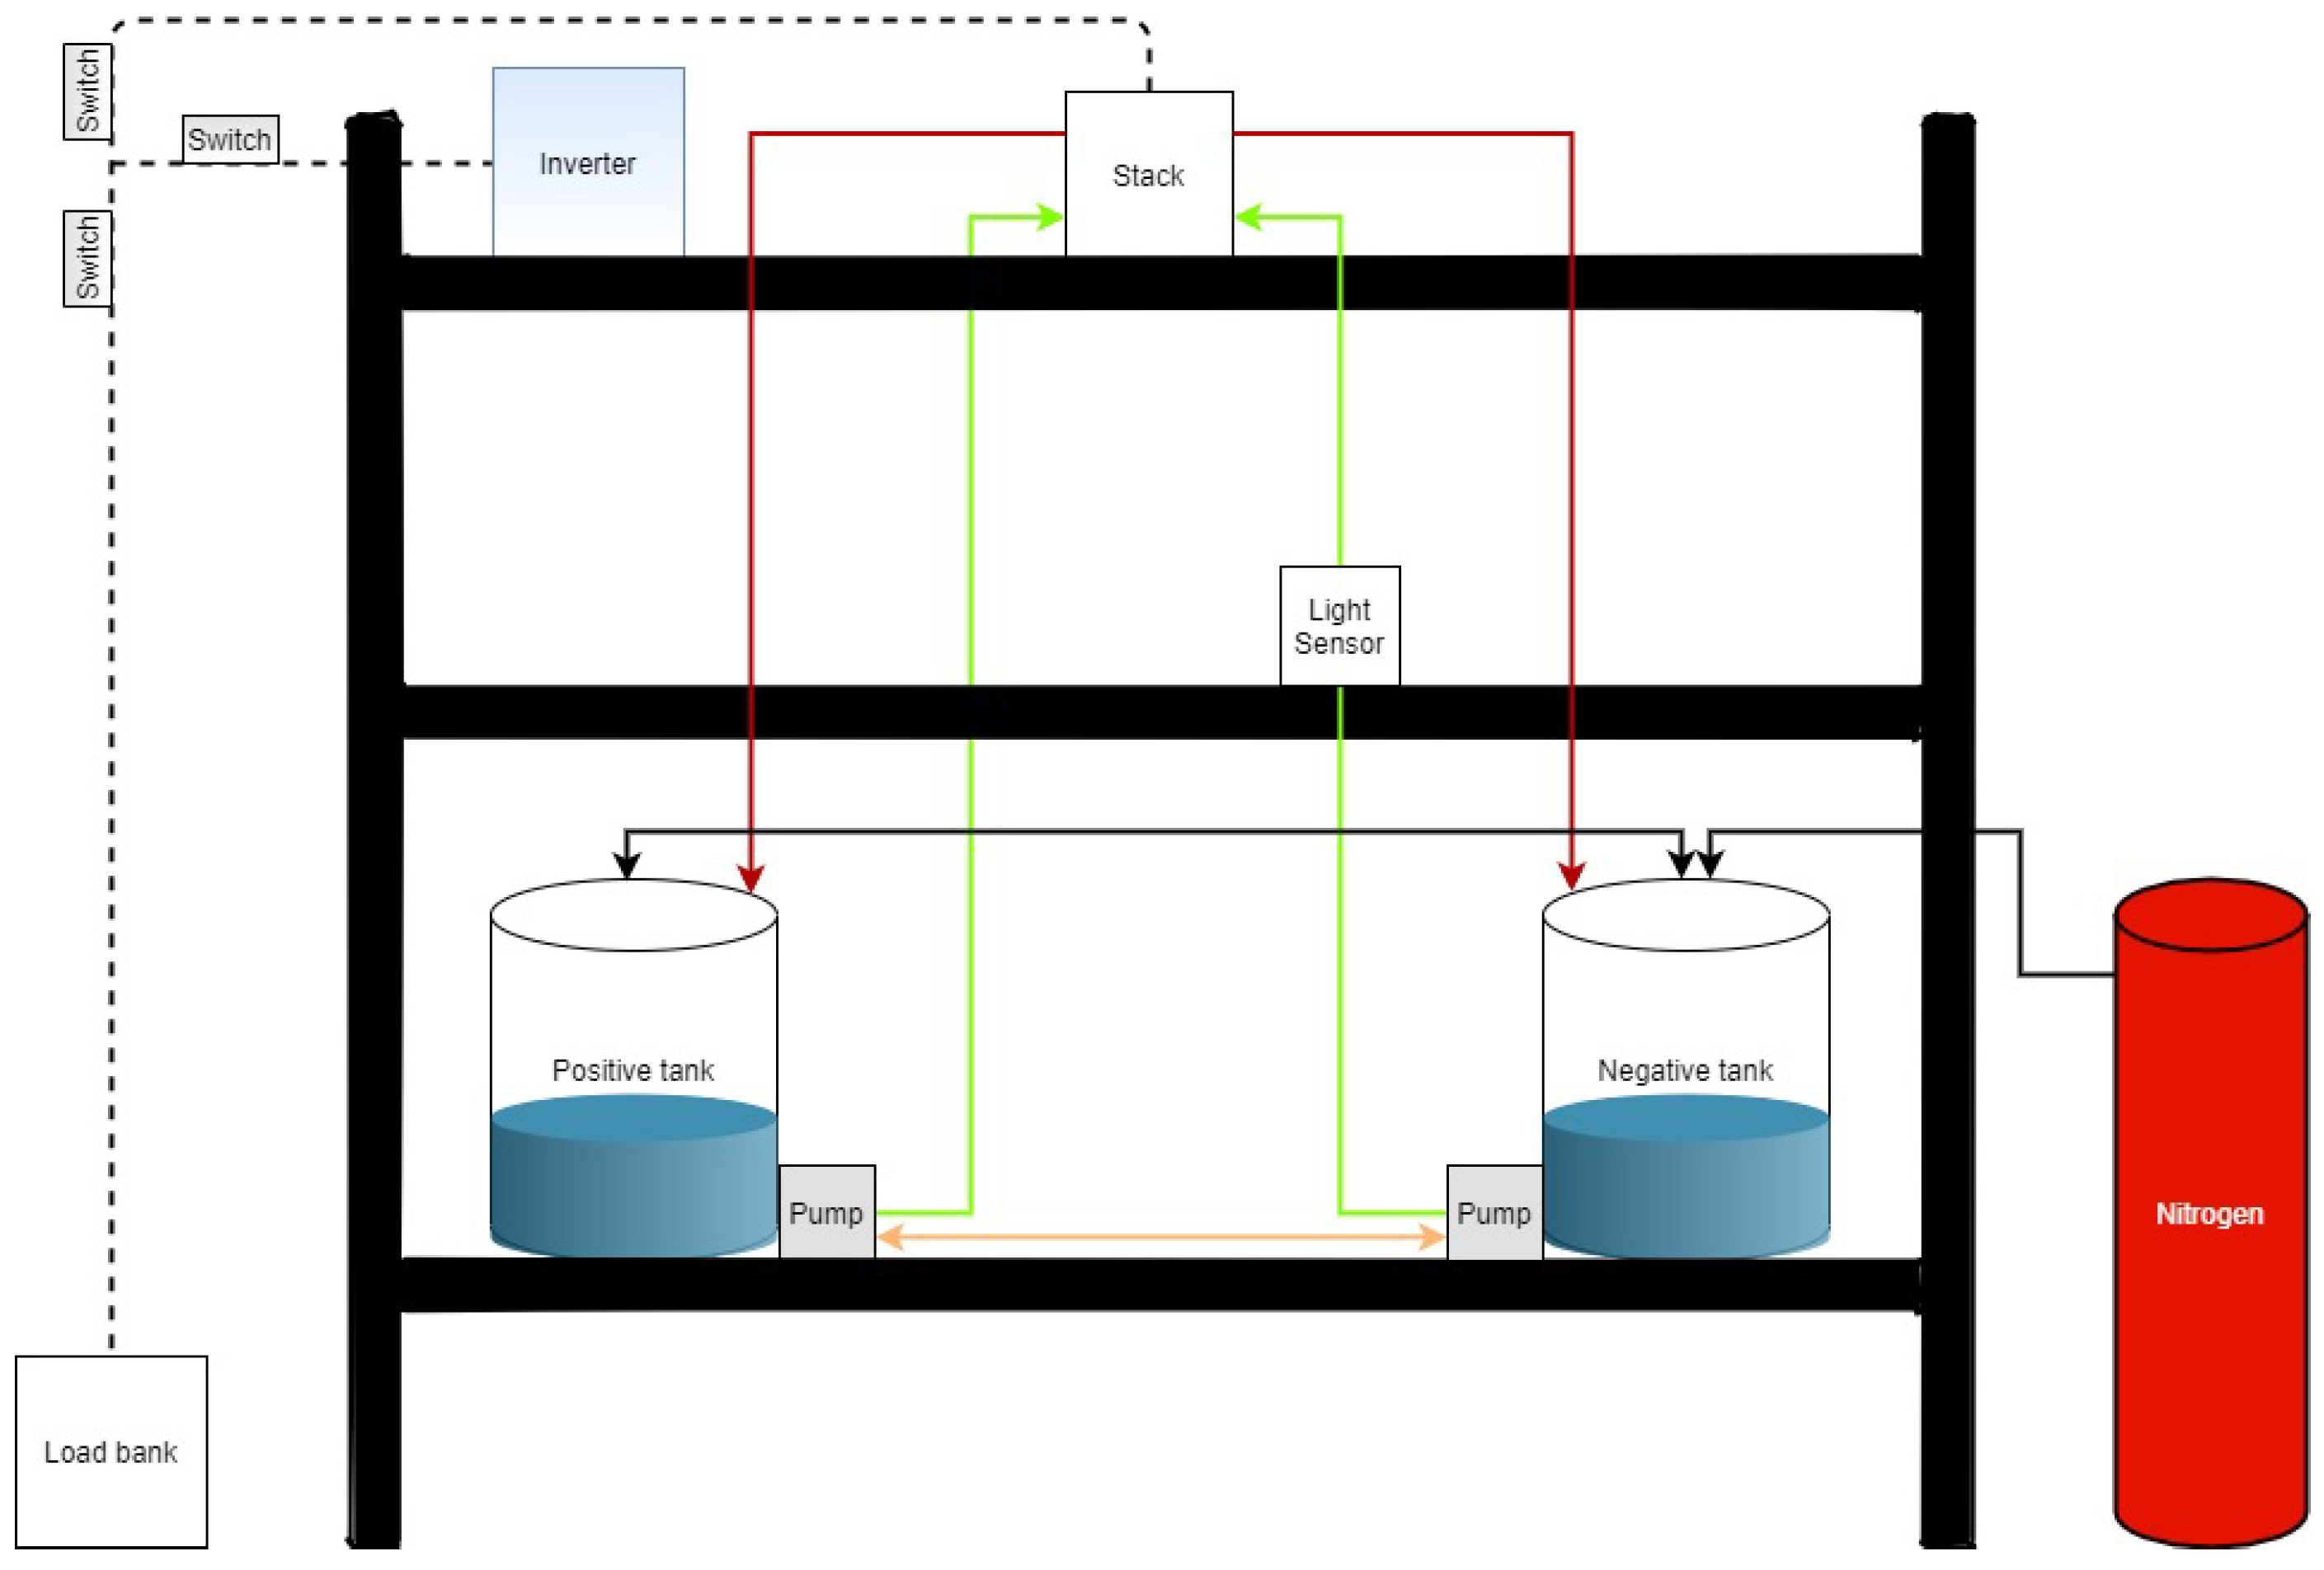
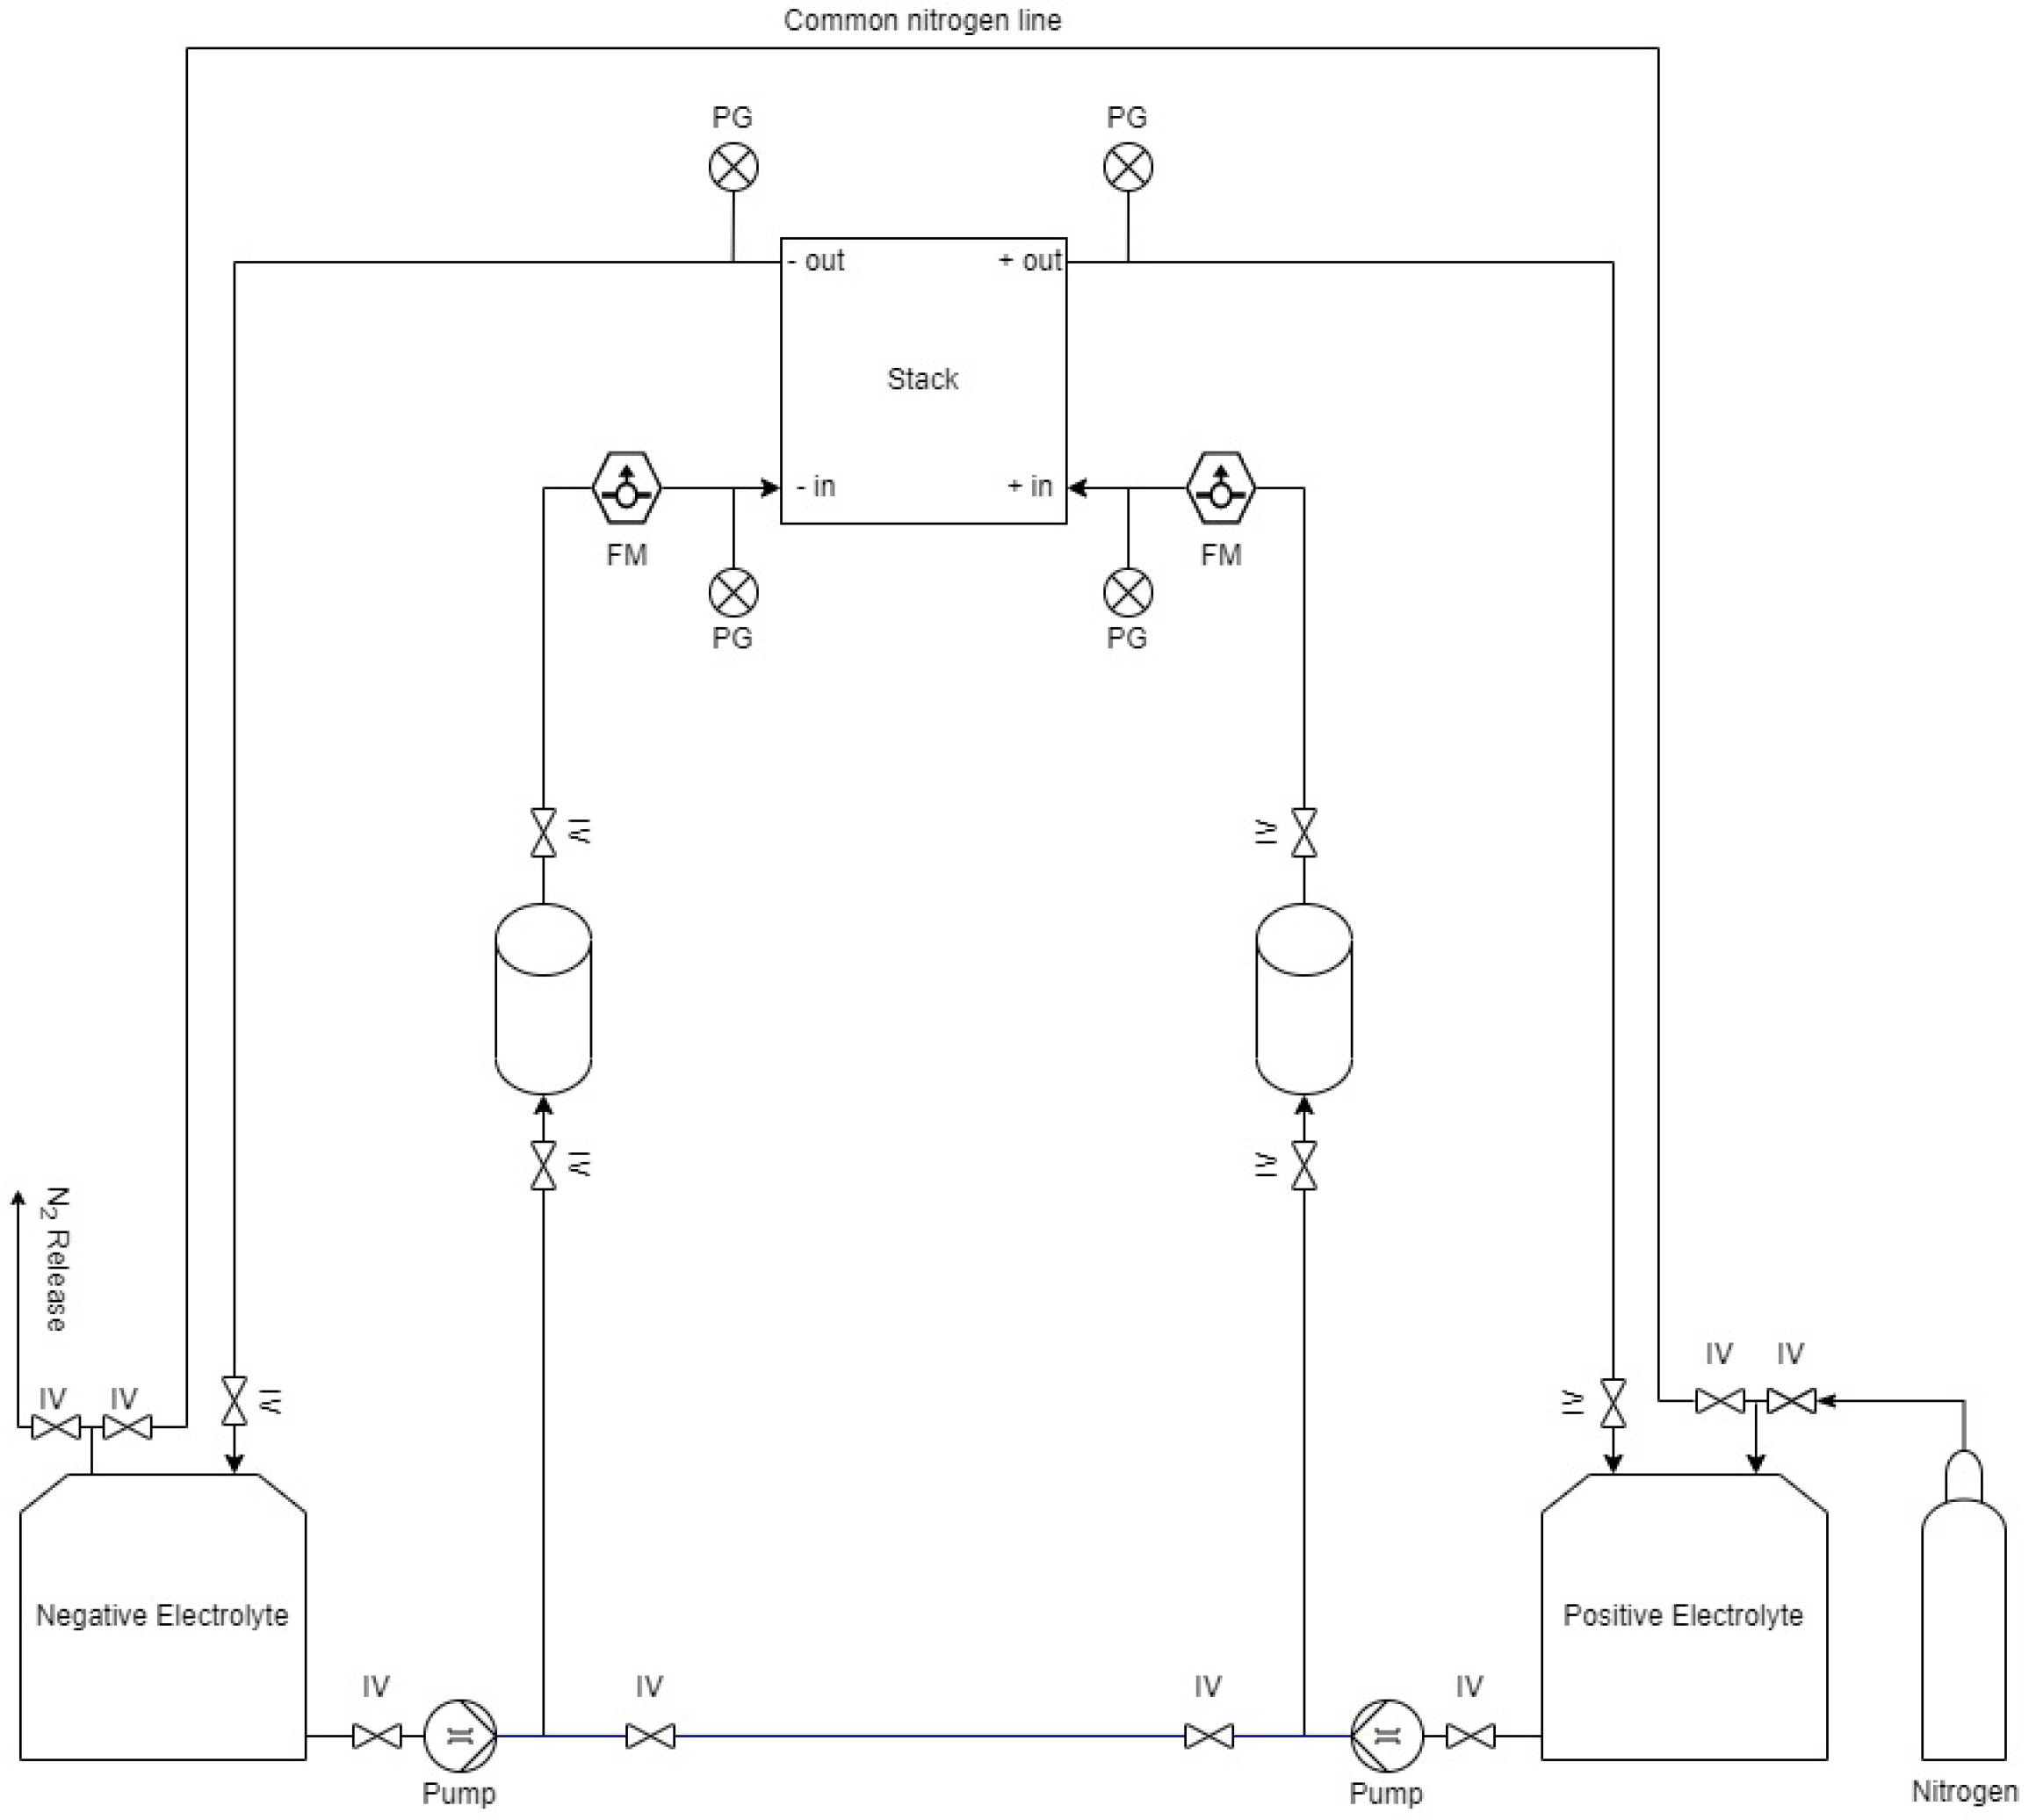
2.1. VRFB System

In order to house the VRFB system, a 6 × 6 × 2 frame was created with three platforms using 2 and 6 silver-anodized aluminum beams ( 2 × 2 cross section). The electrolyte is stored in two 83 L polyethylene tanks on the bottom platform. To mitigate symmetrical capacity loss, some experiments utilize a 1 4 inner diameter santoprene tubing (part 51225K29, McMaster-Carr) to create a hydraulic shunt between the tanks, as illustrated by the orange line in Figure 1. This allows for simple rebalancing of electrolyte volumes and oxidation states, initiation/cessation of which is controlled via a manual on/off valve (part 4876K12, McMaster-Carr). Differences in anolyte/catholyte volumes (due to crossover through the stack membranes) manifest as a height difference between the electrolyte levels, causing volumetric transfer to occur across the hydraulic shunt [11]. The electrolyte pumps (magnetic drive, INTG3-572 AOP Technologies) are powered by means of 24 V 211 W AC/DC converters (Digi-key 1866-3332-ND). The electrolyte is pumped through a 40-cell, 2.5 kW stack (VFBS 40, Volterion) on the top platform via 1 2 inner diameter santoprene tubing (green line in Figure 1), before being returned to the electrolyte tanks (red line in Figure 1).
Flowmeters (McMaster-Carr 9687K11) are placed inline prior to entering the stack and used to monitor the electrolyte flowrate. The pressure drop across the stack is monitored with 15 psig analog pressure sensors (Digi-key BPS140-HG015P-1SGCT-ND) located at the stack inlets/outlets. The locations of these sensors may be seen in Appendix A. Data retrieval (flowrate/pressure) and pump speed control is performed using a National instruments USB-6211 multifunctional I/O device.
The electrolyte tanks are purged with grade 4.8 nitrogen (99.998% purity) prior to cycling to avoid air oxidation of V 2 + . Charging is achieved with a Quattro Multiplus II, while discharging is performed at constant resistance via a 1.4 Ω or 10 Ω load bank. Charging proceeds in constant-current mode until a set maximum voltage is reached, then proceeds under constant-voltage mode until the current reduces below 1–2 A.

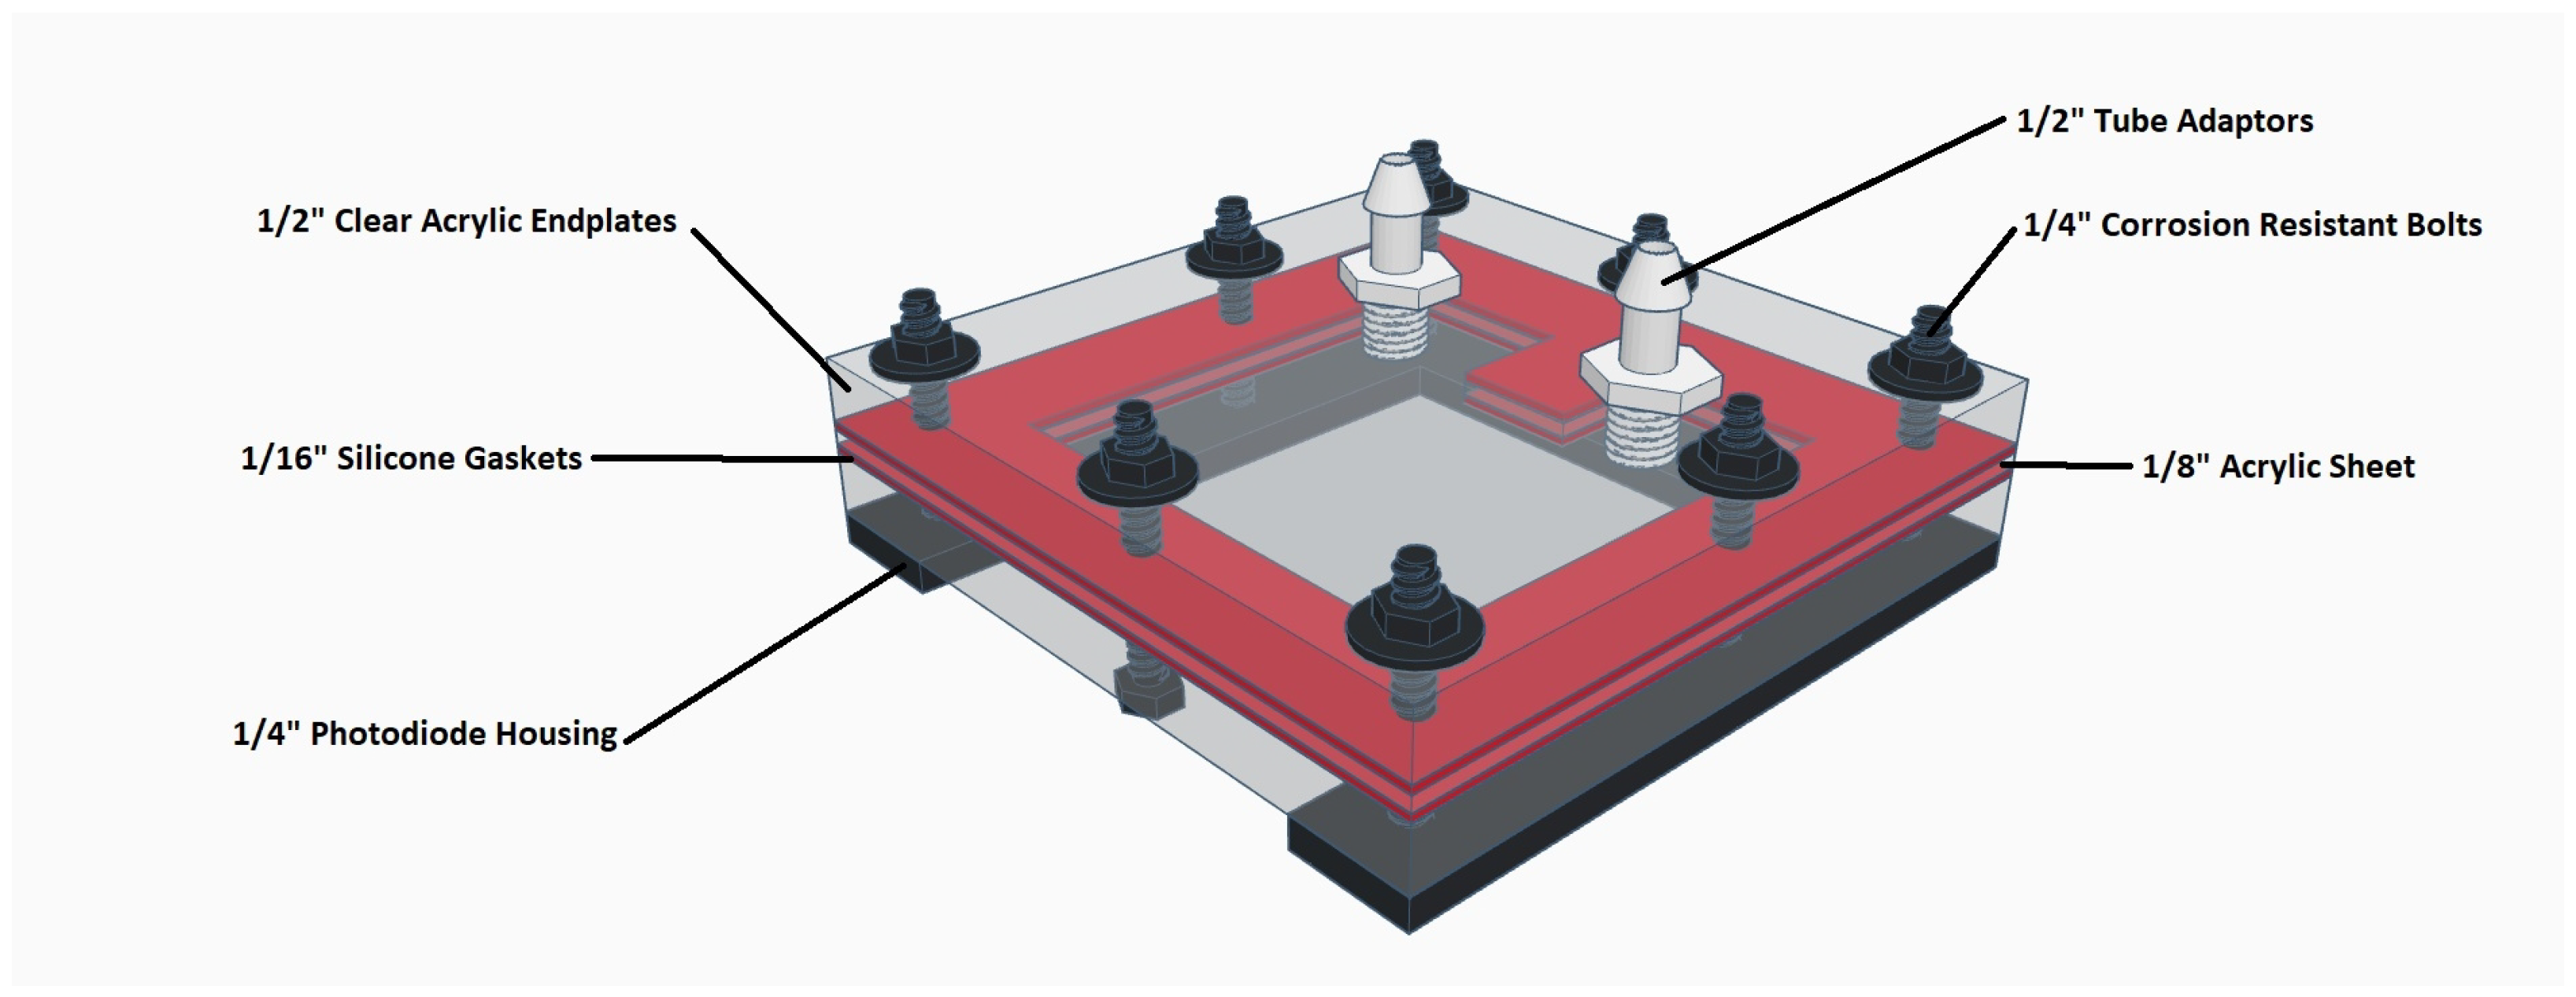
2.2. Absorbance-Based Monitoring System

A flow cell was created with 6 × 6 × 1 2 thick clear acrylic sheet endplates to allow for 92% (visible) light transmission through each sheet. Holes are machined into one endplate and 1 2 tube adapters are affixed using a clear-dry silicone gel (electrolyte inlet/outlet). An electrolyte flow path is created using silicone gasket(s) for thin flow cell configurations (ex 1 16 and 1 8 ), while a thin acrylic sheet sandwiched between two gaskets may be used to maintain mechanical strength for larger optical path configurations ( 1 4 configuration shown in Figure 2). A U-shaped flow pattern is used to reduce the likelihood of dead zones within the cell, with a 1 width around the edges of the flow cell used to maintain a watertight seal.
All testing of the absorbance-based system are performed using a 30 A max charge current with a 62 V/1–2 A cutoff. Discharging is performed through a 1.4 Ω load bank, resulting in maximum discharge currents of 40 A. The automatic rebalancing mechanism is used over the course of cycling in each case.

3. Discussion

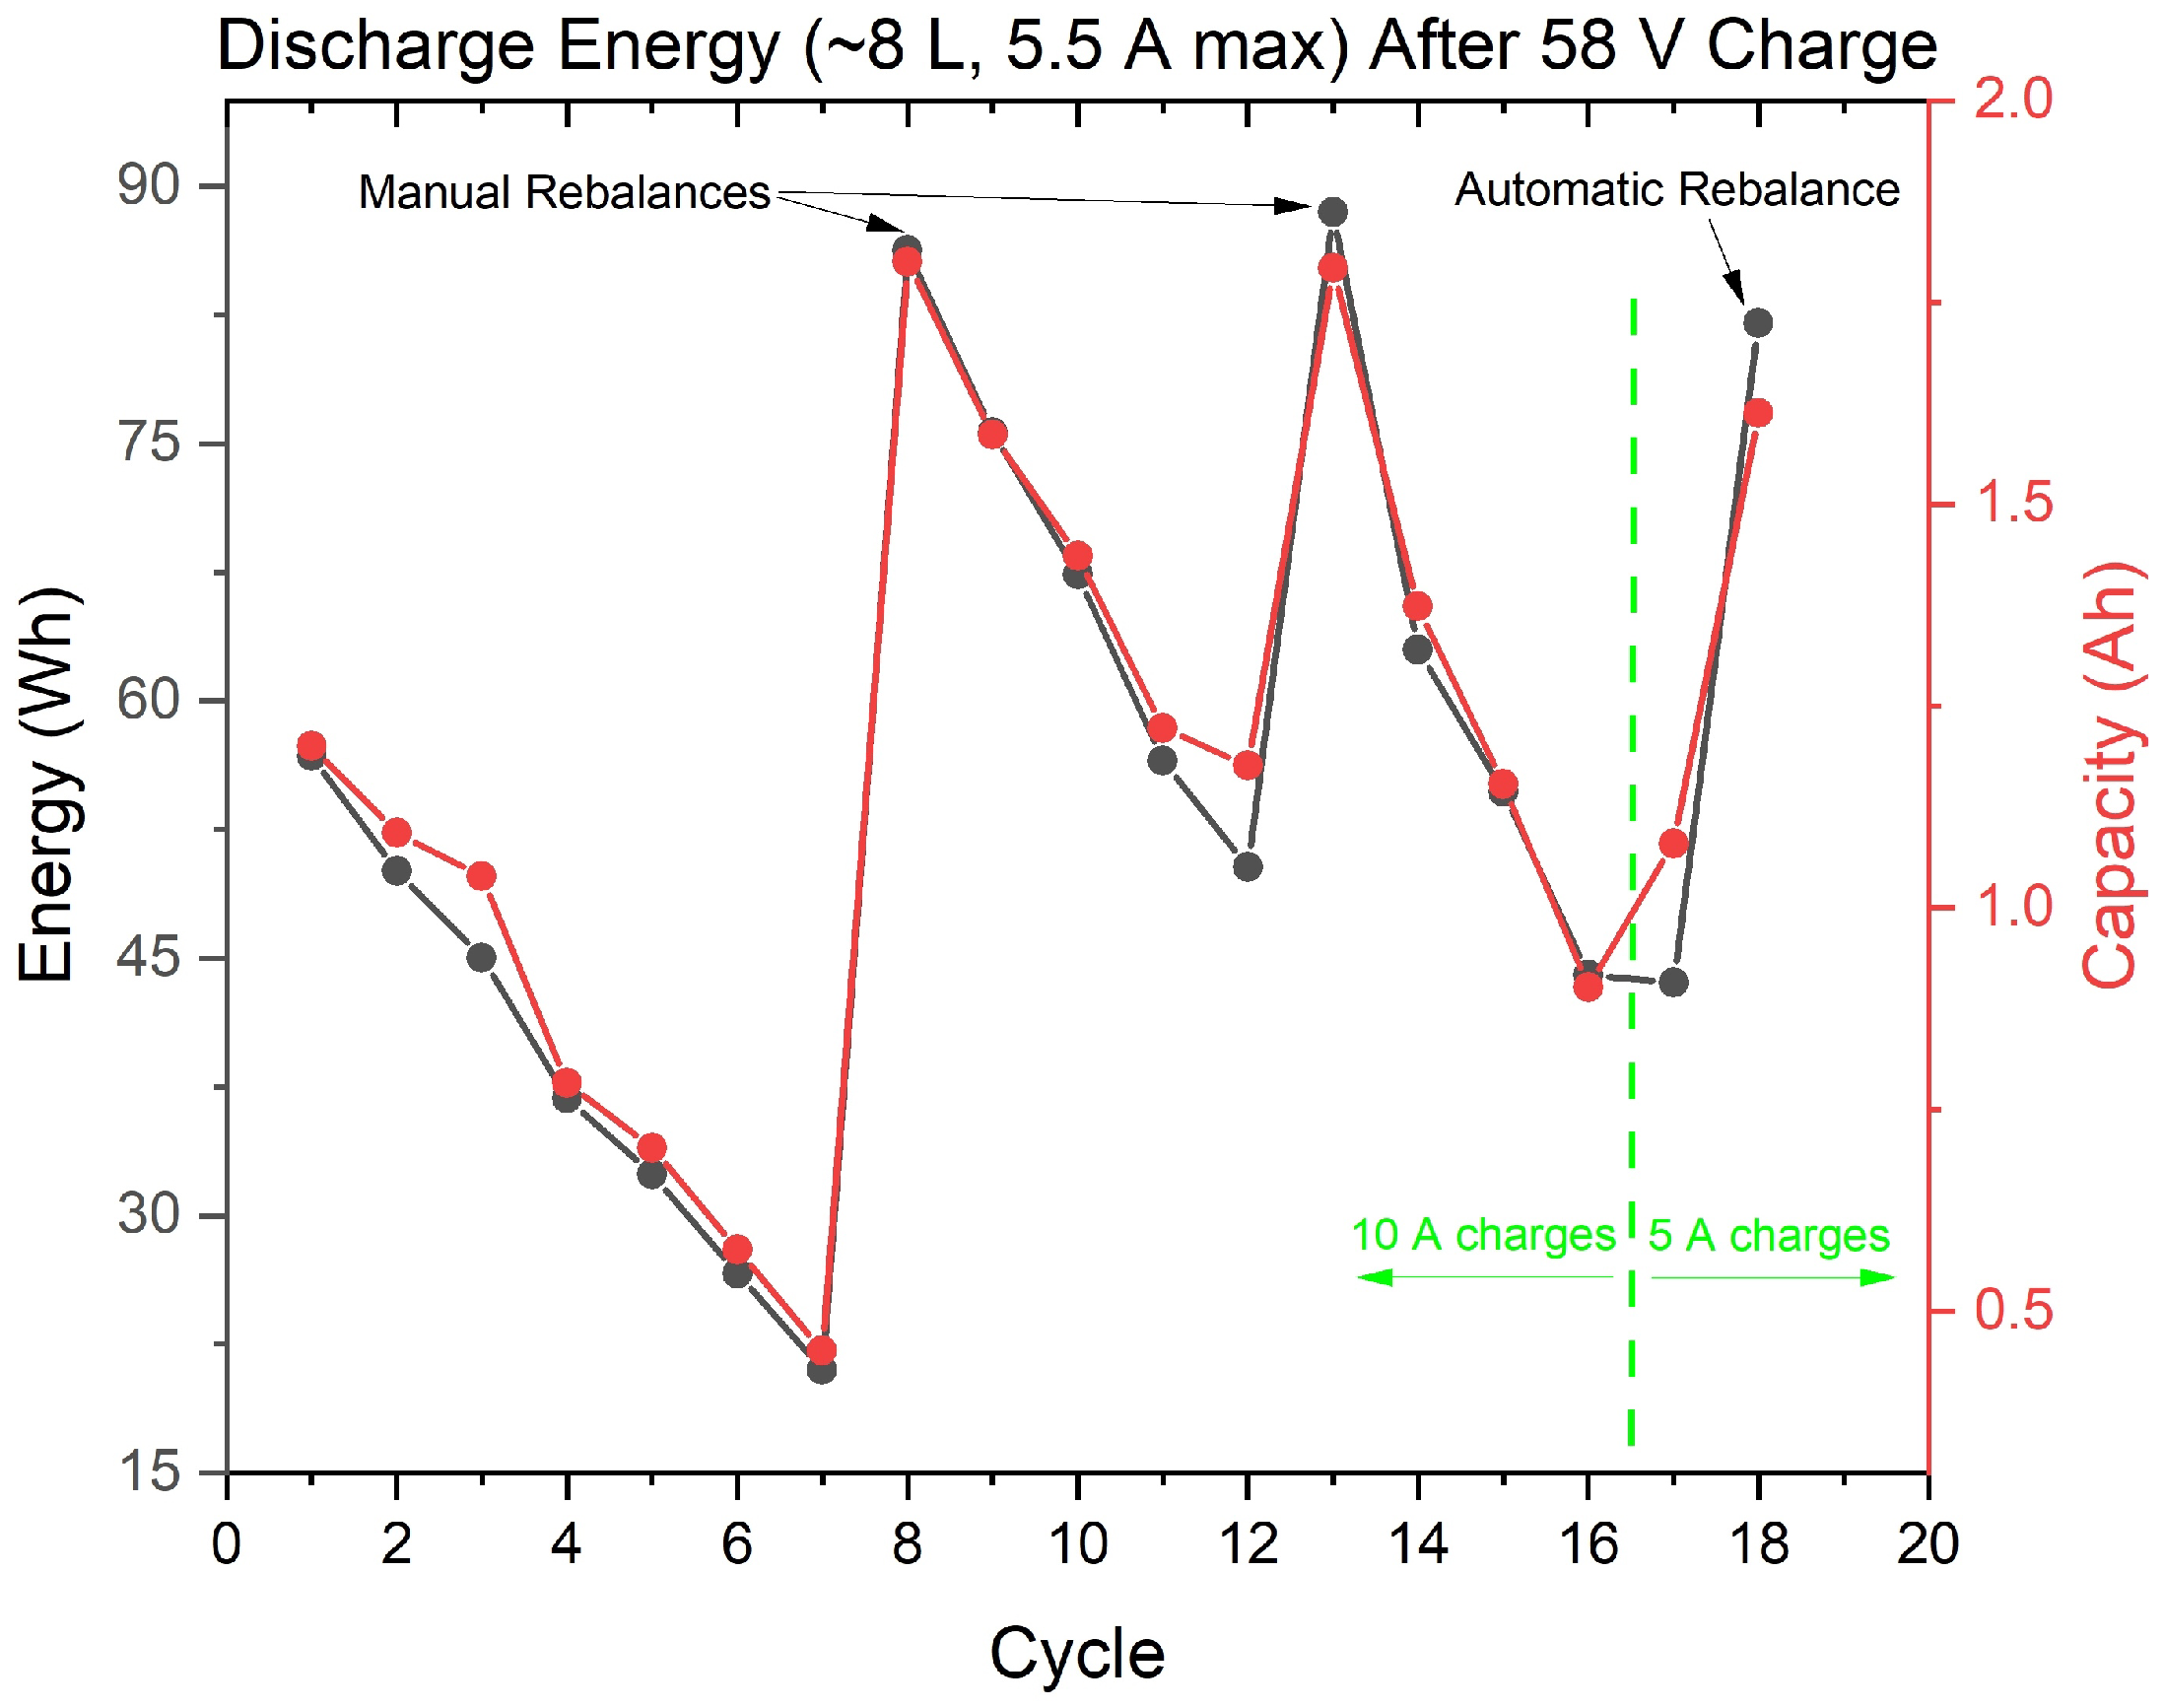
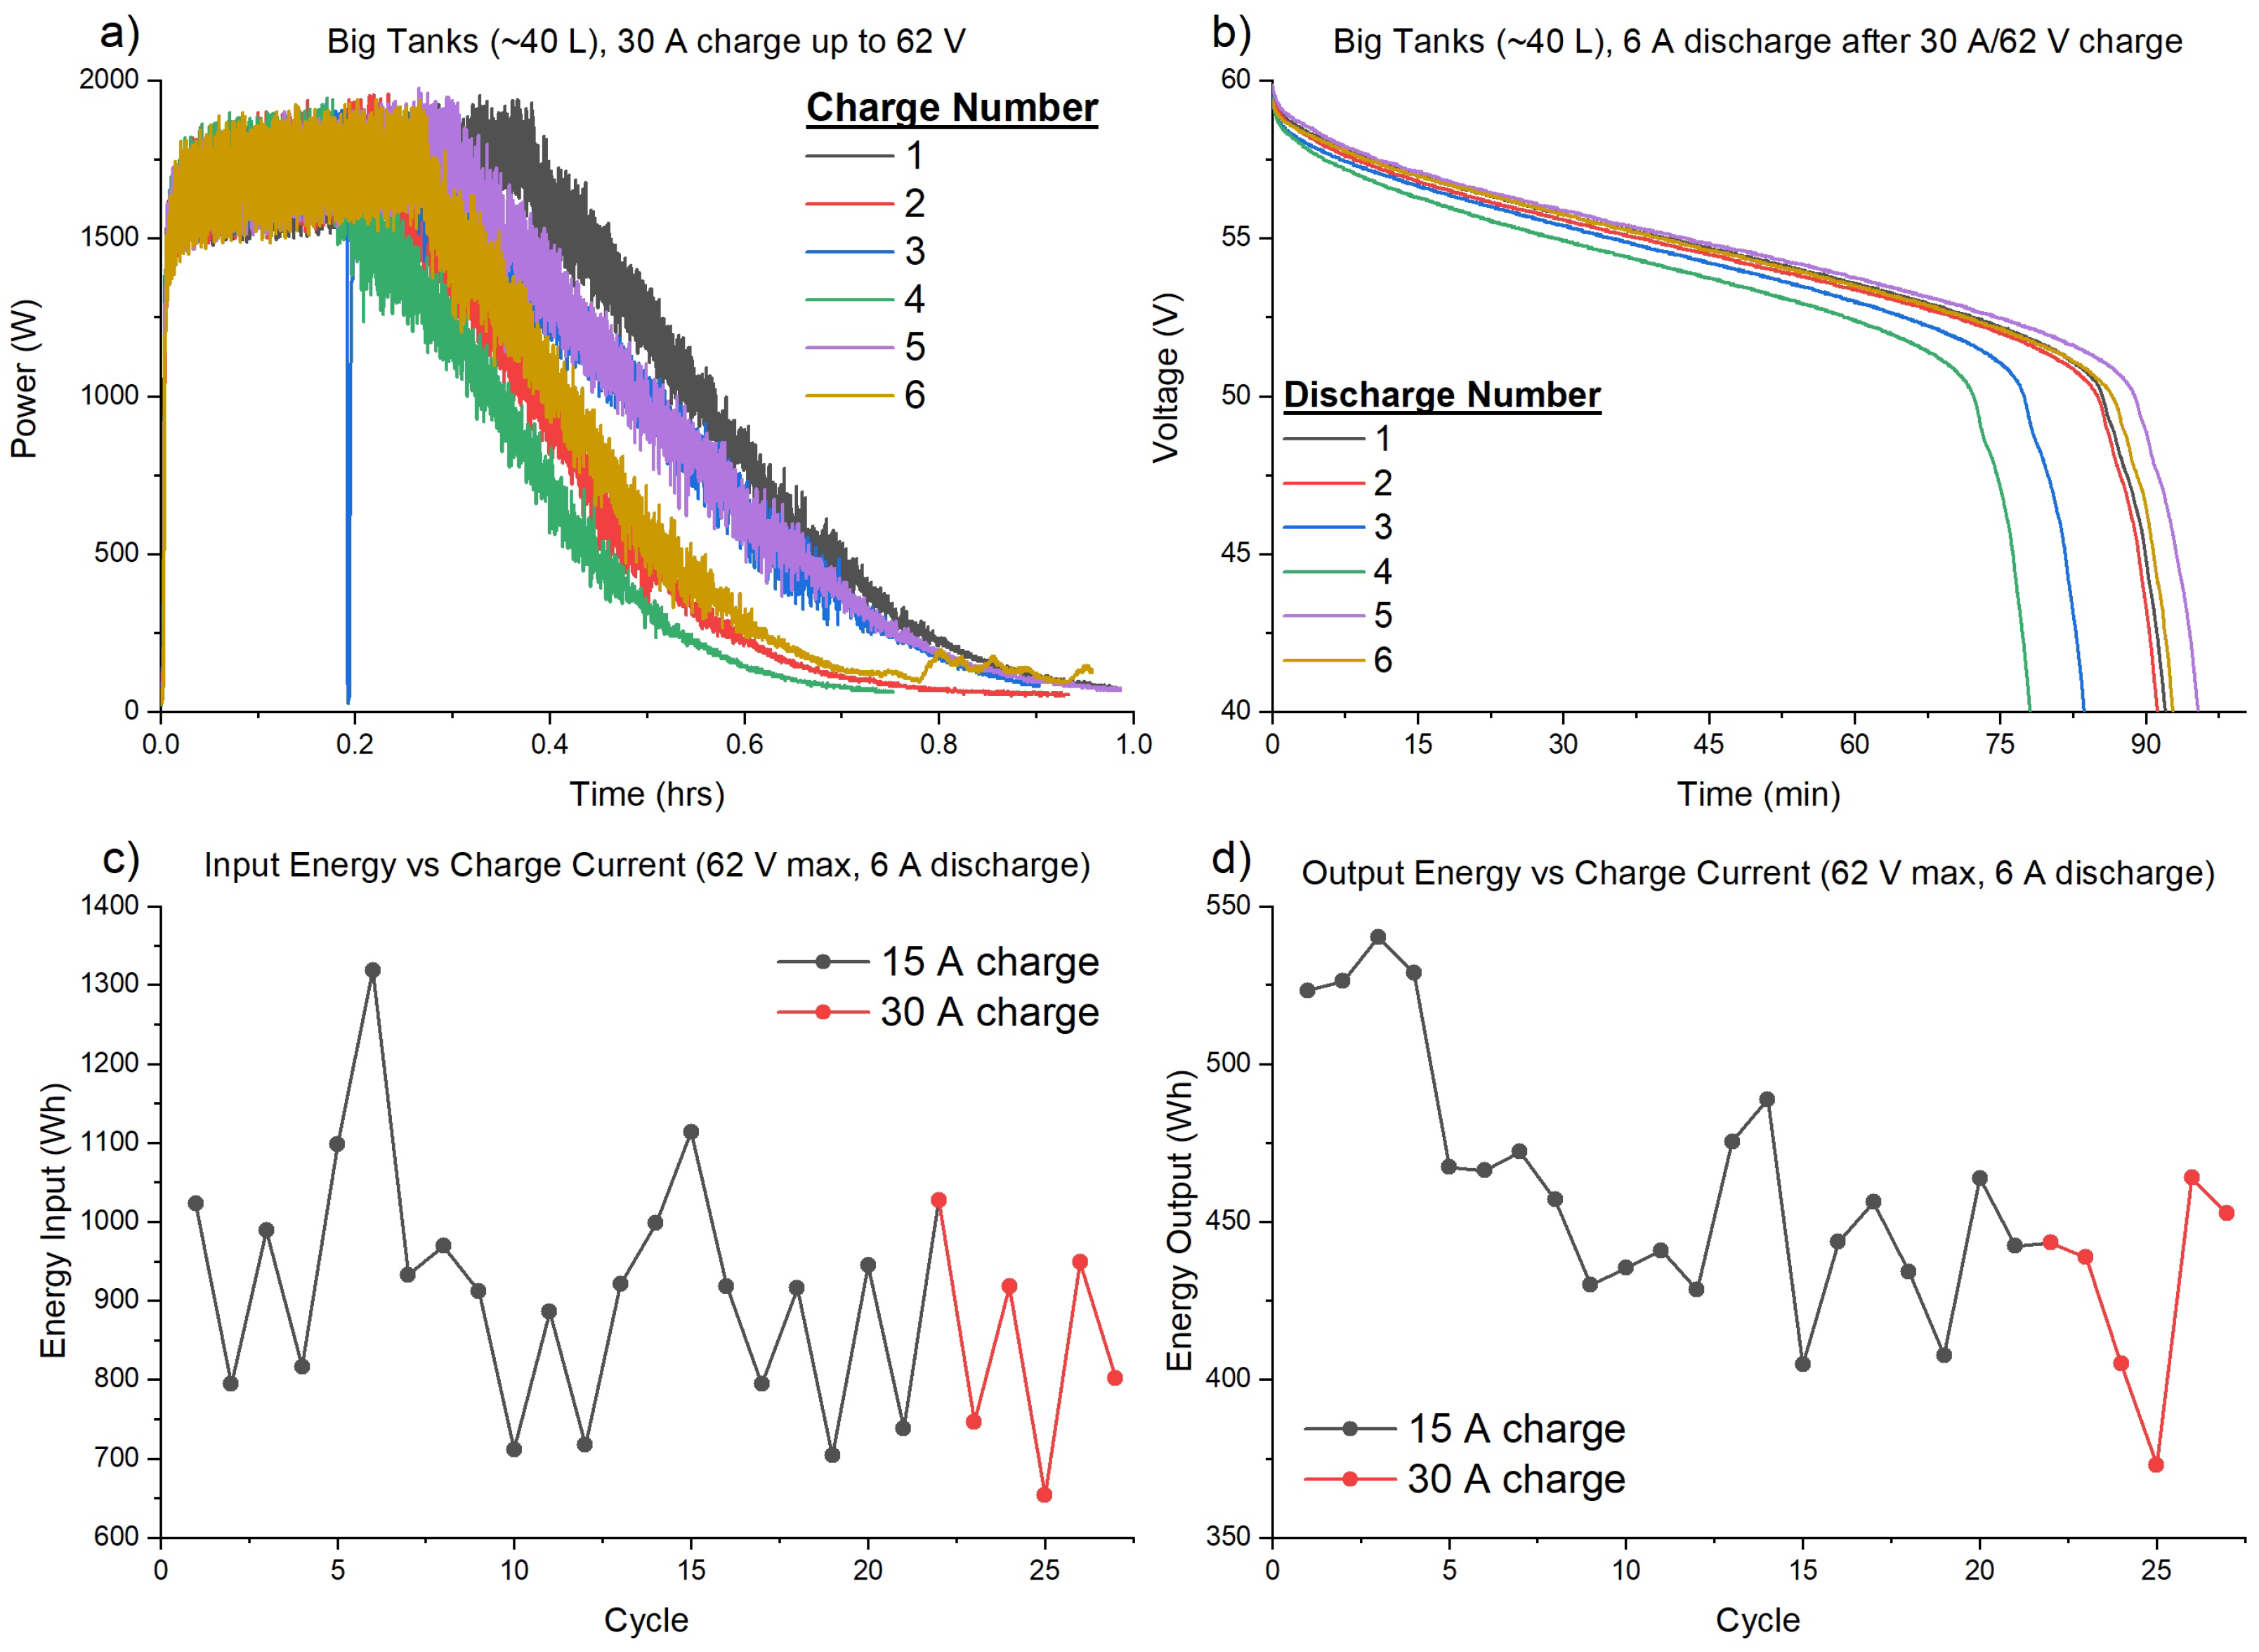
3.1. Capacity Loss Tracking and Mitigation

Capacity tracking was first conducted on a small volume of electrolyte (8 L) to assess the performance of the automatic rebalancing mechanism. Charging was performed with 5 A and 10 A charge currents until reaching a 58 V/1–2 A cutoff, while discharging was achieved through a 10 ohm resistor (6 A max). As seen in Figure 3, the automatic rebalancing mechanism was able to successfully recover an amount of capacity comparable to manual rebalancing of electrolyte volumes. However, a slight reduction in the recovered capacity is seen, primarily due to incomplete rebalancing of the oxidation states and the accumulation of asymmetrical losses since the last rebalance. Although the charge current was reduced to 5 A (hence decreasing the magnitude of overpotentials and increasing the efficiency), a slight reduction in efficiency is observed when the rebalancing mechanism is used. As the rebalancing tube was left open for the entire charge/discharge cycle, this is primarily due to self-discharge processes occurring across the self-discharge tube over the course of battery cycling.
As this method of symmetrical capacity loss regeneration was successful, it was used in future experiments containing 40 L of electrolyte. Charging was performed with 15 A and 30 A charge currents until reaching a 62 V/1–2 A cutoff, while discharging was once again performed through a 10 ohm resistor (6 A max). As observed in Figure 4, the charging current did not have a major impact on battery capacity. The primary effect came from the increased charge voltage cutoff (62 V vs. 58 V), which acted to increase the initial discharge voltage observed in Figure 4b).
The automatic rebalancing mechanism is able to significantly reduce the rate of capacity decay (0.3%/cycle is observed in Figure 4d), while 10%/cycle was observed in Figure 3). This method was not able to fully mitigate capacity decay due to the asymmetric nature of some loss mechanisms. However, it provides a simple way to extend the life of the electrolyte with little/no operator input.

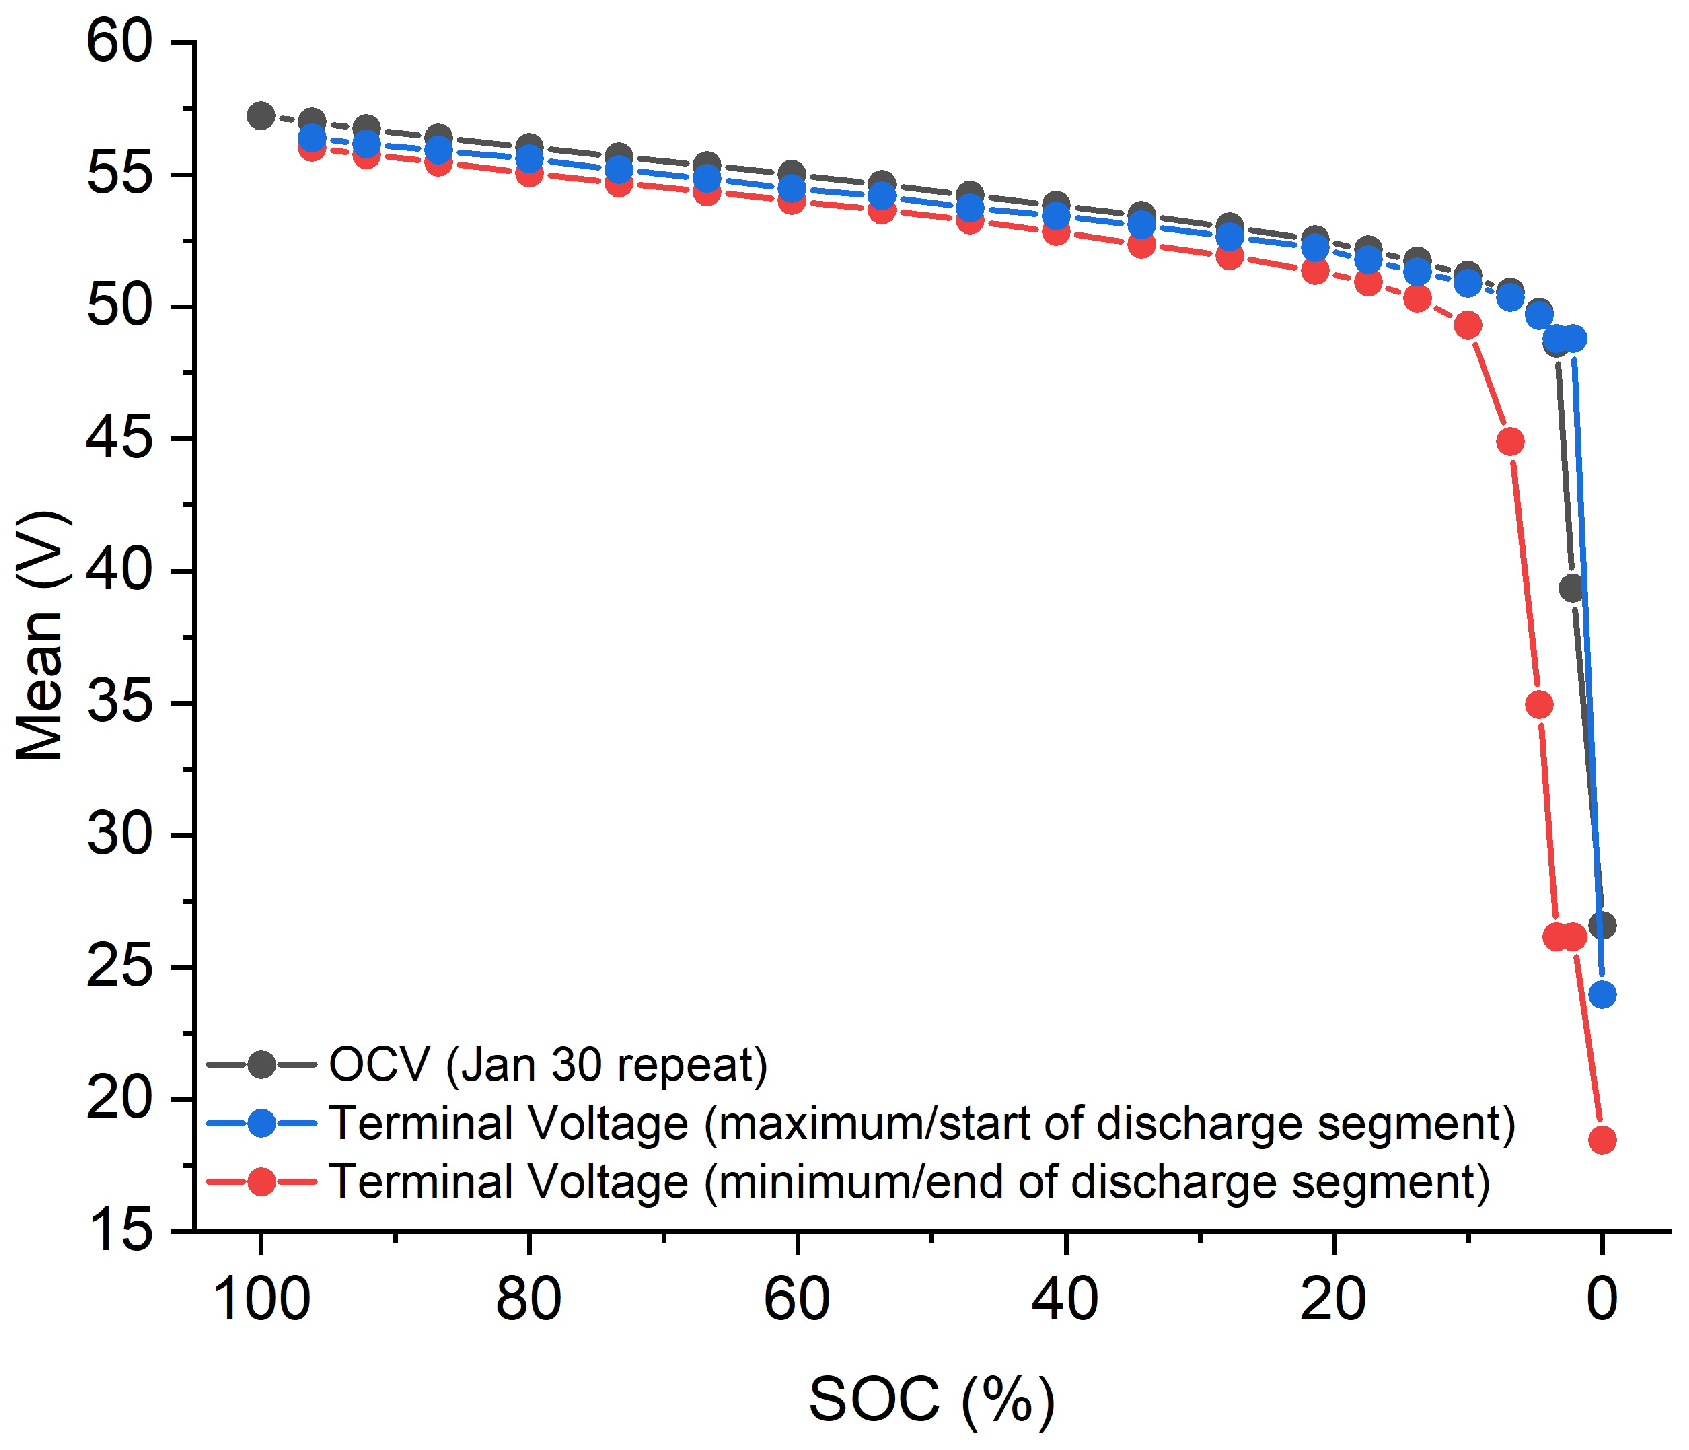
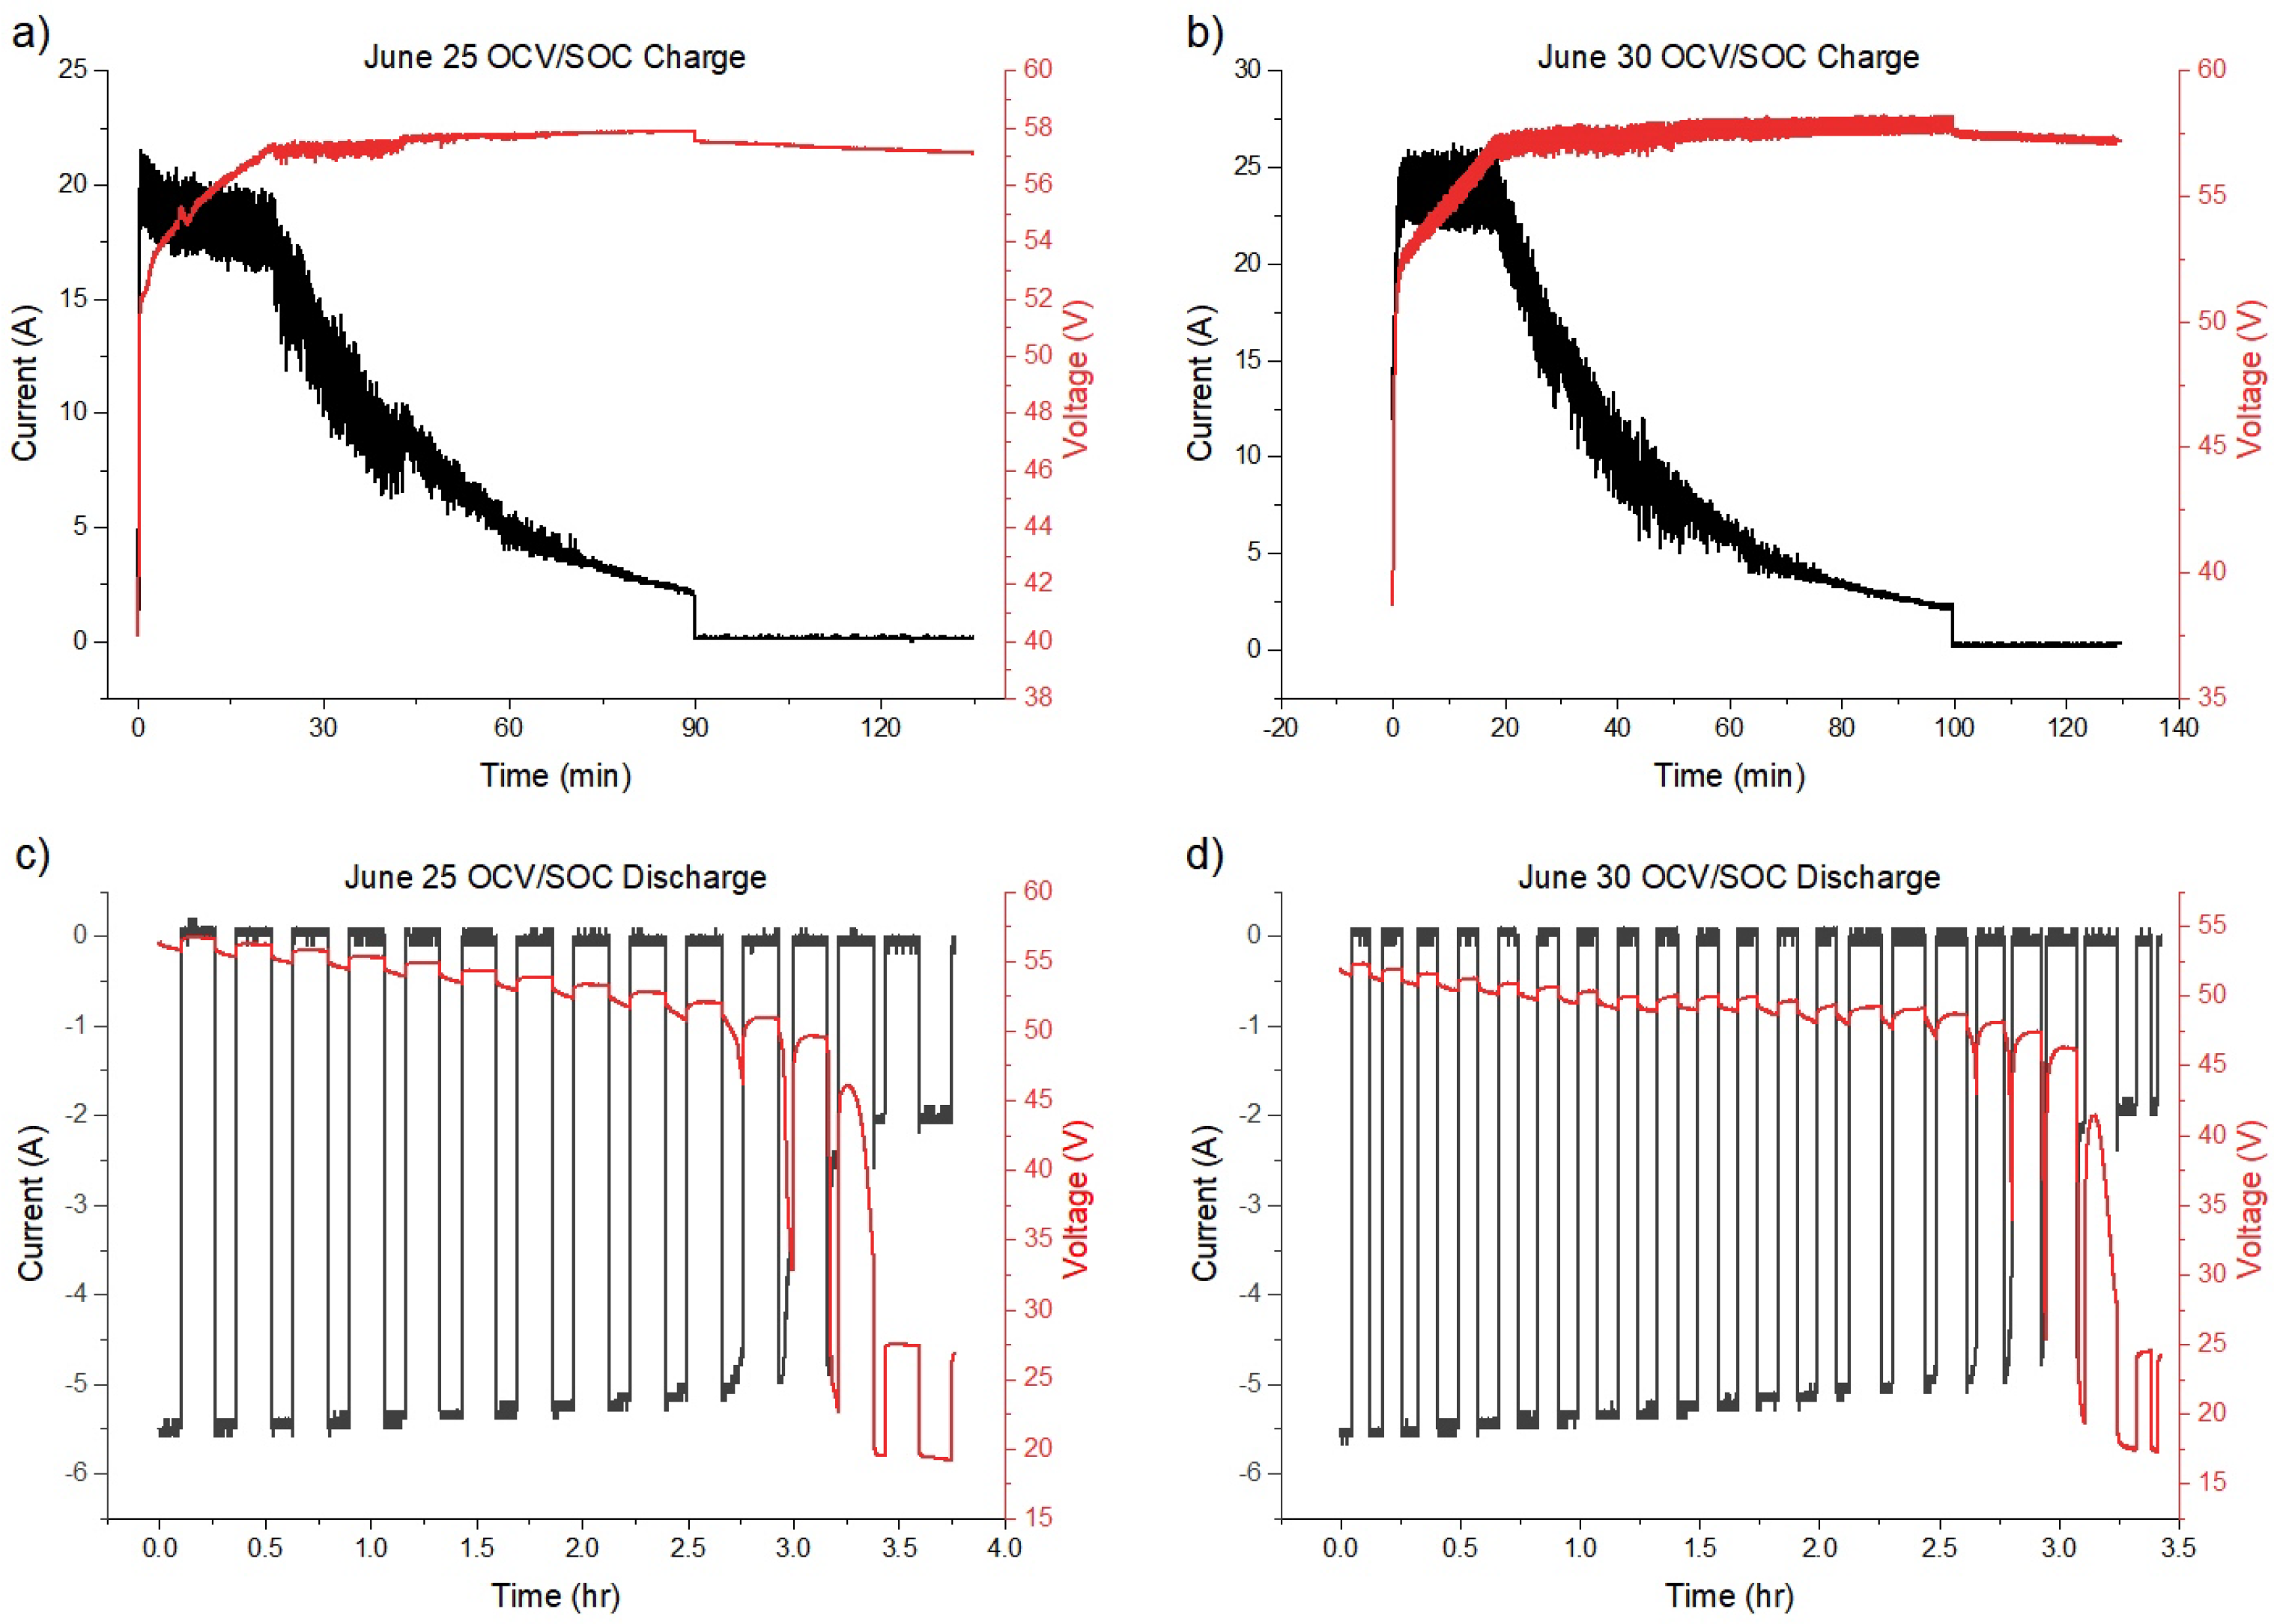
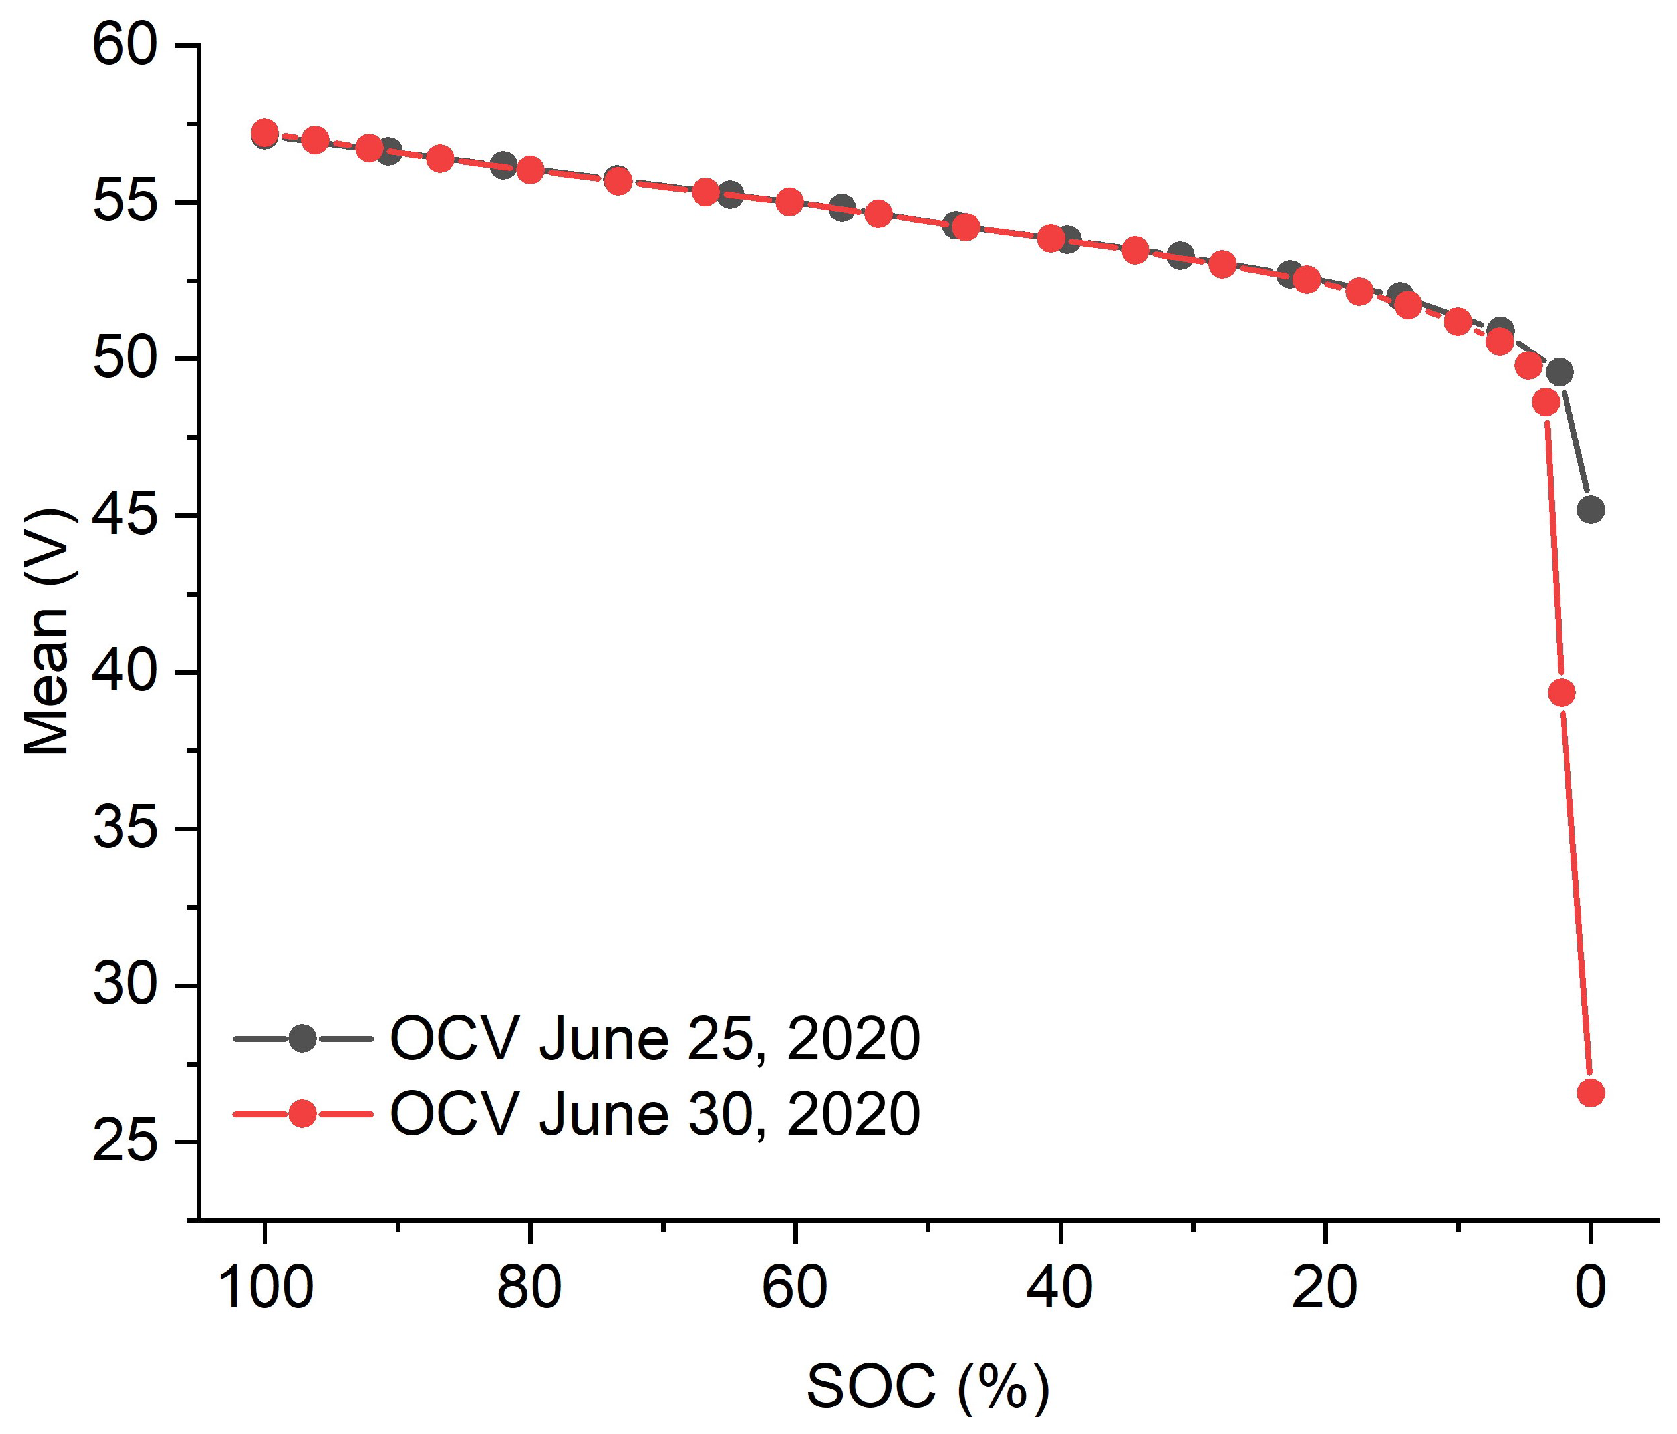
3.2. SOC Tracking via OCV

The VRFB is first charged at 20 A (62 V/1–2 A cutoff) before being discharged in 5 min segments followed by a 5 min relaxation window to allow for the voltage stabilization and for the OCV to be obtained (30 s average after voltage has stabilized). In order to obtain more precision in the top/bottom SOC ranges, the discharging and relaxation times were decreased to 2 min, while the maximum charging current was increased to 25 A. This experimental process may be seen schematically in Appendix B. The coulomb counting method is used to calculate SOC values (via integration of the stack’s current/time data during the discharge segments) and correlate them with the obtained OCV values. The results are shown in Figure 5.
These experiments also allow us to observe the relationship between terminal and open circuit voltages. The previously obtained OCV values are compared to the terminal voltages observed during discharge in Figure 6. The current applied during the discharge process gives rise to overpotentials, causing the OCV to be approximately 0.88 V higher than the terminal voltage.
These results provide a mechanism to estimate the SOC of the VRFB based on the OCV at rest or via the terminal voltage during discharge. However, estimation via terminal voltages will only be valid when the same 5 A discharging current profile is used. Furthermore, although the experiment modifications allowed more precision to be obtained in the 0–20% and 80–100% SOC regimes, large OCV fluctuations are observed in the low SOC ranges. As such, the estimation of SOC may only be valid above 20% SOC. In order to utilize this method for more accurate, continuous monitoring across the entire SOC range, a separate cell operating at zero current should be used for OCV monitoring.
Further inaccuracies in SOC estimation via voltage are introduced when the equality (Equation (4)) no longer holds true, as is the case when asymmetrical losses occur. To detect these imbalances, independent monitoring of the anolyte/catholyte must be performed to determine individual half-cell SOCs (probe both sides of Equation (4)). To achieve this, the following section investigates the integration of the absorbance-based monitoring system (composed of flow cell, photodiode, light source) into the existing VRFB system for the purpose of detecting and accounting for asymmetrical losses.

3.3. SOC Tracking via Absorbance

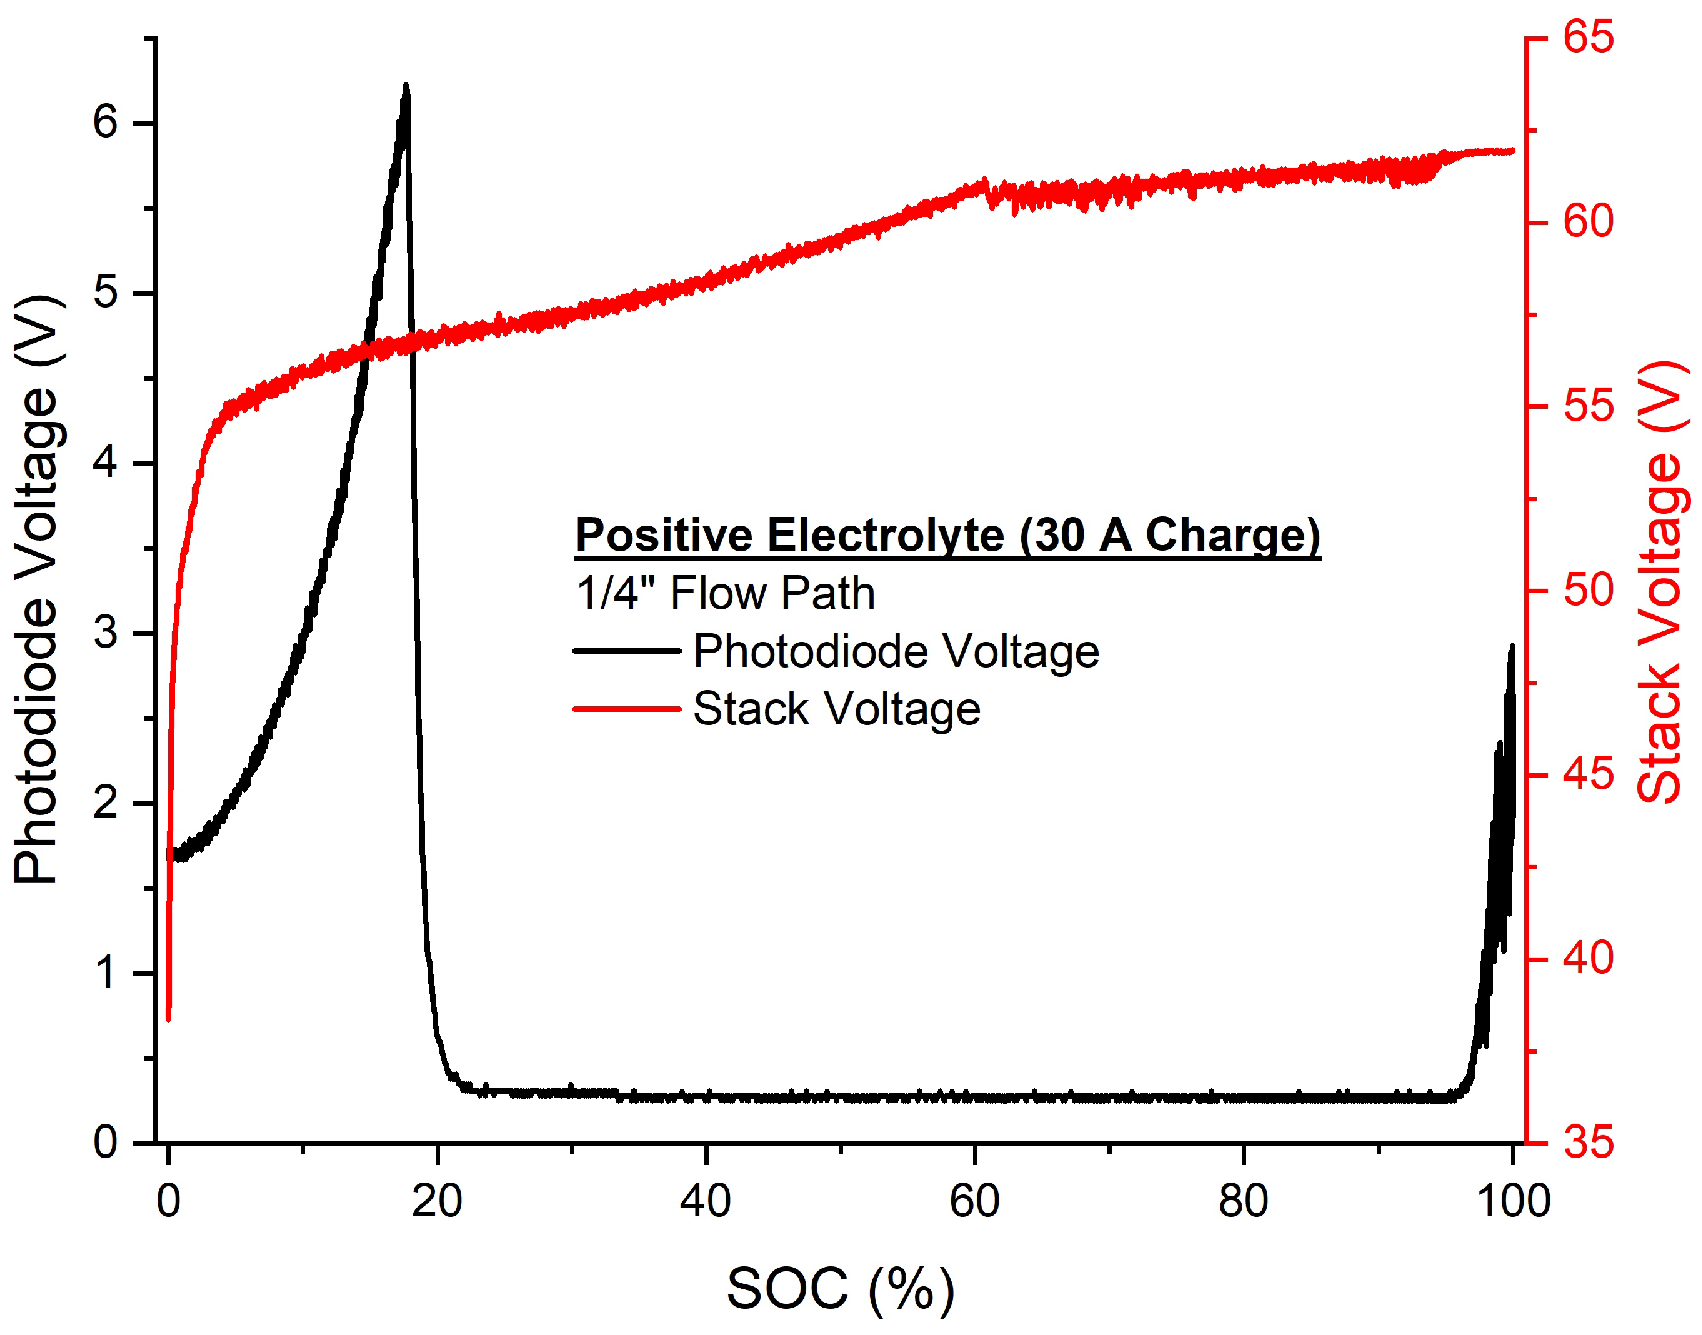
3.3.1. Positive Electrolyte

The positive electrolyte undergoes a transition from light blue to yellow upon charging. As such, the electrolyte displays low absorbance at high/low SOCs. However, high absorbance in excess of Beer’s law is typically seen at mid-SOCs, possibly due to V 4 + / V 5 + complexing leading to the creation of a highly adsorbent V 4.5 + species [5,14,16,18,19]. When plotted as a function of SOC, this `excess’ absorbance typically displays a parabolic relationship [5,14,18]. In the present study, this manifested as zero-light transmission across most of the SOC range. For example, with a 1 4 flow cell configuration, zero light transmission is observed in the 20–90% SOC range (Figure 7). Because of this, an accurate relationship between photodiode voltage and SOC cannot be formed over the entire SOC range.
Improvements were not observed when reducing the optical path to 1 8 or 1 16 , with zero light transmission at moderate SOCs being observed at all tested configurations. Further optical path reductions below 1 16 (ex 1 25 ) are not possible in the current system due to the choice of pumps, and it was hence concluded that optical monitoring of the positive electrolyte is not feasible within the constraints of the current VRFB system design. Further reductions in the flow cell thickness may be achieved via (a) the use of a more powerful pump, (b) the addition of a secondary pump system, or (c) modification of the flow cell design to reduce hydraulic losses. Alternatively, a stronger light source could be used, or beam culmination may be applied to reduce beam divergence.
An alternative method has been proposed by Liu et al. [16] and Zhang et al. [19] to overcome the high absorbance, which uses the entire shape of the transmission spectrum instead of the absorbance of a single wavelength (or the bulk absorbance of a white light source). However, this method has extensive calibration requirements, as a database of transmission spectra must be developed prior to measurement during the charge/discharge process. Furthermore, this requires the use of a spectrometer, the cost of which may be prohibitive for many non-scientific applications. Although the low transmittance make real-time SOC tracking and determining the extent of imbalances a challenge, results from other studies have shown that the positive electrolyte displays high transmittance of 560 nm light in the 98%–100% SOC range [17]. As the positive side reactions only occur during the high voltage charge process, a test may be developed to rapidly assess the rate of positive side reactions, and the optimal battery parameters may be ascertained to extend electrolyte health.

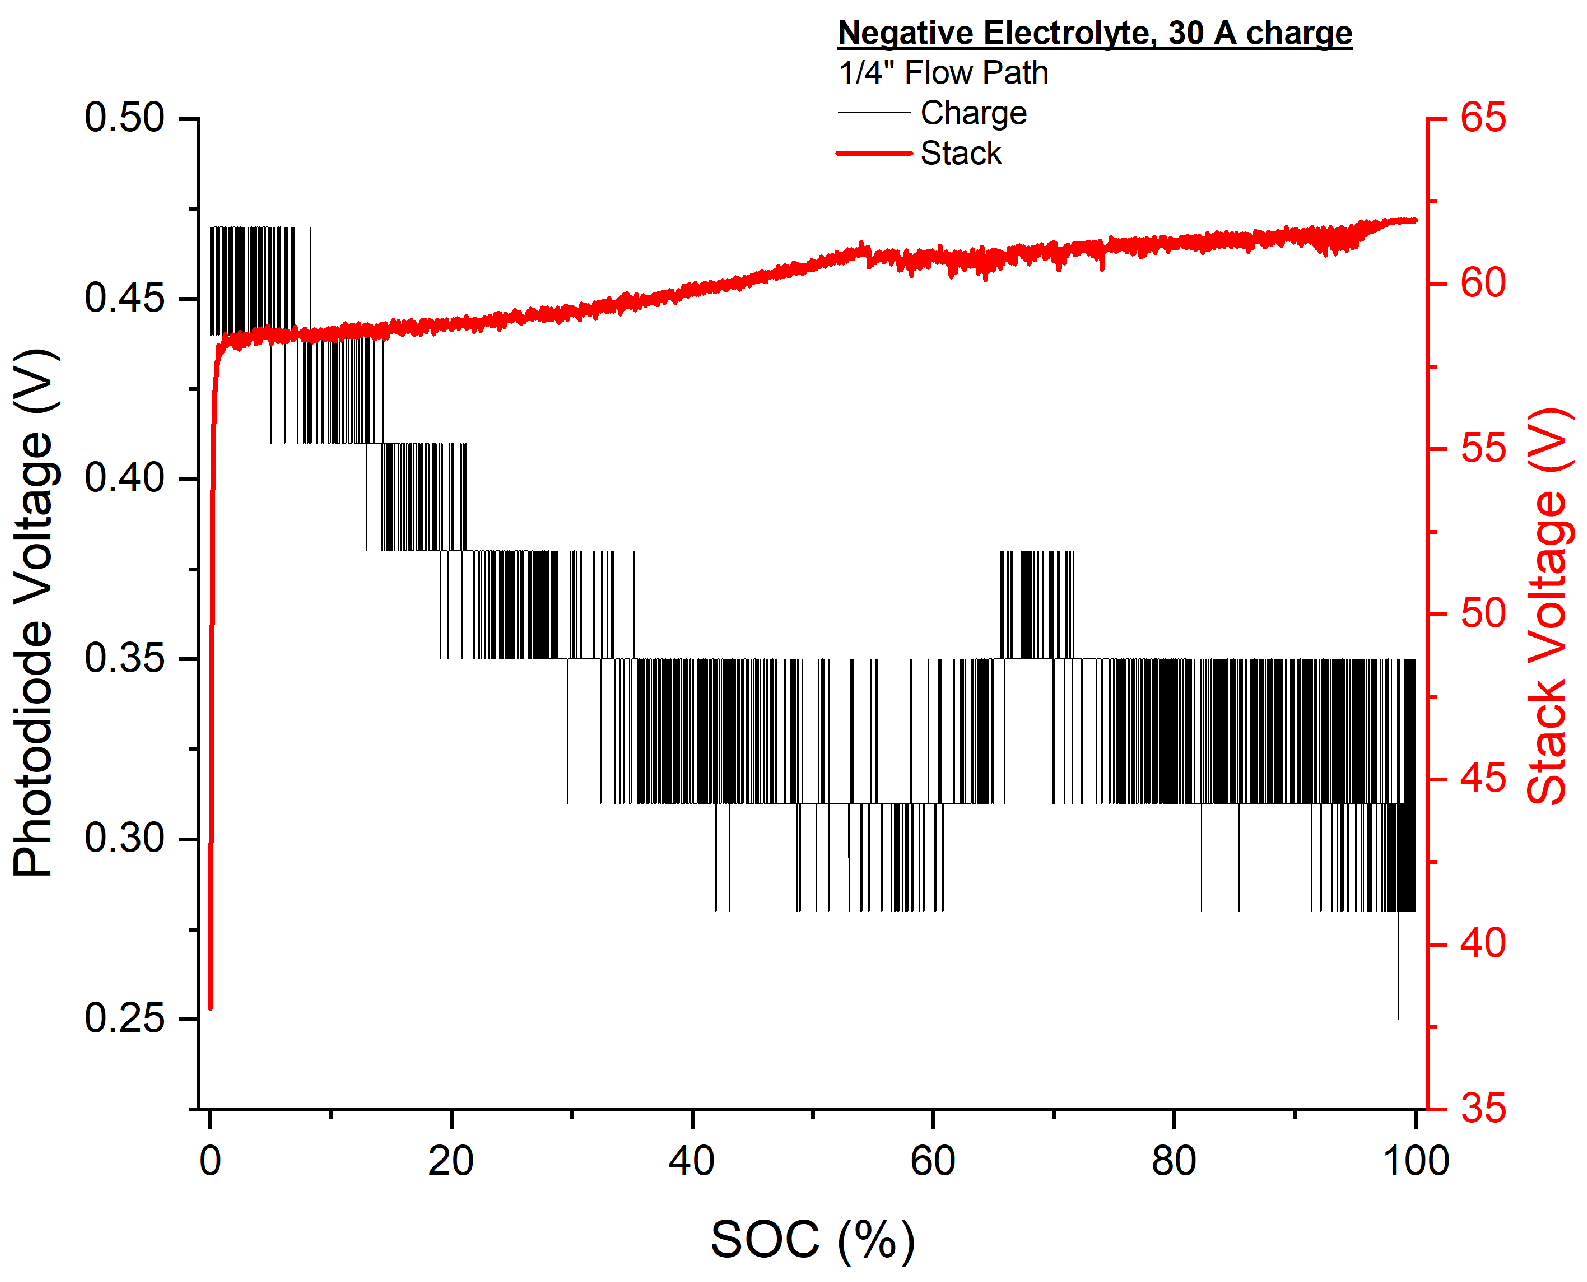
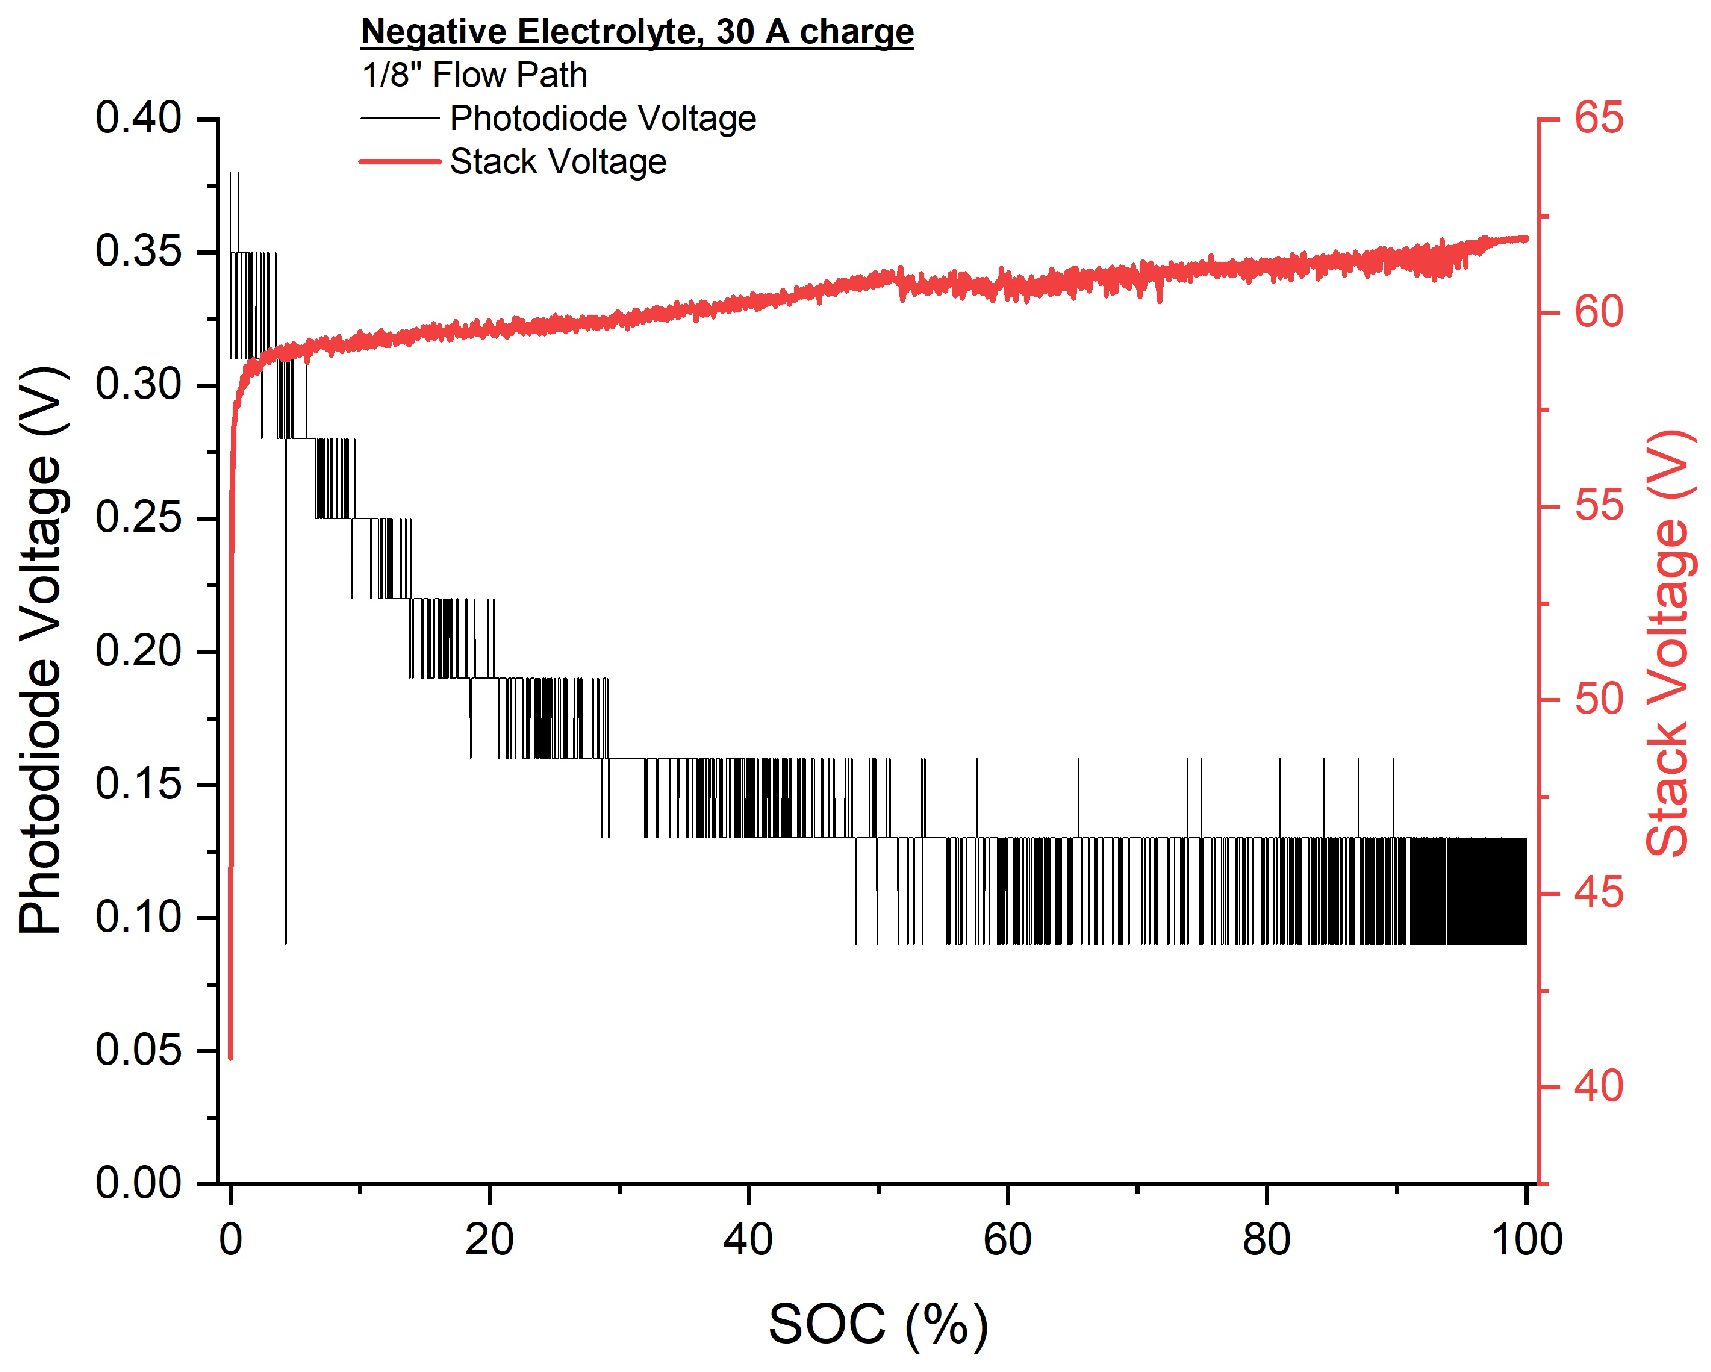
3.3.2. Negative Electrolyte

The negative electrolyte undergoes a transition from green to violet upon charging. As such, the absorbance of the negative electrolyte is expected to increase as a function of SOC. Previous studies have found that the absorbance scales linearly with SOC in the 5% to 100% SOC range if a single wavelength is used (410 nm, 433 nm, 600 nm, or 750 nm) [4,5,14,18,19]. However, a more complex, non-linear relationship is observed when a white light source (300–850 nm) is used, especially near 100% SOC [4]. However, as with the positive electrolyte, the high absorbance of the electrolyte places practical limits on the feasibility of this technique. As seen in Figure 8, the absorbance displays a relatively linear trend in the 0% to 40% SOC range with a 1 4 optical path, after which the electrolyte becomes too dark for proper light transmission onto the photodiode circuit.
Reduction of the optical path to 1 8 results in lower absorbance, leading to the increased sensitivity and data coverage observed in Figure 9. Because of this increased sensitivity, slight deviations from a linear trend are observed below 50% SOC, as predicted by [4]. Similar to the 1 4 optical path results, the high absorbance of the electrolyte results in zero light transmission between 50% and 100% SOC. As a high discharge current is used, data are only obtained for the charge process, with poor sensitivity and absorbance results obtained during the discharge process.
Further reduction in the optical path to 1 16 results in low levels of light transmission across almost the entire SOC range. However, these results suffered from extremely poor sensitivity, especially at moderate SOCs. This is potentially due to misalignment of the light source, which may be improved by replacing the 1 deep spill tray with a black housing, as shown in Figure 2. It can be noted that at high SOCs, the absorbance decreases slightly, as previously observed by [4]. As stated previously, further optical path reductions below 1 16 were not possible within the current system. However, the negative electrolyte’s lower absorbance and linear relationship makes it a more suitable contender for optical monitoring. A 1 16 optical path may be used to tandem with a stronger light source and photodiode amplification to increase data coverage across the entire SOC range and increase data precision.

4. Conclusions

An automatic electrolyte rebalancing mechanism was created, which successfully displayed the ability to recover capacity losses arising from symmetrical mechanisms, and to significantly reduce the rate of capacity decay over repeated cycling. A relationship between SOC and OCV was determined to allow for intermittent SOC estimation (or continually from terminal voltages during a 10 Ω discharge). An absorbance-based SOC monitoring system was integrated into the existing VRFB system and its ability to perform real-time, independent SOC monitoring of the anolyte and catholyte half-cells was investigated. Due to the high absorbance of the electrolyte, this method was found to be unsuitable within the constraints of the current system design. Successful optical monitoring of the positive electrolyte would require a stronger light source or secondary pump system to allow for thinner optical paths, while a stronger light source and photodiode amplification may be used for the negative electrolyte [6,17,18,19].

Author Contributions

Conceptualization, P.M. and K.S.; methodology, K.S.; validation, K.S.; formal analysis, K.S.; resources, P.M.; writing—original draft preparation, K.S.; writing—review and editing, P.M.; visualization, K.S.; supervision, P.M.; funding acquisition, P.M. All authors have read and agreed to the published version of the manuscript.

Funding

This work has been supported in part by the Future Energy System (FES) research program at the University of Alberta, and by Alberta Innovates under the Bitumen Beyond Combustion program.

Conflicts of Interest

The authors declare no conflict of interest.

Abbreviations

The following abbreviations are used in this manuscript:
OCVOpen circuit voltage
SOCState of Charge
VRFBVanadium Redox Flow Battery

Appendix A

The locations of the main VRFB instrumentation are found in Figure A1. The electrolyte is stored in 83 L capacity tanks, which are purged with nitrogen via a common line. In the case of initial tests on 8 L of electrolyte (Section 3.1), smaller 5.5 L cylinders are used for electrolyte storage, and the piping is modified to bypass the large tanks. The electrolyte tanks are hydraulically shunted using a 1 4 tube, and on/off valves are used to initiate/stop electrolyte rebalancing. The electrolyte is pumped through flowmeters via 1 2 tubing prior to entering the stack. Pressure gauges are used to monitor the pressure drop through the cell and ensure it remains within stack parameters (less than 1 bar).
Figure A1. Piping and instrumentation diagram of the VRFB system showing the locations of pressure gauges (PG), isolation valves (IV), and flowmeters (FM) [22].
Cleantechnol 04 00037 g0a1

Appendix B

The test procedure for the OCV-SOC test can be found in Figure A2. The charge process (Figure A2a,b) proceeds uninterrupted until completion (58 V/1–2 A cutoff). Discharge is performed through a 10 Ω load bank in 5 min segments followed by a 5 min relaxation period (Figure A2c). OCV values are recorded as an average of the last 30 s of the relaxation period. Relatively fast voltage stabilization allowed for the shortening of the discharge/relaxation periods to 2 min, increasing the number of acquirable data points (Figure A2d).
Figure A2. OCV-SOC test performed with 40 L of electrolyte and an automatic rebalancing tube. Charge current/voltage using (a) 20 A and (b) 25 A max charge currents. Discharge current/voltage after using a (c) 20 A and (d) 25 A max charge current [22].
Cleantechnol 04 00037 g0a2

References

  1. Schavan, A. Germany’s Energy Research Plan. Science 2010, 330, 295. [Google Scholar] [CrossRef] [PubMed] [Green Version]
  2. Anvari, M.; Lohmann, G.; Wächter, M.; Milan, P.; Lorenz, E.; Heinemann, D.; Tabar, M.R.R.; Peinke, J. Short term fluctuations of wind and solar power systems. New J. Phys. 2016, 18, 063027. [Google Scholar] [CrossRef]
  3. Álvaro Cunha; Martins, J.; Rodrigues, N.; Brito, F.P. Vanadium redox flow batteries: A technology review. Int. J. Energy Res. 2015, 39, 889–918. [Google Scholar] [CrossRef]
  4. Skyllas-Kazacos, M.; Kazacos, M. State of charge monitoring methods for vanadium redox flow battery control. J. Power Sources 2011, 196, 8822–8827. [Google Scholar] [CrossRef]
  5. Tang, Z.; Aaron, D.; Papandrew, A.; Zawodzinski, T. Monitoring the state of charge of operating vanadium redox flow batteries. Ecs Trans. 2012, 41, 1. [Google Scholar] [CrossRef]
  6. Haisch, T.; Ji, H.; Holtz, L.; Struckmann, T.; Weidlich, C. Half-Cell State of Charge Monitoring for Determination of Crossover in VRFB—Considerations and Results Concerning Crossover Direction and Amount. Membranes 2021, 11, 232. [Google Scholar] [CrossRef] [PubMed]
  7. Struckmann, T.; Kuhn, P.; Ressel, S. A combined in situ monitoring approach for half cell state of charge and state of health of vanadium redox flow batteries. Electrochim. Acta 2020, 362, 137174. [Google Scholar] [CrossRef]
  8. Haisch, T.; Ji, H.; Weidlich, C. Monitoring the state of charge of all-vanadium redox flow batteries to identify crossover of electrolyte. Electrochim. Acta 2020, 336, 135573. [Google Scholar] [CrossRef]
  9. Ressel, S.; Bill, F.; Holtz, L.; Janshen, N.; Chica, A.; Flower, T.; Weidlich, C.; Struckmann, T. State of charge monitoring of vanadium redox flow batteries using half cell potentials and electrolyte density. J. Power Sources 2018, 378, 776–783. [Google Scholar] [CrossRef]
  10. Jirabovornwisut, T.; Arpornwichanop, A. A review on the electrolyte imbalance in vanadium redox flow batteries. Int. J. Hydrogen Energy 2019, 44, 24485–24509. [Google Scholar] [CrossRef]
  11. Bhattarai, A.; Ghimire, P.C.; Whitehead, A.; Schweiss, R.; Scherer, G.G.; Wai, N.; Hng, H.H. Novel Approaches for Solving the Capacity Fade Problem during Operation of a Vanadium Redox Flow Battery. Batteries 2018, 4, 48. [Google Scholar] [CrossRef] [Green Version]
  12. Stolze, C.; Hager, M.; Schubert, U. State-of-charge monitoring for redox flow batteries: A symmetric open-circuit cell approach. J. Power Sources 2019, 423, 60–67. [Google Scholar] [CrossRef]
  13. Ngamsai, K.; Arpornwichanop, A. Measuring the state of charge of the electrolyte solution in a vanadium redox flow battery using a four-pole cell device. J. Power Sources 2015, 298, 150–157. [Google Scholar] [CrossRef]
  14. Shin, K.; Jin, C.; So, J.; Park, S.; Kim, D.; Yeon, S. Real-time monitoring of the state of charge (SOC) in vanadium redox-flow batteries using UV–Vis spectroscopy in operando mode. J. Energy Storage 2020, 27, 101066. [Google Scholar] [CrossRef]
  15. Roznyatovskaya, N.; Noack, J.; Mild, H.; Fühl, M.; Fischer, P.; Pinkwart, K.; Tübke, J.; Skyllas-Kazacos, M. Vanadium Electrolyte for All-Vanadium Redox-Flow Batteries: The Effect of the Counter Ion. Batteries 2019, 5, 13. [Google Scholar] [CrossRef] [Green Version]
  16. Liu, L.; Xi, J.; Wu, Z.; Zhang, W.; Zhou, H.; Li, W.; Qiu, X. State of charge monitoring for vanadium redox flow batteries by the transmission spectra of V(IV)/V(V) electrolytes. J. Appl. Electrochem. 2012, 42, 1025–1031. [Google Scholar] [CrossRef]
  17. Liu, L.; Li, Z.; Xi, J.; Zhou, H.; Wu, Z.; Qiu, X. Rapid detection of the positive side reactions in vanadium flow batteries. Appl. Energy 2017, 8, 452–462. [Google Scholar] [CrossRef]
  18. Buckley, D.N.; Gao, X.; Lynch, R.P.; Quill, N.; Leahy, M.J. Towards Optical Monitoring of Vanadium Redox Flow Batteries (VRFBs): An Investigation of the Underlying Spectroscopy. J. Electrochem. Soc. 2014, 161, A524–A534. [Google Scholar] [CrossRef]
  19. Zhang, W.; Liu, L.; Liu, L. An on-line spectroscopic monitoring system for the electrolytes in vanadium redox flow batteries. RSC Adv. 2015, 5, 100235–100243. [Google Scholar] [CrossRef]
  20. Spectrometer SEC2000. 2020. Available online: https://www.als-japan.com/1352.html (accessed on 17 June 2022).
  21. Si Photodiode FD11A. 2012. Available online: https://www.thorlabs.com/thorproduct.cfm?partnumber=FD11A (accessed on 17 June 2022).
  22. Schofield, K. State of Charge and Capacity Tracking in VRFB Systems. Unpublished Master’s Thesis, University of Alberta, Edmonton, AB, Canada, 2022. [Google Scholar]
Figure 1. Setup of the VRFB system [22].
Cleantechnol 04 00037 g001
Figure 2. Construction of a clear flow cell (1/4 internal thickness) with housing for ambient light reduction.
Cleantechnol 04 00037 g002
Figure 3. Effect of rebalancing mechanism on the discharge performance (5.5 A max) of 8 L of electrolyte [22].
Cleantechnol 04 00037 g003
Figure 4. VRFB cycling performance (40 L of electrolyte) with an automatic rebalancing tube, comparing two different charge currents. Cycle (a) charge power, (b) discharge voltage, (c) energy input, (d) energy output [22].
Cleantechnol 04 00037 g004
Figure 5. Measured OCV after using a 20 A (June 25) and 25 A (June 30) max charge current [22].
Cleantechnol 04 00037 g005
Figure 6. OCV vs. terminal voltage using 20 A max current [22].
Cleantechnol 04 00037 g006
Figure 7. Positive electrolyte absorbance test utilizing a 30 A charge and 1/4 optical path (charge process) [22].
Cleantechnol 04 00037 g007
Figure 8. Negative electrolyte absorbance test utilizing a 1/4 flow cell (30 A charge) [22].
Cleantechnol 04 00037 g008
Figure 9. Negative electrolyte absorbance test utilizing a 1/8 flow cell (30 A charge) [22].
Cleantechnol 04 00037 g009
Publisher’s Note: MDPI stays neutral with regard to jurisdictional claims in published maps and institutional affiliations.

