Abstract
In the field of advanced concrete science, the construction industry has risen to great heights. Due to its own characterisation, the manufacturing cost of reactive powder concrete (RPC) is very high. This can be minimised by substituting the components of the RPC with the aid of agro waste. Because of the production of sugar from the sugar cane industry, bagasse ash is abundantly available in India. It is not ideal for the direct replacement of ingredients in concrete because of the presence of carbon dioxide in bagasse ash. The study of bagasse ash’s actions under different temperatures and different exposure times is discussed in this paper. It is inferred from the findings obtained from the energy dispersive study of X-ray (EDAX) that the presence of reactive silica in bagasse ash could be substituted by RPC ingredients due to heat treatment. RPC is composed of exceptionally fine powders (cement, sand, quartz powder and silica smolder) and superplasticiser. The superplasticiser, utilised at its ideal dose, decreases the water to cement proportion (w/c) while enhancing the workability of the concrete. A thick matrix is accomplished by optimising the granular packing of the dry fine powders. This compactness gives RPC ultra-high quality and durability. Reactive powder concretes have compressive qualities extending from 200 to 800 MPa.
1. Introduction
Sustainable building production would require the use of non-conventional and advanced materials and waste management to offset natural resource consumption and find new ways to protect the environment [1]. Because of the high cost of building ingredients used, cement sustainability as a construction material has posed many exposures. By 2050, the Portland cement market is projected to grow by nearly 200%. Construction is one of the world’s biggest industries. Overall, 30% of financial capital is being used by the building industry. Behind steel and aluminum goods, cement is the third-largest energy-intensive material, representing 7% of the total global manufacturing consumption. Worldwide, the estimated electricity consumption reached 105 kWh/tonne manufacturing of cement and clinker manufacturing was responsible for 855 kcal/kg heat consumption. Concrete is a composite material used in building construction. The mixing of cement, water, sand, and aggregates prepares concrete. For the production of one tonne of cement, clay (0.40 tonnes), limestone (1.5 tonnes), and gypsum (0.05 tonnes) are required. Portland cement concrete remains the most popular concrete. Perhaps one of concrete’s key components is cement, which affects the atmosphere very rapidly. Approximately 7% of world emissions lead to around 72.1kg of carbon dioxide (CO2) per tonne of ordinary Portland cement (OPC) output [2]. Cement processing produces high CO2. After transport and energy production, cement is the third-largest man-made CO2 producer in the world. Around 0.97 tonnes of carbon dioxide per 1 tonne of cement output is expected to be released into the atmosphere. A type of greenhouse gas, primarily responsible for global warming, is carbon dioxide [3]. This helps us to study various alternatives to cement which are particularly environmentally friendly. Surplus materials or goods from industrial sectors can be used as limited buildings are constructed while decreasing the required concrete strength. Several researchers have made efforts to utilise industrial and agricultural by-products or waste materials for mixed cement production to reduce costs, save resources, reduce energy consumption, and decrease the amount of CO2 generated during OPC production. Rice husk ash is supplied by agricultural residues from the rice mill industry (RHA). With a high reactive silica content of 92 to 95% and a large specific area with a particle size of 10–75 mm, it is amorphous and non-crystalline with greater pozzolanic behaviour [4,5,6].
Reinforced concrete hardness can be enhanced by an adequate selection of durable materials [7]. Due to its alkaline/lime latent hydraulic properties, slag can effectively substitute up to 95% of ordinary Portland cement [8,9]. However, in general, slags are less alkaline and hydroxide than pure clinker in their concentration, which contributes to reduced pH in cement plants [10,11]. This can have a direct effect on the alkalinity of concrete and minimise protection from corrosion [12]. Portland slag cements can therefore have a significant impact. They can lead to increased durability through pore refining and increased resistance to the penetration of perceptible agents through the addition of alternative materials as fine aggregates [13]. Sugarcane bagasse ash sand (SBAS), a by-product of the production of sugar and ethanol, can be substituted by natural sand in cemented materials [14,15].
Brazil is the world’s largest producer and exporter of sugar cane, with an estimated generation of SBAS of 4 million tonnes per year [16,17]. Sugar cane bagasse ash (SCBA), which is formed as a residue from the processing of sugar, contains this material. In over 110 countries, sugarcane is one of the major food crops, growing over 1500 million tonnes worldwide [18,19]. Sugarcane production in India alone exceeds 300 million tonnes per year, resulting in around 10 million tonnes of bagasse ash from sugarcane as unusable waste material. Approximately 45 % of the fibrous residual is extracted in the same industries as energy in surface heating boilers after harvesting all active sugar from sugarcane, resulting in 8–10% ash as residue, recognised as sugarcane bagasse ash (SCBA) [20]. High unburnt matter, titanium, silicon, and calcium oxides are composed of SCBA. However, ashes obtained directly from either mill are non-reactive since they are burned at very high temperatures under uncontrolled circumstances. Ash thus becomes waste for agriculture and causes problems with disposal [21]. SCBA has achieved an average of 99 million tonnes per annum over the past five years, with India contributing 21 million tonnes per annum. A large proportion of sugarcane could be incinerated in a sugar-producing area to generate the powder used for polishing, clarification, thermal expansion, and crystallisation equipment [22]. SCBA residues are produced during the incineration procedure. Though its proportion of ash comprises only around 3% of the bagasse’s initial volume, the high quantity of carbonised bagasse can produce vast quantities of SCBA to be treated effectively and in an environmentally friendly way [23,24]. Another use of SCBA in building applications is the proper disposal of some enormous waste found by researchers over the last decade. A recent study [25] showed that the high amount of SCBA use results in a reduction in CO2 emissions, a reduction in costs, and a decrease in resource use.
Factory-derived SCBA is denser, with little surface area and a crystalline structure, but in the literature, it is highly destructive in composition with sufficient bonding additives (mainly SiO2, CaO, Al2O3, and Fe2O3) [26,27]. Therefore, many processing methods (such as crushing, heating, electrochemical oxidation, etc.) are needed to boost the characteristics of SCBA to extract processed SCBA (PSCBA) [28]. To fix this problem and to categorise SCBA’s structure, additional approaches like X-ray photoelectron spectroscopy (XPS) must be used to supplement the previously mentioned composition framework. Based on the idea that photoelectrons emitted mostly from the surface of the materials and pulverised with soft X-rays have different surface energies, XPS is a surface-sensitive computation technique for measuring the chemical nature conditions of elements [29,30]. Because XPS probes mostly specimens under 20 nm, it calculates the overall quantity of endogenous elements such as carbon due to carbonation and residues during processing. Among the nation’s biggest industrialised solid waste, coal-burning fly ash (CFA), particularly Class F and Class C according to ASTM C618 [31], however, has been widely distributed as a supplementary cement material (SCM) both for its economic and technological advancements [32,33,34]. The chemical and physical properties of bagasse ash (BA) are the key factors influencing pozzolan minerals. Bagasse ash’s (BA) is more than 10 % dependent on the co-generation process and carbon content. Cordeiro et al. [35], however, observed that a high bagasse ash LOI had no detrimental impact on binder properties, though LOI of less than 10% produced excellent pozzolanic materials.
According to the literature, agrowaste materials can be reused as cementious materials, which will reduce the CO2 emissions in the production process of cement. In this study, sugarcane bagasse ash (SBA) is used as a cementious material with reactive powder concrete. To analyse the performance of the agro waste and the SBA, various studies are performed with various proportions of different mix ratios. The samples are tested under various temperatures, and their compressive strength is analysed with respect to the cement material. The feasibility of using SCBA as an SCM in concrete is investigated.
2. Experiments
In this paper, the key experimental objective is to examine the elemental and phase distribution and also functional groups of two forms of silicon aluminate ash. The first is an SCBA created in Louisiana from the refining of sugar cane bagasse; the second is a conventional class (CFA), produced from burning coal in a regional (Missouri) electric generator. As obtained, the SCBA in powdered form also has a similar color compared with that of the conventional CFA. The structure density of its SCBA is 2.53 g/cm3, which would be comparable to that of 2.35 g/cm3 of a CFA. Conversely, the particle size of the SCBA is 0.49 g/cm3, slightly lower compared with that of 0.98 g/cm3 of the CFA.
2.1. Particle Size Distribution
Particle size proportions of the two ashes were examined using Raman spectroscopy with a Microtrac S3500 size distribution analyzer (Microtrac Inc., Montgomeryville, Pennsylvania USA). The device was fitted with three precise red laser resistors to precisely quantify particle sizes of 0.02–2800 μm. After analyzing this information, the integrated sonicator deployed a 60-s ultrasonic signal to support the dispersion of powder samples in isopropanol culture medium. Distributions of the two forms of ash were calculated both during 15-s processing and using a disc machine. The analysis conducted in this study was an examination of the properties of hardened and fresh concrete. Workability was included in the new concrete properties and compressive strength break tensile strength was included in the hardened concrete properties. For both cylinders and cubes, the compressive strength was established. The measurements of the cylinder used in this study were 100 mm in diameter and 200 mm in height. The mortar cubes were used because there was no coarse aggregate used in this study.
2.2. Materials Used
Sugarcane bagasse ash, quartz sand, cement, silica fume, quartz powder, steel fibre, water, and superplasticiser were the materials used. Grade 53 of ordinary Portland cement was the cement used in this study.
2.3. Material Properties
The specific gravity of the quartz sand used in this analysis was 2.82 and the particle sizes were between 1.18 and 0.6 mm. The fineness value was between 0.075 and 0.009 mm for the quartz sand and the silica fume. The dramix 3D fibre had an aspect ratio of 100.45 for the steel fibres used in this analysis. A superplasticiser based on polycarboxylic ether was used. Compressive strength for cube and cylinder, split tensile strength, flexural strength, and EDAX analysis were carried out in this study.
Cubes of 150 × 150 × 150 mm were used in the compressive strength tests; and cylinders of 150 mm diameter × 300 mm height were used in the compressive strength as well as split tensile strength tests; and 100 × 100 × 500 mm prisms were used in the flexural strength tests in this study. On the basis of trial and error, the mix ratio was achieved by referring to the literature. However, the following mix ratio was taken from the experimental findings inferred by their results [4] as a benchmark in the literature by Perrie Richard.
The following mix classifications shown in Table 1 were established from the mix ratio based on mix ratio shown in Table 2. The compression testing machine was subjected to various loading rates for the mix categorisations described in the chart. The first loading rate of 15 kN/min was observed. There were three loading rates preceding this. The SCBA 17.5 had very significant compressive strength with both cube and cylinder from the observational data identified according to the above table, which were extracted for further analysis using the SCBA 17.5 combination. Then, for a duration of two hours to 8 h, the SCBA was introduced to temperatures of around 2000 to 8000 °C. The mix ratios are given in Table 3.

Table 1.
Mix designation for Sugar cane bagasse ash (SCBA).

Table 2.
Mix ratio.

Table 3.
Mix designation for heat-treated SCBA.
3. Results
With the aid of a hydrometer, the particle size analysis for the SCBA was performed. The findings show that the SCBA’s particle size variation after burning at different temperatures is almost identical to those of the cement’s particle size range. The findings are given in Figure 1.
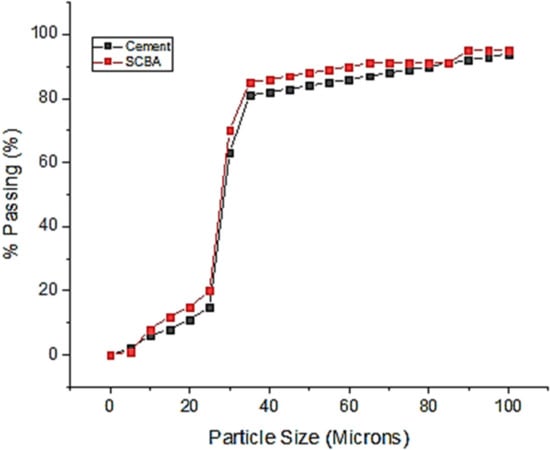
Figure 1.
Particle size distribution of SCBA and cement.
Since SCBA is water soluble, it is therefore not possible to calculate the specific gravity of the SCBA with the aid of the pycnometer. The specific gravity of the SCBA is calculated using the density container. Table 4 and Table 5 identify the characteristics and their chemical characteristics.

Table 4.
Chemical composition of SCBA and OPC.

Table 5.
Physical properties of SCBA.
It was assumed from the results that SCBA was found to be the best cement option. The effects of strength properties are shown in Figure 2.
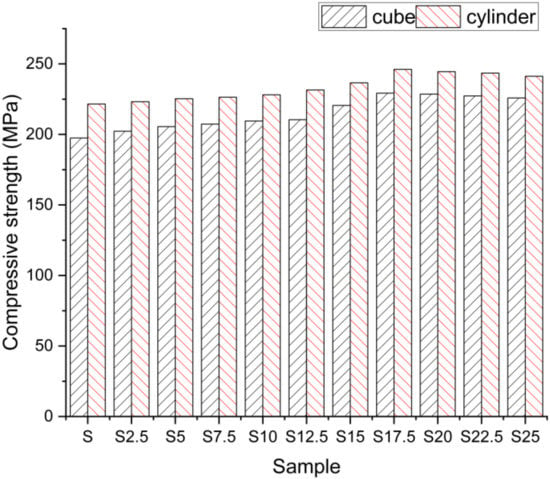
Figure 2.
Compressive strength results of cube and cylinder.
From the compressive strength effects recorded at 28 days, it is strongly observed that even the compressive strength also improves in the cube situation when the loading premium changes. With the rising loading rate, the rise in the concrete strength was stronger than steel. Thus, along with the growing loading rate, the compressive zone of the concrete segment on the yield state decreased [25]. It is inferred from the observational data also that the compressive strength of its specimen (both cubical and cylindrical) rises to a maximum when the cement has been partially removed at a percentage of 17.5 after it decreases linearly. We could also infer from the findings that its loading rate of 15 kN/min provided a higher electrical resistance than the other two loading rates. The loading rate was therefore recorded as 15 kN/min for further study. The key explanation for the impact strength is due to the extra SCBA cementitious property found with the aid of XRD and SEM research. Moreover, Lyra also stated that because cement became gradually replaced at a rate of 10–20% after it started to decrease, the compressive strength of the sample was improved [26]. The explanation for the reduction in intensity has been established as the lack of CaO, which is the hydration reaction’s key contributor. One of the reasons for the reduction in strength was also established by the presence of the carbon content found in SCBA. As the SCBA ratio increases, the carbon content also increases due to the inclusion of the carbon content added in the SCBA due to the disposal yard’s unregulated burning.
3.1. Effect of Math Heating of SCBA under Different Temperatures
As a decrease in strength was found to be due to the existence of carbon, carbon removal was performed after subjecting the SCBA to heat during multiple exposure schedules, and the chemical properties were measured and the outcome of the sample is given in Figure 3.
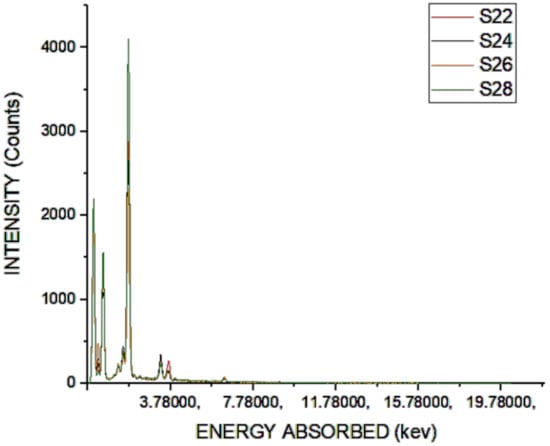
Figure 3.
Chemical analysis of S22 to S28.
The existence of carbon was still detected from the chemical testing analysis, as shown in Figure 4, but the presence of reactive silica was high when the sample was heated for 8 h at a temperature of 200 °C. This shows that there was a variety of silica fumes from the simulation observations, since silica is the main substitute cement materials (SCM) involved in the ash to boost concrete performance. Figure 4 shows the heating test results at a temperature of 400 °C.
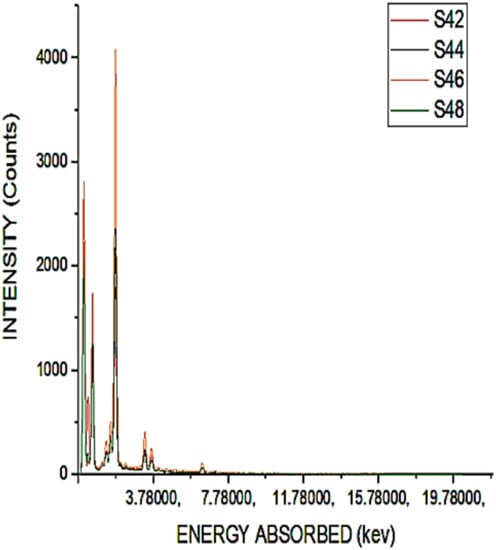
Figure 4.
Chemical composition of S42 to S48.
It is shown that heating at a temperature of 400 °C for a duration of 6 h would give a higher amount of reactive silica. The presence of reactive silica in S46 is 12% higher than that of S28 reactive silica. For a duration of 8 h after heating to a temperature of 400 °C, the carbon content could be observed due to the black color of the samples produced as a result of the unrestricted burning of the sugar cane waste. The heating system was already added as the existence of carbon was already reported despite mathematical heating to 400 °C for a duration of 8 h. It is inferred from the chemical characterisation that there is a huge amount of amorphous silica elements in the sample. The maximum value reaches 400 °C and reduces for a duration of 800 °C while heating. The maximum decrease is due to the formation of silica and another monolithic gaseous substance, as shown by the EDAX results obtained. The color shift occurred during such a process, heating the specimens at a temperature of 600 °C for a duration of 4 h, removing 100% of the chemical composition. The specimens are transported to higher temperatures due to the path, and the findings are presented in Figure 5 below.
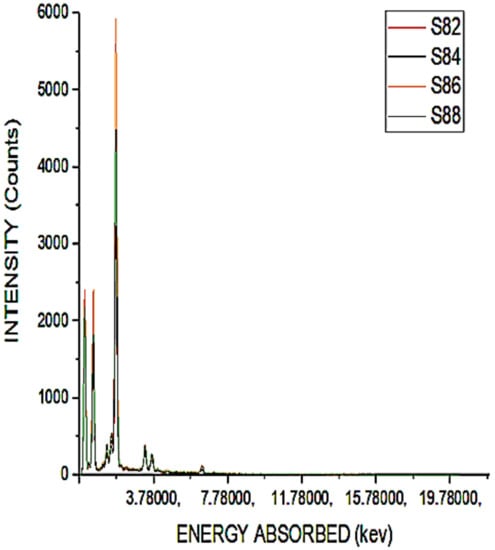
Figure 5.
Chemical composition of S82 to S88.
We could infer from the results presented in Figure 5 that the intensity of silica is very high since the maximum value exceeds 600 °C. However, when heated at a temperature of 800 °C, the sample volume is significantly reduced. It is inferred from the results of Figure 4 and Figure 5 that the high peak indicates that there is a high amount of reactive silica present in sample S88 compared to sample S22. This suggests that this reactive silica will function as an SCM. In Figure 6, the sum of the presence of silica is shown for different samples.
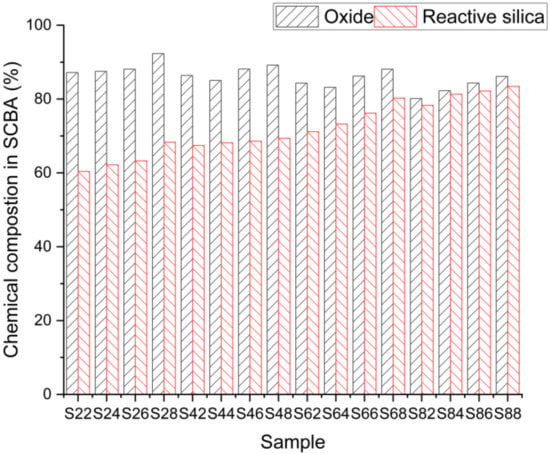
Figure 6.
Reactive silica of different samples.
The findings show that when heating the samples beyond 400 °C, the presence of carbon is verified in the form of oxides until the temperature of 400 °C is reached; the silica value is very high, but the continued presence of other such oxide types, however, is relatively low. We can infer from these findings that the carbon shortage occurs at a temperature of 600 °C.
3.2. Compressive Strength
The effects of compressive power are shown in Figure 7. This shows that the heating of the SCBA raises the power of the compressive force (both cubic and cylindrical). This rise in hardness is due to the movement of SCBA’s crystalline materials and, during mathematical temperature increase, into aqueous dispersion. The intensity of the samples increased by a proportion of 7.6%, which is 43.41% greater than with the compressive strength without SCBA. We may infer from the graph that math heating at a temperature of 800 °C would offer higher mechanical output when SCBA has been partially replaced with cement at a ratio of 17.5%. The loading rate was taken as 15 kN/min because, compared to the other two loading rates, as shown in Figure 2, and also the results observed from Amer Research, it demonstrated better mechanical properties [26].
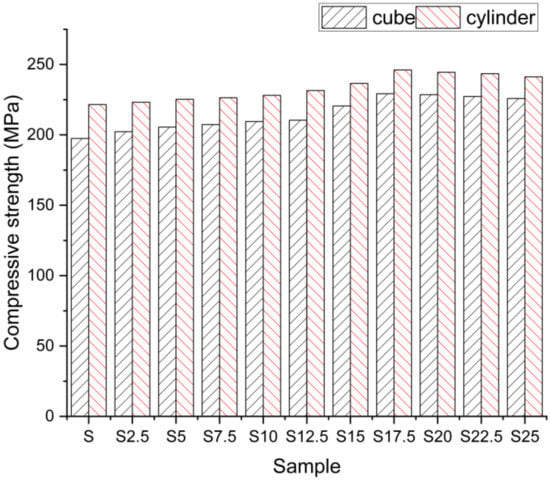
Figure 7.
Compressive strength.
3.3. Split Tensile Strength
Split tensile strength is shown in Figure 8. It is inferred from the results of the split tensile test that the math heating effect does not affect split tensile power. This is primarily because the SCBA’s micro loading capacity only affects the tensile power.
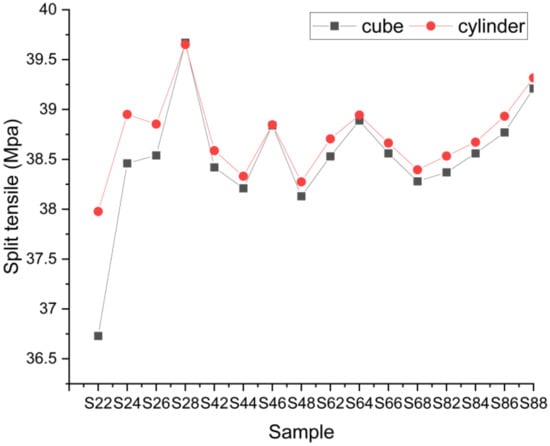
Figure 8.
Split tensile strength.
3.4. Flexural Strength
The findings of the flexural strength test were acquired over the two-point loading framework for the standard samples and the results are given in Figure 9. We could also infer from the flexural strength findings that the mathematical heating effect does not always impact the variance in flexural strength. It lies nearly within the 21–22 MPa range.
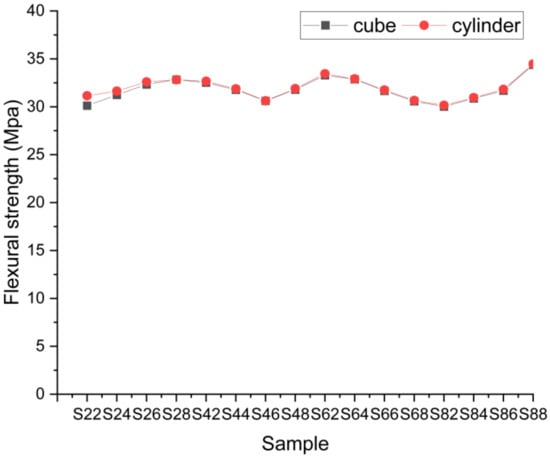
Figure 9.
Flexural strength results.
3.5. Load–Displacement Relationship
The load–displacement relationship has also been noted without SCBA and the samples are described up to that limit. The findings are demonstrated in Figure 10.
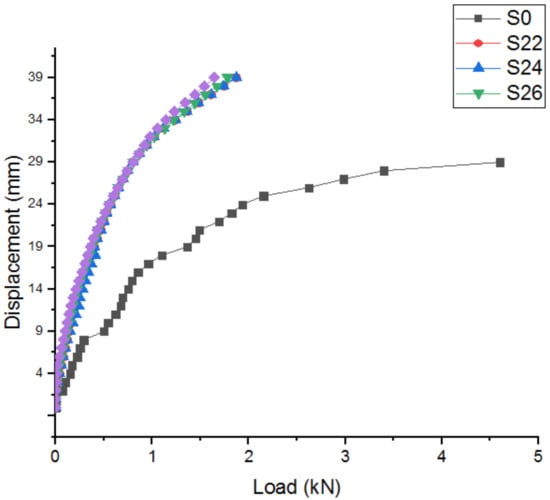
Figure 10.
Load–displacement relationships.
We could infer from the load–displacement relationships that, even before the crack propagation event, disruption would be encountered with the implementation of SCBA. However, relative to the certain specimens, further loads will be needed. Figure 11 indicates the defect pattern of the reactive powder concrete (RPC) cylinder.
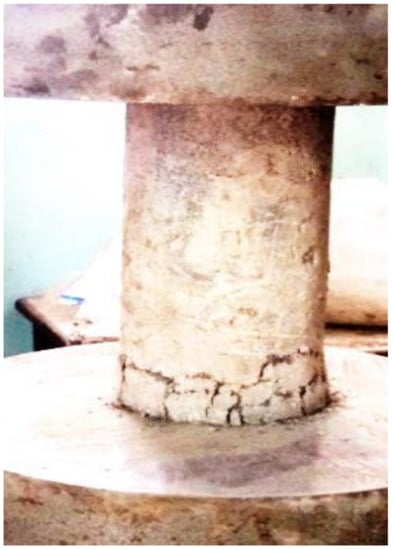
Figure 11.
Failure pattern of reactive powder concrete (RPC) cylinder (S17.5) (Scale: 1(H):1.41(W)).
3.6. Stress–Strain Curve from Compression Test in Various Combinations
The stress–strain curves are presented in Figure 12 and Figure 13. It demonstrates that, for all the specimens, the stress–strain curve is almost comparable. Thus, whenever the specimens are exposed to heat at a temperature of 200 °C, the math intense heat does not affect the stress–strain characteristics. The elasticity modulus determined from the stress–strain curve is greater than the values of the IS code so that it appears to be concave, in an opposite manner to that of traditional concrete.
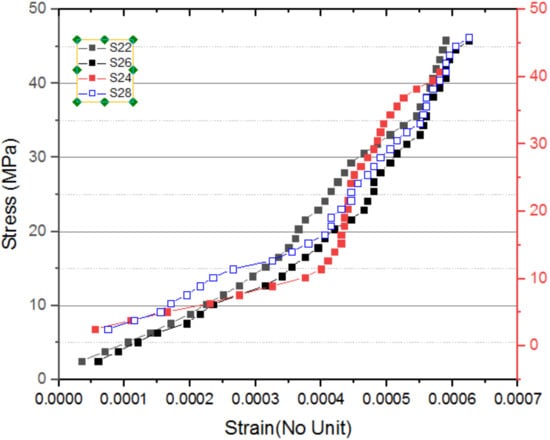
Figure 12.
Stress–strain curve for S22 to S28.
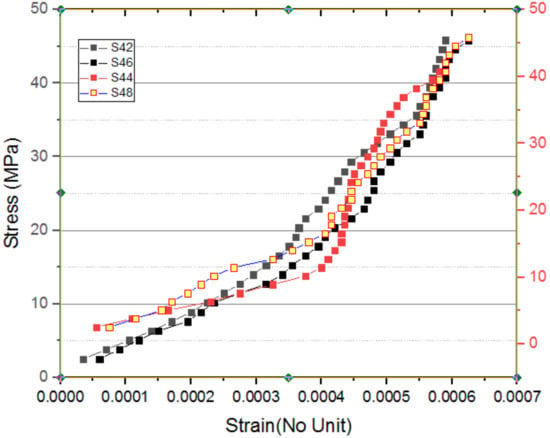
Figure 13.
Stress–strain curve for S42 to S48.
This graph is also similar to that of the graphs shown in Figure 13, Figure 14 and Figure 15, as represented by the stress–strain characteristics for the samples heated at a temperature of 400 °C. Math heat treatment at a temperature of 400 °C further ensures the same performance as at 200 °C, so that math heating at a temperature of 400 °C does not affect the characteristic features of the stress–strain. The stress–strain features of the specimens heated at a temperature of 600 °C are shown in Figure 14. It is inferred from the analysis that the specimens heated for 8 h underwent almost no axial distortion (contraction) compared to other techniques. This change in conduct is primarily due to the elimination of carbon from the specimens. In the strength characteristics, the chemical composition observed in other specimens does not appear. This carbon may appear in the form of certain oxides. In the case of specimens heated to 400 °C, this is the primary reason that the stress–strain behavior patterns will be the same. Figure 15 shows the features of the stress–strain of specimens pressurised to a temperature of 800 °C. Composite samples also underwent almost no elongation with pressurised temperatures up to 400 °C. This activity also shows that the removal of carbon will boost strength.
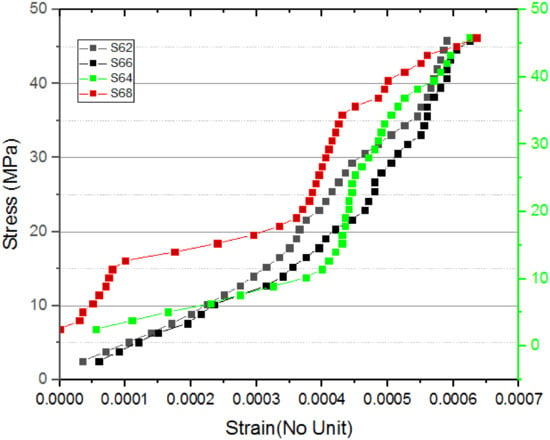
Figure 14.
Stress–strain curve for S62 to S68.
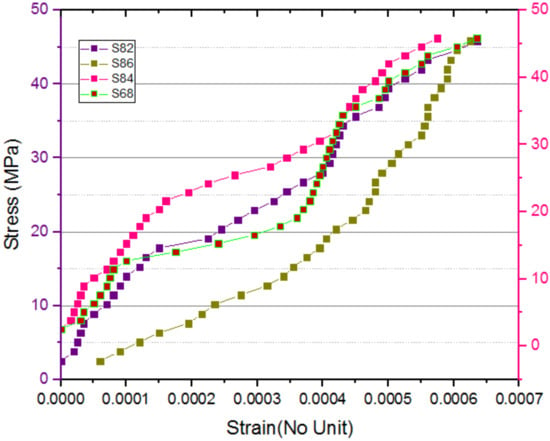
Figure 15.
Stress–strain curve for S82 to S88.
It is inferred from the graph in Figure 16 that the IS 456:2000 value provided inaccurate power compared to the stress–strain curve values. We could learn therefore that the IS code for reinforced cement concrete is not correct.
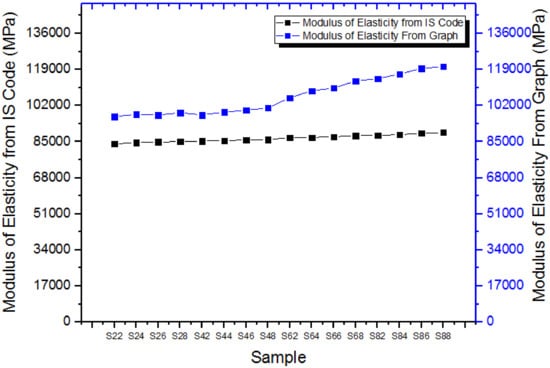
Figure 16.
Modulus of elasticity values.
4. Conclusions
The compressive strength of the specimen (both cubical and cylindrical) rises to a maximum when the cement has been partially removed at a percentage of 17.5 after it decreases linearly. The split tensile test shows that the math heating effect does not affect split tensile power. This is primarily because the SCBA’s micro loading capacity only affects the tensile power. The flexural strength findings show that the mathematical heating effect does not always impact the variance in flexural strength. Whenever the specimens are exposed to heat at a temperature of 400 °C, the math intense heat does not affect the stress–strain characteristics. Hardness increases due to the movement of SCBA’s crystalline materials and, during mathematical temperature increase, into aqueous dispersion. Math heating at a temperature of 800 °C would offer higher mechanical output when SCBA has been partially replaced with cement at a ratio of 17.5%. An improved proportion of silica is provided by mathematical heating down to a temperature of 400 °C; however, the amount of carbon is not eliminated. In comparison with both the specimens heated under 400 °C, math heating to higher than 400 °C delivers the best performance. The elasticity modulus determined from the stress–strain curve is greater than the values of the IS code, so it cannot be used for RPC.
Author Contributions
S.S.: Conceptualization, Supervision. A.K.P.: Methodology. A.K.: Investigations, Writing—original draft. R.S.: Writing—original draft. A.G.: Validation; Project administration; Supervision; Funding acquisition. All authors have read and agreed to the published version of the manuscript.
Funding
This research received no external funding.
Conflicts of Interest
The authors declare no conflict of interest.
References
- Danso, H.; Obeng-Ahenkora, N.K. Major determinants of prices increase of building materials on Ghanaian construction market. Open J. Civ. Eng. 2018, 8, 142–154. [Google Scholar] [CrossRef][Green Version]
- Ranjodh, S.; Rohin, K.; Gurniwaz, S. Study of Self Compacting Concrete Using Brick Dust and Marble Powder. Int. J. Eng. Res. Appl. 2013, 3, 1283–1286. [Google Scholar]
- Naqi, A.; Jang, J.G. Recent progress in green cement technology utilizing low-carbon emission fuels and raw materials: A review. Sustainability 2019, 11, 537. [Google Scholar] [CrossRef]
- Banu, S.S.; Kartikeyan, J.; Jayabalan, P. Influence of using agro-waste as a partial replacement in cement on the compressive strength of concrete–A statistical approach. Constr. Build. Mater. 2020, 250, 118746. [Google Scholar]
- Stalin, B.; Ravichandran, M.; Sudha, G.T.; Karthick, A.; Prakash, K.S.; Asirdason, A.B.; Saravanan, S. Effect of titanium diboride ceramic particles on mechanical and wear behaviour of Cu-10 wt% W alloy composites processed by P/M route. Vacuum 2020, 109895. [Google Scholar] [CrossRef]
- Senthilkumar, S.; Karthick, A.; Madavan, R.; Moshi AA, M.; Bharathi, S.S.; Saroja, S.; Dhanalakshmi, C.S. Optimization of transformer oil blended with natural ester oils using Taguchi-based grey relational analysis. Fuel 2020, 119629. [Google Scholar] [CrossRef]
- Lothenbach, B.; Scrivener, K.; Hooton, R.D. Supplementary cementitious materials. Cem. Concr. Res. 2011, 41, 1244–1256. [Google Scholar] [CrossRef]
- CEN. Cement. Part 1: Composition, Specifications and Conformity Criteria for Common Cements; BS EN 197-1; British Standards Instituiton: London, UK, 2011; p. 56. [Google Scholar]
- Scrivener, K.L.; Juilland, P.; Monteiro, P.J.M. Advances in understanding hydration of Portland cement. Cem. Concr. Res. 2015, 78, 38–56. [Google Scholar] [CrossRef]
- Vollpracht, A.; Lothenbach, B.; Snellings, R.; Haufe, J. The pore solution of blended cements: A review. Mater. Struct. 2016, 49, 3341–3367. [Google Scholar] [CrossRef]
- Almeida, F.C.R.; Klemm, A.J. Effect of GGBS on water absorption capacity and stability of Superabsorbent polymers partially crosslinked with alkalis. J. Mater. Civ. Eng. 2018, 30, 1–11. [Google Scholar] [CrossRef]
- Ortolan, V.K.; Mancio, M.; Tutikian, B.F. Evaluation of the influence of the pH of concrete pore solution on the corrosion resistance of steel reinforcement. J. Build. Pathol. Rehabil. 2016, 1, 1–7. [Google Scholar] [CrossRef]
- Shafigh, P.; Mahmud, H.B.; Jumaat, M.Z.; Zargar, M. Agricultural wastes as aggregate in concrete mixtures - a review. Constr. Build. Mater. 2014, 53, 110–117. [Google Scholar] [CrossRef]
- Sales, A.; Lima, S.A. Use of Brazilian sugarcane bagasse ash in concrete as sand replacement. Waste Manag. 2010, 30, 1114–1122. [Google Scholar] [CrossRef] [PubMed]
- Almeida, F.C.R.; Sales, A.; Moretti, J.P.; Mendes, P.C.D. Sugarcane bagasse ash sand (SBAS): Brazilian agroindustrial by-product for use in mortar. Constr. Build. Mater. 2015, 82, 31–38. [Google Scholar] [CrossRef]
- Moretti, J.P.; Sales, A.; Almeida, F.C.R.; Rezende, M.A.M.; Gromboni, P.P. Joint use of construction waste (CW) and sugarcane bagasse ash sand (SBAS) in concrete. Constr. Build. Mater. 2016, 113, 317–323. [Google Scholar] [CrossRef]
- Attia, M.E.H.; Karthick, A.; Manokar, A.M.; Driss, Z.; Sathyamurthy, R.; Sharifpur, M. Sustainable potable water production from conventional solar still during the winter season at Algerian dry areas: Energy and exergy analysis. J. Therm. Anal. Calorim. 2020, 1–11. [Google Scholar]
- Ding, Y.; Dai, J.-G.; Shi, C.-J. Fracture properties of alkali-activated slag and ordinary Portland cement concrete and mortar. Constr. Build. Mater. 2018, 165, 310–320. [Google Scholar] [CrossRef]
- Dhanalakshmi, C.S.; Madhu, P.; Karthick, A.; Mathew, M.; Kumar, R.V. A comprehensive MCDM-based approach using TOPSIS and EDAS as an auxiliary tool for pyrolysis material selection and its application. Biomass Convers. Biorefin. 2020, 1–16. [Google Scholar]
- Jagadesh, P.; Ramachandramurthy, A.; Murugesan, R. Evaluation of mechanical properties of Sugar Cane Bagasse Ash concrete. Constr. Build. Mater. 2018, 176, 608–617. [Google Scholar] [CrossRef]
- Andreão, P.V.; Suleiman, A.R.; Cordeiro, G.C.; Nehdi, M.L. Sustainable use of sugarcane bagasse ash in cement-based materials. Green Mater. 2019, 7, 61–70. [Google Scholar] [CrossRef]
- Park, C.K. Hydration and solidification of hazardous wastes containing heavy metals using modified cementitious materials. Cem. Concr. Res. 2000, 30, 429–435. [Google Scholar] [CrossRef]
- Agredo, J.T.; de Gutiérrez, R.M.; Giraldo, C.E.E.; Salcedo, L.O.G. Characterization of sugar cane bagasse ash as supplementary material for Portland cement. Ing. Investig. 2014, 34, 5–10. [Google Scholar]
- Reddy, P.; Gupta, M.V.N.; Nundy, S.; Karthick, A.; Ghosh, A. Status of BIPV and BAPV System for Less Energy-Hungry Building in India—A Review. Appl. Sci. 2020, 10, 2337. [Google Scholar] [CrossRef]
- USDA, World Markets and Trade Global Sugar. 2020, pp. 1–8. Available online: https://public.govdelivery.com/accounts/USDAFAS/subscriber/new (accessed on 1 November 2020).
- Lyra, G.P.; dos Santos, V.; De Santis, B.C.; Rivaben, R.R.; Fischer, C.; Pallone, E.M.D.J.A.; Rossignolo, J.A. Reuse of sugarcane bagasse ash to produce a lightweight aggregate using microwave oven sintering. Constr. Build. Mater. 2019, 222, 222–228. [Google Scholar] [CrossRef]
- Sathyamurthy, R.; Kabeel, A.E.; Chamkha, A.; Karthick, A.; Manokar, A.M.; Sumithra, M.G. Experimental investigation on cooling the photovoltaic panel using hybrid nanofluids. Appl. Nanosci. 2020, 1–12. [Google Scholar] [CrossRef]
- Chindaprasirt, P.; Kroehong, W.; Damrongwiriyanupap, N.; Suriyo, W.; Jaturapitakkul, C. Mechanical properties, chloride resistance and microstructure of Portland fly ash cement concrete containing high volume bagasse ash. J. Build. Eng. 2020, 101415. [Google Scholar] [CrossRef]
- Priya, A.K.; Nithya, M.; Rajeswari, M.; Priyanka, P.M.; Vanitha, R. Experimental investigation on developing low cost concrete by partial replacement of waste sludge. Int. J. Chem.Tech. Res. 2016, 9, 240–247. [Google Scholar]
- Fu, B.; Hower, J.; Dai, S.; Mardon, S.; Liu, G. Determination of chemical speciation of arsenic and selenium in high-as coal combustion ash by X-ray photoelectron spectroscopy: Examples from a Kentucky stoker ash. ACS Omega 2018, 3, 17637–17645. [Google Scholar] [CrossRef]
- ASTM C618-19. Standard Specification for Coal Fly Ash and Raw or Calcined Natural Pozzolan for Use in Concrete; ASTM International: West Conshohocken, PA, USA, 2019. [Google Scholar]
- Hemalatha, T.; Mapa, M.; George, N.; Sasmal, S. Physico-chemical and me- chanical characterization of high volume fly ash incorporated and engineered cement system towards developing greener cement. J. Clean. Prod. 2016, 125, 268–281. [Google Scholar] [CrossRef]
- Rivera, F.; Martínez, P.; Castro, J.; López, M. Massive volume fly-ash concrete: A more sustainable material with fly ash replacing cement and aggregates. Cem. Concr. Compos. 2015, 63, 104–112. [Google Scholar] [CrossRef]
- Liao, W.; Ma, H.; Sun, H.; Huang, Y.; Wang, Y. Potential large-volume beneficial use of low-grade fly ash in magnesia-phosphate cement based materials. Fuel 2017, 209, 490–497. [Google Scholar] [CrossRef]
- Prusty, J.K.; Patro, S.K.; Basarkar, S.S. Concrete using agro-waste as fine aggregate for sustainable built environment–A review. Int. J. Sustain. Built Environ. 2016, 5, 312–333. [Google Scholar] [CrossRef]
Publisher’s Note: MDPI stays neutral with regard to jurisdictional claims in published maps and institutional affiliations. |
© 2020 by the authors. Licensee MDPI, Basel, Switzerland. This article is an open access article distributed under the terms and conditions of the Creative Commons Attribution (CC BY) license (http://creativecommons.org/licenses/by/4.0/).