1. Introduction
Fuel cell technology represents a good answer to global climate changes, since it is almost totally “clean” in terms of SO
x and NO
x. In addition, its CO
2 emissions are relatively low. This energy generation is cleaner mainly due to the direct conversion of chemical energy to electrical energy without combustion, which significantly reduces pollutant emissions. Recently, this technology has found a lot of applications in several fields, such as industrial and residential sectors [
1,
2,
3]. Among such applications, the coupling with wastewater treatment plants (WWTPs) has led to improvements for the integration of energy production and the recovery of materials. Through anaerobic digestion, these kinds of plants produce biogas, which can be used as fuel for feeding fuel cells. However, one of the main drawbacks for high-temperature solid oxide fuel cell (SOFC) generators is their low tolerability towards contaminants present in biogas, since they have detrimental effects, mainly related to catalyst deactivation, carbon deposition and pore clogging [
4,
5,
6,
7,
8,
9,
10,
11,
12,
13]. A clean-up section is therefore mandatory before entering the fuel cell generator in order to remove the most dangerous contaminants [
14,
15,
16,
17,
18].
According to a volumetric composition analysis of Società Metropolitana Acque Torino (SMAT) biogas (WWTP), the most harmful and frequent contaminant is H
2S, as reported in literature from other plants [
19]. Presently, the most commonly used desulfurization methods can be divided into wet processes [
20,
21], membrane processes [
22,
23,
24] and dry processes [
16,
17,
25,
26,
27,
28]. Unfortunately, few of these are sufficiently efficient for fuel cell applications, so not all sorbent materials and solutions can reach ultralow sulfur levels (i.e., 30 ppb(v) or 0.04 mg(S)/m
3).
In line with the real plant solution, this article investigates the adsorption mechanism in activated carbon fixed-beds (dry process), since it is one of the best solutions from both the complexity and cost perspectives. Sorbent materials, such as commercial carbons, use physisorption and chemisorption mechanisms to remove pollutants.
The adsorption processes can be classified as physisorption when weak van der Waals forces are involved, and chemisorption when we are dealing with covalent bonding. Surface area and surface chemistry play a key role for H
2S removal. Carbons also present a well-developed microporosity. Naturally produced carbons are very interesting because of their lower cost compared to zeolites or metal oxides, even if their performance needs to be increased to enhance the specific adsorption and catalytic processes. The carbon adsorption capacities can be improved by impregnation of the carbons by suitable chemicals. For example, transition metals and/or their salts are able to produce metal sulfide [
29,
30,
31]. Moreover, basic compounds, such as KOH and NaOH, are able to increase the H
2S adsorption by acid–base reactions, and compounds such as KMnO
4 are able to promote H
2S oxidation [
32,
33]. Unfortunately, the capacity for physical adsorption may be decreased by the impregnation process, because of the reduction of the available micropore volume. Carbon impregnation changes catalytic properties, depending on temperature: physical adsorption of H
2S dominates under the usual conditions, such as a dry and anaerobic environment and low temperatures. While at higher temperatures and with improved surfaces, the mechanism of chemical adsorption occurs. Even the average pH of the carbon surface related to the pH of the local environment affects carbon adsorption capacity. It has been demonstrated that an acidic environment promotes the formation of sulfur oxides and sulfuric acid, while a basic environment favors the formation of elemental sulfur [
34]. In this study, a WWTP was considered, focusing on the gas-cleaning purposes for the application of SOFC (DEMOSOFC). Inside the wide range of commercial activated carbons, a specific commercial carbon, i.e., CKC, was selected and used for the gas-cleaning unit in the SMAT facility. This carbon was selected mainly due to economic evaluations, and then it was used to perform experimental lab tests in this study. The most influential parameters, such as length/diameter of the reactor (L/D) and gas velocity, were kept as close as possible to the conditions of the real plant.
According to the literature [
28,
35], trace concentration of oxygen in the biogas plays a significant role in H
2S adsorption: an experimental correlation between carbon adsorption capacity and volumetric oxygen percentages has been found.
Spent carbons are generally removed from the reactors and substituted with fresh ones. In this case, there are additional costs for both the transport of fresh carbons and the disposal of exhausted carbons, which can be landfilled or incinerated. An alternative solution is the regeneration of spent carbons. This has become widely adopted in the last decade, as it represents the most cost-effective and environmentally sound option. However, the economics of this practice are highly dependent on the characteristics of the regenerated carbon and also to any mass losses incurred during the process [
36].
The simplest and most known method for carbon regeneration is the thermal process, which has been used since 1990s. It can be made under different conditions (steam, air, inert atmosphere and CO
2) [
37,
38]. Considering the complexity of each condition to be exploited in a large demonstration plant, thermal regeneration through an electric oven under inert atmosphere (with N
2), with CO
2 and with air has been exploited and compared at the lab scale, with the possibility of implementation in the real plant.
2. Material and Methods
Here, the experimental apparatus for adsorption and regeneration tests of commercial sorbent material is described.
2.1. Activated Carbon Characterization
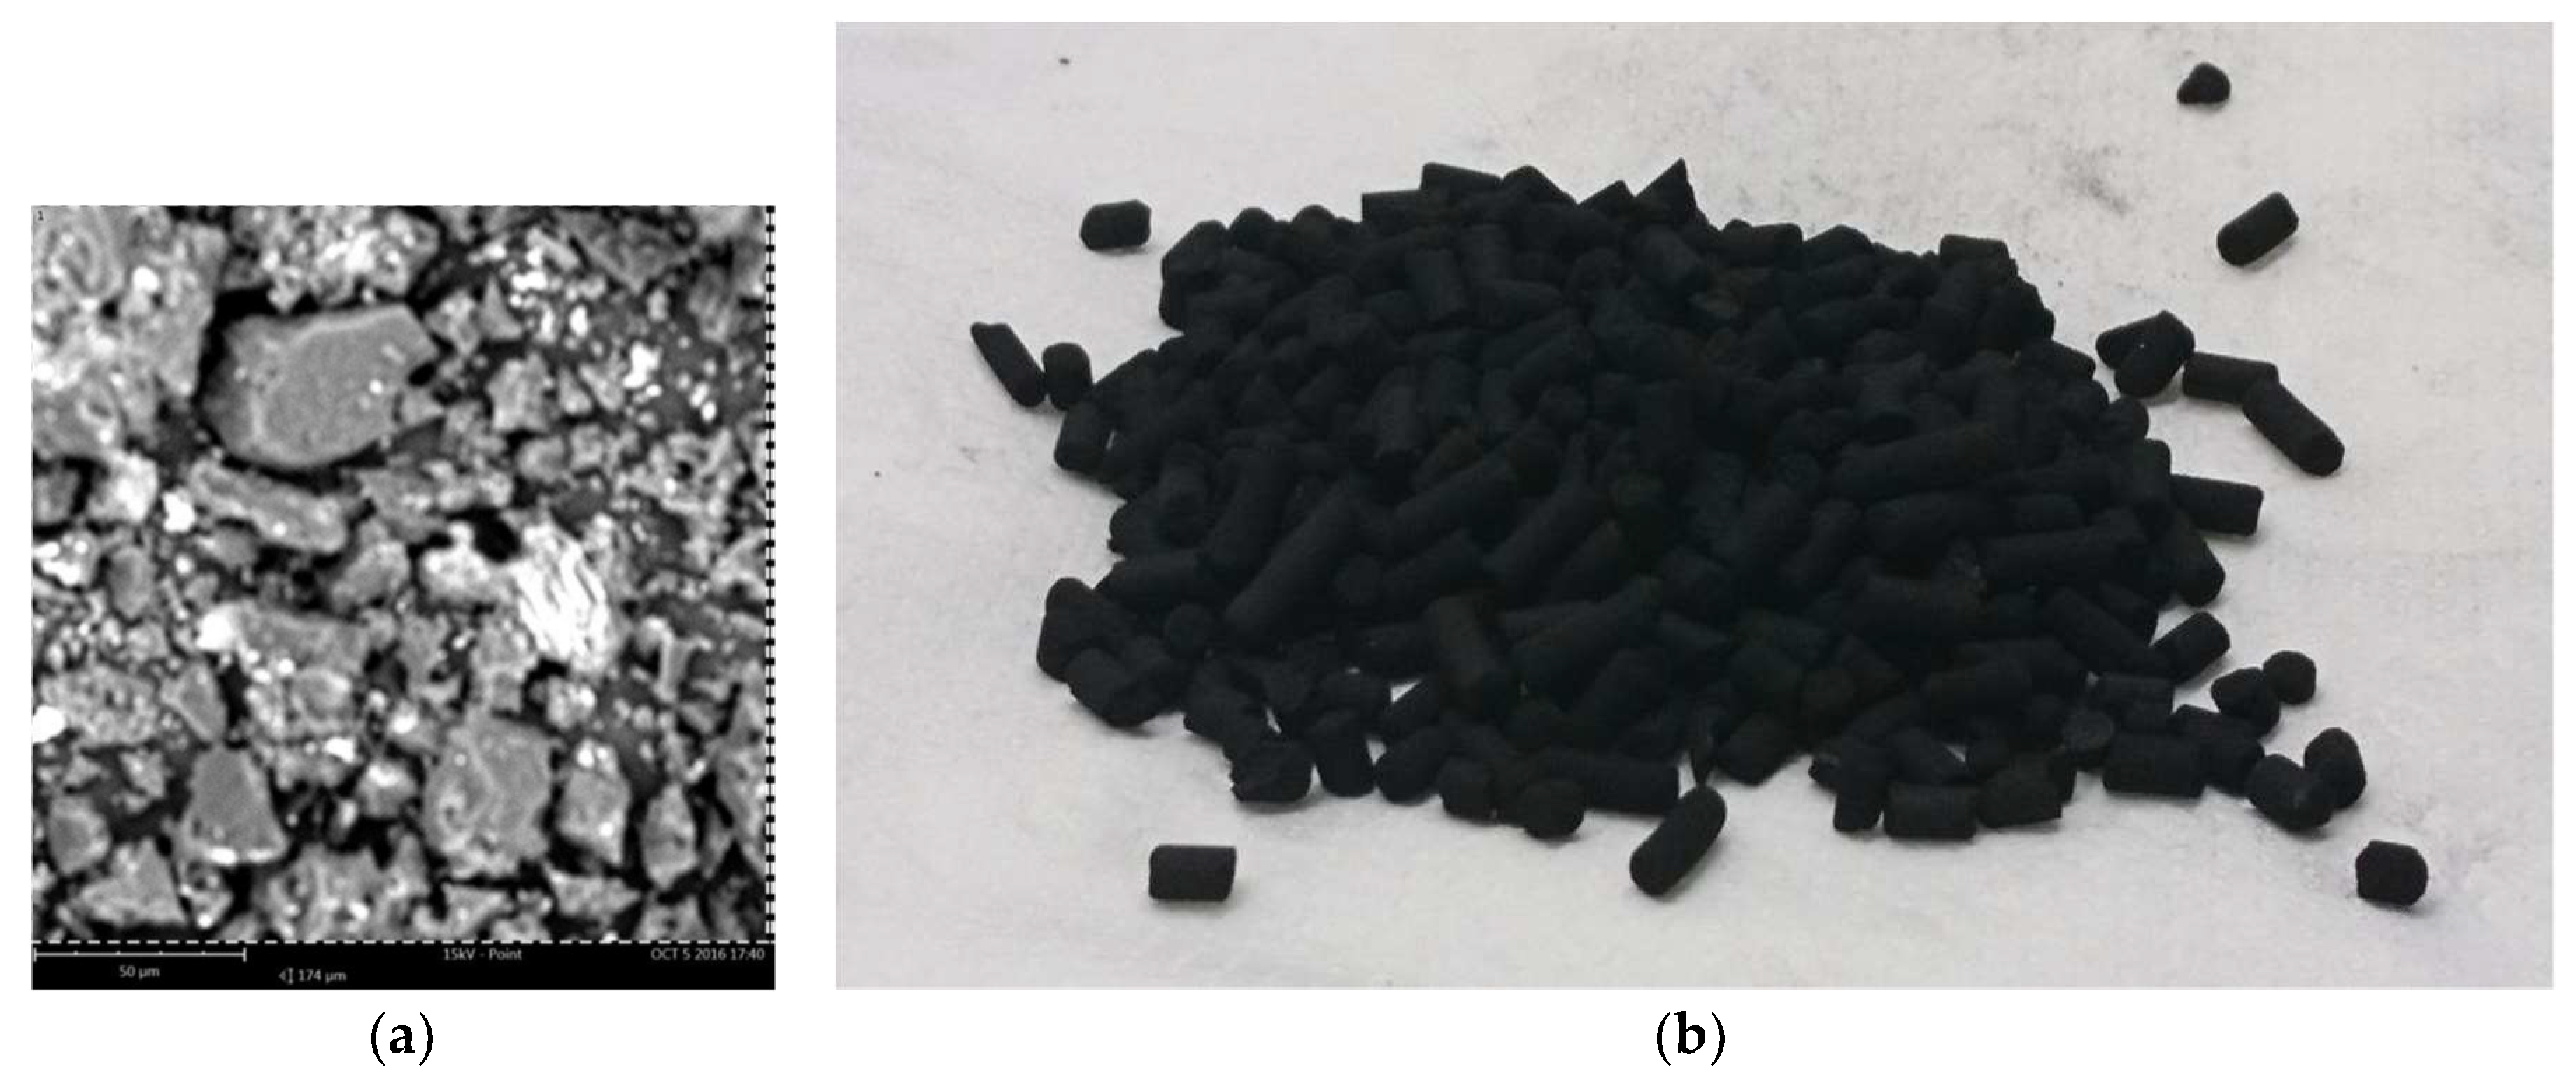
AirDep CKC is an activated carbon of mineral origin, extruded in pellets of 4 mm. It is thermally activated in an inert atmosphere by means of steam impregnated with 5% potassium bicarbonate (KHCO3). It is particularly suitable for the removal of hydrogen sulfide (H2S), low molecular weight mercaptans, acid gases and organic sulfurs.
A good characterization of the physisorption mechanisms involved the determination of some parameters, such as:
Specific surface area;
Micropore volume;
Pore size distribution;
Elemental composition.
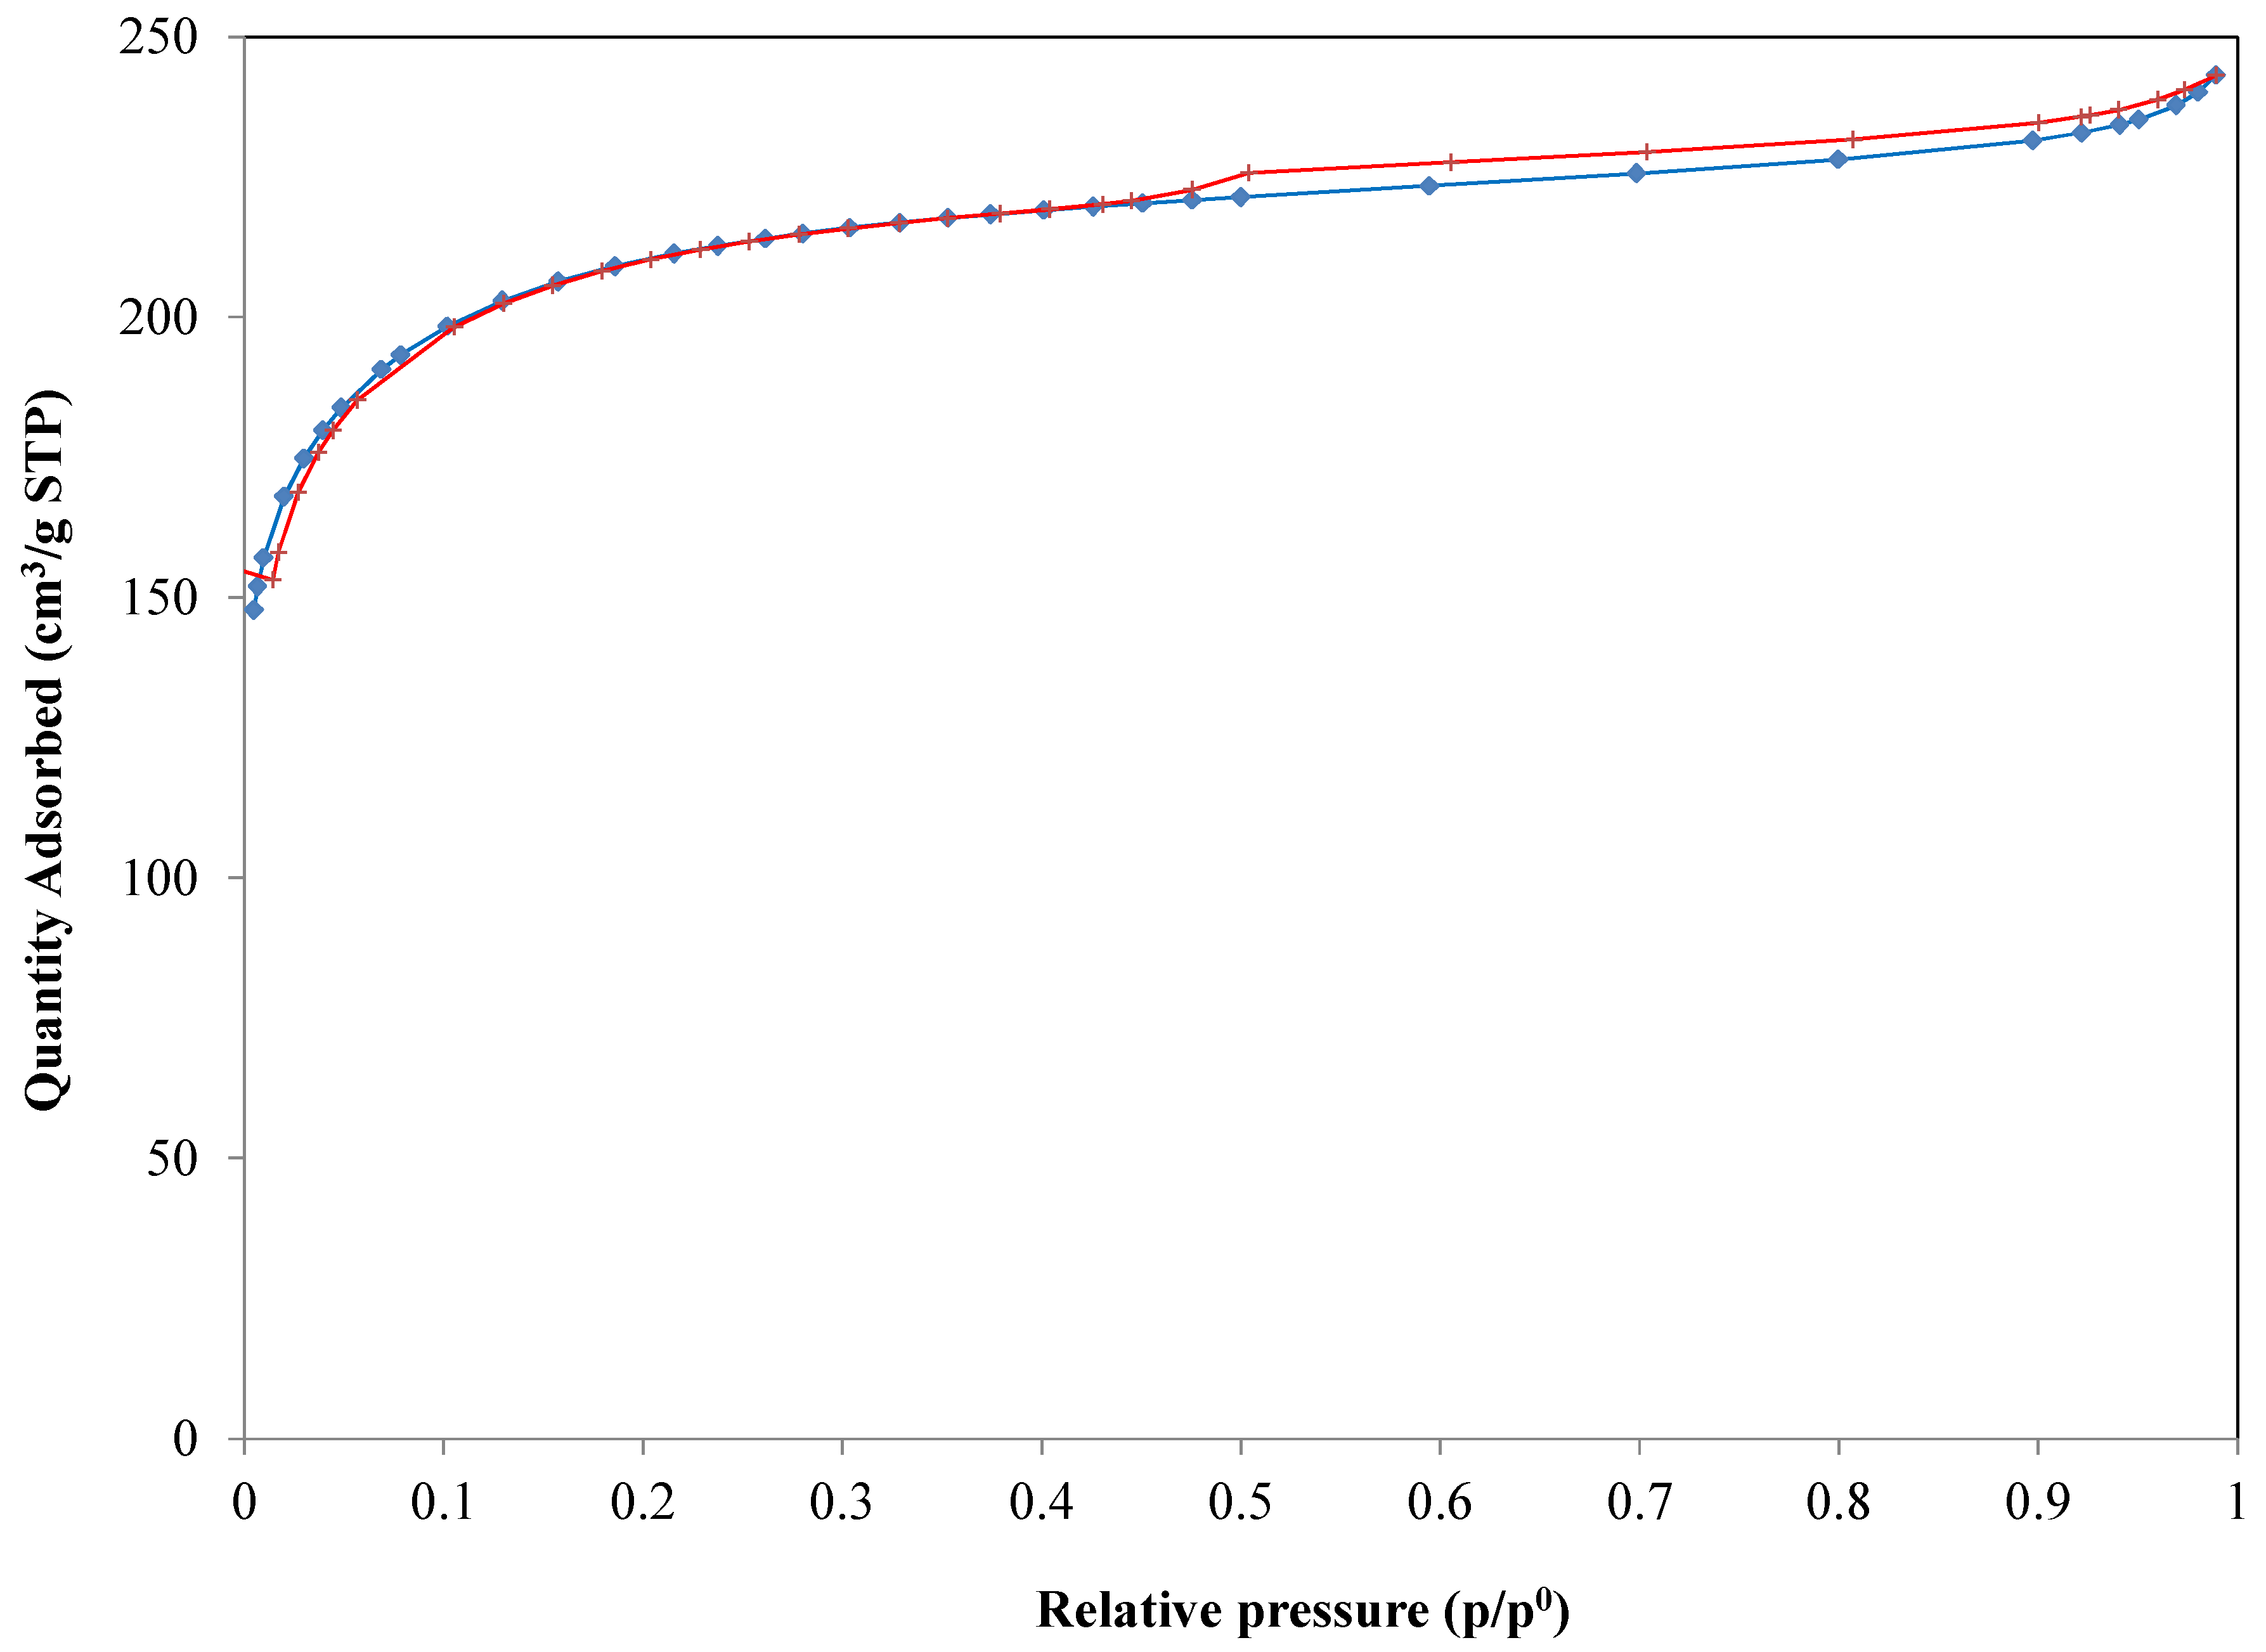
CKC was characterized through nitrogen adsorption–desorption at the temperature of 77 K using a computer-controlled Micromeritics ASAP 2020 Plus apparatus (Micromeritics Instrument Co., Norcross, GA, USA).
The specific surface area, which helps to understand and to classify sorbents for trace compounds removal, was determined applying the Brunauer, Emmett and Teller (BET) method to the adsorption data (
Figure 1). Micropore volume (pores < 2 nm) was calculated using the t-plot method. This method is the most commonly used to determine the volume of microporous materials. It is based on standard isotherm data and thickness curves which describe the statistical thickness of the film of adsorptive on a sorbent surface.
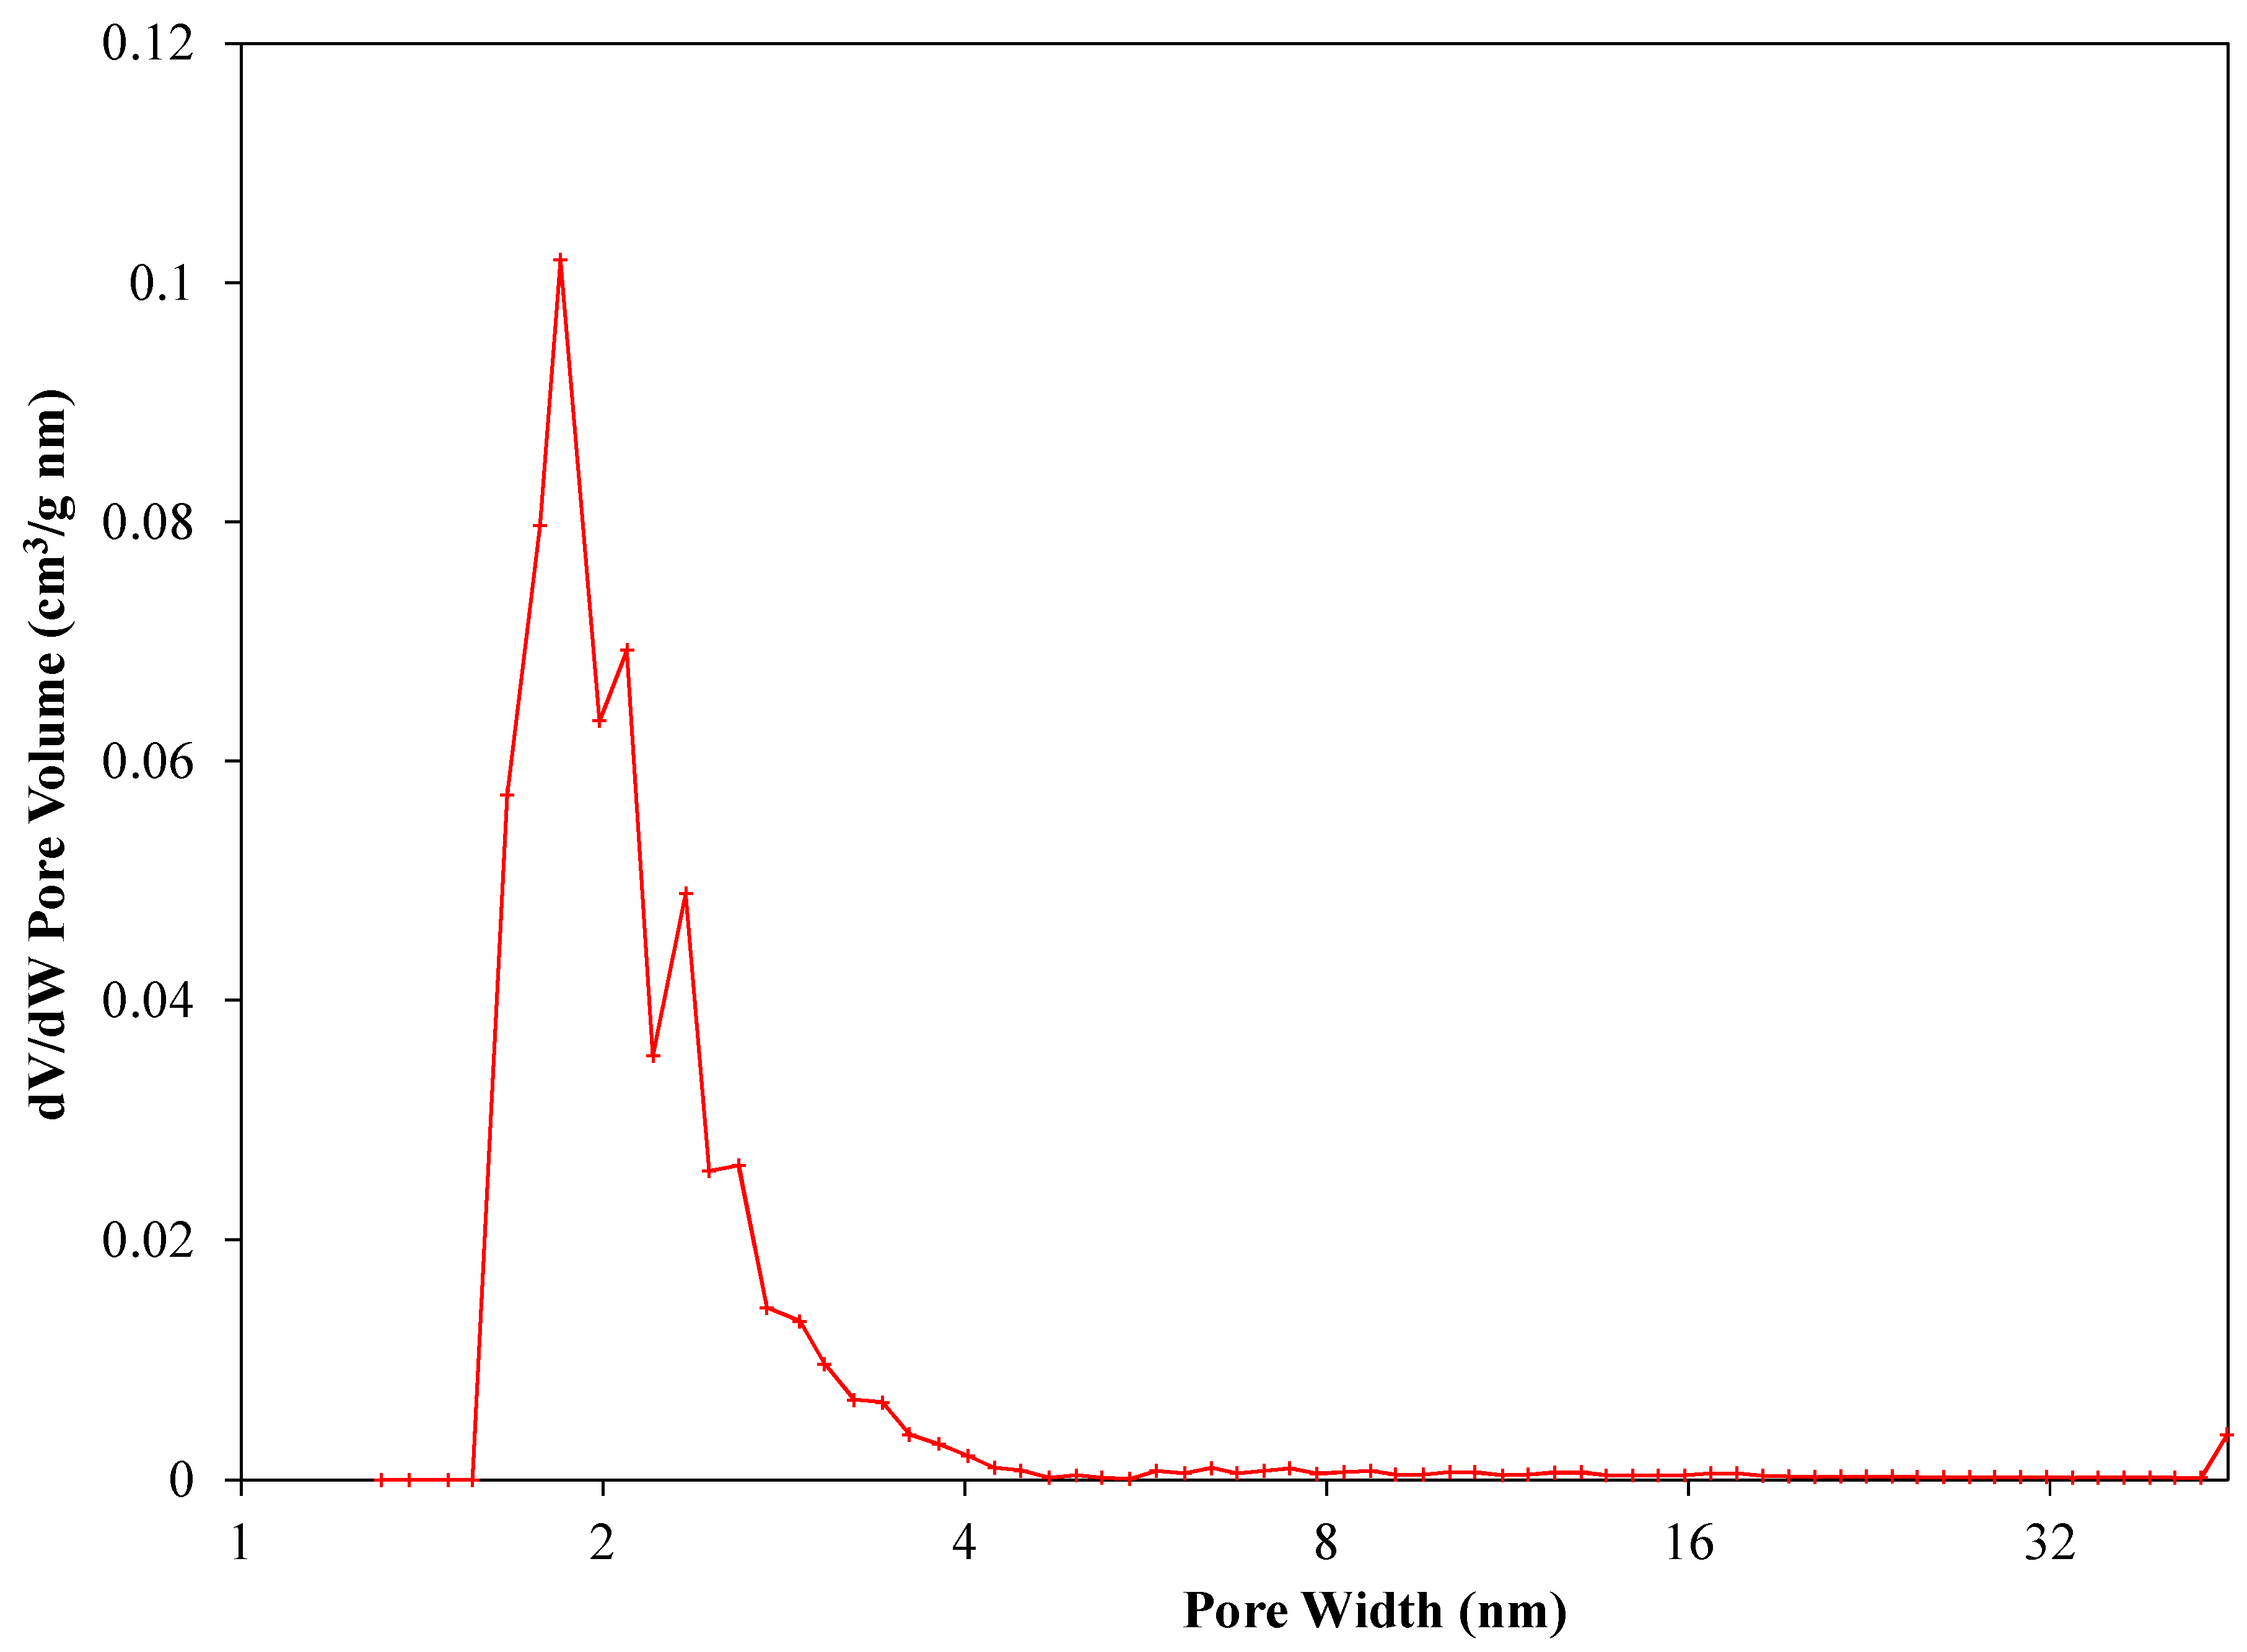
The pore-size distribution (
Figure 2) was determined through the Barrett, Joyner and Halenda (BJH), method from experimental isotherm data using the Kelvin model of pore filling.
Table 1 summarizes the main results for the carbon adopted.
From the analysis results, high values of BET specific surface area were calculated. Moreover, CKC samples are microporous, and an important contribution to the BET specific surface area is due to the adsorption of the nitrogen molecules in the micropores. For these reasons, the use of this carbon is suitable for the contaminant-adsorption purpose.
CKC was further characterized in terms of chemical composition using energy-dispersive X-ray spectroscopy (EDS, EDX or EDXS). This is an analytical technique for the elemental analysis of sample, which relies on an interaction of some source of X-ray excitation and the considered sample. The chemical composition can be very useful to understand how the surface impregnation affects the adsorption dynamics, the adsorbent interaction with contaminant molecules and the adsorption capacity itself.
The EDS analysis (
Table 2) revealed that the carbon is mainly composed of carbon and oxygen, as expected, and by traces of potassium (K) and iron (Fe). These data are an average evaluation of five samples, and the precision ranged around 5%.
Figure 3a is an SEM image of the region analyzed for the chemical characterization of the sample. The field of view (FOV) is the area considered for the analysis, and it is a square with dimension of 174 μm.
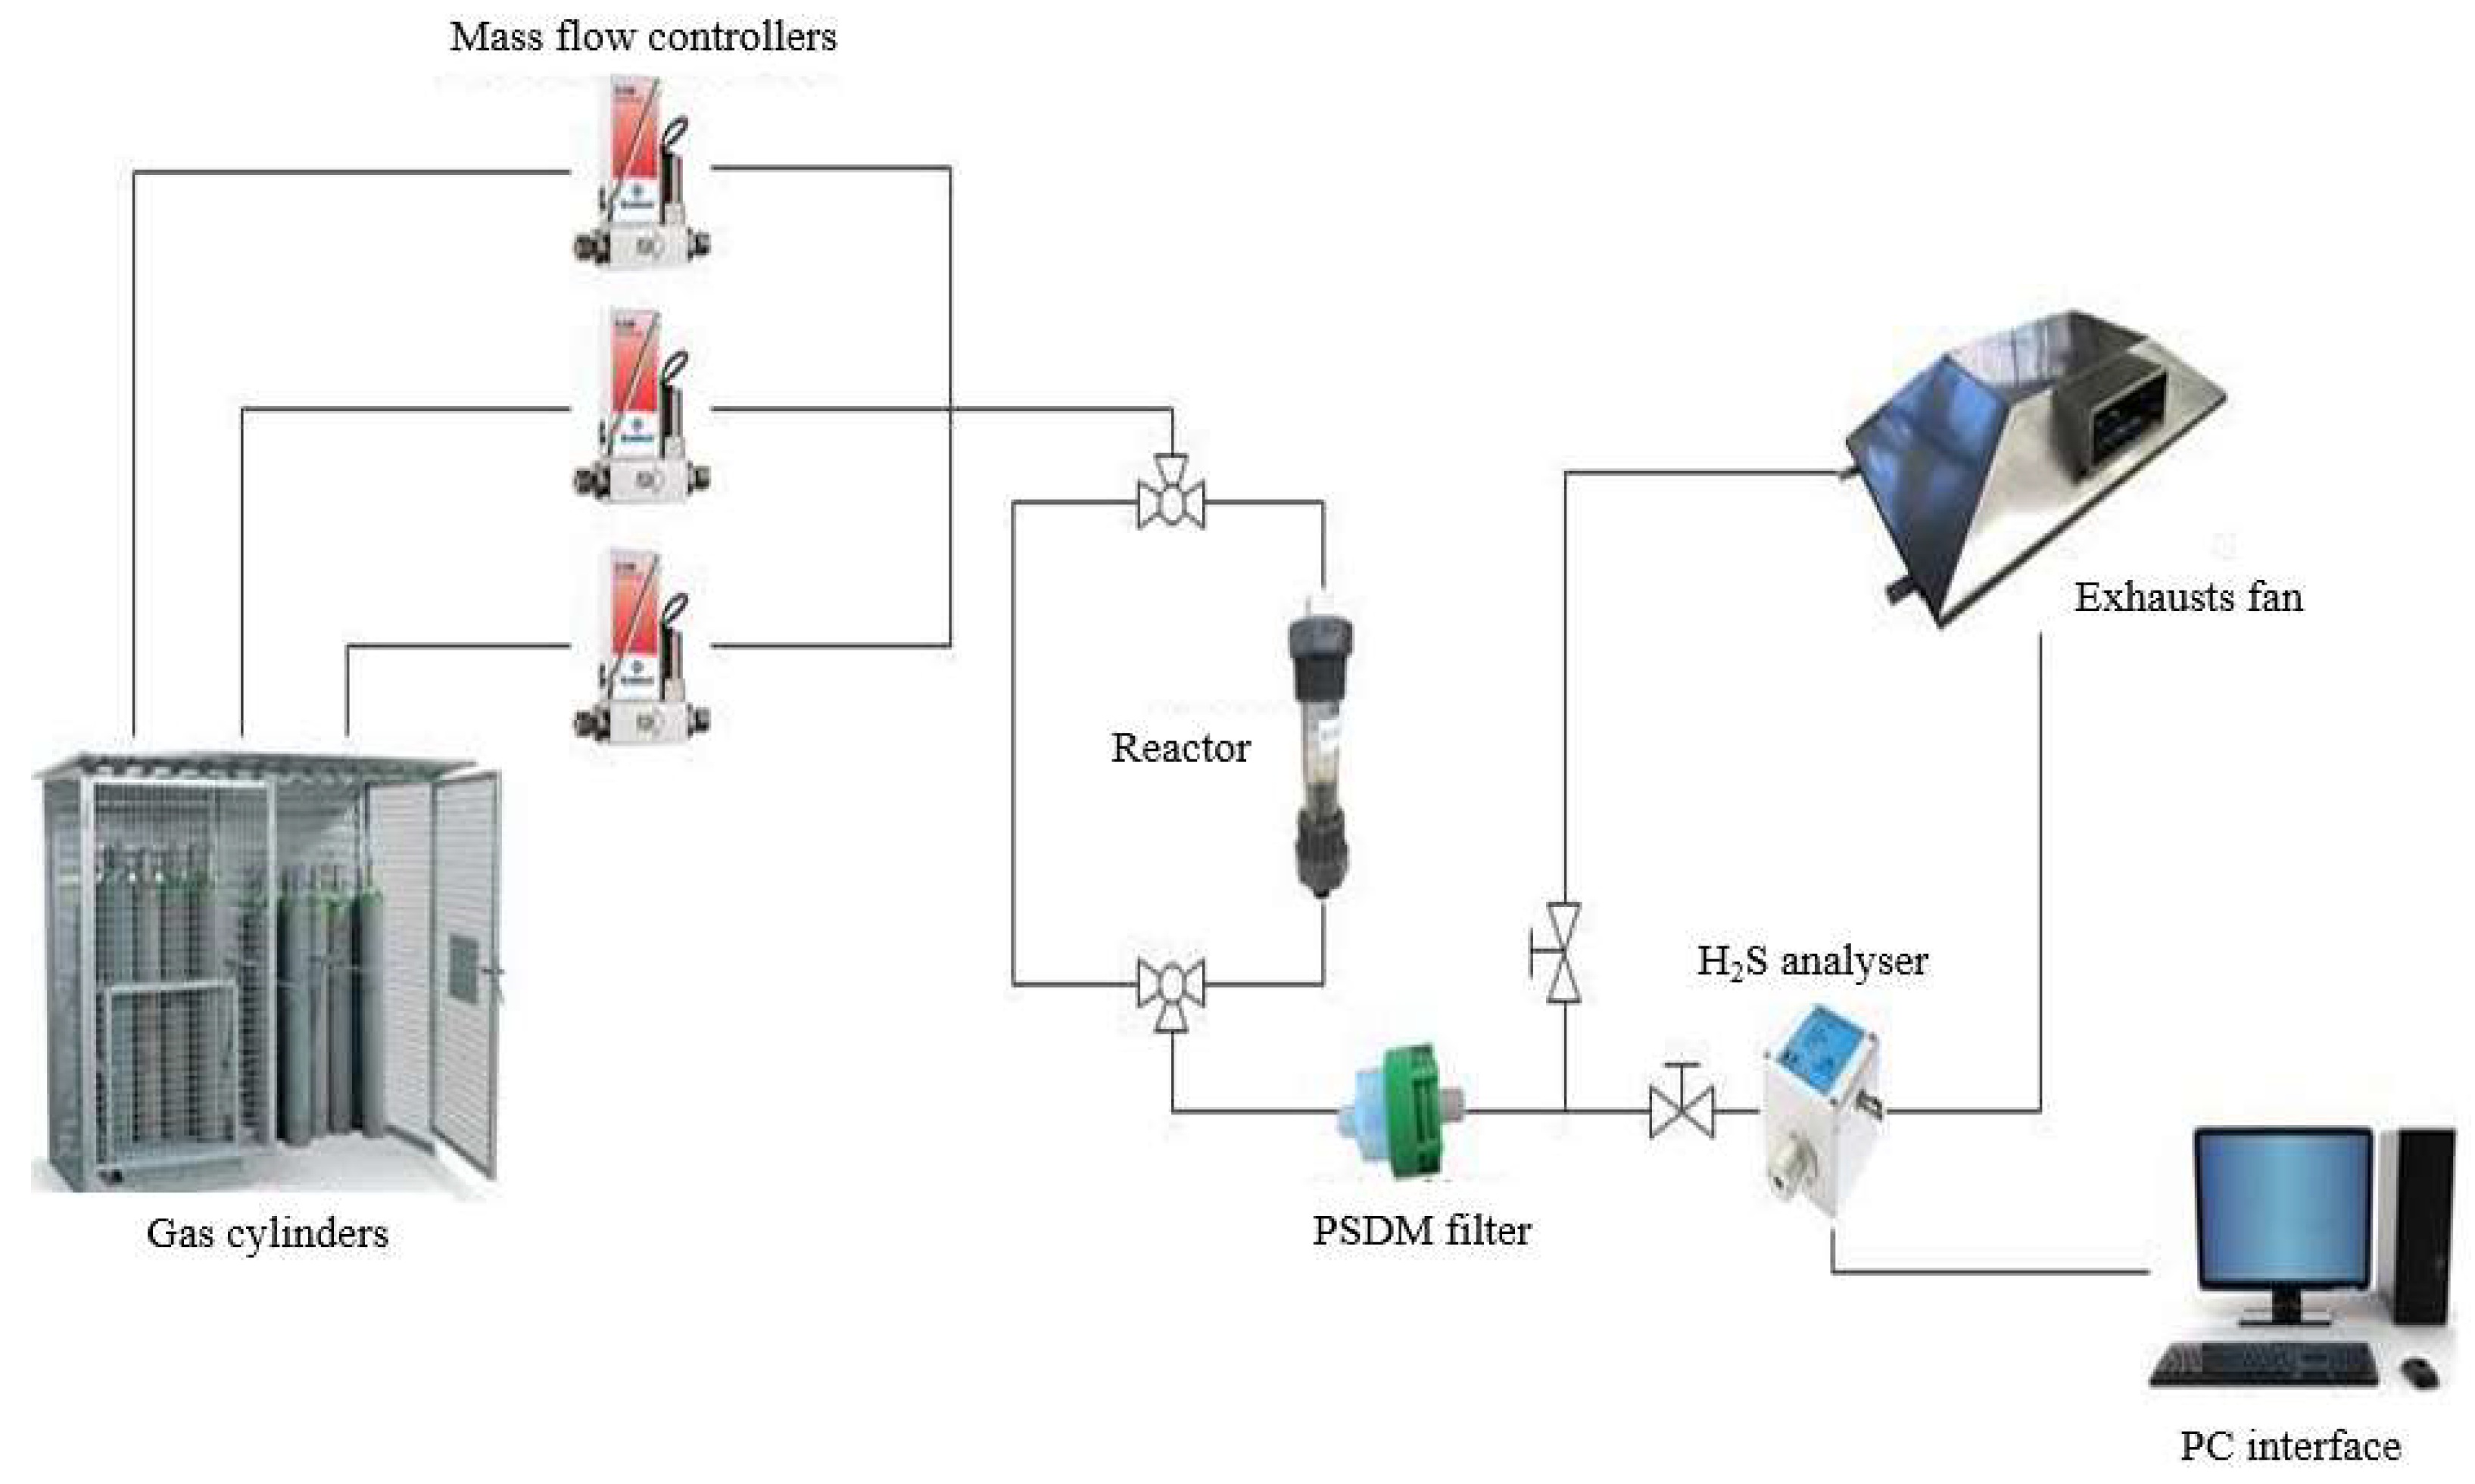
2.2. H2S Removal Tests: Experimental Apparatus
For the tests at the Energy Department, a simulated version of the biogas produced at the WWTP site of Collegno was obtained by balancing the flow rates of the main components (CH4 = 63% and CO2 = 37%) and the concentrations of H2S and oxygen. The total volumetric flow was fixed to 950 NmL/min. Bronkhorst Mass Flow Controllers (MFCs; EL-FLOW, Bronkhorst, The Netherlands) were used to select the correct flow rate of each gas in order to obtain the desired simulated biogas mixture, using gas cylinders (SIAD srl, San Severo, Italy).
The activated carbons for the adsorption tests were packed inside a reactor (D = 25 mm, L = 42.5 mm) with sterile gauze to avoid dragging phenomena by the gas stream. A fundamental aspect in the design of the reactor, both in experimental activity and in real plant application, is the “aspect ratio” (D/d). This value should be higher than or equal to 10 to have a good bed packing. If the aspect ratio is too low, wall effects with a strong decrease in removal performance are expected [
39].
After the reactor, the simulated biogas passes through a polydimethylsiloxane membrane filter (PDSM) with a dimension lower than 2 μm, in order to reduce the risk of sensor fouling.
The analyzer used for the tests is the MECCOS® eTr transmitter (Leopold Siegrist GmbH, Karlsruhe, Germany). It is an instrument for the immediate and continuous monitoring of gas concentrations that uses an electrochemical sensor as a transducer. The current produced from the sensor ranges from 4 to 20 mA that corresponds to a concentration range of 0–200 ppm(v) for H2S. Finally, the connections with the data acquisition card (National Instruments Corporation, Austin, TX, USA) are transferred to a Labview script.
2.3. Test Bench for Sorbent Regeneration
For the regeneration part, an electrical oven was used and controlled by a proportional integral derivative (PID) system (Horst Microprocessor Temperature Regulator HT MC1, Darmstadt, Germany). The carrier gas is regulated by MFCs (EL-FLOW, Bronkhorst, The Netherlands). The electrical oven is able to provide 500 W of electrical power.
The temperature and power regulation were achieved thanks to a K thermocouple (Tersid, Italy). In this device, the carbon exhausted is allocated in an alumina tube reactor with an internal diameter of 14 mm. The oven is preheated until the desired temperature; then, the reactor is allocated inside the furnace, and N
2, CO
2 or air are fluxed for specific time periods into the reactor. Finally, the regenerated carbon is allocated in the reactor shown in
Figure 4 for the re-adsorption test.
2.4. Contaminant Measurement and Adsorption Capacity Calculation
The temporal evolution of sulfur compound concentration was recorded in the Labview script. This information was adopted for the calculation of the adsorption capacity of H2S. This value quantifies the activated carbon’s performance.
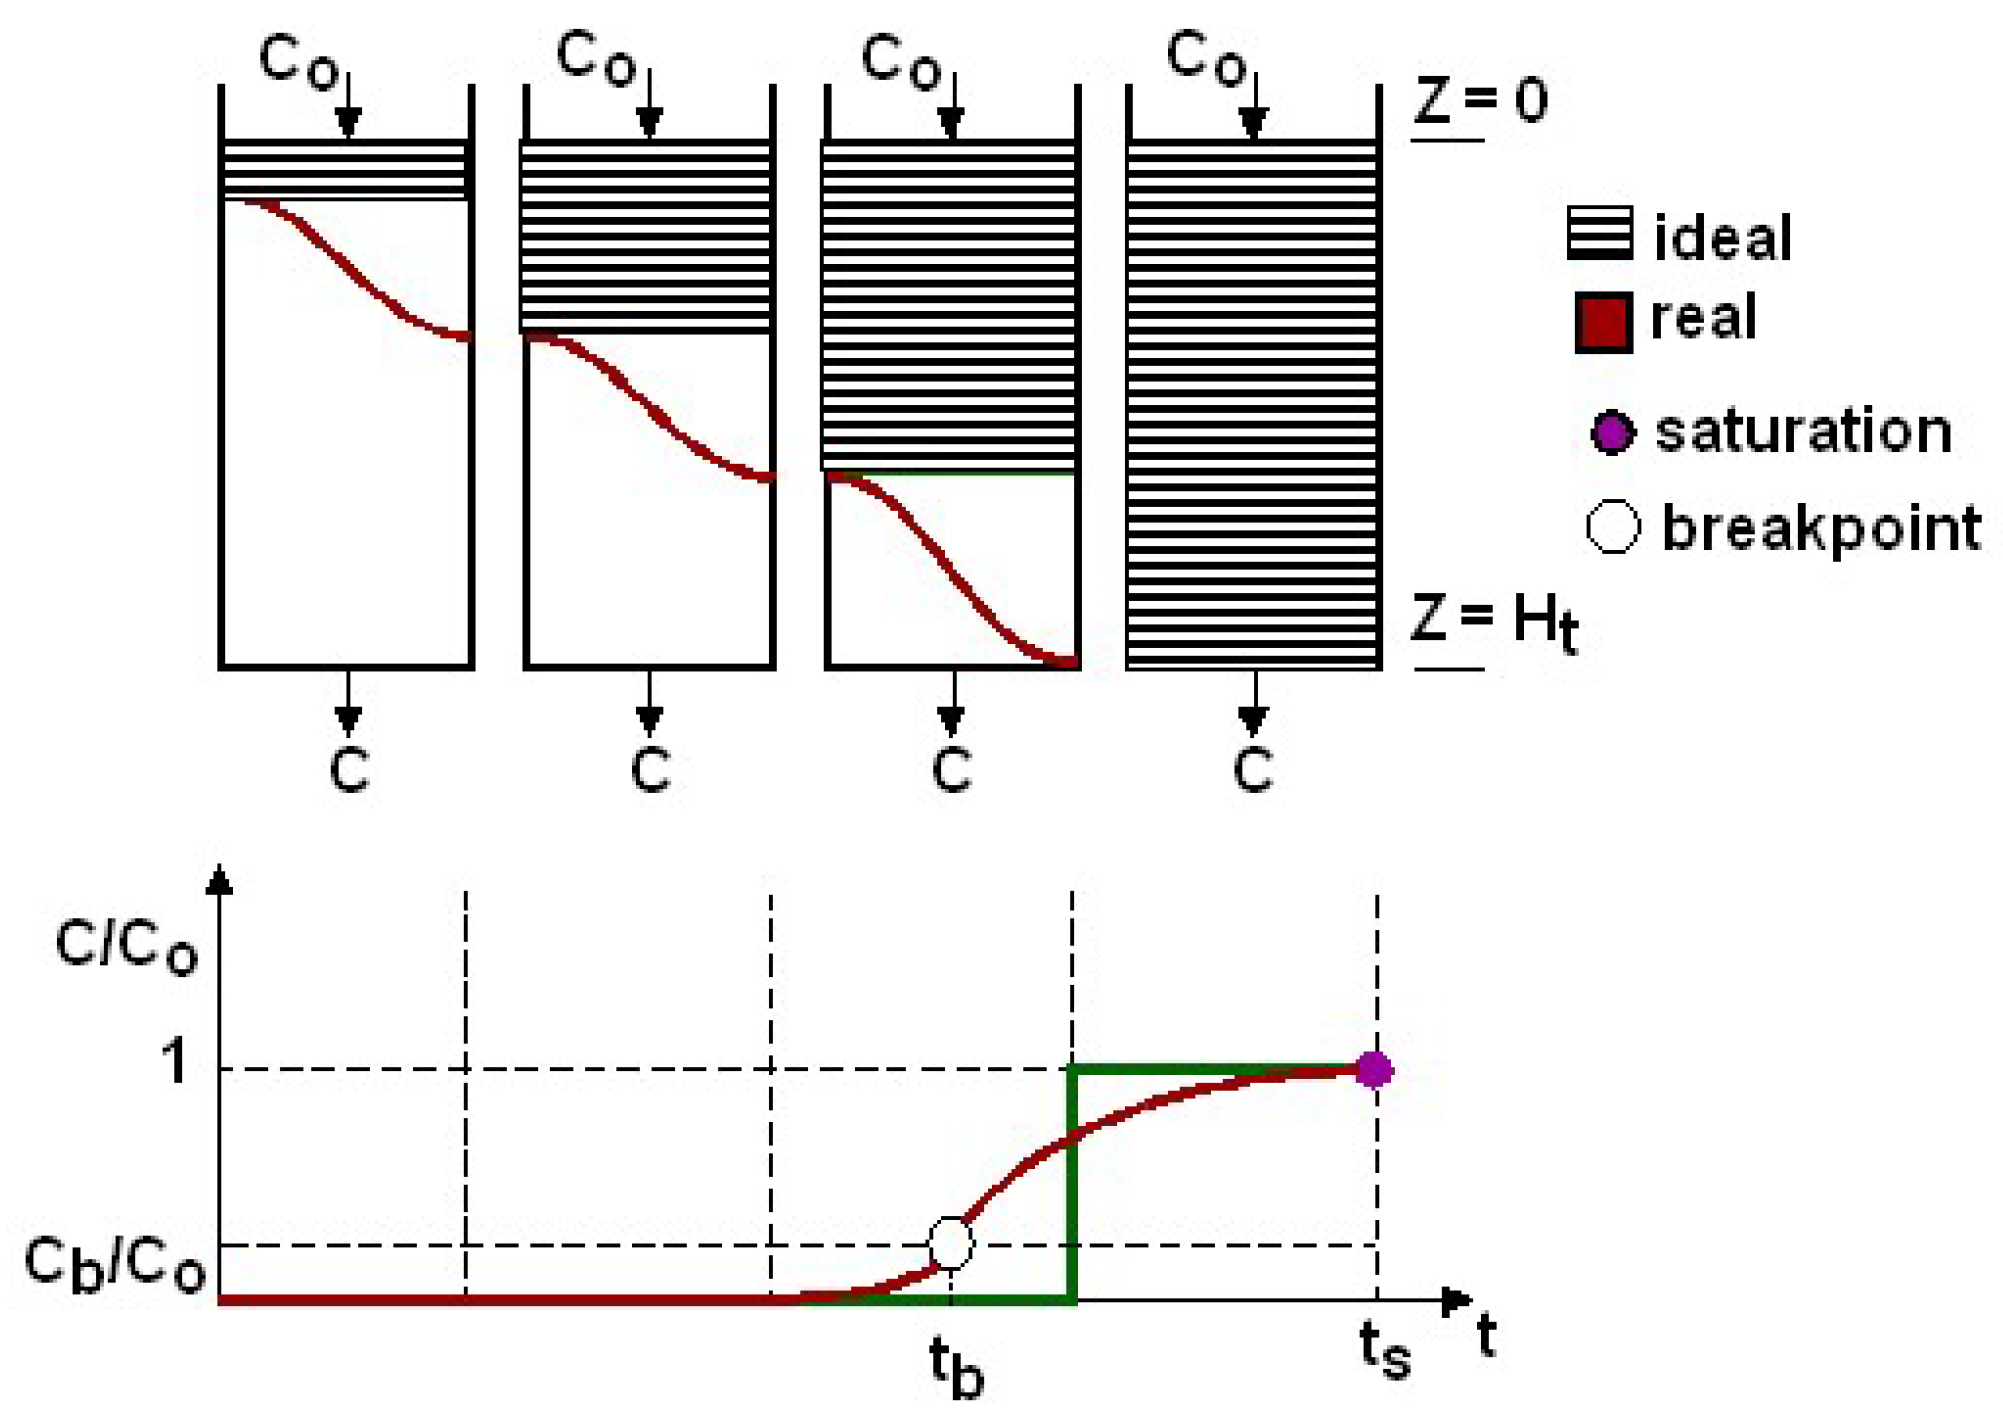
The adsorption capacity can be calculated at breakthrough or at saturation (see
Figure 5).
The breakthrough adsorption capacity was used because the clean-up reactors must prevent H
2S that is at concentration higher than 0.25–0.3 ppm(v) from reaching the fuel cell. It was determined by the following formula, expressed in terms of sulfur removal:
The parameters in the equation are:
the sulfur rate entering in the adsorbent bed, (g/s);
the AC weight in the bed, (g);
the breakthrough time, (min), i.e., when the concentration downstream the filter starts to be different from zero or, more precisely, when the oscillations of the H2S measurement start constantly to range from 0.2 to 0.5 ppm(v).
3. Results and Discussion
The performance of CKC for H2S removal was evaluated under different conditions, considering also the effect of a trace concentration of oxygen in the biogas mixture. Then, the regeneration of activated carbons with three different carrier gases was studied.
3.1. Activated Carbon (CKC) Performance Improvement with Oxygen
According to the literature [
28,
35], the trace concentration of oxygen in the biogas plays a significant role in the H
2S adsorption. Depending on the type of carbon, the entity of improvement can change. This behavior for the considered carbon was not studied.
Always considering the same “boundary” conditions used in the SMAT clean-up section (L/D = 1.7; biogas velocity = 0.038 m/s), the removal results are shown in
Table 3.
The sample weight ranges from 12.5 to 12.7 g, since we have fixed L/D to 1.7. The breakthrough time was calculated considering Equation (1), where the breakthrough time is obtained from the Labview program.
The adsorption capacity without oxygen in the biogas is slightly higher than the reference values at an operating temperature of 100 °C and breakthrough concentration of 1 ppm(v) [
41,
42]. Considering that the operating temperature selected was around 20 °C, this carbon has better H
2S adsorption performance than results from literature [
41].
Starting from these experimental data, an experimental correlation was elaborated, as shown in
Figure 6. An almost logarithmic correlation between the oxygen percentage and the adsorption capacity was found, with
= 0.9832.
This model was elaborated for SMAT conditions, but it could be applied to any inlet H2S concentration or biogas speed, even if less strictly, with similar trends (results unpublished).
It is clear that increasing the concentration of oxygen the increases the removal performance. However, the biggest increase of adsorption capacity is reported for the lowest oxygen concentration (adsorption capacity at 0.1% (vol.) of oxygen is almost 3 times as great as that previous in the figure). In this analysis, the oxygen amount in the biogas was kept as similar as possible to the real plant.
Activated carbon provides a catalytic surface for oxidation to elemental sulfur and sulfate, which significantly enhances the removal capacity of H
2S. In presence of oxygen, the following reaction takes place [
28]:
The elementary sulfur is adsorbed onto the internal surface of the activated carbon. Higher concentrations of oxygen reduce the performance of activated carbon, as reported from literature studies [
43]. From these results, it was decided to monitor continuously the biogas and add an opportune quantity of oxygen using air in order to steadily increase the carbon performance lifetime.
3.2. Regeneration
For the evaluation of regeneration efficiency, the most suited method is the calculation of “regeneration ratio” [
44].
where
X is the mass of sorbate (H
2S) and
M is the mass of sorbent.
According to the definition, Rr can be evaluated by comparing the adsorption capacity of virgin carbon to the adsorption capacity of regenerated carbon. For each regeneration test, the procedure to calculate Rr followed this guide line:
- (1)
Adsorption test on virgin CKC sample and calculation of breakthrough adsorption capacity with the same method used in the previous paragraph;
- (2)
Regeneration of the exhausted sample according to the selected time and atmosphere condition;
- (3)
Adsorption test on regenerated sample and calculation of breakthrough adsorption capacity with the same method used in the previous paragraph.
Considering to the literature studies [
37,
38], parameters were set for the regeneration tests:
gas flow rate: 200 NmL/min;
regeneration time: 15 min, 75 min, 180 min;
Temperature: 100 °C, 200 °C, 300 °C.
According to the literature, the gas flow rate does not affect the regeneration, while the most important parameter is the temperature and/or the regeneration time, as appropriate. Three different values were selected in order to understand how Rr changes with the temperature. For each different gas used for regeneration, depending of the obtained results, these parameters were selected and modified in order to search for the best solution in terms of regeneration ratio. In this work, the temperature investigation for the regeneration was focused to relatively low temperatures in order to consider the waste heat from industrial processes, such as from the flue gases from energy production with SOFC systems.
3.2.1. Regeneration with Nitrogen
The phenomenon governing the regeneration under an inert atmosphere is pyrolysis, which can be carried out under different ranges of temperatures and time. This type of thermal regeneration is responsible for thermal decomposition of adsorbed matter, in this case H
2S molecules, thermal cracking and desorption of decomposition products [
38,
39]. This treatment is a “soft” treatment, which causes minor damages to the narrow microporosity and a high recovery of the pore volume and surface area, responsible for physical adsorption, whose entity depends on regeneration temperature [
37].
The results of tests with N2 are shown below.
As reported in
Table 4, the regeneration ratio values (i.e.,
Rr) are very close to each other. Considering also the thermal and electric expenditure to reach the experimental desired conditions, the best regeneration with N
2 is the thermal treatment at 200 °C.
In
Table 5, comparison of the sample weights is shown: the weight loss increases with the temperature. It is reasonable to think that this is due to a better sulfur and volatile organic compounds (VOCs) removal with increasing temperature during the regeneration.
An improvement of regeneration efficiency with a temperature increase was expected. The regeneration time exposure of 180 min was close to the optimum. In fact, a worsening of regeneration efficiency was observed when increasing the regeneration time to 270 min at 200 °C—the best condition—where the performance collapsed to a regeneration ratio equal to 0.052, shown in
Table 6.
Unlike the previous test campaign, the regeneration with N2 with a shorter treatment time showed the worst results obtained. It indicates that 75 min was not enough time to guarantee the complete occurrence of the processes involving pyrolysis.
Finally, considering this temperature range, it can be assumed that 180 min treatment is the best solution under an inert atmosphere, whose regeneration does not depend strongly on the temperature, but rather on time. The temperature dependence could be more obvious at higher temperatures of regeneration, where thermal decomposition of the carbons is much more likely to occur.
3.2.2. Regeneration with Air
It is well known that the regeneration of carbon sample in an air atmosphere results in oxidation reactions [
37]. This may have an effect on the pore structure, which can be recovered after the regeneration, and a little increase in the pore volume and surface area is usually noticed. The removal of carbon atoms from the sample is due to their reaction with oxygen. If sulfuric acid forms during adsorption, air regeneration is not able to remove it from the sample. This is due to the bond strength with the carbon—the reduction to sulfur dioxide can sometimes occur, with a consequent sulfur removal. The air treatment may be considered as a treatment similar to the nitrogen condition, but, because of the presence of oxygen, it is usually more efficient.
The main drawback of this regeneration process is related to the limitation for real applications at the industrial scale due to combustion problems. The test campaign results are shown in
Table 7.
The regeneration with air showed how CKC carbon is highly reactive. Indeed, although 75 min treatment was a short time period under an inert atmosphere with nitrogen, in this case it can be considered too long a time period. This is due to the removal performance of carbon decreasing compared to that with a shorter time period. This thesis is confirmed both by the weight loss—the highest recorded so far, which has not found a match with a good regeneration efficiency—and by a small amount of ash on the sample, probably due to a partial combustion occurring (
Table 8). The same phenomenon, but less clearly, was observed at 300 °C and 15 min of regeneration exposure. Indeed, in this case, a higher value of regeneration ratio was recorded. Finally, the test at 200 °C and 75 min was carried out to study the dependence on the temperature: the regeneration ratio increases with the temperature. In this case, no ash content was recorded after regeneration.
Considering the results obtained, sulfur removal efficiency with the regeneration in air registered lower performance than in the literature [
37].
3.2.3. Regeneration with Carbon Dioxide
Unlike the regeneration with nitrogen, the regeneration with CO
2 involves an oxidative process, where a chemical reaction between the oxidizing agent (CO
2) and the carbon occurs. This reaction is catalyzed by alkaline and earth-alkaline metals, which are contained in CKC. Catalytic oxidation is responsible of localized partial gasification of the carbon material. Partial destruction of narrow micropores and the formation of larger dimension pores occur [
38]. This treatment is “harder” than nitrogen, but should guarantee better performances, since reactions with SO
2 or S previously adsorbed can occur. The economic and logistic advantages of exploiting CO
2 for carbon regeneration directly at the WWTP site is a crucial point. In this case, we could have three different solutions for a regeneration system [
45]:
- (1)
Pure CO2 could be captured after both water removal and purification from the other gases at the exit of the fuel cells’ anode, whose flux is mainly composed of CO2 and H2O (steam), while O2 and N2 are contained in traces;
- (2)
Pure CO2 could be captured from the biogas as it is before the clean-up system (in this case, there would be also an advantage in terms of CKC adsorption performance, since CO2 is in competition with H2S and, as we know, does not participate in anode reactions);
- (3)
The exhausted flow from the anode could be also used for regeneration, even if safety problems should be taken into account. In addition, steam and CO
2 are sometimes used together as a regeneration technique [
38].
About the first two options, some solutions can be exploited for the CO2 capture. As far as the experimental part concerns, tests were carried out with pure CO2, whose results are shown here.
According to
Table 9, thermal treatments at 100 °C and 300 °C are the best solutions when the duration of regeneration is 180 min. Considering the same conditions used for inert regeneration, we can observe a clear improvement with CO
2 compared to N
2. In fact, a reactive atmosphere with the carbon occurred. However, an anomaly at 100 °C has been found, since a linear increase of regeneration ratio with the temperature was expected. This can be due to an excessive thermal treatment duration, which causes a too high regeneration ratio at 100 °C, and a performance drop at 200–400 °C. This test at 400 °C has been carried out in order to find the temperature limit for this carbon. Considering a range of low temperatures, and according to the results, we can deduce that 300 °C is the best temperature condition, since it can suffer from higher temperatures and undergo damages on its surface. However, likewise to the inert regeneration, it could be interesting to study the regeneration with CO
2 at higher temperatures, where we could have two opposite contributions: the appropriate occurrence of gasification reactions on one side, and damage to the particles due to an overly reactive atmosphere.
The weight losses observed in the samples, shown in
Table 10, confirm the trend of
Rr with temperature, since the highest value is recorded at 300 °C and caused the highest sulfur removal.
As previously done for inert atmosphere, further analysis was carried out in this case also, reducing the regeneration time to 75 min. Unlike the inert atmosphere, a clear improvement is observed at 300 °C. This regeneration ratio value is the best result found and it is in line with the objective, considering the reference values found in literature [
37]. In addition, the weight loss of 13.3%—from 12.8 (virgin carbon) to 11.1 (regenerated carbon)—is the highest recorded value. This is a sign of efficient removal of adsorbed species during the regeneration [
37].
3.2.4. Regeneration with Carbon Dioxide after Adsorption with Oxygen in Biogas and Removal Performance of Activated Carbon
The experimental test campaign was completed through the implementation of the regeneration of the more realistic case, i.e., considering the trace concentration of oxygen in the biogas during the adsorption.
The regeneration with CO2 was exploited, since so far it has given the best results in terms of regeneration ratio. However, considering that the oxygen causes a high improvement of the adsorption performance, the optimal treatment time may be different compared to the no-oxygen case.
The analysis was focalized on the treatment time, comparing the results between 75 min and 180 min, as shown in
Table 11 and
Table 12.
In this case, the efficiency of regeneration is lower than the best situation without oxygen, shown in
Table 9. However, the regeneration ratio shows an opposite behavior with the exposure time. Indeed, without oxygen, it increased when reducing the treatment time. Here, it increases with longer treatment time. The larger amount of adsorbed species obviously requires a longer period of regeneration, and it is confirmed by the literature [
46].
Future works are necessary to find the optimal treatment time for CO2 regeneration, with an oxygen percentage different from zero in order to achieve the best regeneration ratio value, which is 30%, according to this work.
4. Economic Evaluations
Given the results obtained in the tests, the cost evaluation for H2S adsorption reactors was carried out, considering two different scenarios: carbon disposal once breakthrough is reached, and carbon regeneration and disposal after the second adsorption cycle.
The SMAT real plant configuration was used in the calculation, where there are two vessels for H2S adsorption, each vessel containing 250 kg of CKC.
The investment cost, i.e., the installation cost of the reactors, is the same in both scenarios, as shown in
Table 13 (data provided by Bio-komp Company, Villaverla, Italy).
Assuming that the reactors are both changed when H
2S breakthrough concentration is detected, in the lead and lag configuration, the replacement cost is different among the two scenarios, as shown in
Table 14.
The final calculations for a plant lifetime of 4 years were performed and are shown in
Table 15, where an interesting comparison between the two scenarios is made.
The adsorption capacity of virgin CKC is the value found in the analysis of CKC performance with different oxygen percentages in the biogas, and it refers to 0.1% (vol.) of oxygen, chosen as the average value during the plant lifetime. The adsorption capacity of regenerated CKC is the value found in the best situation for regeneration, i.e., CO2 at 300 °C and 75 min treatment.
The cost evaluation proves the applicability of regeneration to the real case, since it would be efficient both in environmental and economic terms; according to these estimates, this could lead to savings of about 35,000 €, carbon needed for the reactors and, consequently, amount of carbon to be disposed.
5. Conclusions
In this work, the experiments were focused on the removal of H2S with commercial sorbents, considering different regeneration agents, such as nitrogen, carbon dioxide and air. The adsorption process was experimentally investigated in fixed-bed reactors with comparable real plant conditions.
An experimental test for H2S adsorption removal was elaborated, starting from the adsorption capacity calculation with three different oxygen concentrations in the simulated biogas. The oxygen concentrations used for the investigation were: 0.1%, 0.3% and 0.5%, considering the biogas composition from the real wastewater plant. Commercial sorbent showed an adsorption capacity linearly dependent on increasing oxygen concentration. These results were encouraging, especially for the real case, where the average oxygen concentration was 0.1%.
In the second part of tests, the regeneration process was deeply studied on the selected commercial activated carbon. Preliminary literature research was necessary to identify the regenerating agents: inert atmosphere, carbon dioxide and air regeneration caused partial combustion of the carbon sample at 300 °C both with 75 min and 15 min. At 200 °C, no combustion occurred—here, the efficiency of regeneration resulted in a better performance than with an inert atmosphere. Unfortunately, the dangerousness and difficulty of controlling the partial oxidation reaction is the main drawback for the real case. Regeneration with CO2 showed the best regeneration ratio values. In particular, the best conditions achieved were 300 °C and 75 min of thermal treatment time, with a regeneration ratio of 30%. Then, the cycle adsorption/regeneration with CO2/adsorption was applied to CKC, adding a trace concentration of oxygen to the biogas mixture (0.1%) and guaranteeing its applicability to SOFC, thanks to lower costs for the clean-up system, carbon needed for the reactors and amount of carbon to be disposed.
The results achieved without the oxygen content in the biogas mixture showed lower performance. Future investigations are needed that consider the scale up of the regeneration with carbon dioxide.


