1. Introduction
In the last decade, a low-carbon economy has become a priority in the European Union (EU) and numerous political programs support it, including the climate strategy until 2050. By 2050, the EU aims to reduce emissions by 80–95% compared with 1990 levels as part of the efforts required by member states as a group [
1] In addition, the European Commission developed a roadmap for moving towards a low carbon economy by 2050, and decarbonization priorities of electricity and heat production are included as separate strategies [
2]. For the power generation sector, the goals are very high. The desired reduction is set up in the range between 93% to 99% relative to 1990 levels. The EU has committed itself to the de-carbonization of Europe’s electricity supply system [
3].
In December 2018 the new rules for making the European electricity market more sustainable have been provisionally approved by negotiators from the Council, the European Parliament and the European Commission. The “Clean Energy for All Europeans” package has been published. The agreement expands and specifies the main targets set up in previous agreements on the Governance proposal, the revised Energy Efficiency Directive, the revised Renewable Energy Directive, the Energy Performance in Buildings Directive and the Regulations on Risk Preparedness and the Agency for the Cooperation of Energy Regulators [
4].
One of the key points in this package is the continuation of stressing the importance of flexibility in the electricity markets, via the reorganization of the Electricity Directive and Regulation in consideration of “demand response”, as defined in the Directive in 2016 [
5]. “Demand response” refers to final customers’ changes in electricity load in response to market signals. In addition, the “Clean Energy for All Europeans” package suggests consumer empowerment focusing on active participation of final consumers in electricity markets activities [
5].
In order to comply with EU legislation, Finnish energy providers have gone through a number of infrastructural changes and have also defined new communication strategies with consumers. As a primary strategy, Finnish combined heat and power (CHP) plants have pledged to switch from coal and peat as fuel to low-carbon sources. Adding solar and wind power into the energy mix is also encouraged. All of these changes require large investments from energy companies and, at the same time, create a diversity of energy sources. Therefore, the supply chains diversification strategy became an important element on the Finnish energy market.
Diversification of electricity supply on a regional level supports decentralization of energy systems and brings flexibility. At the same time, it brings a challenge to keep the production process uninterrupted since the supply of renewables has seasonal fluctuations.
Decentralized energy production systems have not only a higher potential for environmental sustainability in terms of CO
2 emission reduction but also enhance energy security for the region, create jobs and training opportunities as well as boost regional development. Decentralized energy systems have also been proven to have higher reliability and resilience [
6]. Large centralized production systems are driven by production efficiency benefits with high commercial validity; however, they have been criticized for hiding the social cost of production and increasing risks of unsustainable practices [
7]. Small and medium-scale decentralized projects and value chains support local and rural development, create employment, provide energy security, and contribute to climate change mitigation. They are also easier to control and adjust if necessary by local government.
The EU has the third largest energy consumption in the world, and that creates number of challenges regarding its future energy supply. Challenges such as rising demand for electricity, emerging economies competing for critical resources, and the instability of the Middle East force the EU to set up new targets and build new policies in order to provide energy security for the region as well as tackle the climate change problem [
8].
The importance of diversification of the EU’s electricity supply is paramount due to recent legislative measures. Wider diversification will allow reduced energy dependence and enhanced energy safety and security inside the EU. Well-designed regional and national policies of source diversification together with efforts to operate on the EU internal energy market allow using benefits of a competitive EU energy market. This way the levels of security of supply can be increased [
9].
To illustrate how clean energy transition and decentralized electricity production can improve regional social resilience and sustainability, we studied the structure and the multiple electricity supply chains of Oulun Energia (OE) energy provider, located in the northern part of Finland. Regional electricity suppliers such OE serve as an example of regional energy diversification, providing various options to local consumers. The company offers not just electricity as a service but also involves consumers in the company’s activities, thus influencing flexibility and access to the electricity market.
In this paper, we emphasize the importance of social impacts of a clean energy transition on a regional level. We believe that social sustainability of energy production is critical to the sustainable development of regions and humanity as a whole. We focus our research on the sustainability of electricity production in the Oulu sub-region.
The objective of the article is to show the current state of social sustainability in the Oulu region in relation to OE as the main electricity provider. We evaluate OE’s electricity operations as well as investigate how multiple-sourcing and socio-ecological intergradation of supply chains may improve the overall resilience of regional electricity supply chains and, at the same time, boost the socio-efficiency of local communities through building effective relations between a company’s value added and its social impact on a local level. We explore the concept of socio-efficiency, which is defined as the relation between a company’s value added and its social impact in relation to electricity production on the regional level. Together with eco-efficiency, socio-efficiency improves the company’s economic and social sustainability in the long run [
10]. The article will define the main criteria for socially sustainable electricity production in the region and present an easy to read, visual framework that can be accepted by stakeholders and local communities. At the same time, we demonstrate how diversification and decentralization of energy sources help to improve the state of social sustainability in the region. Furthermore, we look on how the concept of socio-efficiency can be integrated along the supply chains and how it helps to balance positive and negative social impacts by building an effective relation between a company’s value added and its social impact on local communities.
2. Previous Research and Theoretical Background
Customers, business partners, suppliers, analysts and stakeholders are looking for new ways, activities and measurable parameters with respect to social sustainability enhancement on both global and regional levels.
Many theories and approaches have been developed in order to manage different issues along global supply chains [
11]. However, most of them are concerned with activities management and ways to avoid unexpected disruptions and reduce economic losses [
12,
13]. Managing social risks in the supply chain has become extremely challenging as more and more companies have moved feedstock production to overseas locations. Consequently, supply chains have been extended, the number of nodes increased, and the complexity of the networks has advanced exponentially. Today, supply continuity is the single biggest business driver [
14]. Organizations recognize that preservation of shareholder value and sustainable risk mitigation are very important for supply chain management. It has been pointed out that disruptions can exert a tremendous impact on the company’s overall performance of supply chain operations, if there is a lack of suitable mechanisms or tools to prevent or reduce negative effects, as has been demonstrated in the past few years [
15].
Recent literature shows broader perspectives on supply chain risk management than just economic losses or changes; risks and sustainability are evaluated together. As well, risk is understood as a wide variety of impacts that can hinder a company in achieving specific targets [
16]. Such perspectives on risks make it easier to manage them in a sustainable way. Since value creation happens through all the stages of the supply chain, the overall risk management should be performed throughout the entire production process [
17].
Very few theories pay attention to the social sustainability of modern supply chains on a regional level. In our previous research, we have conducted an assessment of cumulative social effects and values along the bioenergy value chain for a selected locally sourced production on a regional level [
18]. The findings of the study contributed to a better understanding of the social sustainability dimension of the bioenergy industry. We have used specific social indicators to build a cumulative social effects assessment framework and relate it to local community giving a better understanding of regional social needs, uncovering social issues at each stage of the bioenergy production system, and revealing the levels of cumulative effects and values in the Lahti region in Finland [
18].
Figure 1 represents the framework that has been developed during our previous research. It was designed as a user-friendly tool that can assess the aggregation of social sustainability benefits, using publicly available data. We also suggested that regional authorities, local government agencies, the private sector, and civil society consider using this framework as a screening tool, before a large-scale assessment is conducted on a regional level.
The outcomes of our research showed that, at a regional level, the social effects of bioenergy production tend to accumulate from stage to stage. At the same time, it was noted that the origin of energy sourcing has a strong influence on regional communities and the economy as well. Locally sourced energy production systems have greater positive accumulation in the long run allowing money circulation and jobs to be kept within the region and inside the selected receiving environment [
18].
While conducting study in the Lahti area, we realized that, in order to secure electricity provision, companies in Finland use many different value chains and feedstock sources to diversify supply options. Even more, many Finnish electricity production companies currently emphasize the importance of transition from “traditional” to clean fuels, phasing out the use of coal and peat.
Regional electricity production value chains are determined by the nature of feedstock, electricity production technologies, the production processes themselves and ways in which final products and services are presented to the consumers. The existence of many electricity value chains in one region creates complexity in balancing sustainability issues; in particular, managing and reporting social sustainability.
Currently, there is a growing interest in the field of supply chain management research on how to make traditional economic-focused supply chains more socially and environmentally sustainable and efficient. For example, adding into supply chains elements such as environmental and socio-efficiency, building supplier’s “green” image and enhanced partnerships between suppliers may help to enhance the overall sustainability of traditional supply chains [
19]. However, some papers suggest that usage of such elements would not be sufficient to improve the state of sustainability in global supply chains [
20]. Few research papers are concerned with the social sustainability state for supply chains [
21,
22]. Scholars have proposed different ways to measure social sustainability in the supply chain, both quantitative and qualitative [
23,
24].
One of the most common definitions of sustainable chain management stresses “the creation of coordinated supply chains through integration of economic, environmental, and social considerations with key inter-organizational business systems designed to efficiently and effectively manage the material, information, and capital flows associated with the procurement, production, and distribution of products or services in order to meet stakeholder requirements and improve the profitability, competitiveness, and resilience of the organization over the short- and long-term” [
25].
Based on the above definition, the new concept of embracing socio-ecological intergradation along the supply chain has recently emerged [
26]. It brought up the possibility of developing continued merging of social and ecological supply systems, stating that this way the focus of the company will shift from global supply chain optimization to focus on more regionally located, socio-ecologically connected supply chains operations and activities.
Research papers suggest that business impacts on the environment are always negative, while economic impacts are always positive; however, social impacts could be both positive and negative. For example: impacts such as creation of new employment and training opportunities are positive, whilst work accidents and human rights’ abuse are negative [
27]. The concept of socio-efficiency developed by the German BASF (Badische Anilin und Soda Fabrik) research group shows the ways to minimize negative social impacts (i.e., accidents per value added) or maximize positive social impacts in relation to the value added. The main idea is to find optimal ways to balance all three sustainability dimensions along the entire production system [
28]. In the BASF approach, special attention is paid to social impacts of products and process alternatives. Evaluation of negative and positive social impacts along value chains is performed though SEEbalance© assessment tool that include general “Social Analysis”, Social Life Cycle Assessment (S-LCA) and the approach of “Social Hot Spot Assessment” [
28,
29].
Nevertheless, there is a lack of research on how to balance social performance along regional, multi-sourced value chains. To address this research gap, we attempt to generate the units (social indicators) that will help to measure and balance social sustainability effects in an efficient way on a regional level for multi-sourced electricity productions value chains.
Figure 2 represents the multi-supply chains that can be used for cumulative effects assessment inside the receiving environment.
Multiple sourced value chains create complex social, economic and environmental effects for the region. Social indicator accumulation along a local supply chain may potentially have direct and indirect impacts on local population and environment. As we defined in our previous research, the cumulative impacts of local supply chains may have a major impact on social sustainability in the long-run [
18]. The assessment of a local energy supply chain revealed that social sustainability impacts have the tendency to accumulate within the region. However, the timeframe of impact accumulation varies for indicators at different levels. Individual indicators describe impacts on the persons directly affected. For example, the benefits of training for occupational health and safety on the individual level are immediate. On the regional level, the numbers of individuals trained add up. However, in the long term, having a wider, safety-conscious population base could also have a cascade impact. Social components on the community level, such as direct economic impacts, accumulate on a longer timeframe. The impacts of regional investment in combination with the additional economic activity generated by this investment can have a cascade effect, even for a one-time investment. On a societal level, local community engagement to maintain a favorable public opinion requires continuous commitment in order to achieve the expected output. It may take years or even decades to change public attitudes to accept new developments. However, once values are accumulated, the impacts may even be transferred to the next generation [
18]. The accumulation of small impacts occurred repeatedly over time, such as energy security improvements or health hazards from emissions may eventually cause one significant impact that will positively or negatively affect the social sustainability state in the area.
In order to show the advantage of having multiple sourcing value chains regionally we intend to use the data visualization method. The objective of data visualization is to communicate information and key aspects clearly and effectively through graphical means [
30]. Visualization is in effect functionality matched with aesthetics; a graphical representation is often more intuitive and provides a better insight than numerical data. This technique is used to communicate data or information by converting it as visual objects. At the same time, this method allows discovering trends and patterns, and communicate findings to a target audience. In the case of our study, we visualized the level of positive and negative accumulation of social impacts on a regional level. We build a methodology that allows for demonstrating social sustainability data clearly and efficiently and for communicating it to regional stakeholders and consumers.
3. Sustainable Supply Chains and Standards for Their Evaluation
Building and managing supply chains based on sustainability principles is recognized as an effective strategy to address global challenges faced by companies and institutions. It gives a competitive edge to the company and improves the company’s public image [
31]. Sustainability of the supply chain may be presented as the magnitude to what degree present decisions made by the company top management will influence the future state of environmental, economic and societal components. While developing sustainability strategies, companies need to study potential future uncertainties as well as positive and negative impacts that different decisions may impose on natural and societal levels.
Scholars describe modern sustainable supply chains as an integration of environmental, social, and financial practices into supply chain lifecycle. That is why the complex line of diverse activities and sustainability criteria are included into life cycle of any supply chain and they are not limited by just supply chains stages. Product design and development, selection of materials, workforce health, safety and training as well as environmental standards, the production itself, packaging, consumption, disposal, marketing activities and transportation are just a few elements that can influence the state of supply chain sustainability.
Modern electricity production supply chains are very complex and consist of a network of producers of raw materials, logistics companies, storage facilities and end users. The diversity of energy market players allows sustainable supply chains (SSC) to be seen as key generators of business value. In order to balance and enhance those values, companies have to integrate all three aspects of sustainability into their supply chains.
Global and regional energy supply chains are under pressure and require clear sustainability strategies development from their stakeholders. An increasing number of clients, investors, government regulators and public share are actively involved in discussions about various aspects of energy supply chains that go beyond traditional factors such as cost, quality and financial indicators.
Global Reporting Initiative (GRI) standards are widely accepted by big and small companies for sustainability reporting. They provide organizations with guidelines, including sector specific disclosures and standards, helping them to identify and manage risks as well as allowing organizations to seize new opportunities as they come. The GRI’s sustainability reporting framework contains three main elements providing guidance on “how to report” and “what to report”. They are described below [
32]:
- ➢
Reporting guidelines: The guidelines are the keystone of the GRI G4. They set quality and content principles along performance and managerial aspects and indicators. The principles that define content are: materiality, stakeholder inclusiveness, sustainability context, and completeness. About 140 indicators reflect different thematic categories such as organizational, managerial, economic, environmental, social, human rights, society, and product responsibility issues
- ➢
Sector supplements: GRI guidelines also present supplements that offer additional guidance and indicators for sector specific issues.
- ➢
Indicator protocols: The protocols provide definitions and technical and methodological guidance on each of the performance indicators of the guidelines.
However, sector specific supplements are optional to report on and they only work together with G4 general standards. The use of the G4 Sector specific disclosures is recommended (but not mandatory) to be considered for companies that are using GRI Standards for reporting but it is not a must while preparing annual reports [
32].
Together with GRI, Corporate Social Responsibility (CSR) reporting requirements and growing public awareness obligate corporations to create conditions of exposure to economic, environmental and socio-political negative impacts and risks in their supply chains are reduced to a minimum.
Recent research on the sustainability of energy production raised attention regarding the aspect of social sustainability along a production system [
33]. Mapping and balancing particular social sustainability issues in the global and regional energy supply chain is a challenging task. The social dimension of sustainable energy involves embracing long-term well-being considerations, such as preserving affordable access to food and water, guaranteed energy supply, equal employment opportunities and ensuring the safety and development of people, facilities, and regions [
34]. Transparent participatory processes, such as active engagement of stakeholders, establishing obligations to respect human rights, and embracing a long-term sustainability plans with periodic monitoring play an important role for improving the social sustainability of energy supply chains [
35].
Reporting Corporate Social Responsibility (CSR) in the supply chain context recently became an effective tool that companies use to improve their public image. By reporting CSR on a yearly basis, companies show that their concerns are not limited only to economic benefits and profits, but also include the needs of the society, economy, environment and stakeholders. Nowadays CSR is seen as guarantee of sustainable development [
16,
36]. Moreover, recent analysis of CSR consciousness of the supply-chain members on the supply-chain’s decision showed that the stronger the awareness of CSR among its stakeholders and general public, the more the consumer surplus and involvement is received, and even moderate CSR awareness improves the overall sustainability state of the supply chain [
30].
While preparing the CSR report, companies use general and specific GRI standards. They serve as metrics for supply chain sustainability. Usage of these standards allow companies to show, measure and monitor the sustainability of their supply chains’ activities. Describing a typical supply chain for electricity production, we can say that it is a set of units (organizations) which are connected through different processes and activities producing values along the production system in the form of products or services in order to meet to meet consumers’ expectations [
37]. GRI proposes to follow a certain approach while proceeding with sustainability assessment: start from broad categories through definite aspects to specific indicators [
32].
Since OE is the largest electricity provider in the region, it has to prepare annual reports following certain standards and rules. In order to define how a company performs in the area of social sustainability, we investigated six supply chains operating within the Oulu sub-region and studied the most suitable social categories, identifying specific social aspects and indicators applicable to all value chains that OE use for electricity supply. Each social indicator was the unit of analysis, assessed in terms of importance on the regional level and the ability to accumulate impacts over time. We have analysed OE annual reports for last 3 years that helped us to understand which social aspects are important for the company and how social sustainability issues are handled. Through communicating with Oulun Energia managers, we have also defined how OE engages other supply chain stakeholders along all electricity supply chains and looked into structural collaboration with contractors and the ways of media information exchange.
4. The Supply Chains of Oulun Energia
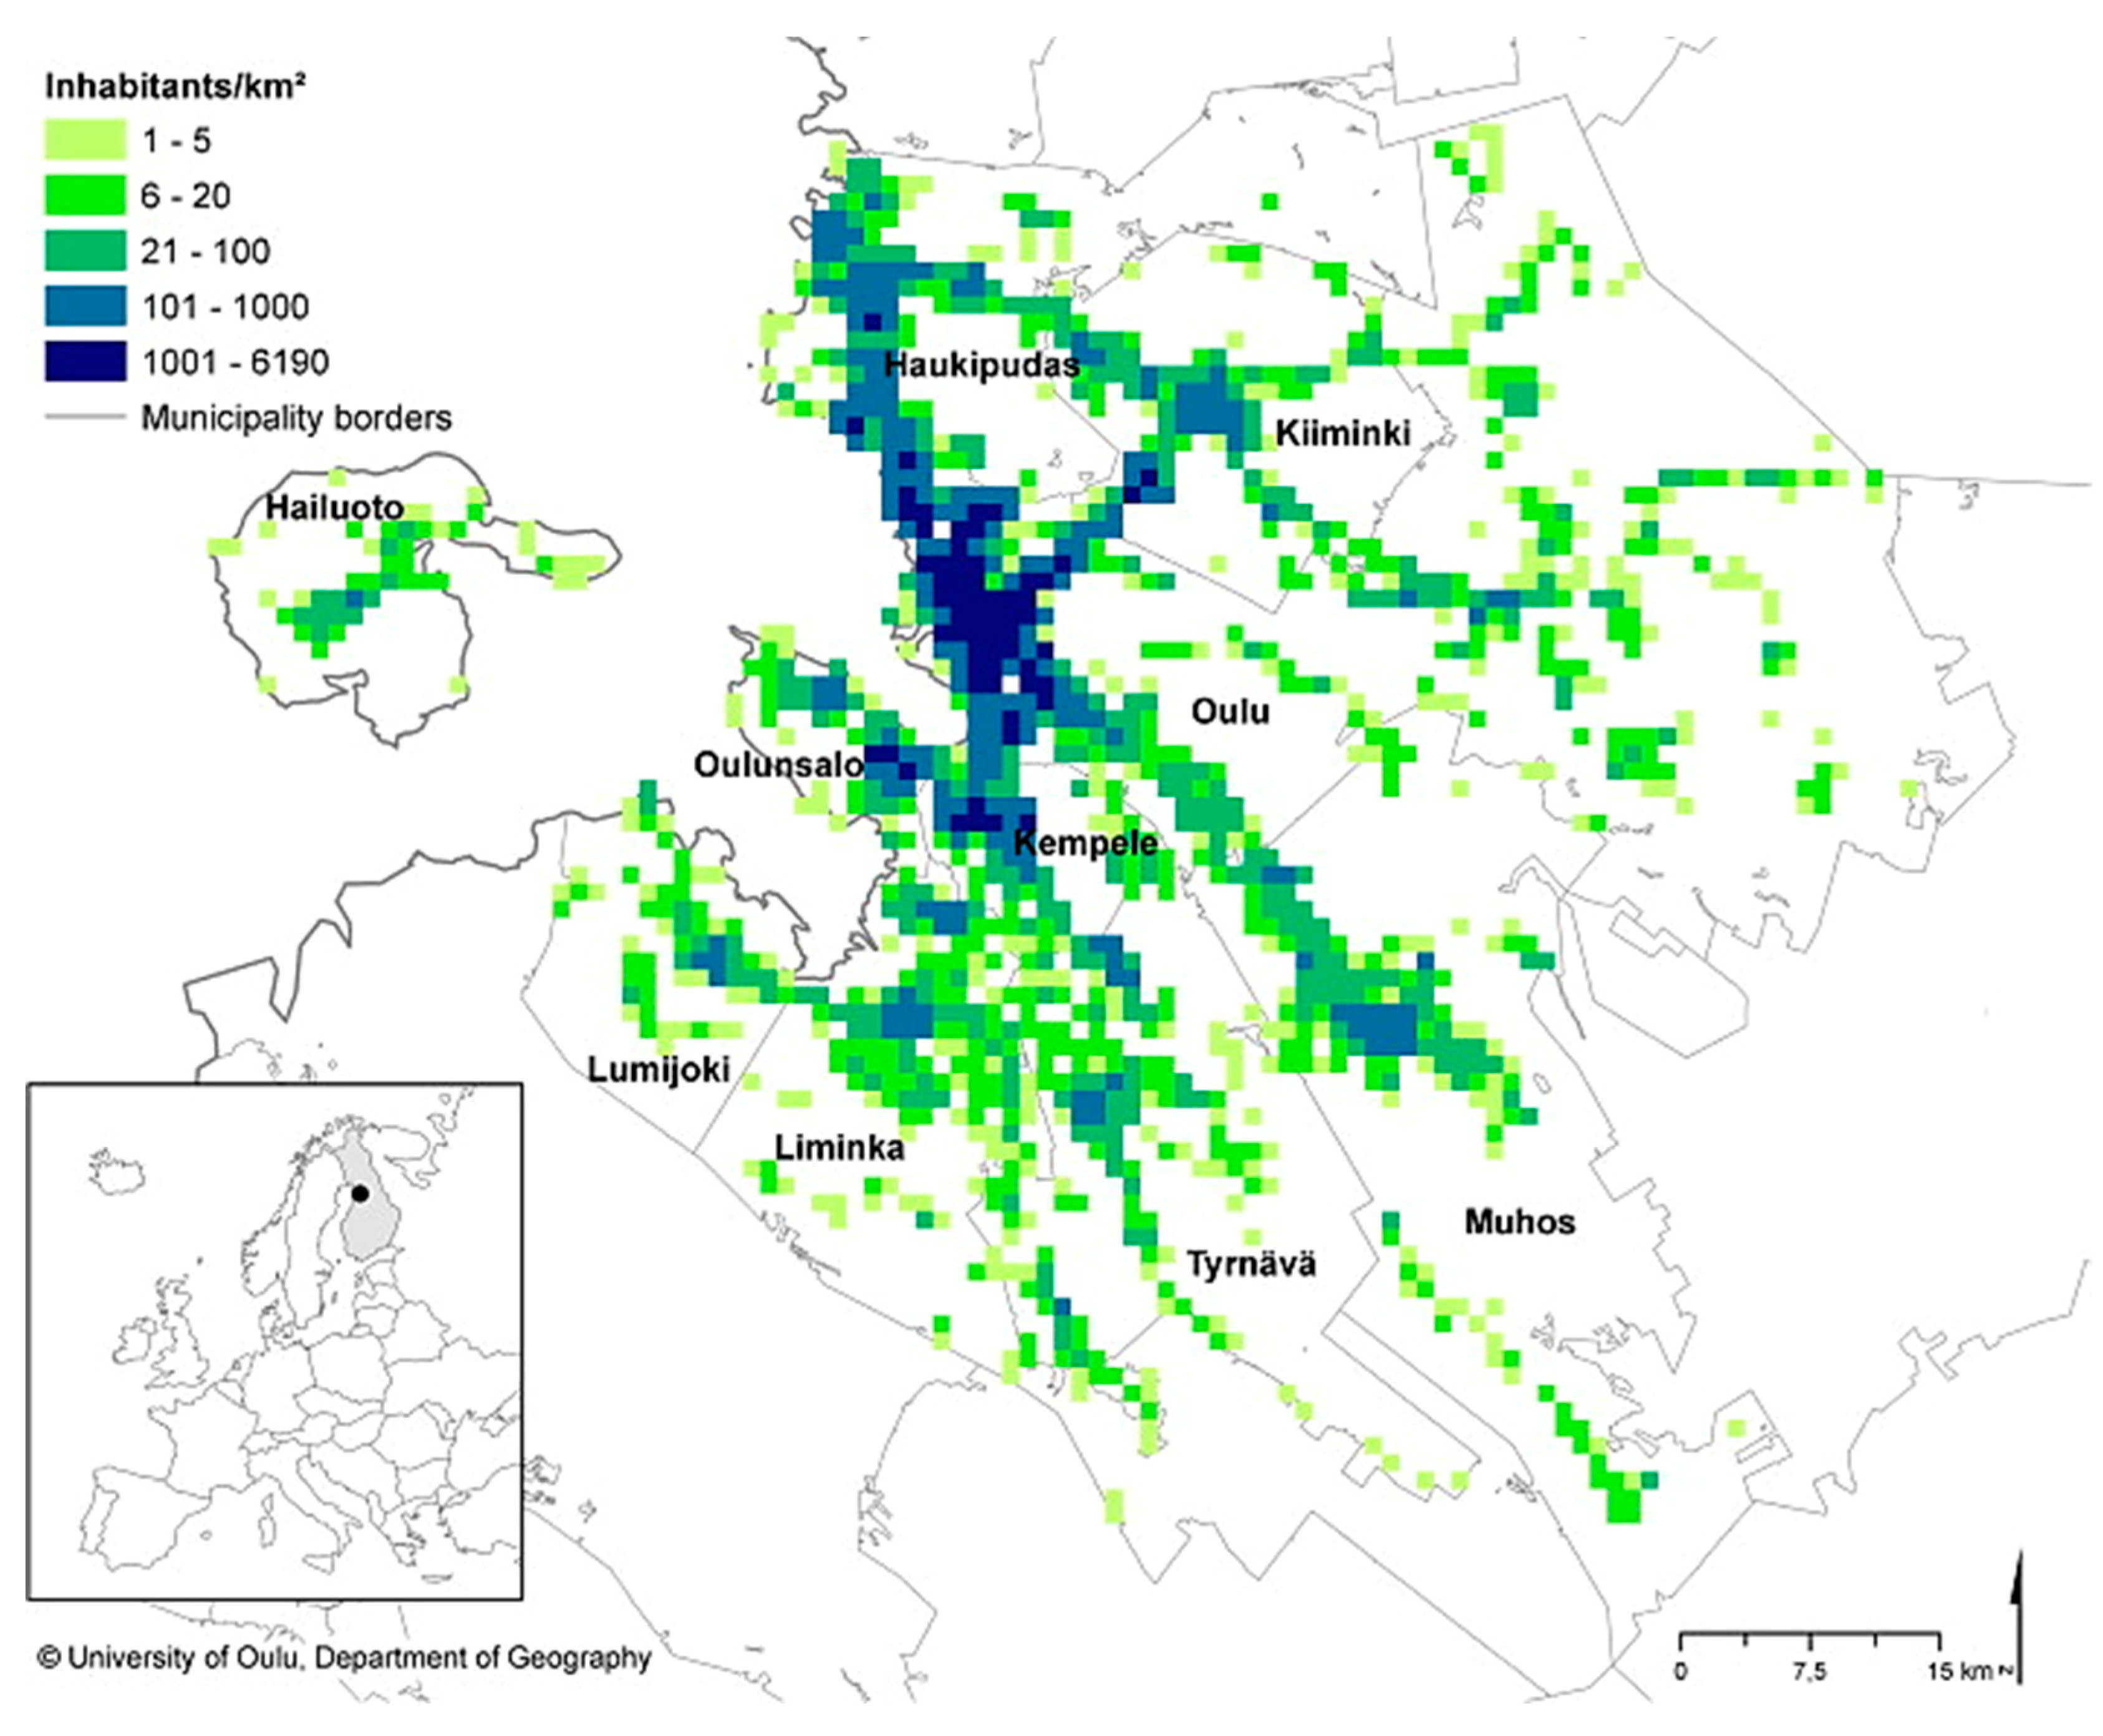
The Oulu sub-region, within the Northern Ostrobothnia region, is located on the North-Eastern shores of the Gulf of Bothnia. With an area of 4800 km
2 and a total population of approximately 227,000 [
38]. The Oulu sub-region consists of the municipality of the City of Oulu, which is also the largest urban center and the capital of the Northern Ostrobothnia region, and three neighbor municipalities: Hailuoto, Kempele and Muhos.
Figure 3 shows the Oulu sub-region and population density distribution; about 60 percent of population is concentrated in the City of Oulu.
Oulun Energia Oy (Oulu, Finland) is the main provider of heat and electricity in the Oulu sub-region. Founded in 1889, operating the city power plant, OE today is registered as a Limited Liability Company (“Osakeyhtiö” abbreviated to “Oy” in Finnish), it is owned by the city of Oulu and it is the largest energy group in Northern Finland. OE, besides being a shareholder in a number of power companies, includes several subsidiaries: Oulun Sähkönmyynti Oy, the power sales company, OE Siirto ja Jakelu Oy, the network operator, OE Urakointi Oy, the network construction company, Turveruukki Oy and Huoltovoima Oy, both feedstock providers. OE operations include fuel acquisition, production, and distribution of electricity and heat, as well as a range of energy services such as commercial operations, contracting and system maintenance.
In order to improve its economic efficiency through flexible fuel supply and by expanding the range of products offered to its customers, over the years, OE combined different technologies and sources for power production. Currently, the energy mix for local energy power production relies on the following power plants and power sources:
Toppila power plant, combined heat and power generation plant
- ○
“Toppila 1” boiler is using mainly peat as a source of energy
- ○
“Toppila 2” boiler using peat and wood chips
Merikoski hydropower plant
Laanila “eco-power plant”, is a waste incinerator with heat and power generation
Solar power production based on photovoltaic (PV) installations on multiple locations
Nuclear, wind and other form of power imported from outside of the region
Table 1 shows the power supply per source of origin for the last few years as reported by OE, while
Table 2 shows the share of energy sources in their own energy generation.
New developments in compliance with EU energy diversification and climate change strategies will change the composition of electricity provision mix presented in above tables during next 10 years. In order to achieve climate goals, OE has committed to phase out the use of peat by 2050. As a first step, they will discontinue the use of the Toppila 1 boiler, which is currently using primarily peat. OE is currently building a new bioenergy plant in the industrial area of Laanila in Oulu. It will reduce carbon dioxide emissions almost by 50% of the entire energy production operations run by OE. New facilities will start their operations in November 2020. The main fuel they intend to use is wood and source separated waste.
Figure 4 illustrates the seven currently operating fuel supply chains of OE: coal, peat, waste, hydro, solar, wind and nuclear. Three out of these seven energy value chains are partially or fully run on local or regional resources and most activities along the supply chains are happening inside the Oulu region, the so-called receiving environment. Those three locally sourced value chains use wood, peat and waste for electricity production.
OE pays a great deal of attention to social sustainability issues. In its 2018 annual report, OE stressed the importance of socially responsible activities that happen along local supply chains operated by the company. Topics such as taking care of the safety and well-being of OE employees are on the top of the priority list, as well as providing local households and businesses with reliable and clean energy. Energy produced within the region boundaries is called “local energy” by OE and it refers to electricity and heat to local communities. OE states that 90% of energy resources used for electricity and heat production are coming from radius of 100 km from city of Oulu, a process that creates social impacts accumulation on the regional development since money circulation and the jobs allocation stay inside the region [
39].
In the next sections, we assess each of the supply chains separately and identify social indicators that tend to have cumulative effects from stage to stage. For this assessment, we have used the cumulative social effect assessment framework described earlier [
18]. The origin of cumulative social effect assessment is based on biophysical as opposed to socio-economic effects and was used as a tool for cumulative effects assessment and management framework (CEAM). CEAM focused on the assessment to evaluate overall ecological sustainability issues. It provided the scope to consider the sustainability of new project alternatives in terms of possible impacts and long-term trends affecting the state of valued environmental components [
40]. Although some elements of socio-economic impact assessment were included, most available examples and evaluations emphasize biophysical effects. In other studies, cumulative socio-economic effects are mentioned for large industries and social impacts assessments are linked to overall sustainability issues [
41]. Canadian researchers [
12] attempted to use social indicators that are measurable and valued to the social dimension in cumulative effects assessment in terms of land use planning. They suggest that it is necessary to recognize the valued or most important components and study the relationship between social values and the environment, since environmental consequences often lead to socio-economic impacts.
Using the framework developed in our research in this study, we study how electricity supply chains in the region add to the complexity and widen the diversity of social sustainability activities involving new social aspects. Due to this supply complexity, we also use GRI G4 reporting guidelines regarding the assessment of social sustainability for the electric utilities sector alone with general G4 aspects [
32].
4.1. Wood and Peat Supply to Toppila 1 and Toppila 2
The Toppila 1 and 2 boilers are a typical example of CHP generation that has long traditions in Finland. These plants traditionally use peat, wood and coal as feedstock for electricity production. However, this type of electricity production will be modified in the nearest future. OE is currently building a new environment-friendly plant in order to comply with the National Energy and Climate Strategy, published in 2016, that aims to increase the use of renewable energy in general. The new bio-power plant, to go into full operation in late autumn 2020, intends to use only wood-based biomass for power production [
42].
This new development will help Oulu Energia to archive its long-term goal of 90% carbon neutrality by 2030. The new facility will cut OE’s CO2 emissions while replacing the old Toppila 1 power plant.
Nevertheless, currently, the operation of Toppila 1 and 2 relies on wood and peat.
Figure 5 shows the basic elements, specific activities and main social indicators along wood and peat biomass supply chain. There are several elements in the wood and peat resource supply chain, such as organizing supply at the local level, procurement of biomass crops, storing, transporting and preprocessing forest biomass resources before it will be used at the Toppila conversion facilities.
The main elements are associated with specific activities. Since there are two sources involved, this value chain is complex, has numerous activities, and associated with them multiple social aspects and indicators.
The Toppila value chain upstream level involves a number of activities related to biomass procurement and logistics. However, the upstream is partly located outside of the receiving environment of the Oulu region. Peat as a biomass source comes from inside the Oulu sub-region (Oulujoki, Siikajoki and Iijoki). The production of peat is done by local employees hired from surrounded villages. Peat delivery is provided by two companies Turveruki and Vapo Oy, but each company has about 40 additional subcontractors. Trucks loaded with peat come to Toppila facilities every 15 min. At peak operation, one load of peat burns in 10 min. Wood biomass comes to Toppila facilities the same way but from longer distances, from the Oulujoki, Pyhäjoki and Kalajoki areas. In case of need, some wood can be delivered also from other areas outside of the Oulu sub-region, so the supply chain starts outside of the receiving environment. About 15 companies participate in wood biomass supply. Mostly dry wood is used; in addition, saw dust is added.
The midstream level of the Toppila value chain is entirely located inside the receiving environment of the Oulu region. The production facilities are located within the city and require skilled personnel to operate and maintain. According to OE [
39], extensive training and educational programs are used at the conversion site on regular basics and meet overall general requirements of Finnish energy production. Training for occupational health and safety is also well organized at the Toppila plants.
All social effects associated with midstream activities accumulate inside the region. Midstream, the inputs in Toppila 1 and 2 boilers are wood and peat feedstock. The outputs are heat and electricity sold to customers mainly in the Oulu region. Downstream activities here are defined as following: distributions of electricity, creating awareness among consumers and building public opinion.
4.2. Merikoski Hydropower
Hydroelectric power is one of the most environmentally friendly renewable energy sources. Hydroelectric power plants transform the kinetic energy of falling water into electrical energy. The production process itself does not have any direct effect on the water resources, neither in quality nor in quantity. However, hydropower plants have an impact on river biodiversity, such as restricting the migration of fish species, among others.
The value chain of hydro electricity production does not have many activities and players involved. The principle of operation of Merikoski as any hydroelectric station is relatively simple.
Unlike other OE value chains, Merikoski does not require any biomass as feedstock for electricity production. That is why there are not many activities up-steam. The river Oulujoki, as the main source of energy, flows directly through the hydroelectric power station.
In order to compensate for the biodiversity impact of the hydropower plant, OE maintains the Ainola parks creeks and provides other benefits to local fishermen. Therefore, social impacts are created upstream through the increase of recreational value for local communities. Therefore, local community engagement plays an important role. OE ensures that community members have an opportunity to be involved and have direct access to valued social activities organized during the year.
The fishladder, also called fish-way, is an additional feature for the Merikoski electricity production facility that improves its overall environmental and social sustainability state. The Merikoski fishladder provides a path for salmonid fish species to swim upriver from the sea past the Merikoski hydropower plant. Thanks to the fishladder, fish can reach a 40-km stretch of the river above the Merikoski power plant up to the next power plant in Montta, and swim to the Muhosjoki and Sanginjoki rivers, tributaries of the Oulujoki river. The fishladder is maintained and financially supported by OE [
39].
All the activities midstream of Merikoski plant’s electricity production value chain take place inside the buildings of hydroelectric power station. The station itself has several divisions. Generators are located in the engine room, directly converting water energy into electrical energy. There is also electrical equipment, which includes control and monitoring devices for the operation of hydroelectric power stations, a transformer station, switchgears and much more. The Merikoski plant consists of three machine stations where only several people take care of equipment and maintain activities. Downstream impacts are the same as all other supply chains: distribution of electricity, creating awareness among consumers and building public opinion (
Figure 6).
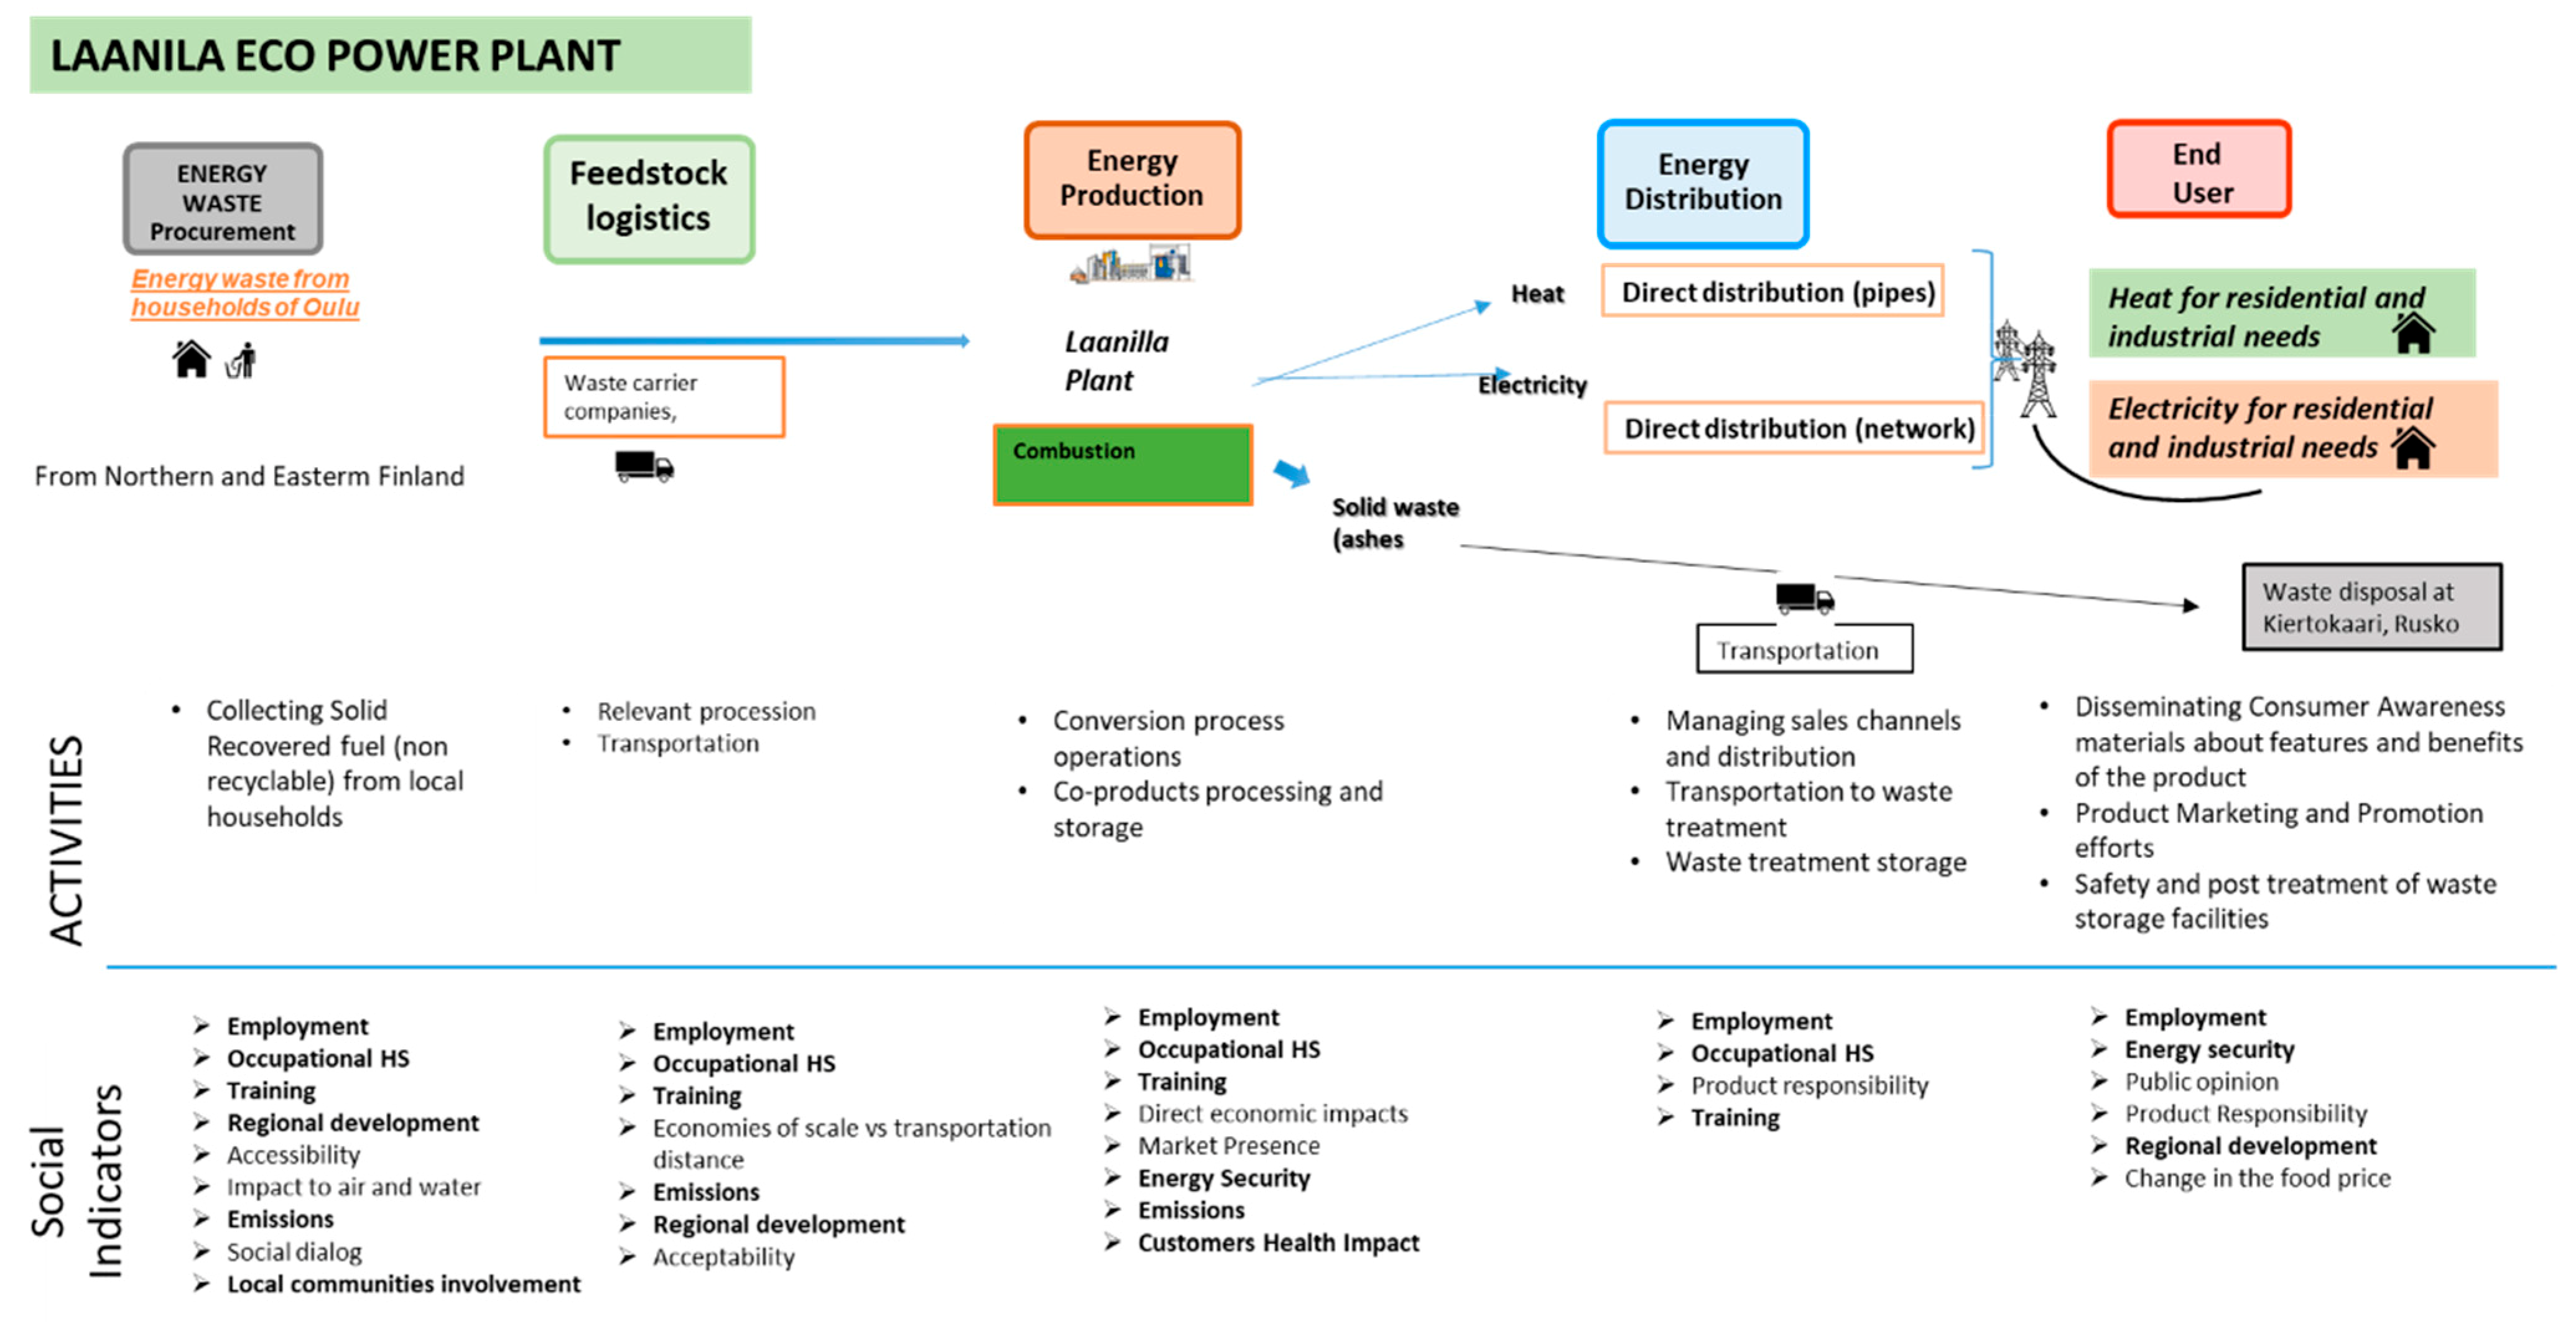
4.3. Laanila Eco Power Plant
The key characteristic of the Laanila Eco-power plant’s value chain is the feedstock. The plant is primarily a waste incinerator with energy recovery. It utilizes about 140,000 tonnes of municipal and sorted industrial waste per year. Approximately fifty percent of waste comes from the Oulu region and the rest from different locations in Northern and Eastern Finland.
Because of feedstock origins upstream, the value chain is complicated and involves numerous activities. As well, not all upstream activities are located inside the receiving environment of the Oulu region. Waste collection is performed at a large number of locations inside and outside of the Oulu region, some waste separation and processing are required, followed by transportation to the conversion facilities, where some short-term storage may be needed.
The midstream level activities take place at Laanila plant itself. Skilled personnel are required to do conversion process operations and that is why specific training and well-organized occupation health and safety programs are very important here.
As in all bioenergy production systems, the Laanila waste-to-energy value chain also involves a number of social sustainability issues such as public health and safety, regional economic development, employment, training, cooperation, public acceptance, and many others. The lower part of
Figure 7 presents main indicators and accumulated social sustainability impacts evaluated along the Laanila electricity production value chain.
Any waste-to-energy facility will also generate emission of pollutants and should be certified and meet the most stringent emission standards [
43].
4.4. Solar Energy Supply
The use of solar energy became popular in Finland in recent years. According to Finnish statistics, production of solar power rose by as much as 128 per cent in 2017 [
38]. The Oulu region is very active in terms of solar energy sites development. OE provides solar photovoltaic (PV) installations as a responsible alternative for homes and businesses, providing consumers with a high-quality PV systems. Several large projects are planned in the near future in the region.
OE is also involved in PV power plant projects in a variety of roles. One of the potential projects in the near future is the installation of large solar PV power plants on decommissioned peatlands located within Oulu region. Popularity of solar energy among customers and the decrease of prices for PV systems encourage OE to invest in solar energy development actively [
39].
The nature of solar electricity production makes this value chain local with the exception that PV systems are produced outside the receiving region. Solar electricity production brings number of social benefits to Oulu region. It creates jobs related to solar panel installation and maintenance. It also has a positive effect for regional economic away from energy generated from fossil fuels.
Health effects from PV development are practically non-existent, therefore this supply chain has positive effects on accumulation via creation of new business midstream and reducing electric bills for households downstream.
4.5. Electricity from Outside the Region
Other power sources from outside the region include primarily wind power, nuclear power and power acquired directly from the electricity market. The power acquired from the market depends on the temporary characteristics of the available energy mix and can include a variable percentage of conventional and nuclear power generation as well as wind and hydropower sources. OE offers to its customers the possibility to select a contract that guarantees wind energy as the exclusive source of power supply as well. This option has an impact on the amount of power imported from outside the Oulu sub-region that is direct, immediate and, to some extent, independent from the rest of the imported power, which is defined primarily by a more direct demand-supply balance effect. Wind power from OE is generated through EPV-Energia Oy.
Nuclear power is currently commercially acquired on the market, and it represents a substantial share of the power commercially distributed by OE. Nevertheless, the rest of the electricity supply for the Oulu region comes from the diverse renewable sources described above. It is safe to assume that direct environmental and social impacts that come from electricity from outside have no accumulation impacts on the Oulu sub-region. Nuclear power perhaps represents a special case for two reasons: on the one hand, nuclear fuel is commercially acquired and processed exclusively outside Finland. On the other hand, the presence of short and medium terms local socio-economic impacts, although impossible to quantify within the scope of this work, needs to be acknowledged, including local employment and import of specialized workforce from abroad (or, at very least, from outside Oulu sub-region) related to the construction work.
5. Results
Based on data received from OE, we selected the social topics, aspects and indicators that we defined as most important to local communities and main stakeholders of Oulu region electric utilities sector. Furthermore, we intended to build an easy to use methodology that illustrated results based on the cumulative social effect assessment framework in combination with GRI G4 aspects and OE stakeholders recommendations and needs. Such methodology will allow us to assess the level of accumulation for social effects inside defined electricity market. At the same time, it will demonstrate how multiple-sourcing value chains on the electricity market can positively influence socio-efficiency, strengthen energy security and improve overall social resilience of receiving environment.
During the assessment of the supply chains of the seven main fuel sources, we have identified three major topic related to social effects of energy generation within the Oulu region:
- ➢
Community impact
- ➢
Labor and health issues
- ➢
Regional development and security
We have defined seven social sustainability indicators that repeat and accumulate along all supply chains. Although not all of them create positive accumulation effects, when combined and assessed together, they demonstrated maximization of positive social impacts in relation to the value added.
Table 3 shows the visualization of regional accumulation for selected social indicators along multiple sourced supply chains.
The top row displays the considered indicators and the first column the power sources. The number of arrows and their direction cells indicate the overall cumulative social sustainability effect as described in the following.
Multiple sourced supply chains concentrated inside the region are able to generate high level of employment. If we look at the employment indicator along all value chains, we can see that it has two parts: direct and indirect jobs. The indirect employment here include all sub-contractors and maintenance personnel that located inside the receiving environment of Oulu Sub-region. According to the OE annual report statement, 1500 people in Oulu and the surrounding province were employed directly and indirectly [
39]. All the benefits related to the employment, such as training and occupational health and safety will remain and accumulate inside the region since there are no multinational companies involved in the electricity supply chains we assessed. In addition, OE offers summer employment for local students [
39]. In the evaluation we also considered the criticality of the impact. This is most seen in the employment dimension. The Oulu region has in Finnish measures, a relatively high unemployment rate (11.6%). From this perspective waste as fuel show a high potential for impact, due to the investment in the new waste-to-energy plant and associated extension of waste source separation.
Customer health impact is the only indicator that showed some tendency of negative accumulation. The main health impacts are due to burning peat at the Toppila facilities and waste at the Laanila plant. Studies show that that fine particular matter is emitted during the combustion process of both peat and wood. These particulates play the main role in adverse health impacts [
44,
45]. Using waste for energy generation also creates some negative customer health impacts from combustion, processing and storage activities. Modern, properly permitted waste management facilities are able to reduce such impacts to minimum [
46]. To quantify health impacts, human toxicity factor evaluated by life cycle assessment (LCA) method can be used [
47].
Local community involvement is another important indicator that shows positive accumulation in the Oulu region. In its 2018 annual report, OE stresses the importance of the local community’s involvement in company operations and activities [
39]. OE works with the local community on many levels offering information, outreach programs, events as well as organizing programs of public dialog using social media publications in various sources. For example Sulake, a customer magazine published by OE twice a year provides information on electricity, heat and energy issues in general. It is distributed through the entire Oulu sub-region. OE also developed its own Northern Power Customer Loyalty Program for its customers. It offers customers both electricity supply services and additional services and products of OE’s partners. This program is supported by the Northern Power mobile app that local communities and private customers can use to track electricity consumption, assess customer services and stay informed about upcoming events and promotions.
The assessment of all chains showed us that not only that social indicators have the tendency to accumulate from one stage to the next during electricity production within one supply chain, but they also accumulate across all supply chains. Furthermore, the participatory process together with OE was used to adjust to the needs of the Oulu region as the receiving environment.
As with any social sustainability assessment methodology, there are still uncertainties and evaluation challenges. The biggest challenges are to make right choices of relevant indicators and the reliability of their quantification and evaluation. In case of social indicators, we recommend selecting them together with stakeholders. In terms of quantification and evaluation, our choice has been to rely on, as far as possible, on data received from Oulun Energia management and publicly available data (such as scale of new investments, number of new jobs added, training hours, accident rates, etc.
Our findings show that the decentralization and diversification of electricity supply chains has a direct influence on energy security level and regional resilience improvement. More specifically, the level of energy security added by each power source is defined by the combination of two factors: the location of the energy supply source and its relative contribution within the OE energy mix. Within this framework, peat and hydro provide significant contribution; however, looking forward the future, wood and waste-based biomass have the potential for the highest positive social impact. Solar and wind, although equally local in nature, represent a significantly smaller contribution.
Such electricity supply structure positively affects regional development since money circulation along evaluated value chains occurs within the area used for improvement of local electricity supply infrastructure as well as for new business development, and improvement of local communities’ well-being. We have defined that the percentage of local actors involved into electricity production supply chain is very high and it building up positive accumulation in the long run inside the region.
The visualization in
Table 3 shows that diverse, locally sourced supply chains of electricity generation results in a wider scope of positive social impacts that accumulate on a regional level. The greatest accumulation is associated with supply chains that are 100% located inside the receiving region, but the level and strength of positive accumulation is different for separate indicators.
6. Discussion
Visualization of social impacts accumulation methodology highlights the importance of diversification for electricity supply chains on the regional level. The ability to track the most important social issues and impacts give stakeholders an edge to overlook current impacts and to build a new strategy that will boost the social sustainability state of the region.
The outcome of our research shows that the highest positive impacts are found in the supply chains that are 100 percent located inside the receiving region. Electricity production based on wood and peat sourcing show the strongest accumulation. The OE ownership of peatlands and large number of local wood suppliers are the reasons for such strong accumulation. Regional connections are built between suppliers and infrastructure and work well on the daily basics.
The example of OE shows that socio-efficiency of electricity and social sustainability impacts accumulation are interconnected. Since socio-efficiency is defined as “relation between a company’s value added and its social impact” the higher accumulation of social values added will produce higher social impacts that can be achieved inside the receiving region in the long run. Local resources optimization for electricity production will boost the circular economy. Such social indicators as employment, educational programs, Occupational Health and Safety (OHS), local communities’ involvement are the ones that have immediate impacts on the well-being of local communities. Regional development and customers’ health impact accumulate within a longer framework and can be tracked via statistical and annual reports published by regional companies.
Value chains of a diversified and decentralized power production in the Oulu region support local and rural development, create employment, provide energy security, and contribute to climate change control. This is an important aspect of local and regional development strategies. Furthermore, it is a well-established important link between the development of sustainable energy systems and sustainable development of rural areas [
48,
49]. Moving toward a low-carbon development path and smarter cities requires a careful medium long-term analysis of local energy systems, as it has also been realized in the Basilicate region of Southern Italy, which has gone through an energy transition from a primarily fossil-based to renewable energy generation [
50]. There is also a need for greater recognition of social equity impacts of energy transition [
51]. Many developed economies are facing economic stagnation and rising unemployment rates. It has been recognized in the Catalonia region of Spain as well, that renewable energy transition not only represents a solution to climate concern and reduced dependence on fossil fuels, but also encourages the creation of employment [
52]. The renewable energy sector is one of the fastest growing sectors of the economy within the European Union. This has certainly been the case in the Czech Republic [
53], where renewable energy created a significant number of jobs. However, it was also pointed out that education and training of workers are an important prerequisite for the renewable energy sector. Waste-based energy has been overlooked in some regions, although energy use of waste will have multiple benefits; reduced emissions and fossil fuel dependence, increased employment and a solution to waste management policies. These multiple benefits of waste-to-energy generations, especially for heat utilization, have been recognized in Glasgow as well [
37].
As it is stated in OE’s annual report, the company has ambitious goals, such as achieving 91% carbon neutrality by 2030 and negative carbon emissions (through carbon sinks) by 2050. In order to achieve these goals, OE is already building the new Laanila Bioenergy Plant based on waste-to-energy conversion. This new source, in turn, will allow OE to phase-out peat. As part of regional circular economy development initiative along with plant, OE is building sorting facilities for municipal and industrial waste [
39]. OE emphasizes the regional importance of the new Laanila bioenergy plant in terms of employment, direct investment and community well-being. The direct investment currently is estimated at about 200 million. Waste-to-energy generation will, in addition, also provide a sustainable way of managing municipal wastes [
18]. This sizeable investment will generate multiple positive impacts for the region, economic, environmental and social.
Our findings also indicate that the decentralization and diversification of electricity supply chains has a direct influence on energy security level and regional resilience improvement. More specifically, the level of energy security added by each power source is defined by the combination of two factors: the location of the energy supply source and its relative contribution within the OE energy mix. Within this framework, peat and hydro provide the highest positive contribution, while solar and wind, although equally local in nature, represent a significantly smaller contribution.
Our methodology is applicable to small and medium regions inside and outside of Finland that use multiple sourced supply chains for electricity production. The success of the evaluation depends on the nature of existing social conditions. It is proposed that easy to read and use methodology gives stakeholders an opportunity to see the overall state of social sustainability of regional electricity markets as well as making the right decisions that will balance social impacts while improving regional resilience.
7. Conclusions
The main goal of this article was to assess the current state of social sustainability of the Oulun Energia power provider in the Oulu region. Using previous research results, we have adapted a cumulative social effects assessment framework and applied it to OE’s supply chains. In communication with the main stakeholder, the OE company, we have selected an array of social sustainability parameters and indicators that we included in the assessment process.
Based on the defined topics, we have combined the social effect of all electricity supply chains. The comparison of chains showed us that not only social indicators have the tendency to accumulate from one stage to the next during electricity production within one supply chain, but they also accumulate across the supply chains. Furthermore, a participatory process together with OE was used to adjust to the needs of Oulu region as receiving environment.
Our main finding was that, at regional level, multiple sourced electricity supply chains create an advantage for the region, rendering them more independent from outside suppliers. Although the power plants within the region do not provide hundred percent security, diversification improves energy security at the local level. Locally sourced electricity production systems also have a closer connection with regional communities and overall with regional economy. Money circulates and jobs in electricity production and distribution stay within the region.
This paper also presented a social sustainability state visualization framework for multiple sourced electricity supply chains. Visualization allows for a better understanding of the current state of social sustainability as well as revealing the levels of social impacts accumulations in the Oulu sub-region. This visual framework can be used in communication with local stakeholders to conceptualize the social sustainability state of multiple sourced regional electricity supply chains.
The study contributes to a better understanding of the social sustainability dimension of regional electricity production markets. However, deeper research is needed in order to understand the potential challenges and benefits that the diversification of energy mix for electricity production in EU can bring in the future. Special attention should be paid to customer heath impact as well as local community involvement along the existing value chain. The case study is an example of clean transformation of local electricity generation based on fuel decarbonization and diversification. Phasing out peat region by region in Finland is motivated by climate goals, but it will have great effect overall on environmental, economic and social sustainability. As this study demonstrates, decentralization and diversification of electricity supply chains may not only contribute to climate change mitigation, but also improves regional social resilience. Decarbonization of the power system is a disruptive change that, in the long-long run, can bring significant aggregation of positive impacts, including social impacts accumulation.


