Abstract
This study aims to understand the effects of wildfires in sagebrush ecosystem on soil properties by examining connections between Soil Water Repellency (SWR), reflectance, and chemistry. Ash and burned soil samples were collected after performing laboratory burns of three common sagebrush plants: sagebrush, rabbitbrush, and bitterbrush. The collected samples were analyzed for their physical properties, including SWR measured by Water Drop Penetration Time (WDPT) and Apparent Contact Angle (ACA), and solar spectral reflectance in the wavelength range of 350 to 2500 nm. Chemical functional groups of the samples were analyzed using Fourier-Transform Infrared (FTIR) spectroscopy. WDPT and ACA values were in the range of 1 to 600 s and ~10° to 88°, respectively, for all three tested fuels. The FTIR analysis showed a decrease (~2 to 4 times) in the ratio of COO−/C=C signals for the burned soil samples compared to the unburned soil samples. Overall, increase in temperature and ACA levels for the samples of burned and burned soil from a 2 cm depth led to increased formation of non-polar compounds with C=C functional groups, and decarboxylation.
1. Introduction
Climate change, prolonged dry seasons, land use changes, invasive species, and fuel accumulation due to fire suppression have played a significant role in increasing the intensity and extent of wildfires over the last few decades, especially in the western United States (US) [1,2,3,4,5,6]. In 2021, three California megafires—the Dixie, Beckwourth Complex, and Caldor Fires—burned ~5224 km2 of land, with the Dixie Fire being the second largest fire in California history according to official California state records [7,8]. The Mosquito Fire, the largest California fire in 2022, burned an area of ~311 km2 and caused hazardous air quality hundreds of kilometers from the fire for several weeks [3,4]. Exposure to toxic wildfire smoke can cause adverse health impacts such as asthma attacks and increases mortality [3,4,9,10,11,12]. Fires can also take a toll on the built environment. For example, Radeloff et al. [13] emphasized that shrubland-located residencies in the US are susceptible to wildfires. According to this study, the number of homes in the Wildland Urban Interface (WUI) has doubled since the 1990s and more of these homes are destroyed by shrubland fires than by forest fires. The current growth of the WUI puts additional homes at risk of wildfire damage [13]. California and Nevada are among the western states that are most prone to wildfires because of their dry, and therefore flammable, coniferous forests and shrublands [3].
Shrublands and grasslands are the prevailing vegetation type in the western US. Approximately 50% of Nevada is dominated by Great Basin sagebrush (Artemisia tridentata), which also flourishes in the northern section of the intermountain West and covers more than 485,000 km2 of the western US [14,15,16,17]. Rubber rabbitbrush (Ericameria nauseosa) and bitterbrush (Purshia tridentata) are also common fuels in the Nevada sagebrush ecosystem [18]. A recent study by Radeloff et al. [19] shows that most of Nevada is dominated by either shrubland or grassland, especially within recent fire perimeters. The same study also demonstrated that WUI fires in these landscapes have increased since 1990 and have burned larger areas than forest fires. Therefore, studying shrubland/grassland fires is very important for Nevada and the western US. As an example, the Martin Fire in 2018, which is the largest recorded fire in Nevada, burned ~1780 km2 of land, primarily within the sagebrush ecosystem of northern Nevada [20,21]. The invasion of cheatgrass into the sagebrush ecosystem has also greatly changed fire ecology and increased fire frequency and size, especially in the last decade. Despite this, fire science research has mainly focused on conifer forest fires [3], so an in-depth understanding of sagebrush fires, especially of their impact on the environment and soil properties, is still missing.
Fire-induced soil hydrophobicity can alter watershed hydrology and lead to soil erosion, flooding, debris flows, and mudslides [22,23,24,25,26], which have been reported by multiple studies [3,4,22,23,24,25,26,27,28,29,30,31,32,33]. Fire-induced SWR is likely caused by changes in the chemistry of Soil Organic Matter (SOM) caused by the soil heating up [3,4,22,23,24,25,26,34] and organic compounds from smoke diffusing into the soil along the thermal gradient during a fire [30]. Fire-induced SWR typically appears as a layer of water-repellent soil parallel to the soil surface [24,32,35]. The thickness of the water-repellent layer depends on several factors, including fuel, soil composition, burn intensity, and duration [36]. Water Drop Penetration Time (WDPT) and Apparent Contact Angle (ACA) are common parameters for quantifying the degree of SWR. WDPT represents the time it takes for a water droplet to be fully absorbed into the soil surface [3,30,37,38,39], whereas ACA is the angle a sessile water droplet forms at the contact with air and the soil surface, which is typically measured with a goniometer [3,39,40,41,42].
Many studies have reported various ranges in temperature thresholds for the formation, occurrence, and destruction of fire-induced SWR under both field and laboratory conditions. Cawson et al. [29] summarized some of the laboratory experiments used to characterize temperature ranges for the creation and elimination of SWR. For example, they reported no or only insignificant changes in SWR for soil temperatures under 175 °C, increased SWR for soil temperatures between 175 °C and 200 °C, and a reduction or elimination of SWR at soil temperatures between 280 °C and 400 °C. According to Cawson et al. [29], burn temperature, soil condition, and oxygen supply can further affect these temperature ranges. Although many studies have assessed chemical changes in postfire soils that may cause SWR, the nature and role of organic compounds found in the soil and how these compounds affect SWR is poorly understood. Several studies [26,30,43,44,45,46,47] have insisted on positive relationships between the amount of organic material in the soil and SWR. For example, Morley et al. [43] reported a greater number of organic compounds (e.g., alkanes) and high molecular mass polar compounds (e.g., fatty acids) in water-repellent soils than in wettable soils. De Blas et al. [47] assessed the role of some organic hydrophobic fractions in water-repellent soils under different forest vegetation types, including Pinus pinaster and Eucalyptus globulus. They observed that the removal of lipids and extractable humic substances decreased the SWR in all soil samples and even led to wettability (WDPT < 5 s) for some samples. Very few studies—including [48,49,50]—have investigated fire-induced SWR in shrubland ecosystems. Williams et al. [48], Pierson et al. [49], and Glenn and Finley [50] investigated fire disturbances in sagebrush landscapes. Glenn and Finely [50] reported more SWR in shrublands than in grasslands. According to these studies, postfire SWR in sagebrush ecosystems is more dependent on the removal of vegetation during fire, preexisting vegetation state, and background SWR, not the fire-induced SWR. Studying pre- and postfire soil conditions is crucial, especially for the very large areas occupied by the sagebrush ecosystem.
Given the ecological importance of sagebrush wildfires in Nevada, the goal of this study was to address fire-induced SWR in a sagebrush ecosystem, a largely neglected research area, by measuring the physical and chemical changes in fire-affected soils. Therefore, the findings from this study improve our understanding of sagebrush ecosystems and their response to fires, which is critical for mitigating postfire hazards.
2. Materials and Methods
2.1. Locations of Fuels and Soil Collection
The fuels (sagebrush—SB, rabbitbrush—RB, and bitterbrush—BB) (Figure 1) were collected from vegetated areas near Desert Research Institute (DRI; Reno, NV, USA): latitude 39°34′17.76″ N, longitude 119°48′3.6″ E, elevation 1516 m (Figure 2). All the fuels were collected on 15 August 2022, and were kept under laboratory conditions (ambient air temperature 22 °C to 23 °C, relative humidity (RH) between 15% and 25%) a few hours prior to the burns (Figure 1). Unburned soil samples were collected from around Red Rock Road, northeast of Reno, Nevada. The soil for the burn experiments was collected from the Red Rock Road 1 experimental field site (latitude: 39°48′1.302″ N, longitude: 119°55′22.95″ W, 1723 m (5654 ft) above Mean Sea Level (MSL)).
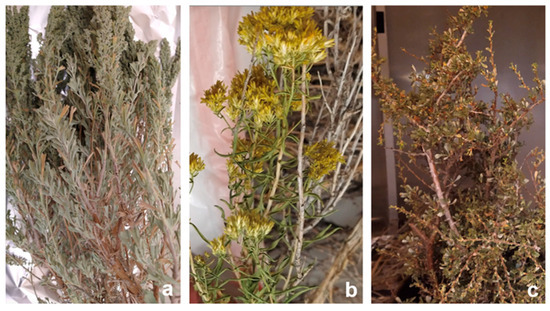
Figure 1.
Three fuels used for test burns: sagebrush (Artemisia tridentata) (SB) (a), rabbitbrush (Ericameria nauseosa) (RB) (b), bitterbrush (Purshia tridentata) (BB) (c).
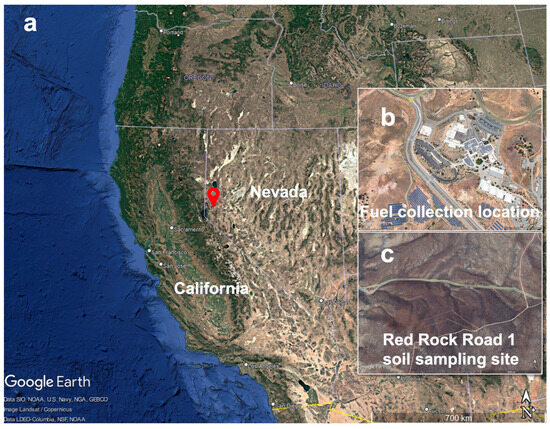
Figure 2.
Map showing: the location of the study site in Nevada (a), the fuel collection site (b), and the soil sampling site (c) (adapted from Google Earth).
Soil samples were collected from the topsoil (0 to 10 cm) within a small gully developed in colluvium on the northern flank of an incised rock outcrop. Soils at this site were formed from Cretaceous granitic rocks [51] and belong to the Bedell series. The Bedell series consists of well-drained Argixerolls on 0 to 15% slopes (footslopes and toeslopes; Soil Survey Staff, 2024). Typical Bedell soils contain dark grayish-brown A horizons up to 50 cm thick with low (<10%) gravel content above weakly to moderately developed Bt horizons. Soils in upslope positions are thinner (~50 to 100 cm to bedrock) and have thinner A horizons (26 to 36 cm). Organic matter contents in A horizons of soils in the study area are ~1% to 3% by mass and the soil surfaces are commonly stabilized by a combination of sagebrush, bitterbrush, rabbitbrush, and other desert shrubs [51,52]. According to [53], bitterbrush and rabbitbrush are among the most common plants in the sagebrush ecosystem.
2.2. Combustion Chamber and On-Line Measurements
The test burns for the three fuels (RB, SB, and BB) were performed in the DRI combustion chamber [54]. Briefly, the DRI combustion chamber is a vertical cuboid (1.83 m × 1.83 m × 2.06 m) made of aluminum and designed for controlled open combustion of solids [54]. Within the combustion chamber, a 7.57 L stainless steel stockpot was used to contain the soil during the burn experiments. The internal wall of the stockpot was insulated with fireproof fiber insulation material to minimize wall effects of the stainless steel on heat transfer in the soil (Figure 3a–d). The stockpot was then filled with air-dried soil from the Red Rock Road 1 experimental field site. Three thermocouples (TL1915 K-Type Inconel—2012 °F—1.6 mm/150 mm; PerfectPrime, Barbican, UK) were installed to measure the spatial and temporal temperature distribution above and below the soil surface, as seen in Figure 3c. The first thermocouple was placed 4 cm above the soil surface (hereafter referred to as T1) The second thermocouple was installed right at the soil surface (hereafter referred to as T2), and the third thermocouple was placed 2 cm below the soil surface (hereafter referred to as T3). Temperature was measured at the 2 cm soil depth to determine how the fuel-burning process affects soil temperature and the formation of repellency deeper in the soil.
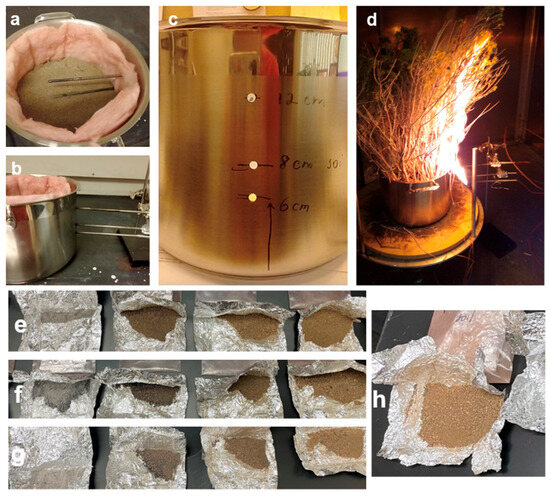
Figure 3.
Laboratory setup of combustion experiments: Top view of the thermocouples inside the insulated pot (a), side view of the positions of the thermocouples (b), distances from the bottom of the pot where the thermocouples were placed in the ports (6, 8, 12 cm) (c), and laboratory burn of fuel (sagebrush) (d). Soil and ash samples collected after the laboratory burn (from left to right): RB ash, RB soil mixed with ash, RB burned soil, and RB burned soil from a 2 cm depth (e), SB ash, SB soil mixed with ash, SB burned soil, and SB burned soil from a 2 cm depth (f), BB ash, BB soil mixed with ash, BB burned soil, BB burned soil from a 2 cm depth (g), and unburned soil (h).
For each burn experiment, approximately 1 kg of rabbitbrush, 500 g of sagebrush, and 500 g of bitterbrush were placed as fuel on top of the soil in the stockpot. The fuel was ignited using Bernzomatic standard propane fuel (Worthington Industries, Columbus, OH, USA). When the burn was complete, the stockpot containing the ash and soil was allowed to cool to ambient temperature and the soil and ash samples were collected for further analyses. From each of the three burn experiments (one experiment per fuel type), four types of samples were collected: ash, surface soil, soil mixed with ash, burned surface soil, and burned soil from 2 cm below the surface (Table 1). Figure 3e–g show how the individual ash and soil samples looked after the burn experiments. For comparison, Figure 3h shows unburned soil from Red Rock Road 1.

Table 1.
Details of the collected samples (SB = sagebrush, RB = rabbitbrush, and BB = bitterbrush).
2.3. WDPT Measurements
The four types of ash and soil samples described in Table 1 were tested for water repellency using WDPT and ACA analyses. The WDPT measurements were performed using a procedure described elsewhere [30,38,55,56]. Briefly, drops of deionized water (mass of 25 ± 4 mg) were applied to the sample surfaces using a disposable 2 mL glass pipette (VWR, Radnor, PA, USA) with a latex bulb (Fisher Scientific, Pittsburg, PA, USA). Seven to nine water drops were placed onto the soil or ash surface from a height of approximately 1 cm. The WDPT was measured as the time that it took for a water droplet to be fully absorbed into the sample surface. WDPT tests categorize soils as wettable when WDPT is less than 0.5 s and water repellent if WDPT is more than 5 s. The range for high water repellency was between 60 s and 600 s, and extremely hydrophobic above 3600 s [30,57].
2.4. ACA Measurements
The ACA of four types of ash and soil samples described in Table 1 were measured with a goniometer (model FTÅ1000, First Ten Ångstroms Inc., Portsmouth, VA, USA). All samples were unpacked and left open at room temperatures of ~23 °C to 24 °C and 10% to 30% of RH for at least 12 h prior to the ACA measurements. Samples were then sifted using a 500 µm sieve (TM E-11, No. 35; Soiltest Inc., Evanston, IL, USA) to remove larger particles that could interfere with the goniometer test. Sample slides for the goniometer test were prepared by mounting ash and soil sample material onto double-sided adhesive tape (Scotch and 3M, Permanent Double-Sided Tape “Narrow”, St. Paul, MN, USA) attached to a glass microscope slide (clear glass, ground edges, precleaned 25.4 mm × 76.2 mm slides, AmScope, Irvine, CA, USA). To ensure enough sample material was on the sample slide, the slide was dipped into the sample material several times and the excess material was removed by gently tapping and shaking the slide upside-down. Figure 4a shows sample slides with soil mixed with ash as the sample material. ACA measurements were performed by placing a droplet of deionized water (droplet volume approximately 8 µL) from the 27-gage syringe needle of the pipette fixed to the FTÅ1000 device onto the sample slide (Figure 4b). The ACA between the droplet and ash or soil was measured from an optical image contact between the droplet, surrounding air, and underlying ash or soil material using a video microscope (First Ten Ångstroms Inc., Portsmouth, VA, USA) and FTÅ1000 image analysis software (version 2.0). ACA values above 90° suggest high water repellency, whereas values below 90° are an indicator of low water repellency [3,4,46]. Five to nine ACA measurements could be performed on each sample slide within five minutes of the sample slide being prepared. RH in the ambient air during measurement varied between 20% and 30%.
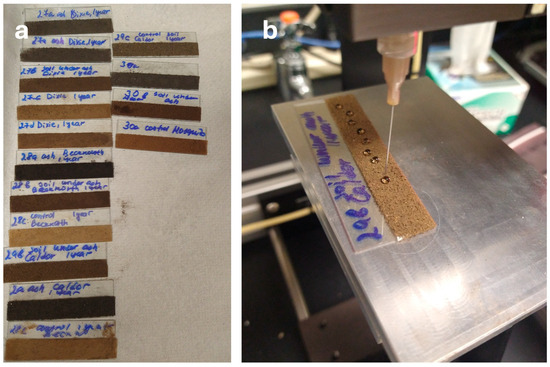
Figure 4.
Apparent Contact Angle (ACA) measurements using the goniometer technique: soil mixed with ash samples prepared on microscope slides (a), and SB soil and ash sample prepared for the ACA measurements (b).
2.5. Reflectance Measurements
The reflectance spectra of the laboratory burned ash and soil samples summarized in Table 1 were captured using an ASD FieldSpec 3 spectroradiometer (ASD Inc., Boulder, CO, USA) on 30 July 2023, under sunny and clear sky illumination at ~12:00 PM (PST) at DRI, Reno, NV, USA. The samples were taken out of the refrigerator and were kept at room temperature (23° ± 1°) for approximately 3 h to bring all samples to the same moisture content (preventing condensation) and temperature before recording the measurements. The surface of the samples was leveled evenly and the contact probe was held ~2 cm above the samples to record the solar reflectance. A total of seven spectra were collected from seven different spots on each sample. A Field of View (FOV) of 18° was used and the spectral reflectance was measured from a wavelength of 350 to 2500 nm and calibrated using the reflectance measurements of a white reference target (i.e., Spectralon) and the dark current of the spectroradiometer. The ASD FieldSpec 3 combines three separate spectrometers (first detector: 350 to 1000 nm, second detector: 1000 to 1830 nm, and third detector: 1830 to 2500 nm, Boulder, CO, USA), which causes artifacts near the two spectral boundaries (i.e., 1000 and 1830 nm). The spectra were exported using ViewSpecPro (version 6.2) and RS3 software (version 6.4.0) and were analyzed with Microsoft Excel. The relative reflectance was automatically calculated by dividing the sample reflectance by the reflectance of the white reference. Because of strong atmospheric absorption features, the low-signal noisy regions around the wavelengths between 1832 and 1926 nm, and between 2453 and 2500 nm were removed from the spectra.
2.6. FTIR Measurements
Soil samples selected for FTIR measurements were sifted through a 20 μm USA standard test sieve (Gilson Company, Inc., Columbus, OH, USA). Potassium bromide (KBr) pellets were prepared for FTIR analysis by adding ~0.5 mg of sample material to 200 mg of KBr (PIKE Technologies, Inc., Madison, WI, USA) and this mix was ground with an agate mortar and pestle for 5 min. These pellets were pressed and flattened by a hydraulic press at ~15 MPa pressure to achieve the optimal thickness for high-quality FTIR spectra. FTIR transmittance spectra were acquired using a Nicolet 380 FTIR instrument (Thermo Fisher Scientific Inc., Waltham, MA, USA) over the wavenumber scan range of 4000 to 400 cm−1. Thirty-two spectral scans were collected over ~39 s in total for each sample of ash, burned, and unburned soil. Final transmittance spectra were calculated using OMNIC software (version 8.0) and further analyzed using Microsoft Excel (version 2509) and Python (version 3.13). We used the FTIR technique to analyze the four major functional groups of organic compounds (semiquantitative analysis) in the soil samples.
We used methanol to extract organic compounds from the soil and the FTIR technique to conduct the chemical characterizations of the compounds [58,59,60,61,62,63,64,65,66,67,68]. The soil samples in our study were placed in 4 mL vials (VWR International, LLC, Radnor, PA, USA) and were treated so that equivalent amounts of methanol were retained in the upper surfaces. The samples were placed on the shaker rotisserie (Thermo Scientific, Des Moines, IA, USA) for 24 h and sonicated using ultrasonic cleaner (Branson Ultrasonics Corporation, Brookfield, CT, USA) for 2 h. Finally, the samples were transferred into 15 mL centrifuge tubes (VWR International, LLC, Radnor, PA, USA) and centrifuged (Southwest Science, Roebling, NJ, USA) twice. Titan3 PTFE 30 mm, 0.45 µm hydrophilic filters (Thermo Fisher Scientific Inc., Rockwood, TN, USA) were used to remove the solid particles from the extract. The samples were also placed under the Reacti-ThermTM heating module (Pierce, Rockford, IL, USA) that was attached to an Ultra High Purity NI UHP250 compressed nitrogen tank (Airgas, Radnor, PA, USA) for 5 min to increase the concentration of the solution [64,69,70,71,72,73].
3. Results and Discussion
3.1. Temperature Analysis
Figure 5 shows temperature as a function of time for individual burns and three fuels (Figure 5a: RB, Figure 5b: SB, and Figure 5c: BB). Table 2 presents the durations of active burning, here defined by the temperature above the surface (T1) being several times higher (at least 15 times) than room temperature. The shortest burn was for RB fuel (~130 min), whereas SB and BB fuel burns lasted ~260 and ~380 min, respectively. RB and SB fuel burned more in the flaming phase compared to BB fuel, which burned the longest and with lower temperatures throughout the temperature profile in the smoldering-combustion phase. Combustion phases were identified visually. Table 2 also lists the maximum temperatures recorded with T1, T2, and T3 for all the fuels. The maximum temperature above the soil surface (T1) was the highest for BB fuel (708.6 °C) followed by 678.9 °C and 331.4 °C for SB and RB fuels, respectively. For the soil surface (T2), the maximum temperature did not vary significantly between the three fuels (343.8 °C to 361.7 °C), whereas the maximum temperature at a 2 cm depth in the soil (T3) for SB fuel reached 240.7 °C, which was higher than the maximum temperatures for BB (147.5 °C) and RB (124.4 °C) fuels. Figure 5 shows temperature as a function of time for the three burn experiments. Temperature fluctuations 4 cm above the soil surface (T1) were the largest for all three fuel treatments, which was expected because of the lower heat capacity of air compared to soil. Figure 5 also shows how soil dampens the temperature maxima (i.e., the soil surface became considerably hotter than the soil at the 2 cm depth) and how the temperature maxima at the 2 cm depth were delayed compared to the temperature maxima at the soil surface. The temperature curves at the soil surface and at the 2 cm depth also started to overlap around the same temperature (Figure 5a: ~90 °C for RB, Figure 5b: ~90 °C for SB, Figure 5c: ~60 °C for BB) toward the end of the burn for all three fuel treatments. In addition, the T2 and T3 curves are the farthest apart for RB and the closest for SB from the beginning of the burn until shortly after reaching the maximum temperature. The greatest difference (high temperature gradient) between the T2 and T3 curves is observed for RB fuel (Figure 5a), which may have resulted from the fast and short combustion of RB fuel (~130 min) compared to the combustion intensity and duration of SB and BB fuels [32,36,74,75,76,77,78]. Our results are in agreement with the temperature values reported by Sirotiak et al. [79]. Their laboratory-simulated fires resulted in a relatively stable temperature at the 2 cm depth of ~170 °C, which is close to the range of ~124.4 °C to ~147.5 °C of the maximum temperatures observed at the 2 cm depth for all our burns (Figure 5). We also noticed that the soil temperature profiles (T2—soil surface and T3—2 cm deep in soil) for our burns were smooth and with no significant fluctuations, especially for RB and BB fuels, which is typical temperature behavior observed in other studies such as [79] and was likely caused by the soil heat capacity dampening the fast fluctuation observed for T1 above the surface. DeBano et al. [36] investigated the impact of fire on the movement of hydrophobic compounds at different sand depths under several laboratory scenarios. Although a different fuel (pine litter) was used, the temperatures profiles observed in their soil samples were comparable to those observed during our burns. For example, the maximum temperature taken on the surface of the dry pure quartz sand (dried for 2 h at 105 °C) in the experiment from [36] was 350 °C, which is close to our T2 values of 343.8 °C for RB, 373.5 °C for SB, and 361.7 °C for BB fuels. In another experimental work, Gimeno-García and Rubio [80] conducted laboratory burns to evaluate the spatial distribution of temperature on the surface of the soil using thermocouples during shrub fires. The peak temperature for their soil surfaces exceeded 600 °C in most cases for both high- and moderate-severity burn scenarios. The average temperatures at the soil surface ranged from 347 °C to 630 °C for both scenarios, so the T2 soil surface temperature values in our study (Table 2) are comparable to those measured by Gimeno-García and Rubio.
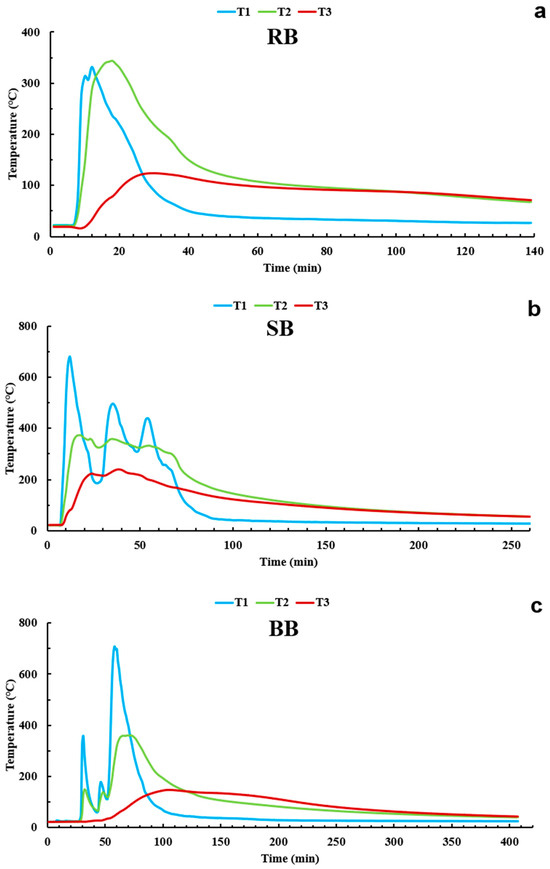
Figure 5.
Air and soil temperatures as functions of time for all three tested fuel treatments: RB—rabbitbrush (a), SB—sagebrush (b), and BB—bitterbrush (c). Temperatures were taken during laboratory burn experiments using the following thermocouples: T1 is the thermocouple placed 4 cm above the soil surface, T2 is the thermocouple on the soil surface, T3 is the thermocouple 2 cm below the soil surface.

Table 2.
Temperature measurements with three thermocouples: T1—4 cm above the soil surface for measuring combustion temperature, T2—on the soil surface for measuring soil surface temperature, T3—2 cm below the soil surface for measuring soil temperature. * Active burning duration was counted from the minute the fire started until temperatures declined to room temperature (between 22 °C and 24 °C).
Our results for soil surface temperatures during laboratory combustion are also in good agreement with those reported for real wildfires. The literature on soil temperatures during wildfires reports that the soil surface temperature can reach between 500 °C and 700 °C during intense wildfires, whereas the soil surface temperature is between 250 °C and 450 °C for low and moderate severity wildfires [81,82]. Rundel [83] summarized the average of the maximum soil surface temperatures during wildfires in different vegetation systems, including grassland, forest, shrublands, and slash. According to [83], the maximum soil surface temperature ranged from ~245 °C to 700 °C for shrublands, with the highest temperatures found for California chaparral shrublands, 170 °C to 245 °C for grasslands, and 220 °C to 300 °C for coniferous forests. Therefore, our soil surface temperatures are comparable to the lower values for shrubland wildfires reported by [83]. In conclusion, the temperatures we observed in our laboratory burns are representative of real soil surface temperatures during wildland fires.
3.2. Soil Water Repellency Analysis with WDPT and ACA
Figure 6 and Table S1 present the averaged WDPT values for all samples summarized in Table 1. Compared to the samples of unburned soil (WDPT < 0.5 s) and soil mixed with ash (WDPT: 1 to 3.2 s), burned surface soil samples and samples from the soil layer below the ash showed significantly higher WDPT values (~600 times) ranging from wettable to slightly–highly water repellent (WDPT: from 1 to 600 s) for all tested fuels (RB, SB, and BB). The WDPT measurements were stopped after 600 s due to visually detectable evaporation of deposited water droplets. It should be noted that the burned soils mixed with ash had lower SWR values compared to the burned soil samples, which is most likely due to the presence of highly wettable ash [30,33]. It is also interesting that the ashes from RB, SB, and BB were wettable, which is evident from their respective WDPT values being <1 s (Figure 6, Table 1). WDPT measurements of the soil samples collected at a 2 cm depth showed higher SWR for RB and BB compared to samples from SB. We hypothesize that fire-induced heat penetrated deeper into the soil for RB and BB fuels compared to SB fuel and caused high SWR [30]. DeBano et al. [36] discussed that the penetration of heat and hydrophobic compounds downward into the soil surrogate can cause the formation of SWR as deep as 3–4 cm for dry sand exposed to a 25 min burn. The differences in WDPT values depend on several parameters such as fuel type, soil structure and chemical composition, burn temperature and severity, amount of fuel, and fuel moisture content [22,23,27,32].
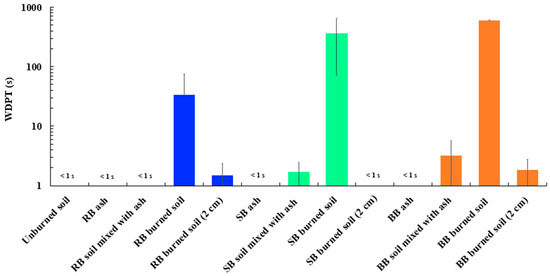
Figure 6.
Water Drop Penetration Time (WDPT) plotted on a log scale for all samples. Error bars represent standard deviations calculated based on five to nine WDPT measurements (Table S1).
There are several studies that evaluated the SWR degree in areas affected by fires in sagebrush ecosystem. Pierson et al. [49] reported WDPT values ranging from 0 to 300 s for burned and unburned coppice (under shrub canopy) and interspace (area between shrub and canopies) microsites within sagebrush-dominated landscapes after the 1999 Denio Fire in southwestern Nevada. The highest WDPT value (~300 s) was observed for unburned and burned sites of coppice and between 200 s and 250 s for both the postfire fire soils at a depth of 3 cm. Glen and Finley [50] assessed the SWR of burned and unburned areas with the WDPT test within sagebrush steppe after the 2005 Clover Fire in Boise, Idaho. The authors observed the highest SWR at the burned soil surface and at the 2 cm depth, which is similar to our results. In addition, moderate severity fire-affected areas in shrub-dominated locations exhibited more SWR than in grass areas.
Figure 7 presents ACA values measured with the FTÅ1000 goniometer for all RB, SB, and BB fuel-treatment samples: ash, a mixture of soil and ash, burned and unburned soils, and burned soil from a 2 cm depth. The lowest ACA values were observed for the unburned soils and for the ash samples for all three fuel treatments; these values were all in the nonrepellent range of <10° to 12° [30,46]. The detection limit for ACA using the FTÅ1000 goniometer is approximately 10°, so the ACA values found for ash and unburned soil were at the detection limit of the goniometer. The highest values were found for the burned surface soils with ACAs 59.7° ± 10.9°, 78.4° ± 5.8°, 88.2° ± 2.4° for RB, SB, and BB fuels, respectively. Overall, the ACAs for burned soils for all three fuel treatments (RB, SB, and BB) were ~6 to 9 times higher than the ACAs of unburned soils. The samples of soil mixed with ash had slightly smaller ACA values (~3% smaller for RB and 23% smaller for BB) than the respective burned surface soil samples, whereas the burned soil ACAs for SB were comparable to the ACAs of soil mixed with ash. The slightly lower ACAs for soil mixed with ash were most likely due to the presence of wettable ash. Although the ACA and WDPT differences between burned soil samples and soil mixed with ash for RB were not statistically significant (ACA: RB: p = 0.7496 > 0.05, SB: p = 0.0404 < 0.05, BB: p = 0.0137 < 0.05—WDPT: RB: p = 0.065 > 0.05, SB: p = 0.0056 < 0.05, BB: p = 0.0001 < 0.05), we can still see differences in terms of ACA and WDPT for the same soil samples (burned soil and soil mixed with ash) for SB and BB. Soil samples from burned soil from a 2 cm depth had ACA values between 31° and 47° for all the fuels, which is in agreement with our WDPT results and indicates the formation of some SWR at a depth of ~2 cm, even though these ACA values were 40% to 48% lower than those for the burned soil samples.
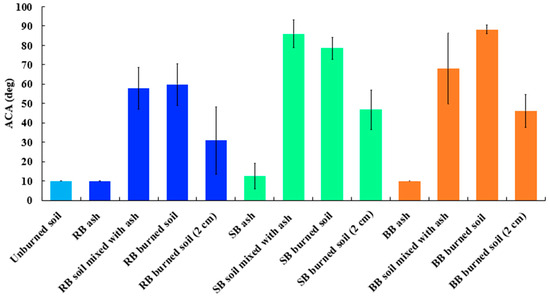
Figure 7.
Apparent Contact Angle (ACA) plot for all tested fuels: RB—Rabbitbrush, SB—Sagebrush, and BB—Bitterbrush. Error bars represent standard deviations calculated based on five to eight ACA measurements with the goniometer (Table S1).
The results of our ACA measurements agree with the ACA values reported in other studies [3,30,84], even though their measurements were not performed on sagebrush ecosystem samples. For example, McGhie et al. [84] observed ACAs of 50 to 92° for a 2% mixture of fire-affected sand pastures and more than 90° for most of the 5% mixture of the same materials. For Sierra Nevada conifer forest (US), Samburova et al. [3] reported significantly higher (1.1 to 9 times) ACA values overall for burned soils after the 2021 megafires compared to ACA values for comparable, unburned soils. For example, in case of the Beckwourth Complex Fire, the ACAs differed from 65.3 ± 9.6° for unburned soils to 88.9 ± 4.6° for the burned soils. Unlike in this study, some other studies [3,23] also observed high SWR for unburned soils. Doerr et al. [23] and Samburova et al. [3] observed high SWR for unburned soils in coniferous forests in the northwestern USA, which was most likely caused by the chemistry of conifer duff and vegetation leaking hydrophobic compounds into the soil [85,86].
To compare the results from ACA measurements with the results from the WDPT test, the WDPT and ACA data points for the soil samples (unburned, burned, and 2 cm below the surface) were correlated. Figure 8 presents a summary of these results. A high correlation (R2 = 0.868) [87] between WDPT and ACA was found, indicating that WDPT and ACA are related. Shillito et al. [57] showed that there is a highly nonlinear relationship between WDPT and the effective contact angle of water-repellent sand. These findings are also in good agreement with other studies such as [3], in which the authors observed an increase in ACA values with increasing WDPT for the soil samples tested. The unburned soil showed no SWR, as expected. However, there was an increase in SWR in samples of burned soil and burned soil from a 2 cm depth, which is reflected in their WDPT and ACA values in the plot. Based on our results, we also conclude that ACA is likely more sensitive to SWR changes than WDPT. However, measuring ACA is also more labor and equipment intensive than a simple WDPT test. One reason that the WDPT test had a lower sensitivity than the ACA technique is that the WDPT measurements had to be stopped after 600 s due to water evaporation. Another study [88] also mentioned that the WDPT is only sensitive to a narrow range of ACA values (above 90°), so WDPT might not provide much information about SWR severity for the ACA values below 90°.
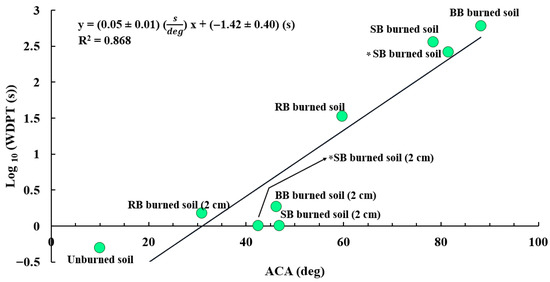
Figure 8.
Correlations between WDPT (natural logarithm (ln) of WDPTs have been calculated and used for the plot) versus ACA values for the unburned and burned samples from all fuels (R2 = 0.868). The asterisk (*) indicates the extra two data points (samples of burned soil and burned soil from a 2 cm depth) for another experiment we performed using dry sagebrush to see the difference between fresh and dry fuels in terms of SWR level (e.g., ACA and WDPT).
Figure 9 shows the link between the maximum temperature values for soils during burning (T2—surface, T3—deep) and their ACA values measured post-burns. A high correlation between the ACA and maximum temperature values (R2 = 0.777) for the temperature range of 124.4 °C to 373.5 °C indicates a direct dependence of SWR characterized by ACA on temperature. Some fundamental studies [22,25] previously characterized the impact of temperature on SWR. They showed that depending on the temperature value, SWR could be either destroyed or intensified. For example, DeBano and Krammes [25] observed that the soil became nonwettable after being heated to 316 °C for 5 min and became nonrepellent after being burned at 482 °C for 10 min. However, several other laboratory studies [22,27,29,89,90] reported eliminating SWR at temperatures above 280 °C to 400 °C, which we did not observe in our experiments. We found water repellency (ACA values between 59.76° ± 10.91° and 88.21° ± 2.42°) at the soil surface that was heated above 300 °C (T2 values in Table 2). However, the ACA measured for SB burned soil (78.44° ± 5.84°) at 373.5 °C is below the ACA for BB burned soil (ACA = 88.21° ± 2.42°), with a measured surface temperature of 361.7 °C, which is comparable to the similar RB burned soil (ACA = 59.76° ± 10.91°) at a lower soil surface temperature (T = 343.8 °C). This effect could be due to the elimination of SWR caused by the decomposition of organic matter [22,27,29,89,90]. Overall, our study clearly shows the presence of a water-repellent layer right at the surface of the mineral soil under the ash layer at the mineral soil surface temperatures above 300 °C. It should be noted that temperature measurements were performed with the thermocouple right at the soil surface (T2) and we hypothesize that the heat from the fuel combustion could have caused the high readings from T2.
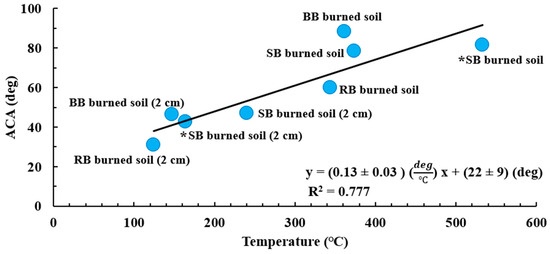
Figure 9.
Correlation between maximum temperatures of T2 (soil surface) and T3 (at a 2 cm depth) and averaged ACA values for the respective samples of burned soil and burned soil from 2 cm below the surface from all fuels (R2 = 0.777). The asterisk (*) indicates two extra data points (samples of burned soil and burned soils from a 2 cm depth) for another experiment we performed (e.g., ACA and WDPT).
3.3. Reflectance Analysis of Samples
Figure 10 shows the reflectance spectra in the wavelength range of 350 to 2500 nm for all sample types (ash, burned soil, soil mixed with ash, burned soil from a 2 cm depth, and unburned soil) for the three tested fuel treatments (RB, SB, and BB). Overall, the reflectance spectra of the samples for all the fuels look similar and are within the same order throughout the whole spectra for a large spectral range, between 400 nm and 1300 nm. Therefore, to compare the reflectance spectra of the different types of samples and tested fuel treatments, the reflectance values in the range of 400 to 1300 nm were averaged, as shown in Table 3. This range was selected based on the observed consistency in reflectance behavior for all tested fuels (Figure 10). The most reflective soil samples for all tested fuels (RB, SB, and BB) were the unburned samples, exemplified by their bright color, followed by the samples of the soil burned 2 cm below the surface and the burned soils with the samples of the burned soil mixed with ash having the lowest reflectance. When comparing the fuel treatments, RB fuel had the highest averaged reflectance (0.257) for burned soil samples and BB fuel had the lowest (0.220). For soil burned 2 cm below the surface, the averaged reflectance ranged from 0.279 to 0.285, with the highest for BB fuel (0.285) and lowest for SB fuel (0.279), respectively (Table 3). However, the ash samples from all the fuels in our study were visually dark in color (Figure 3e–g), and therefore have low reflectance. In addition, the ash reflectance curves are spectrally flatter compared to the reflectance curves of the other samples. Based on Table 3, the highest and lowest averaged reflectance values for the ash samples are for BB fuel (0.343) and SB fuel (0.196), respectively. In the case of the samples of soil mixed with ash, RB fuel (0.224) and SB fuel (0.177) had the highest and lowest averaged reflectance, respectively, over the same spectral range. The averaged reflectance of BB ash was lower by ~11%, whereas the averaged reflectances of RB and SB ash were lower by ~20% and ~37%, respectively, than that of the unburned soil. As mentioned previously, the ash samples in this study are dark in color (Figure 3e–g) and this color depends on burn temperature and severity. Based on studies such as [4,91,92,93,94,95,96], the ash color can change from black, which indicates the incomplete combustion (moderate severity) of SOM, to whitish gray due to complete combustion (high severity) of SOM.
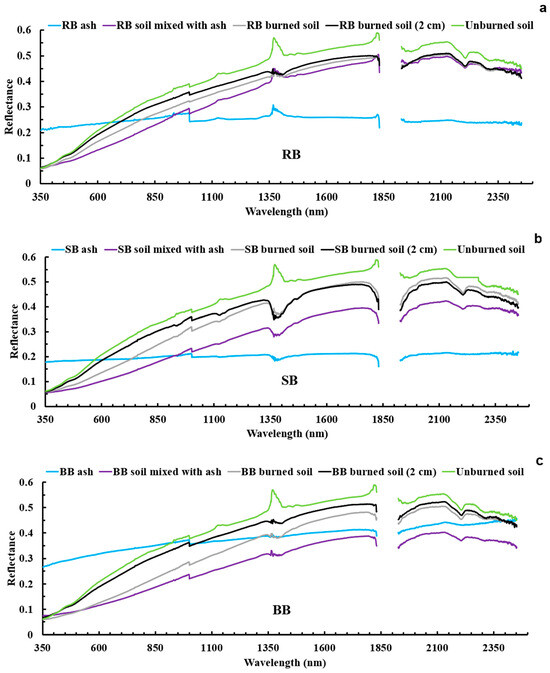
Figure 10.
Reflectance spectra for all soil samples by fuel: RB—rabbitbrush (a), SB—sagebrush (b), BB—bitterbrush (c). For each spectrum, seven replicate measurements were taken with ASD FieldSpec 3 across leveled samples, and each measurement (point) is the average of ten collected reflectance spectra.

Table 3.
Reflectance values averaged over the spectral range of 400 to 1300 nm for all collected samples (unburned soil, ash, soil mixed with ash, burned soil, and burned soil from a 2 cm depth) for RB, SB, and BB fuels. Standard deviations represent seven replicate reflectance measurements (Section 3.3).
Comparing the reflectance of the burned soils with the reflectance of the unburned soil, we observed a reduction in reflectance of 17% to 29%. Overall, a reduction in the averaged reflectance of the samples of burned soil from a 2 cm depth was in the range of ~8% to 10% for all three fuels compared to the unburned soil. Lastly, the samples of soil mixed with ash had the greatest reduction in averaged reflectance, ranging from ~28% to ~43% for all fuels, compared to the unburned soil.
In our previous study (Raeofy et al. [4], we reported similar ranges for the reflectance of various postfire burned soils and unburned soil samples for three 2021 Northern California megafires (the Dixie, Beckwourth Complex, and Caldor Fires). For example, the reflectance for burned and unburned soils collected within a few weeks after the Caldor Fire ranged from ~0.05 to ~0.4 across the wavelength range of 400 to 1300 nm. However, it should be noted that the fuels in the previous study [4] were mainly typical conifer forest fuels (e.g., Ponderosa and Jeffrey pine needles and duff), which are different from the sagebrush ecosystem vegetation in this study. Yin et al. [97] measured the reflectance spectra for a postfire background layer that consisted of soil and charcoal and the reported values ranged from ~0.1 to ~0.4 over the spectral range of 400 to 2500 nm, which is similar to the reflectance values of our laboratory-generated samples (Figure 10). The reflectance curves of their ash samples were not as spectrally flat as those of our laboratory-generated samples and the reflectance of all their samples increased with wavelength across the spectra. This may have been due to differences in the origin of the samples (e.g., lab burn or real fire), mineralogy, moisture content, etc.
The reflectance spectra for all the samples of our previous study [4] look smooth in the visible range, with the highest variations around 700 nm. Therefore, a wavelength of 700 nm was selected to find a link between the reflectance of samples of burned soil and soil burned 2 cm below the surface (T2 and T3) and their respective temperatures during burns (temperature range: 124.4 °C to 373.5 °C). Figure 11 shows the relationship between these two variables, where the slope of −0.0003 ± 0.0001 °C−1 and R2 = 0.775 indicate a high negative correlation. As SWR increases (in terms of an increase in ACA), the reflectance decreases for a temperature range of 124.4 °C to 373.5 °C (T2 and T3, respectively). Therefore, the surface of the burned soil samples have lower reflectance than the samples of soil burned 2 cm below the surface, which is likely due to the higher fire-induced heating of the surface soil samples [36,74,77,78]. In other words, fire effects on the SOM make the soil color darker—as shown in the samples of burned soil and burned soil from a 2 cm depth using RB, SB, and BB fuel in Figure 3e–g—which means the reflectance is reduced. Studies such as [89,90,91,92,93,94,95,96,97,98,99,100] have investigated the effects of heat on the reflectance of burned soil and reported lower reflectance for burned areas. For example, Lugassi et al. [100] analyzed the spectral changes in the heated soil surface reflectance after a laboratory burn experiment to map the soil surface temperature. They reported lower reflectance for the heated soil under 250 °C as the temperature increased due to incorporation of soot (an overall reflectance of 0.41 for heated soil at 251 °C) and higher reflectance with increasing temperature in the burned soil above 250 °C because of a more complete combustion of SOM (an overall reflectance of 0.55 for heated soil at 432 °C) between 350 and 2500 nm. It should be noted that the soil structure and moisture content in the Lugassi et al. [100] study were different than those in our study, which may have affected the 250 °C threshold that led to changes in the correlation between reflectance and temperature of the soil heated at this temperature. Nevertheless, the correlation between the reflectance and temperature of soil heated under 250 °C reported by Lugassi et al. [100] is in agreement with our findings from temperatures collected at T3 and the reflectance at 700 nm (overall reflectance of 0.279 °C at 240.7 °C for burned soil from a depth of 2 cm using SB fuel).
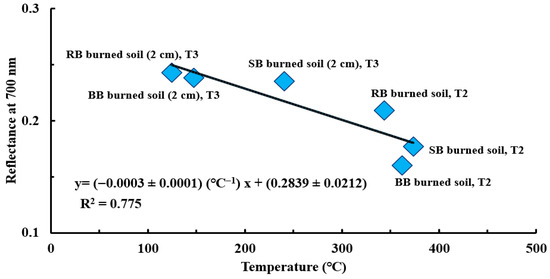
Figure 11.
The correlation between the 700 nm wavelength reflectance of samples of burned soil and burned soil from a 2 cm depth for all fuels and their respective T2 and T3 maximum temperatures (R2 = 0.775). Error bars fall within a range of 0.002 to 0.004 (<3%), which is too small to visualize in this figure.
Figure 12 shows the correlation between the averaged reflectance values from 400 to 1300 nm of the samples of burned soil and burned soil from a 2 cm depth and their respective temperatures (T2 and T3). Similar to the correlation between reflectance at 700 nm and temperature (Figure 12), we observed a high negative correlation (R2 of 0.776) between the averaged reflectance (400 to 1300 nm) and temperature, indicating that high surface temperatures (T2 and T3 ranging from 124.4 °C to 373.5 °C) during laboratory burns led to lower averaged reflectance values for samples of burned soil than samples of burned soil from a 2 cm depth.
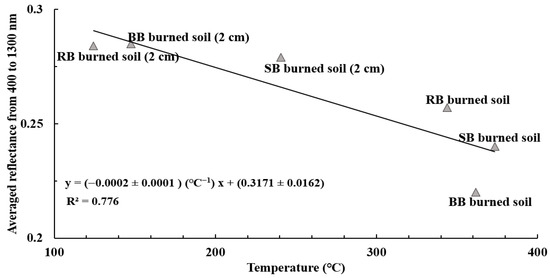
Figure 12.
The correlation between the averaged reflectance values and temperature for samples of burned soil and burned soil from a 2 cm depth for all fuels from 400 to 1300 nm (R2 = 0.776).
Visual observation of the analyzed soils (Figure 3e–g) shows that the color of the burned soil samples is darker than that of the samples of burned soil from a 2 cm depth, which is in agreement with the lower averaged reflectance values of the burned soil samples and the negative correlations between reflectance and temperature (Figure 11 and Figure 12). Similar to the laboratory experiments in this study, in real postfire soil analysis [4] for the Beckwourth Complex Fire, the unburned soil spectral reflectance curve stayed above the burned soil spectral reflectance curve between 400 nm and 1300 nm. In other words, the unburned soil had a higher reflectance than the burned soil sample over this spectral range.
Analyzing SWR using ACA data and reflectance, showed a high negative correlation (R2 value of 0.703) between the averaged reflectance values (400 to 1300 nm) and the ACAs of samples of unburned soil, soil mixed with ash, burned soil, and burned soil from a 2 cm depth for all analyzed fuels (Figure 13). The samples of soil mixed with ash had lower reflectance (~1.14 to ~1.57 times) than samples of burned soil and burned soil from a 2 cm depth. This was most likely due to the presence of dark ash in the samples of soil mixed with ash, which was also observed visually (Figure 3e–g). The highest averaged reflectance between 400 nm and 1300 nm was for the unburned soil samples (Figure 13), which was also observed for reflectance at 700 nm (Figure 12) and visually (Figure 3e–g). In addition, samples of soil mixed with ash had the lowest averaged reflectance values for all samples except for RB soil mixed with ash, which had a slightly higher reflectance (~2%) than BB burned soil over the same spectral range (Table 3). Overall, the reflectance of samples of burned soil and burned soil from a 2 cm depth using RB, SB, and BB fuel are consistent for the averaged reflectance (between 400 nm and 1300 nm) and for 700 nm data (Figure 11, Figure 12 and Figure 13). The reflectance is reduced in soil samples with darker ash due to the heat of fire and modified soil chemistry. To assess the differences in the chemical nature of unburned and burned soils that cause SWR and changes in reflectance properties, we analyzed the chemical functional groups using the FTIR technique.
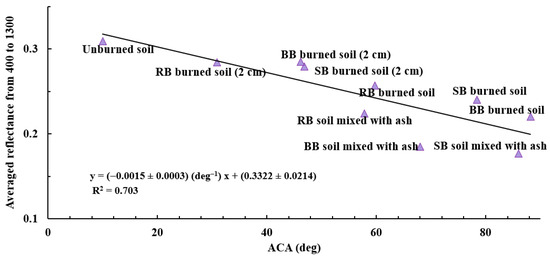
Figure 13.
The correlation between the averaged reflectance values of samples of unburned soil, soil mixed with ash, burned soil, and burned soil from a 2 cm depth and their respective ACA (R2 = 0.703) for all fuels from 400 to 1300 nm.
3.4. FTIR Analysis of Chemical Functional Groups
FTIR spectra were acquired using sifted soil samples mixed directly with KBr powder that were compressed into pellets following the procedure described in Section 2.6. Figure 14 is an example of FTIR spectra of different samples (unburned soil, ash, soil mixed with ash, burned soil, and burned soil from a 2 cm depth) for laboratory burns using RB fuel. Due to several constraints of this study, only FTIR spectra for samples of unburned soil, burned soil, and burned soil from a 2 cm depth were acquired for all fuel treatments: RB, SB, and BB. The spectra of samples for SB and BB fuels, which are similar to RB spectra, can be found in the Supplementary Materials (Figure S1). The spectra of burned soil samples show more prominent absorption bands (e.g., ~1384, ~2850, and ~2920 cm−1) than the unburned soil sample, which is likely due to chemical changes caused by combustion-induced processes [30,89,101,102,103,104]. The transmission spectra showed a high background signal of soil inorganic components, which makes it difficult to identify the functional groups associated with the hydrophobic nature of soil organic compounds. To reduce this background effect and enhance the absorption signal of the functional groups of soil organic species, extraction and pre-concentration of organic fractions of the selected samples were performed with methanol, which is one of the most common solvents used to extract soil organics [58,64,65,66,67,68].
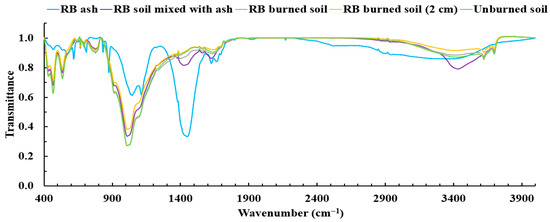
Figure 14.
FTIR spectra of unextracted samples including ash, soil mixed with ash, burned soil, burned soil from a 2 cm depth, and unburned soil for combustion using rabbitbrush (RB) as fuel.
Figure 15a shows the spectra of extracts for samples of unburned soil, burned soil, and burned soil from a 2 cm depth using RB fuel and the spectra for SB and BB fuels are included in the supplementary material (Figure S2). Figure 15b shows the differences between the unburned and burned soil samples for RB, SB, and BB and identifies six major peaks. To compare these spectra, six distinguished peaks were identified, highlighted, and assigned (Table 4, Figure 15b). The peaks at ~3620 and ~3699 cm−1 are related to the O–H stretching of inorganic clay content [69,105]. The broad peak at ~3400 cm−1 is due to the O–H stretching of hydroxyl groups of phenol, water, and alcohol [69,89,106]. The double peaks between the spectral bands of ~2850 and ~2922 cm−1 correspond to the symmetric and asymmetric stretching of aliphatic C–H bonds [69,105,107,108]. The absorption band at ~1384 cm−1 is related to O–H deformation, carbonates, stretching of aliphatic C–H cm−1, phenolic groups, and asymmetric stretching of COO− (carboxylate) and C=O (carbonyl) groups [70,109,110,111,112]. The peak at ~1437 originates from the asymmetric stretching vibrations of C=O and the presence of carbonate [4,106,112,113]. The presence of one band at ~469 cm−1 is characteristic of O–Si–O bending vibrations in silica glass and quartz [113]. The sharp peak at ~1011 cm−1 represents polysaccharides and Si–O and C–O–C stretching in clay minerals and quartz in the soil [69,89,106]. Additionally, the peak in between 1600 and 1740 cm−1 and the asymmetric peaks at ~1740 to 1700 cm−1 and at ~1640 to 1600 cm−1 have been associated with aromatic C=C, C=O bands of amide and carboxylic acid or ketone [69,89,109,110,112,114,115]. The peak at 1560 cm−1 is indicative of C=C bonds of aromatic rings and O–H bending vibrations in imogolite and allophane [116,117]. It should be noted that the position of peaks corresponding to the organics might be slightly shifted. For example, the peak corresponding to C=C aromatics is at 1560 cm−1, as reported by [116], whereas in this study it is detected at around 1569 cm−1. This could happen for several reasons, such as differences in soil composition (e.g., particle size) and overlapping of the FTIR signal from different functional groups [89,106,117,118,119,120,121,122]. Several studies [89,122,123,124,125] observed similar functional groups to those detected in this work and around the similar frequency region in the FTIR spectra of postfire soil. For example, Diniz et al. [124] presented the vibrations of C=C (aromatic) around 1600–1400 cm−1, C–H groups around 2979–2850 cm−1, C–O stretching between 1033 cm−1 and 1099 cm−1, and O–H stretching at 3300–3270 cm−1 in the FTIR spectra of heated SOM after prescribed fire. Rossi et al. [125] detected absorption bands at 2925 cm−1 and 2855 cm−1 for aliphatic methyl, C=C aromatic rings in the 1720 to 1600 cm−1 range, and O–H groups between 3440 cm−1 and 3380 cm−1 in the transmission FTIR spectra of soil after pre-harvest straw burning.
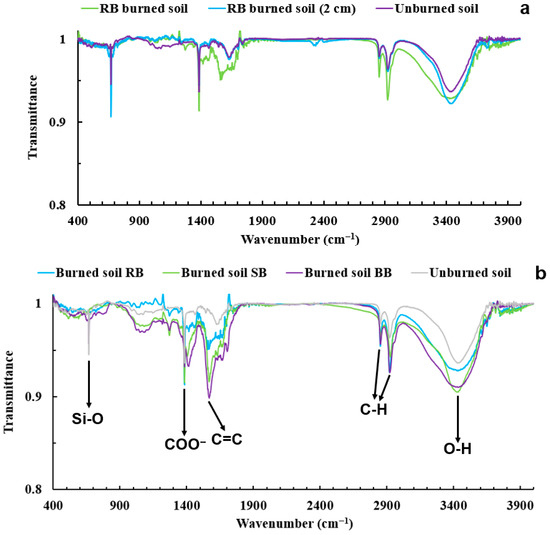
Figure 15.
FTIR spectra for methanol extracted from samples of burned soil, burned soil from a 2 cm depth, and unburned soil using RB fuel (a). FTIR spectra for methanol extracted from samples of unburned and burned soil using RB, SB, and BB fuel with the six major peaks identified (b).

Table 4.
Details of the absorption bands and their respective functional groups at approximately 667, 1384, 1569, 2850, 2920, and 3419 cm−1 that were detected in the FTIR spectra of the methanol-extracted unburned and burned soils from RB, SB, and BB fuel combustion. Peak signals of ~1384, ~1569, ~2850, ~2920, and ~3419 cm−1 and their respective functional groups (COO−, C=C, C–H, and O–H) were used in this analysis.
To compare the chemical functional group composition of analyzed soil samples, the absorption signal heights of the four major functional groups identified (C–H, C=C, O–H, and COO−) were determined and the ratios of the peak heights for these functional groups were calculated within each spectrum (Table 5). The C–H and C=C functional groups were considered nonpolar functional groups (e.g., functional groups of aliphatic and aromatic compounds), whereas the COO− and OH functional groups were assigned to polar functional groups [58,69,70,89,103,104,105,106,109,110,111,112,114,115,116,117,126]. The ratios of COO−/C–H, O–H/C–H, COO−/C=C, O–H/C=C, and C–H/C=C were calculated for each spectrum (Table 5) for all samples and COO−/C–H, O–H/C–H, COO−/C=C, O–H/C=C are interpreted as “polar versus nonpolar” functional group ratios. Overall, nonpolar functional groups are generally associated with water repellency, whereas polar functional groups are associated with wettability [127,128].

Table 5.
Identified ratios of peak signals (polar and nonpolar functional groups). The soil samples in this table were extracted with methanol and prepared with KBr.
The most significant change in “polar versus nonpolar” functional group ratios was observed in the case of COO−/C=C ratio, when this ratio decreased 1.6 to 4.3 times for the burned soils compared to the unburned soil, making the burned soil samples less polar than the unburned sample. For samples of burned soil from a 2 cm depth, this ratio was 1.3 to 1.8 times lower than for the unburned soil, showing that chemical changes (or reduced polarity) also occurred at the 2 cm depth in the soil during burns. For the O–H/C=C ratios, a decrease for all burned soils (1.1 to 3.2 times for samples of burned soil and burned soil from a 2 cm depth) was also observed except for samples of burned soil from 2 cm depths using RB fuel. Analysis of COO−/C–H, and O–H/C–H ratios (Table 5) showed either no significant change or a very slight decrease (1.1 to 1.7 times) in these ratios. The C–H/C=C ratio (nonpolar to nonpolar functional group) showed a decrease (1.1 to 3.2 times) for samples of burned soil and burned soil from a 2 cm depth compared to the unburned soil, indicating the formation of C=C structures and/or loss of C–H compounds. Based on these results, we conclude that the formation of compounds with C=C functional groups and decarboxylation (or removal of COO− functional groups) are major chemical processes that most likely affect the decrease in polarity of soil samples after laboratory burns of all three tested fuel treatments. At the same time, the reduction in O–H polar functional groups and the formation of nonpolar C–H groups likely had an insignificant effect on the decrease in soil polarity or increase in soil hydrophobicity. Overall, the decrease in ratios of two nonpolar chemical functional groups (C–H/C=C) for all samples of burned soil and burned soil from a 2 cm depth compared to the unburned soil confirms our hypothesis that the formation of compounds with C=C functional group, such as aromatic compounds, prevails over formation of C–H type compounds. These results agree with our previous study on chemical analysis of real postfire soils samples, where the Fourier-Transform Ion Cyclotron Resonance Mass Spectrometry (FT-ICR MS) method was applied to assess the chemical differences in real postfire soil samples collected after major 2021 California megafires compared to unburned soil [3]. We found that oxygen-rich organic compounds were more present in the burned soil compared to the unburned soil, which contributed to the increased aromaticity and hydrophobicity of postfire soils along with the development of Polycyclic Aromatic Hydrocarbons’ (PAHs) like organic compounds on the soil surface. Similar results on the increase in aromatic organics in postfire soils (formation of C=C functional group) have also been observed in other studies [3,122,129,130,131,132,133,134,135,136,137,138]. For example, Atanassova et al. [138] and Tinoco et al. [122] have reported the presence of PAHs (aromatic compounds with two or more fused aromatic rings in their molecular structure) [131,139,140,141,142] and the removal of oxygen-containing functional groups (e.g., decarboxylation, and increase in aromaticity of organic compounds) in fire-affected soils. Several studies on Nuclear Magnetic Resonance (NMR) analysis of postfire soils also reported an increase in aromaticity in fire-affected soil compared to unburned soil [133,135].
3.5. The Link Between Soil Chemistry (FTIR), SWR (ACA), Fire Temperature, and Reflectance
To investigate how chemical composition is affected by burn temperature and how this is reflected in soil hydrophobicity, the results of FTIR chemical functional group analysis were compared with soil temperature and ACA measurements. Figure 16a shows the correlation between the COO−/C=C and temperature for samples of burned soil and burned soil from a 2 cm depth and the combustion of RB, SB, and BB fuels. A moderate negative correlation (R2 = 0.601) between temperature increase (from 124.4 °C to 373.5 °C) and a decrease in COO−/C=C ratio by 55.7% was determined. Similar to COO−/C=C and temperature trends, the COO−/C=C ratio and ACA showed a high negative correlation (R2 = 0.900; Figure 16b). These correlations clearly indicate that decarboxylation (removal of COO−) and the formation of C=C functional groups (or aromatic compounds) during burns in the temperature range of 124.4 °C to 373.5 °C are responsible for the formation of SWR, as indicated by an increase in ACA from 31° for unburned soil to 88° for burned soil. Samburova et al. [3] also observed an increase in aromaticity in their burned soil samples from wildfires. Their findings confirmed that aromatic compounds including PAHs most likely contribute to fire-induced SWR. As was mentioned above, several other studies [122,124,133,135] show similar results (aromatization and decarboxylation in burned soil). However, some studies concluded [26,43,89,92,128,143,144] that compounds with aliphatic nature have the biggest effect on SWR. For example, Simkovic et al. [89] and Wu et al. [128] concluded that SWR was strongly correlated to the presence of aliphatic structures such as fatty acids and the degradation of those structures resulted in the soil samples becoming hydrophilic again. To explain these discrepancies related to the nature of fire-induced SWR, more comprehensive quantitative and qualitative chemical analyses on different postfire soils are needed.
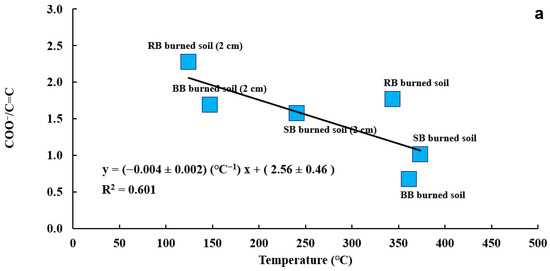
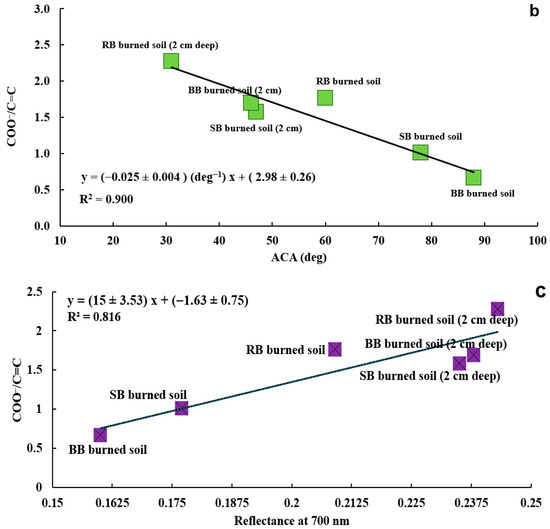
Figure 16.
Correlation between ratio of COO−/C=C for samples of burned soil and burned soil from a 2 cm depth from all fuels and their respective temperatures (R2 = 0.601) (a), Correlation between the ratio of COO−/C=C for burned soil and burned soil from a 2 cm depth for all fuels and their respective ACA values (R2 = 0.900) (b), Correlation between ratio of COO−/C=C for burned soil and burned soil from a 2 cm depth for all fuels and their respective reflectance at 700 nm (R2 = 0.816) (c). The soil samples in plots (a–c) were extracted using methanol and prepared as KBr pellets.
Figure 16c presents the correlation between the COO−/C=C ratio and the reflectance of the samples of burned soil and burned soil from a 2 cm depth at 700 nm wavelength. This high correlation (R2 = 0.816) shows that as the COO−/C=C ratio decreases, the reflectance of the samples decreases. In other words, when the samples become less polar (more hydrophobic), their reflectance decreases. Even with our limited number of samples, our results show that reflectance measurements (e.g., measurements with remote sensing tools [4,145,146,147,148]) of postfire soils can potentially be used not only for detecting SWR (Section 3.3 Reflectance analysis of samples, Figure 13), but also assessing the chemistry of the soil surface that causes fire-induced SWR. To the best of our knowledge, this is the first study that shows a relationship between soil chemistry and reflectance.
4. Conclusions
Laboratory burns of three of Nevada’s most common fuels (i.e., SB, RB, and BB) were performed and the SWR (ACA and WDPT), temperature, and reflectance of the soil surface were measured and compared with the FTIR analysis of the chemical functional groups of the soil as well as extracts.
The WDPT measurement results showed that all burned soil samples had elevated levels of SWR (RB: WDPT ~ 33 s, SB: WDPT ~ 359 s, BB: WDPT ~ 600 s) compared to the unburned soils with a WDPT value of ~1 s. Elevated SWR was further confirmed by ACA measurements showing that all burned soil samples had ACA values that were 6 to 8.8 times higher than the unburned soil. As expected, a high correlation (R2 = 0.868) between WDPT and ACA measurements was observed, and we found that ACA is likely a more sensitive parameter than WDPT for assessing SWR. However, WDPTs are easier to conduct than the goniometer tests needed to measure ACA. High correlations were observed between temperature and ACA (R2 = 0.777), ACA and averaged (R2 = 0.703) reflectance between 400 and 1300 nm, and temperature and reflectance values (reflectance at 700 nm and temperature: R2 of 0.775, the averaged reflectance in the range of 400 to 1300 nm and temperature: R2 of 0.776). These results demonstrate the potential for the reflectance measurements to detect postfire SWR, especially for large-area fires where it is intractable to conduct representative SWR measurements or collect large representative soil sample sets.
To characterize the chemical nature of postfire SWR, FTIR analysis for soil methanol extracts was performed for burned soils, burned soils from a 2 cm depth, and unburned soil samples from RB, SB, and BB fuels. The FTIR spectra showed distinct signals of the chemical functional groups of COO−, O–H, C=C, and C–H and the ratios of their signal heights were used to assess the polarity (or hydrophobicity) of the soil samples. Based on the analysis of the following “polar versus nonpolar” functional group ratios (COO−/C–H, O–H/C–H, COO−/C=C, O–H/C=C, C–H/C=C), the COO− organic compounds were more affected and decomposed by fire in comparison with polar O–H structures. However, C=C organic materials were more present in fire-affected soils than other nonpolar compounds such as C–H. We found that decarboxylation, or a decrease in COO− and an increase in C=C functional groups, is likely the mechanism for the formation of SWR after burns. To confirm our findings, more chemical analyses using individual organic species that contain these functional groups were performed. Correlations of COO−/C=C with temperature and reflectance were run and showed that as the temperature increases, the C=C compounds increase in the soil samples because of fire and when the samples become hydrophobic, their reflectance is reduced (COO−/C=C and T: R2 = 0.601, COO−/C=C and reflectance at 700 nm: R2 = 0.816). A high correlation (R2 = 0.900) between COO−/C=C and ACA indicates that the burned soil samples become more hydrophobic with higher concentrations of C=C structures, which we hypothesize most likely represent aromatic-type compounds.
Due to several project constraints, this study has several major limitations: (i) a small number of controlled burns were performed, which limited the number of data points collected; (ii) only three sage-brush ecosystem fuels were tested; and (iii) the soil temperature was measured only at the soil surface and a 2 cm depth, which made it hard to reconstruct a temperature profile to assess potential changes in SWR due to temperature at different depths. Despite these limitations, the dataset showed high correlations between temperature, reflectance, SWR (WDPT and ACA), and the chemistry of the burned soils. Overall, this is the first study that characterized not only the dependence of SWR on temperature, but also linked the postfire SWR with changes in soil reflectance and chemistry. The results of this work can help optimize assessments of SWR after wildfires using optical remote sensing techniques and link the SWR properties to postfire soil chemical changes. Moreover, little research has been performed on the chemistry of soils in sagebrush ecosystems, especially in Nevada.
Based on the results of this study, the following research on postfire SWR can be performed: (1) investigation of the formation of SWR at different soil depths and correlation of this SWR profile with soil chemistry, reflectance, and temperature of the burn; (2) comparison of our laboratory results with those for real-life wildland fires in Nevada; (3) assessment of the impact of different combustion regimes (smoldering versus flaming) and soil condition (e.g., water content, SOM content) on soil chemistry and formation of SWR during burns; and (4) analysis of additional sagebrush ecosystem fuels, such as cheatgrass [149] or horsebrush. Our results are essential for achieving a better understanding of the sagebrush ecosystem and its relation to wildfires, as well as preventing and mitigating disasters such as flooding and soil erosion through remote sensing of chemical and physical soil properties in the sagebrush landscape.
Supplementary Materials
The following supporting information can be downloaded at: https://www.mdpi.com/article/10.3390/soilsystems9040111/s1, Figure S1: FTIR spectra for the samples from b: sagebrush and c: bitterbrush; Figure S2: FTIR spectra for methanol extracted burned, 2 cm deep burned soil, and background soil samples for a: SB and b: BB; Table S1: Details of the WDPT and ACA for the samples. (The limit for WDPT was 0.5 s, while for the ACA it is 10 degrees).
Author Contributions
Conceptualization, Y.R., V.S., and H.M.; methodology, Y.R., V.S., H.M., and M.B.; software, Y.R., V.S., H.M., M.B., B.S.; validation, Y.R., V.S., M.B., B.S., and H.M.; formal analysis, Y.R., V.S., and H.M.; investigation, Y.R., V.S., M.B., B.S., and H.M.; resources, Y.R., V.S., and H.M.; data curation, Y.R., V.S., H.M., M.B., B.S., E.F.-C., S.H., K.L., W.C., A.J.A., B.M., and A.Y.K.; writing—original draft preparation, Y.R., and V.S.; writing—review and editing, Y.R., V.S., M.B., B.S., and H.M.; visualization, Y.R., V.S., and H.M.; supervision, V.S., and H.M.; project administration, V.S., H.M., M.B., B.S., E.F.-C., and A.Y.K.; funding acquisition, V.S., H.M., M.B., B.S., E.F.-C., and A.Y.K. All authors have read and agreed to the published version of the manuscript.
Funding
This research was funded in part through 20–24 Nevada NASA Space Grant Fellowship under Grant No. 80NSSC20M0043, NSF EPSCoR RII Track1: Harnessing the Data Revolution for Fire Science (HDRFS) under Grant No. OIA-2148788 and National Science Foundation under Grant No. EAR2154013, 2024–2025 Whittell Forest Graduate Research Grant, and NSF EPSCoR RII: Focused EPSCoR Collaborations: FEC: Optical Properties of Mineral Dust Aerosols: Building Capacity for Use-Inspired Applications Through Experimental and Theoretical Investigations under Grant NSF-OIA 2521432.
Institutional Review Board Statement
Not applicable.
Informed Consent Statement
Not applicable.
Data Availability Statement
The authors declare that the data supporting the findings of this study are available within the paper and its Supplementary Information Files. Should any raw data files be needed in another format they are available from the corresponding author upon reasonable request.
Acknowledgments
The authors thank Analytical Spectral Devices, Inc., for their assistance and support; Don Sabol for providing the FieldSpec 3 instrument and supporting its use; Stephen M. Spain and Palina Bahdanovich for their help with the FTIR measurements; John (Jay) Arnone for providing permits at the research site; and Nic Beres for his help with the management of the sampling site.
Conflicts of Interest
The authors declare no conflicts of interest.
Abbreviations
The following abbreviations are used in this manuscript:
| WUI | Wildland Urban Interface |
| SWR | Soil Water Repellency |
| SOM | Soil Organic Matter |
| WDPT | Water Drop Penetration Time |
| ACA | Apparent Contact Angle |
| FTIR | Fourier-Transform Infrared |
| ASD | Analytical Spectral Devices |
| FOV | Field of View |
| RH | Relative Humidity |
| MSL | Mean Sea Level |
| SB | Sagebrush |
| RB | Rabbitbrush |
| BB | Bitterbrush |
| FT-ICR MS | Fourier-Transform Ion Cyclotron Resonance Mass Spectrometry |
| PAH | Polycyclic Aromatic Hydrocarbon |
| NMR | Nuclear Magnetic Resonance |
References
- Westerling, A.L. Increasing western US forest wildfire activity: Sensitivity to changes in the timing of spring. Philos. Trans. R. Soc. B-Biol. Sci. 2016, 371, 20150178. [Google Scholar] [CrossRef]
- Mueller, S.E.; Thode, A.E.; Margolis, E.Q.; Yocom, L.L.; Young, J.D.; Iniguez, J.M. Climate relationships with increasing wildfire in the southwestern US from 1984 to 2015. For. Ecol. Manag. 2020, 460, 117861. [Google Scholar] [CrossRef]
- Samburova, V.; Schneider, E.; Rüger, C.; Inouye, S.; Sion, B.; Axelrod, K.; Bahdanovich, P.; Friederici, L.; Raeofy, Y.; Berli, M.; et al. Modification of soil hydroscopic and chemical properties caused by four recent California, USA megafires. Fire 2023, 6, 186. [Google Scholar] [CrossRef]
- Raeofy, Y.; Samburova, V.; Berli, M.; Sion, B.; Moosmüller, H. Hyperspectral reflectance and chemical composition of pre- and post-fire soils from three 2021 western USA megafires. Fire 2023, 6, 471. [Google Scholar] [CrossRef]
- Dennison, P.E.; Brewer, S.C.; Arnold, J.D.; Moritz, M.A. Large wildfire trends in the western united states, 1984-2011. Geophys. Res. Lett. 2014, 41, 2928–2933. [Google Scholar] [CrossRef]
- Song, F.H.; Li, T.T.; Hur, J.; Chow, A.T.S.; Leung, K.M.Y.; Wu, F.C. Wildfire-derived pyrogenic organic matter posing overlooked emerging risks to aquatic ecosystems. Environ. Sci. Technol. 2024, 58, 11209–11212. [Google Scholar] [CrossRef] [PubMed]
- History of California Wildfires; Western Fire Chiefs Association (WFCA): Wilsonville, OR, USA, 2022; Available online: https://wfca.com/wildfire-articles/history-of-california-wildfires/ (accessed on 18 September 2025).
- Cova, G.; Kane, V.; Prichard, S.; North, M.; Cansler, A. The outsized role of California’s largest wildfires in changing forest burn patterns and coarsening ecosystem scale. For. Ecol. Manag. 2023, 528, 120620. [Google Scholar] [CrossRef]
- D’Evelyn, S.M.; Jung, J.; Alvarado, E.; Baumgartner, J.; Caligiuri, P.; Hagmann, R.K.; Henderson, S.B.; Hessburg, P.F.; Hopkins, S.; Kasner, E.J.; et al. Wildfire, smoke exposure, human health, and environmental justice need to be integrated into forest restoration and management. Curr. Environ. Health Rep. 2022, 9, 366–385. [Google Scholar] [CrossRef]
- Maya, S.; Thakur, N.; Benmarhnia, T.; Weiser, S.D.; Kahn, J.G. The impact of wildfire smoke on asthma control in California: A microsimulation approach. Geohealth 2024, 8, e2024GH001037. [Google Scholar] [CrossRef] [PubMed]
- Reid, C.E.; Brauer, M.; Johnston, F.H.; Jerrett, M.; Balmes, J.R.; Elliott, C.T. Critical review of health impacts of wildfire smoke exposure. Environ. Health Perspect. 2016, 124, 1334–1343. [Google Scholar] [CrossRef]
- Black, C.; Tesfaigzi, Y.; Bassein, J.A.; Miller, L.A. Wildfire smoke exposure and human health: Significant gaps in research for a growing public health issue. Environ. Toxicol. Pharmacol. 2017, 55, 186–195. [Google Scholar] [CrossRef]
- Radeloff, V.C.; Helmers, D.P.; Kramer, H.A.; Mockrin, M.H.; Alexandre, P.M.; Bar-Massada, A.; Butsic, V.; Hawbaker, T.J.; Martinuzzi, S.; Syphard, A.D.; et al. Rapid growth of the US wildland-urban interface raises wildfire risk. Proc. Natl. Acad. Sci. USA 2018, 115, 3314–3319. [Google Scholar] [CrossRef]
- Innes, R.J. Artemisia tridentata subsp. Vaseyana, Mountain Big Sagebrush. In Fire Effects Information System; U.S. Department of Agriculture, Forest Service, Rocky Mountain Research Station, Fire Sciences Laboratory: Washington, DC, USA, 2017. Available online: https://www.fs.usda.gov/database/feis/plants/shrub/arttriv/all.html (accessed on 18 September 2025).
- Managing Big Sagebrush in Changing Climate. Academic Technology and Outreach|Montana State University MSU. Available online: https://ato.montana.edu/sagebrush/publication.html (accessed on 18 September 2025).
- Sage Steppe Wild. 2025. Available online: https://www.wild-sage.org/projects/sagebrush-steppe (accessed on 18 September 2025).
- Solis, J. Half of Sagebrush Rangelands Are on the Brink of Collapse—Scientists Have a Plan to Revive Them; Nevada Current: Carson, NV, USA, 2024. [Google Scholar]
- Gauna, J. Plant of the Week Sagebrush (Artemisia tridentata nutt.). 2024. Available online: https://www.fs.usda.gov/wildflowers/plant-of-the-week/artemisia_tridentata.shtml (accessed on 18 September 2025).
- Radeloff, V.C.; Mockrin, M.H.; Helmers, D.; Carlson, A.; Hawbaker, T.J.; Martinuzzi, S.; Schug, F.; Alexandre, P.M.; Kramer, H.A.; Pidgeon, A.M. Rising wildfire risk to houses in the united states, especially in grasslands and shrublands. Science 2023, 382, 702–707. [Google Scholar] [CrossRef]
- Bowlin, N. The West’s Worst Fires Aren’t Burning in Forests. 2019. Available online: https://www.hcn.org/issues/51-11/wildfire-the-wests-worst-fires-arent-burning-in-forests/ (accessed on 18 September 2025).
- Clements, C.D.; Freese, M.; McAdoo, C.; Harmon, D. The Martin Fire: Then and Now. 2023. Available online: https://progressiverancher.com/the-martin-fire-then-and-now/ (accessed on 18 September 2025).
- Letey, J. Causes and consequences of fire-induced soil water repellency. Hydrol. Process. 2001, 15, 2867–2875. [Google Scholar] [CrossRef]
- Doerr, S.H.; Woods, S.W.; Martin, D.A.; Casimiro, M. ‘Natural background’ soil water repellency in conifer forests of the north-western USA: Its prediction and relationship to wildfire occurrence. J. Hydrol. 2009, 371, 12–21. [Google Scholar] [CrossRef]
- DeBano, L.F. Water Repellent Soils: A State-of-the-Art; U.S. Department of Agriculture, Forest Service, Pacific Southwest Forest and Range Experiment Station: Washington, DC, USA, 1981. [Google Scholar]
- Debano, L.F.; Krammes, J. Water repellent soils and their relation to wildfire temperatures. Hydrol. Sci. J. 1966, 11, 14–19. [Google Scholar] [CrossRef]
- Atanassova, I.; Doerr, S.H. Changes in soil organic compound composition associated with heat-induced increases in soil water repellency. Eur. J. Soil Sci. 2011, 62, 516–532. [Google Scholar] [CrossRef]
- Doerr, S.H.; Shakesby, R.A.; Walsh, R.P.D. Soil water repellency: Its causes, characteristics and hydro-geomorphological significance. Earth-Sci. Rev. 2000, 51, 33–65. [Google Scholar] [CrossRef]
- Chen, H.; Liu, F.L. Soil depth and recovery interval mediate soil water repellency under different forest types and fire intensity levels in china: Evidence for ecosystem resiliency. Soil Tillage Res. 2024, 237, 105982. [Google Scholar] [CrossRef]
- Cawson, J.G.; Nyman, P.; Smith, H.G.; Lane, P.N.J.; Sheridan, G.J. How soil temperatures during prescribed burning affect soil water repellency, infiltration and erosion. Geoderma 2016, 278, 12–22. [Google Scholar] [CrossRef]
- Samburova, V.; Shillito, R.M.; Berli, M.; Khlystov, A.Y.; Moosmüller, H. Effect of biomass-burning emissions on soil water repellency: A pilot laboratory study. Fire 2021, 4, 24. [Google Scholar] [CrossRef]
- Jordán, A.; González, F.; Zavala, L. Re-establishment of soil water repellency after destruction by intense burning in a Mediterranean heathland (SW Spain). Hydrol. Process. 2010, 24, 736–748. [Google Scholar] [CrossRef]
- DeBano, L. The role of fire and soil heating on water repellency in wildland environments: A review. J. Hydrol. 2000, 231, 195–206. [Google Scholar] [CrossRef]
- Larsen, I.J.; MacDonald, L.H.; Brown, E.; Rough, D.; Welsh, M.J.; Pietraszek, J.H.; Libohova, Z.; de Dios Benavides-Solorio, J.; Schaffrath, K. Causes of post-fire runoff and erosion: Water repellency, cover, or soil sealing? Soil Sci. Soc. Am. J. 2009, 73, 1393–1407. [Google Scholar] [CrossRef]
- Negri, S.; Arcenegui, V.; Mataix-Solera, J.; Bonifacio, E. Extreme water repellency and loss of aggregate stability in heat-affected soils around the globe: Driving factors and their relationships. Catena 2024, 244, 108257. [Google Scholar] [CrossRef]
- DeBano, L.F. Observation on water-reppellent soils in westerns United States. In Proceedings of the Symposium on Water Repellent Soils; DeBano, L.F., Letey, J., Eds.; University of California: Riverside, CA, USA, 1969; pp. 17–29. [Google Scholar]
- DeBano, L.; Savage, S.; Hamilton, D. The transfer of heat and hydrophobic substances during burning. Soil Sci. Soc. Am. J. 1976, 40, 779–782. [Google Scholar] [CrossRef]
- Savage, S.M.; Heaton, C.; Osborn, J.; Letey, J. Substances contributing to fire-induced water repellency in soils. Soil Sci. Soc. Am. Proc. 1972, 36, 674–678. [Google Scholar] [CrossRef]
- Doerr, S.H. On standardizing the ‘water drop penetration time’ and the ‘molarity of an ethanol droplet’ techniques to classify soil hydrophobicity: A case study using medium textured soils. Earth Surf. Process. Landf. 1998, 23, 663–668. [Google Scholar] [CrossRef]
- Letey, J.; Carrillo, M.L.K.; Pang, X.P. Approaches to characterize the degree of water repellency. J. Hydrol. 2000, 231, 61–65. [Google Scholar] [CrossRef]
- Bachmann, J.; Ellies, A.; Hartge, K.H. Development and application of a new sessile drop contact angle method to assess soil water repellency. J. Hydrol. 2000, 231, 66–75. [Google Scholar] [CrossRef]
- Erbil, H.Y. The debate on the dependence of apparent contact angles on drop contact area or three-phase contact line: A review. Surf. Sci. Rep. 2014, 69, 325–365. [Google Scholar] [CrossRef]
- Rosado, B.H.P.; Holder, C.D. The significance of leaf water repellency in ecohydrological research: A review. Ecohydrology 2013, 6, 150–161. [Google Scholar] [CrossRef]
- Morley, C.; Mainwaring, K.; Doerr, S.; Douglas, P.; Llewellyn, C.; Dekker, L. Organic compounds at different depths in a sandy soil and their role in water repellency. Aust. J. Soil Res. 2005, 43, 239–249. [Google Scholar] [CrossRef]
- Dekker, L.W.; Ritsema, C.J. How water moves in a water repellent sandy soil. 1. Potential and actual water repellency. Water Resour. Res. 1994, 30, 2507–2517. [Google Scholar] [CrossRef]
- Scott, D.F. Soil wettability in forested catchments in South Africa; as measured by different methods and as affected by vegetation cover and soil characteristics. J. Hydrol. 2000, 231, 87–104. [Google Scholar] [CrossRef]
- Leelamanie, D.; Karube, J.; Yoshida, A. Characterizing water repellency indices: Contact angle and water drop penetration time of hydrohobized sand. Soil Sci. Plant Nutr. 2008, 54, 179–187. [Google Scholar] [CrossRef]
- de Blas, E.; Rodríguez-Alleres, M.; Almendros, G. Speciation of lipid and humic fractions in soils under pine and eucalyptus forest in northwest Spain and its effect on water repellency. Geoderma 2010, 155, 242–248. [Google Scholar] [CrossRef]
- Williams, C.J.; Pierson, F.B.; Kormos, P.R.; Al-Hamdan, O.Z.; Hardegree, S.P.; Clark, P.E. Ecohydrologic response and recovery of a semi-arid shrubland over a five year period following burning. Catena 2016, 144, 163–176. [Google Scholar] [CrossRef]
- Pierson, F.; Robichaud, P.; Moffet, C.; Spaeth, K.; Williams, C.; Hardegree, S.; Clark, P. Soil water repellency and infiltration in coarse-textured soils of burned and unburned sagebrush ecosystems. Catena 2008, 74, 98–108. [Google Scholar] [CrossRef]
- Glenn, N.F.; Finley, C.D. Fire and vegetation type effects on soil hydrophobicity and infiltration in the sagebrush-steppe: I. Field analysis. J. Arid Environ. 2010, 74, 653–659. [Google Scholar] [CrossRef]
- Dee, S. Preliminary Geologic Map of the Granite Peak Quadrangle; Nevada Bureau of Mines and Geology Open-File Report: Washoe County, NV, USA, 2019; pp. 12–19. [Google Scholar]
- Official Soil Series Descriptions (OSDS); USDA, Natural Resources Conservation Service: Washington, DC, USA, 2025. Available online: https://www.nrcs.usda.gov/resources/data-and-reports/official-soil-series-descriptions-osds (accessed on 18 September 2025).
- McElderry, K. Species Biology of Sagebrush Steppe. 2025. Available online: https://blogs.oregonstate.edu/ (accessed on 18 September 2025).
- Tian, J.; Chow, J.C.; Cao, J.J.; Han, Y.; Ni, H.Y.; Chen, L.W.A.; Wang, X.L.; Huang, R.J.; Moosmüller, H.; Watson, J.G. A biomass combustion chamber: Design, evaluation, and a case study of wheat straw combustion emission tests. Aerosol Air Qual. Res. 2015, 15, 2104–2114. [Google Scholar] [CrossRef]
- Letey, J. Measurement of contact angle, water drop penetration time and critical surface tension. In Proceedings of the Symposium on Water Repellant Soils, Riverside, CA, USA, 6–10 May 1968. [Google Scholar]
- King, P.M. Comparison of methods for measuring severity of water repellence of sandy soils and assessment of some factors that affect its measurement. Aust. J. Soil Res. 1981, 19, 275–285. [Google Scholar] [CrossRef]
- Shillito, R.M.; Berli, M.; Ghezzehei, T.A. Quantifying the effect of subcritical water repellency on sorptivity: A physically based model. Water Resour. Res. 2020, 56, e2020WR027942. [Google Scholar] [CrossRef]
- Enev, V.; Sedlácek, P.; Kubíková, L.; Sovová, S.; Doskocil, L.; Klucáková, M.; Pekar, M. Polarity-based sequential extraction as a simple tool to reveal the structural complexity of humic acids. Agronomy 2021, 11, 587. [Google Scholar] [CrossRef]
- Guillen, M.D.; Iglesias, M.J.; Dominguez, A.; Blanco, C.G. Semiquantitative ftir analysis of a coal-tar pitch and tts extracts and residues in several organic-solvents. Energy Fuels 1992, 6, 518–525. [Google Scholar] [CrossRef]
- Odo, I.; Ezeanyika, L.; Ogugua, V.; Joshua, P.; Okagu, I. FTIR and GC-MS spectroscopic analysis of methanol and chloroform extracts of Brenania brieyi root bark. Am. J. Res. Commun. 2017, 5, 44–54. [Google Scholar]
- Son, Y.; Giovenco, D.P.; Delnevo, C.; Khlystov, A.; Samburova, V.; Meng, Q.Y. Indoor air quality and passive e-cigarette aerosol exposures in vape-shops. Nicotine Tob. Res. 2020, 22, 1772–1779. [Google Scholar] [CrossRef]
- Samburova, V.; Lemos, M.S.; Hiibel, S.; Hoekman, S.K.; Cushman, J.C.; Zielinska, B. Analysis of triacylglycerols and free fatty acids in algae using ultra-performance liquid chromatography mass spectrometry. J. Am. Oil Chem. Soc. 2013, 90, 53–64. [Google Scholar] [CrossRef]
- Liu, J.; Bergin, M.; Guo, H.; King, L.; Kotra, N.; Edgerton, E.; Weber, R.J. Size-resolved measurements of brown carbon in water and methanol extracts and estimates of their contribution to ambient fine-particle light absorption. Atmos. Chem. Phys. 2013, 13, 12389–12404. [Google Scholar] [CrossRef]
- Sengupta, D.; Samburova, V.; Bhattarai, C.; Kirillova, E.; Mazzoleni, L.; Iaukea-Lum, M.; Watts, A.; Moosmüller, H.; Khlystov, A. Light absorption by polar and non-polar aerosol compounds from laboratory biomass combustion. Atmos. Chem. Phys. 2018, 18, 10849–10867. [Google Scholar] [CrossRef]
- Akomeng, N.; Adusei, S. Organic solvent extraction and spectrophotometric quantification of total phenolic content of soil. Heliyon 2021, 7, e08388. [Google Scholar] [CrossRef] [PubMed]
- Cao, T.; Li, M.J.; Zou, C.L.; Fan, X.J.; Song, J.Z.; Jia, W.L.; Yu, C.L.; Yu, Z.Q.; Ping, P.A. Chemical composition, optical properties, and oxidative potential of water- and methanol-soluble organic compounds emitted from the combustion of biomass materials and coal. Atmos. Chem. Phys. 2021, 21, 13187–13205. [Google Scholar] [CrossRef]
- Song, J.; Li, M.; Fan, X.; Zou, C.; Zhu, M.; Jiang, B.; Yu, Z.; Jia, W.; Liao, Y.; Peng, P. Molecular characterization of water- and methanol-soluble organic compounds emitted from residential coal combustion using ultrahigh-resolution electrospray ionization fourier transform ion cyclotron resonance mass spectrometry. Environ. Sci. Technol. 2019, 53, 13607–13617. [Google Scholar] [CrossRef] [PubMed]
- Tfaily, M.M.; Chu, R.K.; Tolic, N.; Roscioli, K.M.; Anderton, C.R.; Pasa-Tolic, L.; Robinson, E.W.; Hess, N.J. Advanced solvent based methods for molecular characterization of soil organic matter by high-resolution mass spectrometry. Anal. Chem. 2015, 87, 5206–5215. [Google Scholar] [CrossRef]
- Pärnpuu, S.; Astover, A.; Tonutare, T.; Penu, P.; Kauer, K. Soil organic matter qualification with FTIR spectroscopy under different soil types in estonia. Geoderma Reg. 2022, 28, e00483. [Google Scholar] [CrossRef]
- Provenzano, M.; Cilenti, A.; Gigliotti, G.; Senesi, N. Spectroscopic investigation on hydrophobic and hydrophilic fractions of dissolved organic matter extracted from soils at different salinities. Clean-Soil Air Water 2008, 36, 748–753. [Google Scholar] [CrossRef]
- Samburova, V.; Szidat, S.; Hueglin, C.; Fisseha, R.; Baltensperger, U.; Zenobi, R.; Kalberer, M. Seasonal variation of high-molecular-weight compounds in the water-soluble fraction of organic urban aerosols. J. Geophys. Res. Atmos. 2005, 110, D23210. [Google Scholar] [CrossRef]
- Chow, A.T.S.; Ulus, Y.; Huang, G.C.; Kline, M.A.; Cheah, W.Y. Challenges in quantifying and characterizing dissolved organic carbon: Sampling, isolation, storage, and analysis. J. Environ. Qual. 2022, 51, 837–871. [Google Scholar] [CrossRef]
- Bahdanovich, P.; Axelrod, K.; Khlystov, A.Y.; Samburova, V. Characterization of organic species and functional groups in pollen, fungi, algae, and bacteria bioaerosols. Environ. Sci. Atmos. 2024, 4, 1091–1104. [Google Scholar] [CrossRef]
- Sullivan, A.L. Inside the inferno: Fundamental processes of wildland fire behaviour: Part 2: Heat transfer and interactions. Curr. For. Rep. 2017, 3, 150–171. [Google Scholar] [CrossRef]
- Fiorini, C.; Craveiro, H.D.; Santiago, A.; Laim, L.; da Silva, L.S. Parametric evaluation of heat transfer mechanisms in a WUI fire scenario. Int. J. Wildland Fire 2023, 32, 1600–1618. [Google Scholar] [CrossRef]
- Oliveira, L.A.; Viegas, D.X.; Raimundo, A.M. Numerical predictions on the soil thermal effect under surface fire conditions. Int. J. Wildland Fire 1997, 7, 51–63. [Google Scholar] [CrossRef]
- DeBano, L.F. Formation of Non-Wettable Soils: Involves Heat Transfer Mechanism; Pacific Southwest Forest & Range Experiment Station: Berkeley, CA, USA, 1966. [Google Scholar]
- Badía, D.; López-García, S.; Martí, C.; Ortíz-Perpiñá, O.; Girona-García, A.; Casanova-Gascón, J. Burn effects on soil properties associated to heat transfer under contrasting moisture content. Sci. Total Environ. 2017, 601, 1119–1128. [Google Scholar] [CrossRef] [PubMed]
- Sirotiak, M.; Bartošová, A. Changes in structure and content humic substances in soil during the laboratory simulated fires. Trans. VSB 2016, 11, 42–48. [Google Scholar] [CrossRef][Green Version]
- Gimeno-García, E.; Andreu, V.; Rubio, J.L. Spatial patterns of soil temperatures during experimental fires. Geoderma 2004, 118, 17–38. [Google Scholar] [CrossRef]
- Negri, S.; Stanchi, S.; Celi, L.; Bonifacio, E. Simulating wildfires with lab-heating experiments: Drivers and mechanisms of water repellency in alpine soils. Geoderma 2021, 402, 115357. [Google Scholar] [CrossRef]
- Zavala, L.M.; Granged, A.J.P.; Jordán, A.; Bárcenas-Moreno, G. Effect of burning temperature on water repellency and aggregate stability in forest soils under laboratory conditions. Geoderma 2010, 158, 366–374. [Google Scholar] [CrossRef]
- Rundel, P.W. Impact of fire on nutrient cycles in mediterranean-type ecosystems with reference to chaparral. Ecol. Stud. 1983, 43, 192–207. [Google Scholar]
- McGhie, D.; Posner, A. The effect of plant top material on the water repellence of fired sands and water repellent soils. Aust. J. Agric. Res. 1981, 32, 609–620. [Google Scholar] [CrossRef]
- Kainulainen, P.; Holopainen, J.K. Concentrations of secondary compounds in Scots pine needles at different stages of decomposition. Soil Biol. Biochem. 2002, 34, 37–42. [Google Scholar] [CrossRef]
- Kelleher, B.P.; Simpson, M.J.; Simpson, A.J. Assessing the fate and transformation of plant residues in the terrestrial environment using HR-MAS NMR spectroscopy. Geochim. Cosmochim. Acta 2006, 70, 4080–4094. [Google Scholar] [CrossRef]
- Asuero, A.; Sayago, A.; González, A. The correlation coefficient: An overview. Crit. Rev. Anal. Chem. 2006, 36, 41–59. [Google Scholar] [CrossRef]
- Wang, Z.F.; Wallach, R. Effects of time-dependent contact angle on wettability of subcritically water-repellent soils. Water Resour. Res. 2020, 56, e2020WR027314. [Google Scholar] [CrossRef]
- Simkovic, I.; Dlapa, P.; Doerr, S.H.; Mataix-Solera, J.; Sasinkova, V. Thermal destruction of soil water repellency and associated changes to soil organic matter as observed by FTIR spectroscopy. Catena 2008, 74, 205–211. [Google Scholar] [CrossRef]
- Badía-Villas, D.; González-Pérez, J.; Aznar, J.; Arjona-Gracia, B.; Marti-Dalmau, C. Changes in water repellency, aggregation and organic matter of a mollic horizon burned in laboratory: Soil depth affected by fire. Geoderma 2014, 213, 400–407. [Google Scholar] [CrossRef]
- Brook, A.; Wittenberg, L. Ash-soil interface: Mineralogical composition and physical structure. Sci. Total Environ. 2016, 572, 1403–1413. [Google Scholar] [CrossRef]
- Dlapa, P.; Bodí, M.B.; Mataix-Solera, J.; Cerdà, A.; Doerr, S.H. FT-IR spectroscopy reveals that ash water repellency is highly dependent on ash chemical composition. Catena 2013, 108, 35–43. [Google Scholar] [CrossRef]
- Bodí, M.B.; Martin, D.A.; Balfour, V.N.; Santín, C.; Doerr, S.H.; Pereira, P.; Cerdà, A.; Mataix-Solera, J. Wild land fire ash: Production, composition and eco-hydro-geomorphic effects. Earth-Sci. Rev. 2014, 130, 103–127. [Google Scholar] [CrossRef]
- Roy, D.P.; Boschetti, L.; Maier, S.W.; Smith, A.M.S. Field estimation of ash and char colour-lightness using a standard grey scale. Int. J. Wildland Fire 2010, 19, 698–704. [Google Scholar] [CrossRef]
- Mataix-Solera, J.; Doerr, S.H. Hydrophobicity and aggregate stability in calcareous topsoils from fire-affected pine forests in southeastern Spain. Geoderma 2004, 118, 77–88. [Google Scholar] [CrossRef]
- Pereira, P.; Ubeda, X.; Martin, D.A. Fire severity effects on ash chemical composition and water-extractable elements. Geoderma 2012, 191, 105–114. [Google Scholar] [CrossRef]
- Yin, C.M.; He, B.B.; Quan, X.W.; Yebra, M.; Lai, G.K. Remote sensing of burn severity using coupled radiative transfer model: A case study on Chinese Qinyuan Pine fires. Remote Sens. 2020, 12, 3590. [Google Scholar] [CrossRef]
- Pleniou, M.; Koutsias, N. Sensitivity of spectral reflectance values to different burn and vegetation ratios: A multi-scale approach applied in a fire affected area. ISPRS J. Photogramm. Remote Sens. 2013, 79, 199–210. [Google Scholar] [CrossRef]
- Beltrán-Marcos, D.; Suárez-Seoane, S.; Fernández-Guisuraga, J.M.; Fernández-García, V.; Pinto, R.; García-Llamas, P.; Calvo, L. Mapping soil burn severity at very high spatial resolution from unmanned aerial vehicles. Forests 2021, 12, 179. [Google Scholar] [CrossRef]
- Lugassi, R.; Ben-Dor, E.; Eshel, G. A spectral-based method for reconstructing spatial distributions of soil surface temperature during simulated fire events. Remote Sens. Environ. 2010, 114, 322–331. [Google Scholar] [CrossRef]
- Mastrolonardo, G.; Francioso, O.; Di Foggia, M.; Bonora, S.; Rumpel, C.; Certini, G. Application of thermal and spectroscopic techniques to assess fire-induced changes to soil organic matter in a Mediterranean forest. J. Geochem. Explor. 2014, 143, 174–182. [Google Scholar] [CrossRef]
- Jiménez-Morillo, N.T.; Almendros, G.; De la Rosa, J.M.; Jordán, A.; Zavala, L.M.; Granged, A.J.P.; González-Pérez, J.A. Effect of a wildfire and of post-fire restoration actions in the organic matter structure in soil fractions. Sci. Total Environ. 2020, 728, 138715. [Google Scholar] [CrossRef]
- Badertscher, M.; Bühlmann, P.; Pretsch, E. Structure Determination of Organic Compounds: Tables of Spectral Data; Springer: Berlin/Heidelberg, Germany, 2009. [Google Scholar]
- Devangsari, I.; Nurudin, M.; Sartohadi, J.; Karmila, Y. Characteristics of peat functional group in Padang Island, Indonesia. IOP Conf. Ser. Earth Environ. Sci. 2022, 1005, 012022. [Google Scholar] [CrossRef]
- Parolo, M.E.; Savini, M.C.; Loewy, R.M. Characterization of soil organic matter by FT-IR spectroscopy and its relationship with chlorpyrifos sorption. J. Environ. Manag. 2017, 196, 316–322. [Google Scholar] [CrossRef]
- Heller, C.; Ellerbrock, R.H.; Rosskopf, N.; Klingenfuss, C.; Zeitz, J. Soil organic matter characterization of temperate peatland soil with FTIR-spectroscopy: Effects of mire type and drainage intensity. Eur. J. Soil Sci. 2015, 66, 847–858. [Google Scholar] [CrossRef]
- Araya, S.N.; Fogel, M.L.; Berhe, A.A. Thermal alteration of soil organic matter properties: A systematic study to infer response of Sierra Nevada climosequence soils to forest fires. Soil 2017, 3, 31–44. [Google Scholar] [CrossRef]
- Capriel, P.; Beck, T.; Borchert, H.; Gronholz, J.; Zachmann, G. Hydrophobicity of the organic-matter in arable soils. Soil Biol. Biochem. 1995, 27, 1453–1458. [Google Scholar] [CrossRef]
- Supic, S.; Malesev, M.; Radonjanin, V.; Bulatovic, V.; Milovic, T. Reactivity and pozzolanic properties of biomass ashes generated by wheat and soybean straw combustion. Materials 2021, 14, 1004. [Google Scholar] [CrossRef]
- Azkorra, Z.; Aizpurua, A.; Riga, P.; Heras, P.; Ibargoitia, M.; Gallejones, P.; Gartzia, N.; González, A.; Arbestain, M.C. Characterisation of organic carbon in mire and heath soils at the Elgea-Urkilla Wind Farm, northern Spain. Mires Peat 2008, 4, 5–11. [Google Scholar]
- Hong, H.L.; Chen, S.L.; Fang, Q.; Algeo, T.J.; Zhao, L.L. Adsorption of organic matter on clay minerals in the Dajiuhu peat soil chronosequence, South China. Appl. Clay Sci. 2019, 178, 105125. [Google Scholar] [CrossRef]
- Provenzano, M.R.; Gigliotti, G.; Cilenti, A.; Erriquens, F.; Senesi, N. Spectroscopic and thermal investigation of hydrophobic and hydrophilic fractions of dissolved organic matter. Compos. Sci. Util. 2006, 14, 191–200. [Google Scholar] [CrossRef]
- Kalembkiewicz, J.; Galas, D.; Sitarz-Palczak, E. The physicochemical properties and composition of biomass ash and evaluating directions of its applications. Pol. J. Environ. Stud. 2018, 27, 2593–2603. [Google Scholar] [CrossRef]
- Celi, L.; Schnitzer, M.; Negre, M. Analysis of carboxyl groups in soil humic acids by a wet chemical method, fourier-transform infrared spectrophotometry, and solution-state carbon-13 nuclear magnetic resonance. A comparative study. Soil Sci. 1997, 162, 189–197. [Google Scholar] [CrossRef]
- Kaiser, M.; Ellerbrock, R.H.; Gerke, H.H. Long-term effects of crop rotation and fertilization on soil organic matter composition. Eur. J. Soil Sci. 2007, 58, 1460–1470. [Google Scholar] [CrossRef]
- Benitesa, V.D.; Mendonça, E.D.; Schaefer, C.E.G.R.; Novotny, E.H.; Reis, E.L.; Ker, J.C. Properties of black soil humic acids from high altitude rocky complexes in Brazil. Geoderma 2005, 127, 104–113. [Google Scholar] [CrossRef]
- Tkachenko, Y.; Niedzielski, P. FTIR as a method for qualitative assessment of solid samples in geochemical research: A review. Molecules 2022, 27, 8846. [Google Scholar] [CrossRef] [PubMed]
- Lu, S.; Dosseto, A.; Lemarchand, D.; Dlapa, P.; Simkovic, I.; Bradstock, R. Investigating boron isotopes and FTIR as proxies for bushfire severity. Catena 2022, 219, 106621. [Google Scholar] [CrossRef]
- Ryan, R.; Dosseto, A.; Lemarchand, D.; Dlapa, P.; Thomas, Z.; Simkovic, I.; Bradstock, R. Boron isotopes and FTIR spectroscopy to identify past high severity fires. Catena 2023, 222, 106887. [Google Scholar] [CrossRef]
- Bárcenas-Moreno, G.; Jiménez-Compán, E.; Emeterio, L.M.S.; Jiménez-Morillo, N.T.; González-Pérez, J.A. Soil pH and soluble organic matter shifts exerted by heating affect microbial response. Int. J. Environ. Res. Public Health 2022, 19, 15751. [Google Scholar] [CrossRef]
- Margenot, A.J.; Calderón, F.J.; Goyne, K.W.; Dmukome, F.N.; Parikh, S. IR Spectroscopy, Soil Analysis Applications; Elsevier: Amsterdam, The Netherlands, 2016; pp. 448–454. [Google Scholar]
- Tinoco, P.; Almendros, G.; Sanz, J.; González-Vázquez, R.; González-Vila, F.J. Molecular descriptors of the effect of fire on soils under pine forest in two continental Mediterranean soils. Org. Geochem. 2006, 37, 1995–2018. [Google Scholar] [CrossRef]
- Vergnoux, A.; Guiliano, M.; Di Rocco, R.; Domeizel, M.; Théraulaz, F.; Doumenq, P. Quantitative and mid-infrared changes of humic substances from burned soils. Environ. Res. 2011, 111, 205–214. [Google Scholar] [CrossRef]
- Diniz, Y.V.D.G.; de Oliveira, A.P.P.; da Silva, T.P.; Neto, E.C.D.; Garcia, A.C.; Pereira, M.G.; Motta, M.S.; Fagundes, H.D.; dos Santos, O.A.Q.; dos Anjos, L.H.C. Prescribed fire application in a Brazilian mountain environment: Changes in soil organic matter quality in the short and medium term. Catena 2023, 232, 107418. [Google Scholar] [CrossRef]
- Rossi, C.Q.; Pereira, M.G.; García, A.C.; Berbara, R.L.L.; Gazolla, P.R.; Perin, A.; González, A.P. Effects on the composition and structural properties of the humified organic matter of soil in sugarcane strawburning: A chronosequence study in the Brazilian Cerrado of Goias State. Agric. Ecosyst. Environ. 2016, 216, 34–43. [Google Scholar] [CrossRef]
- Matejková, S.; Simon, T. Application of FTIR spectroscopy for evaluation of hydrophobic/hydrophilic organic components in arable soil. Plant Soil Environ. 2012, 58, 192–195. [Google Scholar] [CrossRef]
- Atanassova, I.; Doerr, S.H. Organic compounds of different extractability in total solvent extracts from soils of contrasting water repellency. Eur. J. Soil Sci. 2010, 61, 298–313. [Google Scholar] [CrossRef]
- Wu, Y.C.; Zhang, N.; Slater, G.; Waddington, J.M.; de Lannoy, C.F. Hydrophobicity of peat soils: Characterization of organic compound changes associated with heat-induced water repellency. Sci. Total Environ. 2020, 714, 136444. [Google Scholar] [CrossRef]
- González-Pérez, J.A.; González-Vila, F.J.; Almendros, G.; Knicker, H. The effect of fire on soil organic matter—A review. Environ. Int. 2004, 30, 855–870. [Google Scholar] [CrossRef]
- Dymov, A.A.; Startsev, V.V.; Milanovsky, E.Y.; Valdes-Korovkin, I.A.; Farkhodov, Y.R.; Yudina, A.V.; Donnerhack, O.; Guggenberger, G. Soils and soil organic matter transformations during the two years after a low-intensity surface fire (Subpolar Ural, Russia). Geoderma 2021, 404, 115278. [Google Scholar] [CrossRef]
- Chen, H.; Chow, A.T.; Li, X.W.; Ni, H.G.; Dahlgren, R.A.; Zeng, H.; Wang, J.J. Wildfire burn intensity affects the quantity and speciation of polycyclic aromatic hydrocarbons in soils. Acs Earth Space Chem. 2018, 2, 1262–1270. [Google Scholar] [CrossRef]
- Campos, I.; Abrantes, N.; Pereira, P.; Micaelo, A.C.; Vale, C.; Keizer, J.J. Forest fires as potential triggers for production and mobilization of polycyclic aromatic hydrocarbons to the terrestrial ecosystem. Land Degrad. Dev. 2019, 30, 2360–2370. [Google Scholar] [CrossRef]
- Dymov, A.A.; Gabov, D.N.; Milanovskii, E.Y. 13C-NMR, PAHs, WSOC and water repellence of fire-affected soils (Albic Podzols) in lichen pine forests, Russia. Environ. Earth Sci. 2017, 76, 275. [Google Scholar] [CrossRef]
- Jiménez-González, M.A.; De la Rosa, J.M.; Jiménez-Morillo, N.T.; Almendros, G.; González-Pérez, J.A.; Knicker, H. Post-fire recovery of soil organic matter in a Cambisol from typical Mediterranean forest in Southwestern Spain. Sci. Total Environ. 2016, 572, 1414–1421. [Google Scholar] [CrossRef] [PubMed]
- Abney, R.B.; Kuhn, T.J.; Chow, A.; Hockaday, W.; Fogel, M.L.; Berhe, A.A. Pyrogenic carbon erosion after the Rim Fire, Yosemite National Park: The role of burn severity and slope. J. Geophys. Res.-Biogeosci. 2019, 124, 432–449. [Google Scholar] [CrossRef]
- Jiménez-Morillo, N.T.; de la Rosa, J.M.; Waggoner, D.; Almendros, G.; González-Vila, F.J.; González-Pérez, J.A. Fire effects in the molecular structure of soil organic matter fractions under cover. Catena 2016, 145, 266–273. [Google Scholar] [CrossRef]
- Vergnoux, A.; Di Rocco, R.; Domeizel, M.; Guiliano, M.; Doumenq, P.; Théraulaz, F. Effects of forest fires on water extractable organic matter and humic substances from mediterranean soils: UV-vis and fluorescence spectroscopy approaches. Geoderma 2011, 160, 434–443. [Google Scholar] [CrossRef]
- Atanassova, I.; Doerr, S.; Bryant, R. Changes in organic compound composition in soil following heating to maximum soil water repellency under anoxic conditions. Environ. Chem. 2012, 9, 369–378. [Google Scholar] [CrossRef]
- Rey-Salgueiro, L.; Martínez-Carballo, E.; Merino, A.; Vega, J.A.; Fonturbel, M.T.; Simal-Gandara, J. Polycyclic aromatic hydrocarbons in soil organic horizons depending on the soil burn severity and type of ecosystem. Land Degrad. Dev. 2018, 29, 2112–2123. [Google Scholar] [CrossRef]
- Vila-Escalé, M.; Vegas-Vilarrúbia, T.; Prat, N. Release of polycyclic aromatic compounds into a Mediterranean creek (Catalonia, NE Spain) after a forest fire. Water Res. 2007, 41, 2171–2179. [Google Scholar] [CrossRef]
- González-Pérez, J.A.; Almendros, G.; de la Rosa, J.M.; González-Vila, F.J. Appraisal of polycyclic aromatic hydrocarbons (PAHs) in environmental matrices by analytical pyrolysis (Py-GC/MS). J. Anal. Appl. Pyrolysis 2014, 109, 1–8. [Google Scholar] [CrossRef]
- Knicker, H. Pyrogenic organic matter in soil: Its origin and occurrence, its chemistry and survival in soil environments. Quat. Int. 2011, 243, 251–263. [Google Scholar] [CrossRef]
- McKissock, I.; Gilkes, R.J.; van Bronswijk, W. The relationship of soil water repellency to aliphatic C and kaolin measured using DRIFT. Aust. J. Soil Res. 2003, 41, 251–265. [Google Scholar] [CrossRef]
- Simkovic, I.; Dlapa, P.; Feketeová, Z. Application of infrared spectroscopy and thermal analysis in explaining the variability of soil water repellency. Appl. Sci. 2023, 13, 216. [Google Scholar] [CrossRef]
- Finley, C.D.; Glenn, N.F. Fire and vegetation type effects on soil hydrophobicity and infiltration in the sagebrush-steppe: II. Hyperspectral analysis. J. Arid Environ. 2010, 74, 660–666. [Google Scholar] [CrossRef]
- Yu, H.; Kong, B.; Wang, Q.; Liu, X.; Liu, X. Hyperspectral remote sensing applications in soil: A review. In Hyperspectral Remote Sensing; Elsevier: Amsterdam, The Netherlands, 2020; pp. 269–291. [Google Scholar]
- Lewis, S.A.; Robichaud, P.R.; Frazier, B.E.; Wu, J.Q.; Laes, D.Y.M. Using hyperspectral imagery to predict post-wildfire soil water repellency. Geomorphology 2008, 95, 192–205. [Google Scholar] [CrossRef]
- Finn, M.P.; Lewis, M.; Bosch, D.D.; Giraldo, M.; Yamamoto, K.; Sullivan, D.G.; Kincaid, R. Remote sensing of soil moisture using airborne hyperspectral data. Gisci. Remote Sens. 2011, 48, 522–540. [Google Scholar] [CrossRef]
- Rennie, M.; Samburova, V.; Sengupta, D.; Bhattarai, C.; Arnott, W.P.; Khlystov, A.; Moosmüller, H. Emissions from the open laboratory combustion of cheatgrass (Bromus tectorum). Atmosphere 2020, 11, 406. [Google Scholar] [CrossRef]
Disclaimer/Publisher’s Note: The statements, opinions and data contained in all publications are solely those of the individual author(s) and contributor(s) and not of MDPI and/or the editor(s). MDPI and/or the editor(s) disclaim responsibility for any injury to people or property resulting from any ideas, methods, instructions or products referred to in the content. |
© 2025 by the authors. Licensee MDPI, Basel, Switzerland. This article is an open access article distributed under the terms and conditions of the Creative Commons Attribution (CC BY) license (https://creativecommons.org/licenses/by/4.0/).