Article

Spatial Variability and Temporal Changes of Soil Properties Assessed by Machine Learning in Córdoba, Argentina

by
Mariano A. Córdoba
1,2,*,
Susana B. Hang
1,
Catalina Bozzer
3,4,
Carolina Alvarez
1,5,
Lautaro Faule
5,
Esteban Kowaljow
6,7,
María V. Vaieretti
6,
Marcos D. Bongiovanni
4 and
Mónica G. Balzarini
1,2
1
Facultad de Ciencias Agropecuarias, Universidad Nacional de Córdoba, Ing Agr. Félix Aldo Marrone 746, Ciudad Universitaria, Córdoba X5000HUA, Argentina
2
Unidad de Fitopatología y Modelización Agrícola (UFyMA), Instituto Nacional de Tecnología Agropecuaria—Consejo Nacional de Investigaciones Científicas y Técnicas, Av. 11 de Septiembre 4755, Córdoba X5020ICA, Argentina
3
Instituto de Investigaciones, Sociales, Territoriales y Educativas (ISTE), Consejo Nacional de Investigaciones Científicas y Técnicas—Universidad Nacional de Río Cuarto, Ruta Nº 36 Km 601, Rio Cuarto X5804BYA, Córdoba, Argentina
4
Facultad de Agronomía y Veterinaria, Universidad Nacional de Río Cuarto, Ruta Nº 36 Km 601, Rio Cuarto X5804BYA, Córdoba, Argentina
5
Instituto Nacional de Tecnología Agropecuaria, EEA Manfredi, Ruta Nac. Nº 9 km 636, Manfredi X5988, Córdoba, Argentina
6
Instituto Multidisciplinario de Biología Vegetal (IMBIV), Consejo Nacional de Investigaciones Científicas y Técnicas—Universidad Nacional de Córdoba, Av. Vélez Sarsfield 1666, Córdoba X5016GCA, Argentina
7
Facultad de Ciencias Exactas, Físicas y Naturales, Universidad Nacional de Córdoba, Av. Vélez Sarsfield 299, Córdoba X5000HUA, Argentina
*
Author to whom correspondence should be addressed.
Soil Syst. 2025, 9(4), 109; https://doi.org/10.3390/soilsystems9040109
Submission received: 11 July 2025 / Revised: 22 September 2025 / Accepted: 8 October 2025 / Published: 10 October 2025
(This article belongs to the Special Issue Use of Modern Statistical Methods in Soil Science)

Abstract

Understanding the temporal dynamics and spatial distribution of key soil properties is essential for sustainable land management and informed decision-making. This study assessed the spatial variability and decadal changes (2013–2023) of topsoil properties in Córdoba, central Argentina, using digital soil mapping (DSM) and machine learning (ML) algorithms. Three ML methods—Quantile Regression Forest (QRF), Cubist, and Support Vector Machine (SVM)—were compared to predict soil organic matter (SOM), extractable phosphorus (P), and pH at 0–20 cm depth, based on environmental covariates related to site climate, vegetation, and topography. QRF consistently outperformed the other models in prediction accuracy and uncertainty, confirming its suitability for DSM in heterogeneous landscapes. Prediction uncertainty was higher in marginal mountainous areas than in intensively managed plains. Over ten years, SOM, P, and pH exhibited changes across land-use classes (cropland, pasture, and forest). Extractable P declined by 15–35%, with the sharpest reduction in croplands (−35.4%). SOM decreased in croplands (−6.7%) and pastures (−3.1%) but remained stable in forests. pH trends varied, with slight decreases in croplands and forests and a small increase in pastures. By integrating high-resolution mapping and temporal assessment, this study advances DSM applications and supports regional soil monitoring and sustainable land-use planning.

1. Introduction

Soil is a dynamic and complex system that plays a fundamental role in sustaining agricultural and environmental health. Spatial variation in key soil properties, such as soil organic matter (SOM), pH, and extractable phosphorus (P), has major implications for food security and ecosystem sustainability, especially under global environmental change [1]. SOM is essential for soil health and productivity, as it controls key physical, chemical, and biological properties. As a primary component and indicator of soil organic carbon (SOC), it is central to the global carbon cycle. Maintaining or increasing SOC stocks therefore contributes to climate change mitigation by enhancing soil carbon storage [2]. Soil pH directly affects nutrient availability, plant uptake, and the solubility of heavy metals, which can be toxic to vegetation. Suboptimal soil pH levels can thus induce plant stress [3]. Phosphorus is vital for basic plant metabolism and crop production and is often deficient in soils worldwide [4]. However, P accumulated in soils or recently applied as fertilizer is prone to loss via leaching and runoff, and even small concentrations can trigger eutrophication in aquatic ecosystems [5].
Understanding the spatial and temporal variability of soil properties is essential for sustainable land management. In recent years, artificial intelligence (AI) has transformed the study of soil variability and has been widely applied in digital soil mapping (DSM). Many AI approaches employ statistical learning algorithms capable of predicting soil properties at unsampled locations [6]. Machine Learning (ML), a subset of AI, enhances model performance by learning from data and identifying latent patterns, thereby enabling accurate prediction of soil properties in complex landscapes. These methods are especially promising for prediction and classification tasks, and their use in agriculture and environmental applications has increased substantially [7].
To improve the global agri-food system and promote more sustainable food production, a deeper understanding of soil chemical and biophysical properties—and their spatial and temporal variability—is essential. This requires the collection of extensive spatial agronomic data for several years, for which DSM has emerged as a reliable and efficient technique for predicting key soil characteristics. By leveraging empirical relationships between soil properties and predictor variables, such as vegetation and climate, DSM enables detailed analysis of the spatial distribution of edaphic variables [8]. DSM studies often utilize covariates available at multiple spatial resolutions, ranging from digital elevation model derivatives to remote sensing data. Predictive models typically require the integration and rescaling of multiple layers of covariates. A major challenge lies in selecting the optimal set of input variables that significantly enhance model performance. Feature selection is commonly used to reduce model complexity and improve predictive accuracy by retaining only the most informative features [9].
Building on the framework proposed by McBratney et al. [10], several predictive models based on linear regression kriging have been successfully applied to estimate soil properties. However, in recent decades, there has been a growing shift toward ML algorithms, owing to their capacity to model complex, nonlinear relationships without relying on strong assumptions about data distribution. These methods have consistently demonstrated improved predictive performance across diverse environmental settings and geographic regions [11,12]. A wide array of ML approaches have been applied in DSM, including rule-based models like Cubist [13], ensemble methods such as Random Forest [14] and Quantile Regression Forest (QRF) [15], and kernel-based algorithms such as Support Vector Machines (SVM) [16]. Although these methods differ in structure and interpretability, all have shown promise in modeling soil properties from large and heterogeneous datasets. Among these, QRF has received particular attention for its ability to generate prediction intervals to quantify uncertainty—an especially valuable feature in DSM applications [17].
Despite these advantages, conventional ML algorithms exhibit notable limitations when applied to spatio-temporal studies. In their standard implementations, they do not explicitly account for spatial or temporal autocorrelation, potentially limiting their capacity to capture underlying soil processes across space and time. Moreover, while ensemble and rule-based models offer robust spatial predictions, temporal variability is typically inferred indirectly, for instance through multi-year comparisons. These limitations underscore the need to complement ML predictions with explicit spatio-temporal information when analyzing soil dynamics [6].
Due to their differing mechanisms for processing training data, ML models can produce divergent assessments of variable importance [9]. Thus, selecting the most suitable ML approach for a given landscape remains a key challenge in soil data analytics. Several studies, including those by Diks and Vrugt [18], Baltensweiler et al. [19], and Qu et al. [12], have documented performance differences across varying environmental contexts. The suitability of a specific algorithm often depends on the dataset’s characteristics and the intended purpose of the spatial mapping task [11]. As ML models gain broader adoption in DSM, it becomes increasingly important to evaluate their performance across heterogeneous landscapes and pronounced environmental gradients [20,21]. In such contexts, understanding the spatial variability and its environmental drivers is vital to enhance model interpretability and guide informed land management decisions. Furthermore, assessing temporal shifts in soil properties is essential for sustainable land-use, especially in regions experiencing agricultural intensification and climate change [22].
In Córdoba, Argentina, soil fertility has come under growing pressure due to the intensification of agricultural practices, especially the widespread adoption of soybean-dominated systems with limited nutrient replenishment. Recent assessments have reported negative phosphorus balances in croplands, reflecting insufficient fertilization relative to crop nutrient exports [23]. Similarly, long-term land-use changes have led to declines in soil organic matter across large areas, particularly where native ecosystems were converted to cropland or pasture [24,25]. These trends highlight the need for comprehensive regional assessments of soil fertility to quantify current conditions and detect long-term changes. Focusing our study on one of Argentina’s most agriculturally significant regions allows us to provide insights with direct relevance for soil management, fertilization strategies, and sustainable food production.
Against this backdrop, the present study applies established DSM methods to generate high-resolution maps of soil properties for the year 2023 across a large and heterogeneous region. A distinctive aspect of our approach is the integration of these spatial predictions with decadal field observations from 2013, enabling the evaluation of long-term soil property changes under different land-use systems. The study area—Córdoba province—is one of Argentina’s principal agricultural regions, contributing significantly to national grain and livestock output. This large-scale assessment offers critical spatial insights to support sustainable soil and land-use management in a key agri-food region of South America.
The objectives of this study were to: (i) compare the performance of widely used ML algorithms in predicting topsoil properties; (ii) map the spatial variability of key soil properties using high-resolution environmental covariates derived from multiple data sources and (iii) analyze decadal trends in soil properties to develop a broader understanding of soil dynamics under varying land-use systems. Regarding methodology, we hypothesized that an on-site simultaneous comparison of ML methods for DSM would enable the identification of the most effective model for predicting soil properties in heterogeneous agricultural landscapes. The study is characterized by integration of a large, harmonized soil dataset with multi-source environmental covariates and temporal analysis to provide valuable insights for both science and land management.

2. Materials and Methods

2.1. Study Area

The study was conducted in Córdoba province, in the central region of the Argentine Pampas, located between 29–35° S and 61–65° W (Figure 1). The province has a surface area of approximately 16 million hectares. The topography predominantly consists of plains (~60%), complemented by north–south mountain ranges in the western part of the province. Elevations range from 79 to 2790 m above sea level (m a.s.l.). The region is bisected by the 800 mm and 500 mm isohyets, establishing an east–west moisture gradient, ranging from humid to sub-humid, semi-arid, and arid climates. Mean annual rainfall ranges from 400 to 900 mm, while mean annual temperatures range from 10 to 24 °C. The hydrological balance indicates an annual water deficit ranging from −80 mm to −480 mm. According to Soil Taxonomy [26], the soils are categorized as Mollisols (61%), Entisols (13%), Alfisols (7%), and Aridisols (5%) [27]. Lands covered by salt flats and temporary or permanent water bodies were excluded from the analysis.

2.2. Soil Data

Soil data were compiled from multiple sources, including a soil profile database developed under the Soil Maps Plan of the Ministry of Agriculture and Livestock of Córdoba and the National Institute of Agricultural Technology https://suelos.cba.gov.ar/ (accessed on 8 October 2025). In addition, two research data collections were incorporated: one from the Good Agricultural Practices program of the Ministry of Bioagroindustry of Córdoba https://bpa.cba.gov.ar/ (accessed on 8 October 2025), and another from studies conducted in the southwest of Córdoba province in the sandy plains known as the Pampa Medanosa [28,29]. Soil data from studies conducted in natural and managed areas by members of the Multidisciplinary Institute of Plant Biology of the National University of Córdoba (IMBIV, CONICET-UNC), as well as data provided by private companies conducting field-scale studies were also used. Notably, approximately 90% of the total observed data were collected from 2020 onwards. All soil samples were precisely georeferenced. For soil profile data or multi-depth measurements, we harmonized the soil depth layers to 0–20 cm by applying the mass-preserving spline function [30]. To ensure comparability across sources, data were checked for consistency in units and analytical methods, and duplicate or inconsistent records were removed prior to modeling. Measurements were retained when obtained using standardized methods: extractable phosphorus (P-Bray) [31], Walkley & Black for soil organic matter [32], and pH determined with a 1:2.5 soil-to-water ratio. In total, the harmonized database comprised 7000 observations (Table 1). The spatial distribution of topsoil samples is shown in Figure 1. Sample density was higher in intensively cultivated areas, particularly croplands, and lower in natural or less accessible regions, reflecting the heterogeneity of land-use and soil properties across Córdoba, Argentina. This uneven distribution highlights both the strengths and limitations of the available dataset for capturing the spatial variability associated with soil type and management.

2.3. Environmental Covariates

An extensive set of potential environmental covariates was used to characterize the soil-forming factors outlined in the SCORPAN model [10]. Bioclimatic variables were extracted from the CHELSA (Climatologies at high resolution for the Earth’s land surface areas) v2.1 database, which provides temperature and precipitation estimates downscaled from the output of the ERA-Interim climate reanalysis model to a 1 km spatial resolution [33]. These variables, encompassing annual averages (mean annual temperature and annual precipitation) and extreme environmental factors (temperature of the coldest/warmest month or quarter, precipitation of the wettest/driest month or quarters), were derived from monthly temperature and precipitation values. Their mean, minimum, and maximum values were subsequently computed. Monthly evapotranspiration values (mean, maximum, and minimum) were also included and calculated using the Penman-Monteith equation [34].
Additionally, we computed vegetation indices from remote sensing products. Using Landsat 8 satellite images (30 m resolution) spanning quarterly periods from 2013 to 2023, we derived the Normalized Difference Vegetation Index (NDVI), Land Surface Temperature (LST), and shortwave infrared (SWIR). To further account for vegetation, we derived the Fraction of Photosynthetically Active Radiation absorbed by vegetation (fPAR) using the MODIS sensor product MOD15A2H v061 [35]. The fPAR measures the proportion of solar radiation that reaches the top of the plant canopy and contributes to photosynthetic activity. The mean and standard deviation (SD) for each 3-month period (quarter) were calculated for all vegetation variables.
Regarding topographic attributes, geomorphometric variables representing various aspects of the Earth’s surface morphology were used. These variables originated from the global Geomorpho90m database [36], which comprises standardized geomorphometric features derived from the MERIT Digital Elevation Model, with a resolution of 90 m. The standardized geomorphometric variables consist of three types of layers describing (i) the rate of change along the elevation gradient, (ii) roughness, and (iii) geomorphological forms. Textural classes derived from the soil maps of Córdoba (mapascordoba.gob.ar) were also used as covariates. All environmental covariates (p = 60) were rescaled to a common 90 m grid cell using bicubic interpolation [37]. Spectral index were calculated, and the prediction raster grid containing all covariate values was generated using the Google Earth Engine cloud computing platform for geospatial analysis [38].

2.4. Machine Learning (ML) Algorithms

Three ML methods—QRF, Cubist, and SVM—were compared to assess their ability to predict topsoil properties. The algorithms used in this study were selected to represent complementary modeling paradigms in DSM [11]. QRF was included because it enables the quantification of prediction uncertainty. Cubist was chosen for its strong predictive performance in environmental applications and for its easier interpretability. SVM was selected as a kernel-based method particularly suited for modeling complex nonlinear relationships. Together, these algorithms provide a robust comparative framework encompassing ensemble, rule-based, and kernel-based ML strategies.
For a standardized comparison, we independently applied the Recursive Feature Elimination (RFE) approach [39] for optimal covariate selection in each model. RFE is a wrapper-based feature selection method that recursively removes the least important variables in terms of model performance, aiming to retain the subset of predictors that contribute most to predictive accuracy. RFE helps reduce model complexity and improve generalization by eliminating redundant or irrelevant covariates. Hyperparameter optimization for each method was performed through 10-fold cross-validation on the training dataset [40].

2.4.1. Quantile Regression Forest (QRF)

The QRF algorithm is a probabilistic extension of the Random Forest (RF) method. RF is an ensemble technique that builds multiple regression trees (RT) using bootstrapped samples of the training data. Each RT recursively partitions the feature space, and only a random subset of covariates is considered at each split, thereby introducing diversity into the ensemble. While RF provides point predictions by averaging the outputs stored in the terminal nodes of the trees, QRF extends this by estimating the full conditional distribution of the response variable, enabling the derivation of prediction intervals and the quantification of predictive uncertainty. In this study, QRF was implemented in the R statistical environment using the ‘caret’ package [41]. The ‘mtry’ parameter, which defines the number of covariates randomly selected at each split and is the only parameter requiring specific tuning [42], was optimized via grid search across the range of 2 to 25. The number of trees (‘ntree’) and the minimum number of samples per terminal node (‘nodesize’) were fixed at their default values of 500 and 5, respectively.

2.4.2. Cubist

The Cubist algorithm is a rule-based method that integrates regression trees with linear regression models. In contrast to traditional RTs, Cubist fits linear models at the terminal nodes (leaves) of the tree. Model selection is based on conditional rules derived from the data. Predictive accuracy is further enhanced through boosting, by generating an ensemble of rule-based models known as “committees,” with each subsequent model correcting the errors of its predecessor. Here, the Cubist model was implemented using the ‘caret’ package in R (v.4.5.1), and model parameters—including the number of ‘committees’ and the number of nearest ‘neighbors’ used in prediction—were optimized through grid search. The number of committees was tuned across {1, 10, 50, 100}, and neighbors across {0, 1, 5, 9}.

2.4.3. Support Vector Machine (SVM)

SVM is a supervised machine learning algorithm grounded in the principles of statistical learning theory and structural risk minimization [43]. Although originally developed for classification tasks, it has been adapted for regression problems. SVM employs kernel functions to project the data into a higher-dimensional space, where it fits an optimal hyperplane by minimizing an ε-insensitive loss function. This approach tolerates deviations smaller than a defined epsilon (ε) threshold [40]. In this study, we applied SVM with a radial basis function (RBF) kernel. The two main hyperparameters—the cost (‘cost’) and kernel width (‘sigma’)—were optimized using grid search via the ‘caret’ package in R. The ‘cost’ parameter was tuned across {0.25, 0.5, 1, 2}, while ‘sigma’ values were estimated using the sigest function and further refined within the automatically generated grid.

2.5. Assessment of ML Algorithms

A k-fold cross-validation process (k = 10) was performed on each soil property, following the selection of predictors by RFE, to compare the model performance of QRF, Cubist, and SVM. The performance of these ML algorithms was assessed using the mean absolute error (MAE), root mean square error (RMSE), Lin’s Concordance Correlation Coefficient (CCC), and modeling efficiency coefficient (MEC). Each metric quantifies the discrepancies between the observed and predicted values as follows.
M A E = 1 n i = 1 n y i y ^ i
R M S E = 1 n i = 1 n y i y ^ i 2
ρ c = 2 · ρ · σ y ^ · σ y σ y ^ 2 + σ y 2 + ( μ y ^ μ y ) 2      
M E C = 1 i = 1 N y i y ^ i 2 i = 1 N y i μ y 2
where n , y ^ i , y i , σ y ^ , σ y , μ y ^ , μ y , and ρ are, respectively, the sample size, predicted values, observed values, variance of predictions, variance of observations, mean values of the predicted and observed values, and the correlation coefficient between predicted and observed values.
The RMSE assesses map accuracy in the units of the target variable, CCC assesses the ability of the map to match the spatial pattern of the target soil variable, and MEC quantifies the proportion of variance explained by the model [44]. A MEC value of 1 indicates a perfect fit, whereas a value of 0 suggests that the model performs no better than predicting with the mean of the observed values.
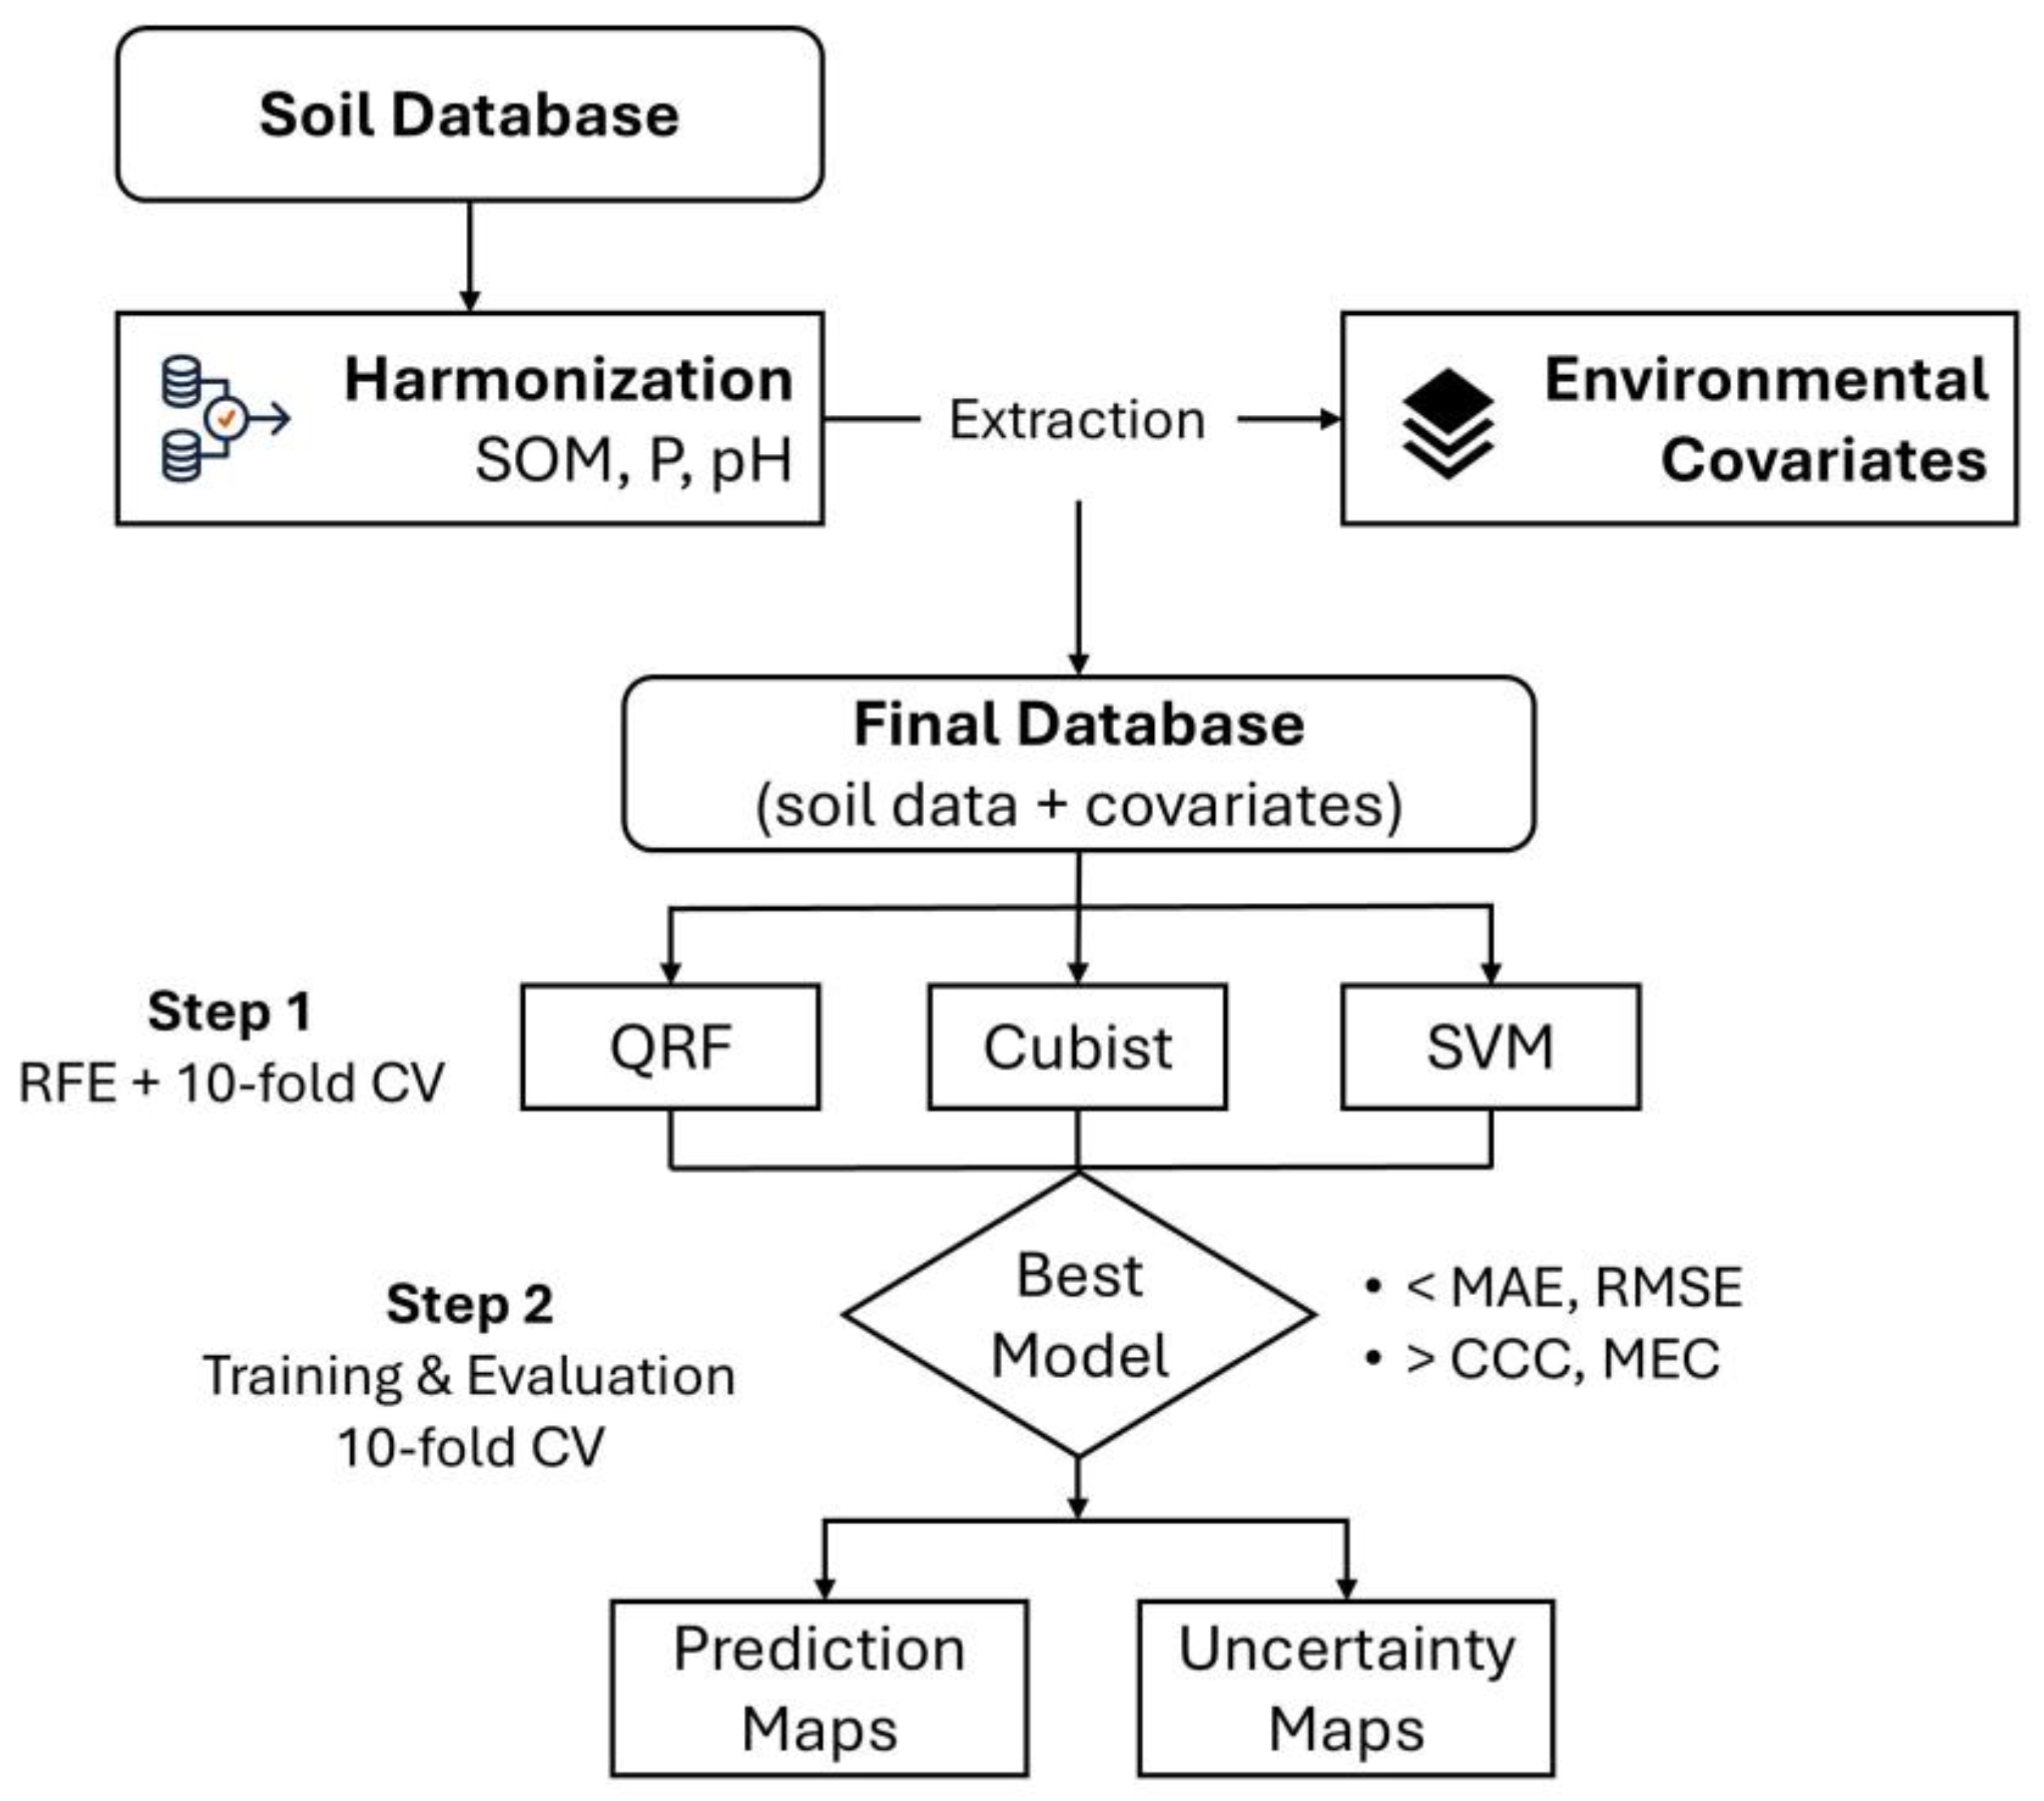
For the ML algorithm with the best overall performance, we next quantified the uncertainty for each predicted pixel. To this end, we calculated the mean and SD of each pixel, which served as the final map and its prediction uncertainty, respectively. To analyze the environmental factors influencing spatial variations in soil properties, we determined the relative importance of covariates using the best-performing model. The relative importance was estimated using the permutation importance method [45], which involves randomly permuting each covariate. This calculation is based on the difference in the out-of-bag error between the model with the permuted covariate and the model without the covariate [46]. A higher increase in error indicates greater relative importance for the variable. The schematic workflow of data processing, model training, and evaluation is presented in Figure 2.

2.6. Temporal Changes in Soil Properties

To compare the temporal patterns of topsoil properties, we used data from a previous study conducted in 2013 [47]. For 2023, we relied on the predicted values obtained via DSM using the ML algorithm with the best average performance. Land cover information for 2023 was based on a recent classification provided by IDECOR [48]. To ensure consistency with broader land-use categories, the original land-cover classes were reclassified as: Forest and Shrubland were grouped under ‘Forest’; Annual Extensive Cropping as ‘Cropland’; and both Improved Pasture and Managed Natural Pasture as ‘Pasture’. To assess temporal changes, average values of topsoil properties were computed for each land-use category in 2013 and 2023. Statistical differences between years were evaluated using a permutation-based paired test, implemented with the ofemeantest package [49] in R.

3. Results

3.1. Soil Properties

The descriptive statistics of the soil properties across Córdoba province are shown in Table 1. The mean SOM content was 2.19%, with a relative variability of 50%. Extreme values ranged from 0.10% to 13.20%. However, only 5% of the data had values below 1% or above 3.56%. The variable P showed the highest relative variability (coefficient of variation, CV = 85%) with an average value of 26.54 ppm, whereas the pH exhibited lower variability (CV = 10%), with an average value of 6.53, and minimum and maximum values of 4.1 and 11, respectively.

3.2. Performance of ML Models

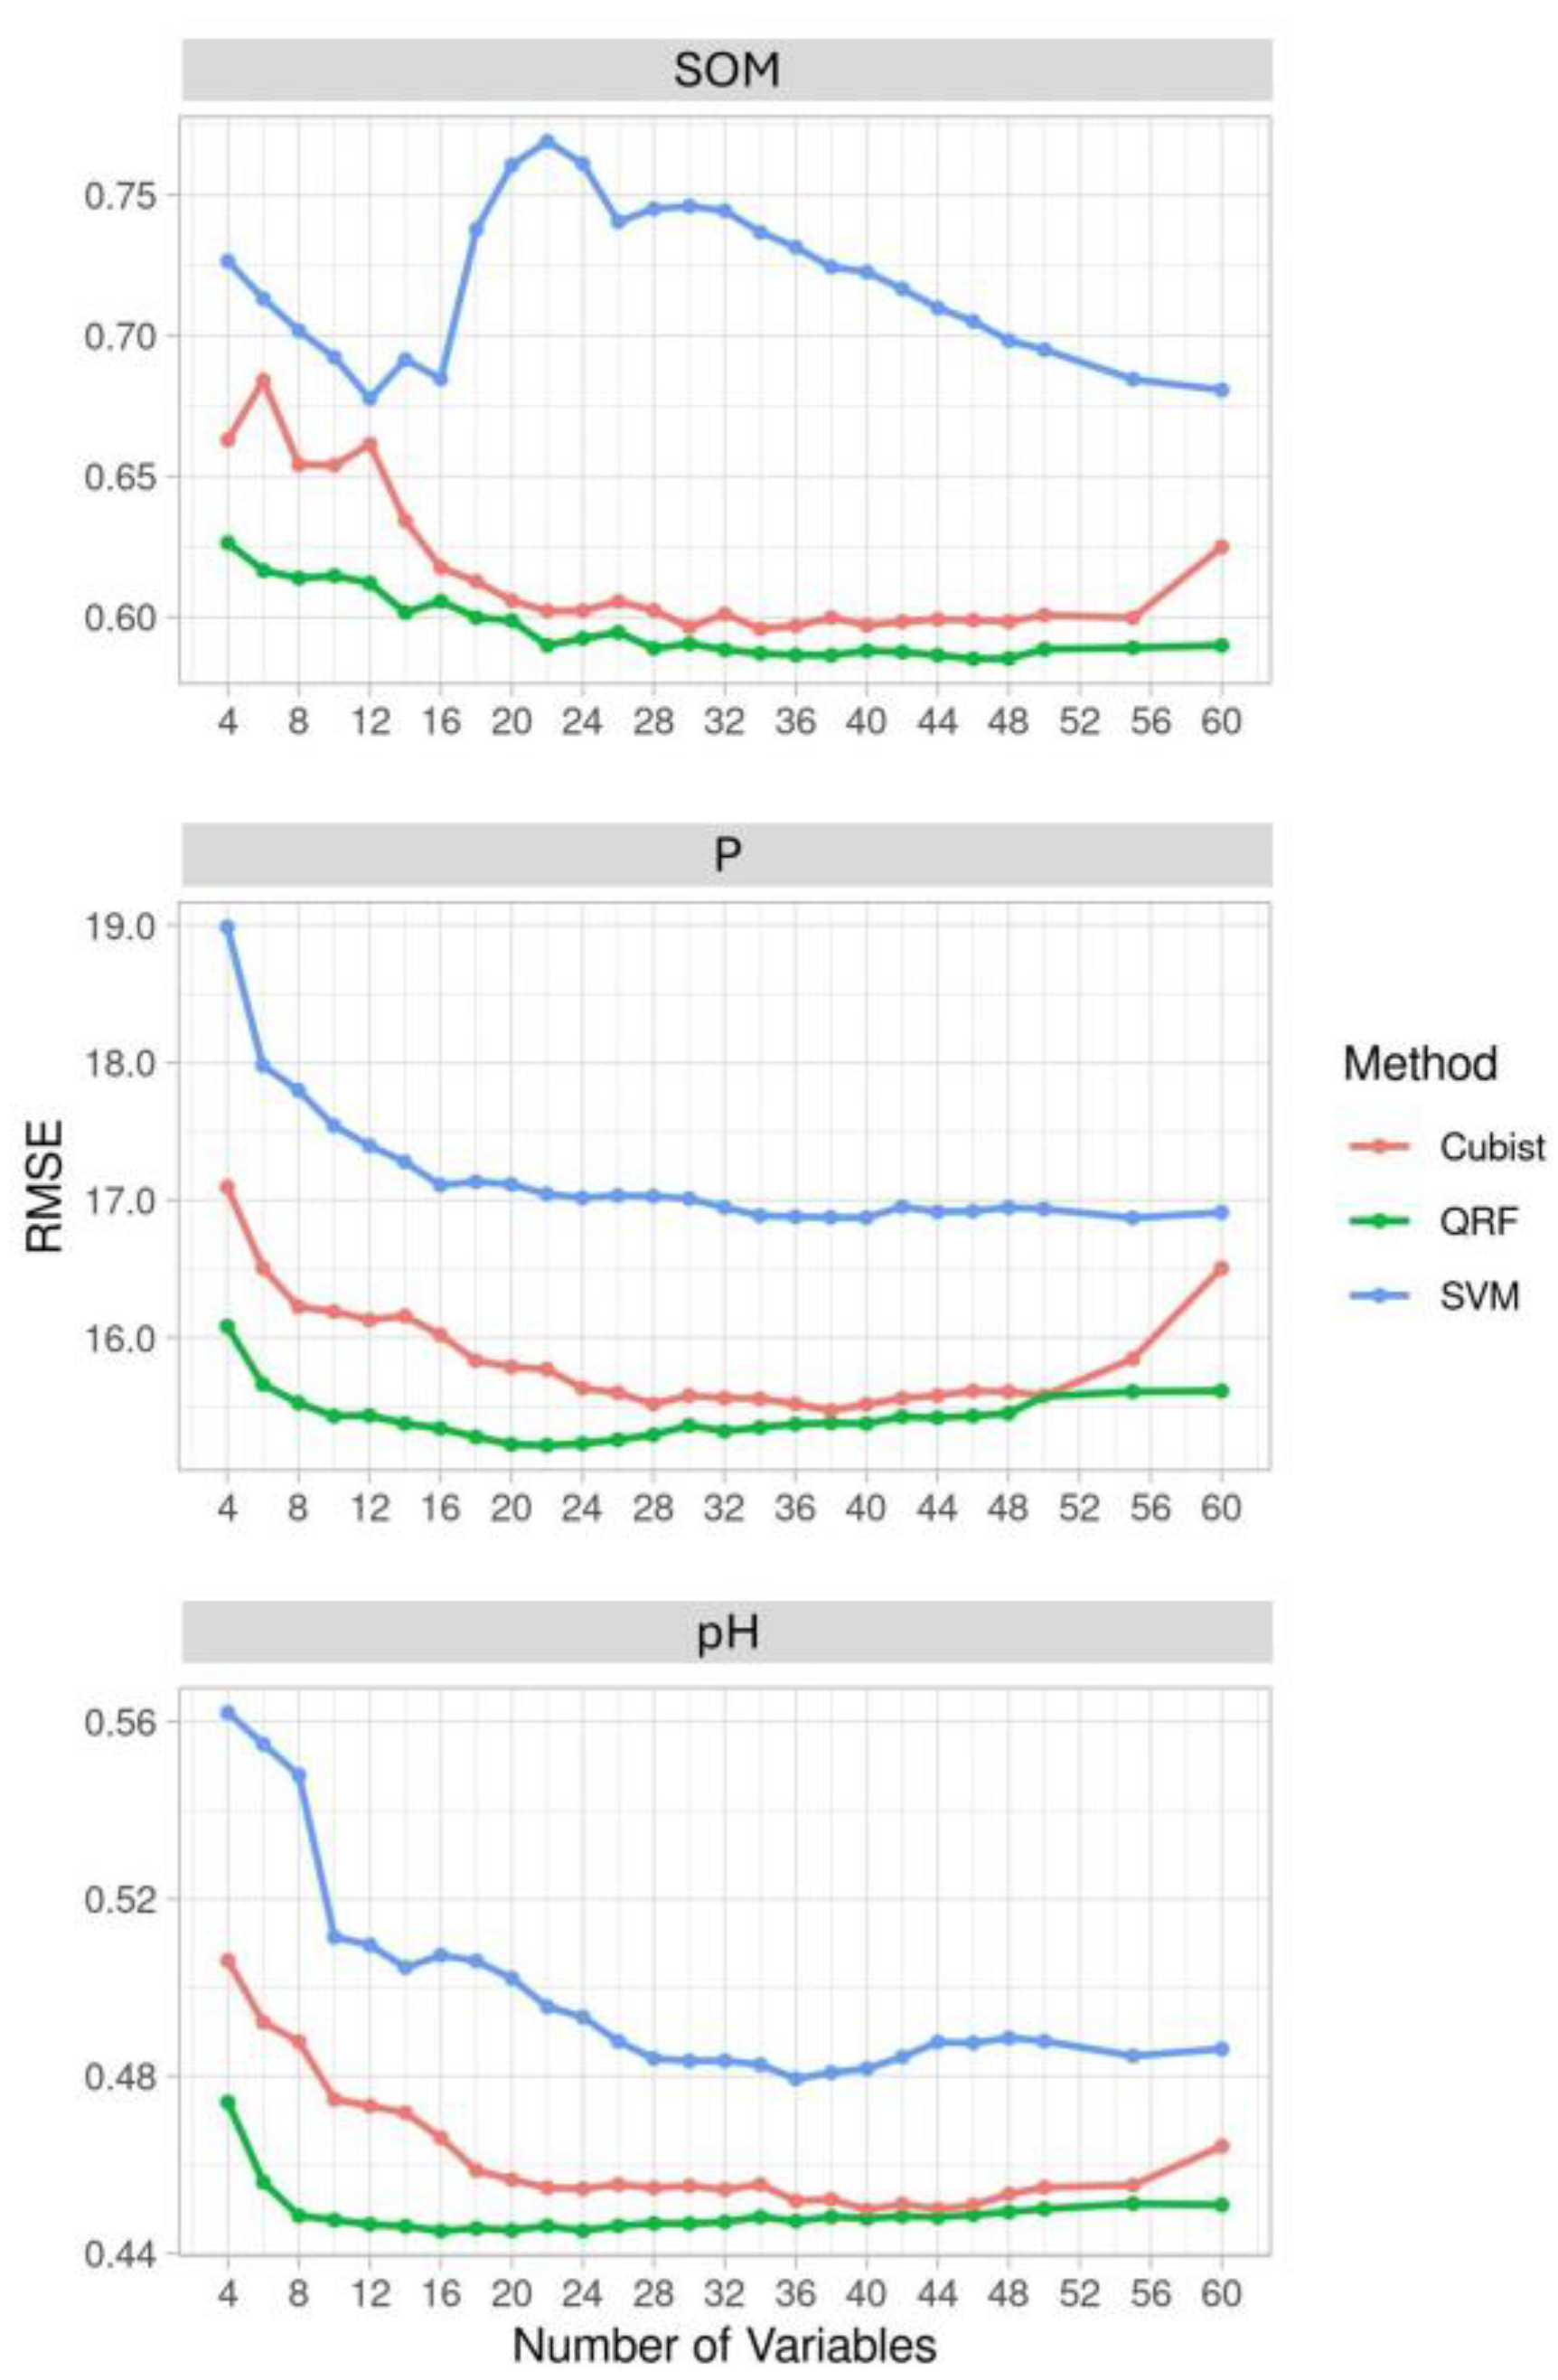
The models selected a varying number of covariates for each soil property (Figure 3). The QRF algorithm demonstrated the highest performance for all soil variables. For SOM, QRF showed a subset of 22 covariates yielding predictive performance comparable to the full predictor set. The same pattern was observed when using the Cubist algorithm. In contrast, for SVM, optimal performance was achieved with 10 covariates, with a decrease in error observed as the number of covariates increased. However, when a high number of covariates (p = 60) was used, performance values were close to the optimum. For P, RFE did not improve model performance except when nearly all covariates were included.
Table 2 presents the prediction accuracy statistics for each model for the three soil variables studied. The QRF algorithm exhibited the best performance across all three soil properties, followed by Cubist. Conversely, the SVM model showed comparatively lower performance than QRF and Cubist. For instance, in the case of SOM, QRF had the lowest MAE and RMSE values (0.380 and 0.581), as well as the highest CCC and MEC values (0.846 and 0.715, respectively). This trend was consistent across all the soil properties evaluated. Figure 4 illustrates the scatter plots of observed versus predicted values, showing that QRF predictions aligned most closely with the 1:1 line, in agreement with the accuracy metrics reported in Table 2.

3.3. Relative Importance of Covariates

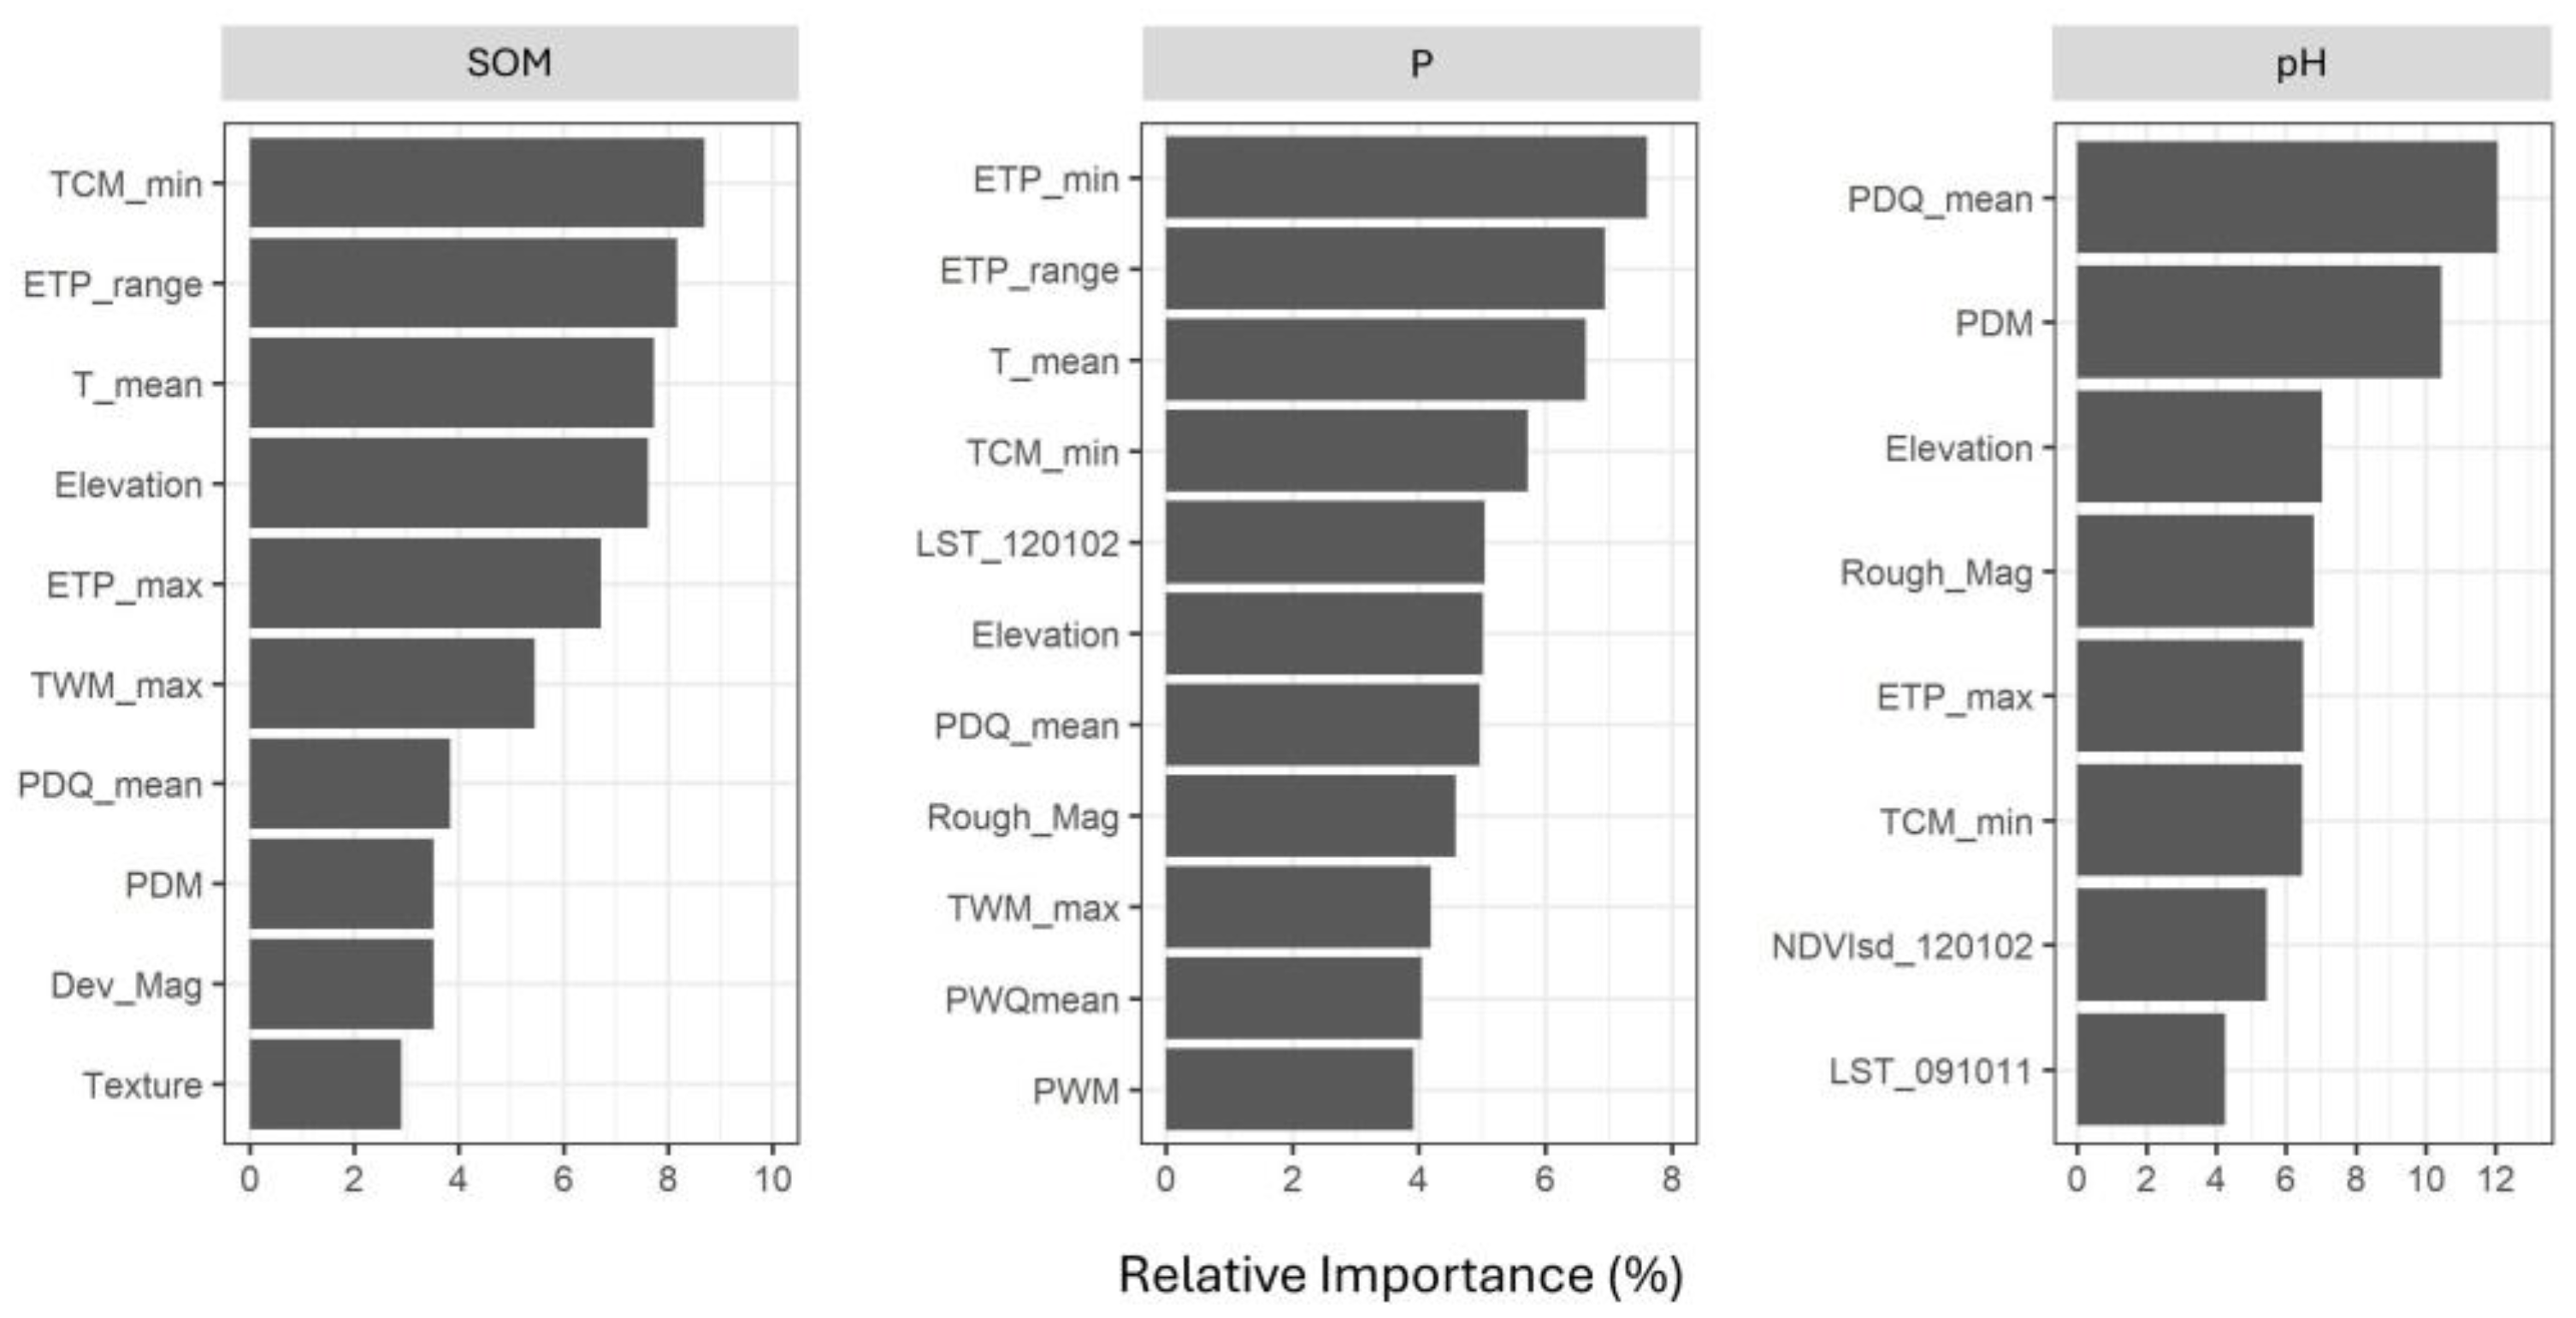
The spatial distribution of SOM and P was primarily influenced by climatic variables, followed by vegetation and topography. For SOM, based on the relative importance of covariates, climatic variables explained the largest proportion of soil variability (56%), followed by vegetation (24%), topography (17%), and soil texture (3%). Similarly, for P, climatic variables were the most influential (59%), followed by vegetation and topography (31% and 10%). For pH, climatic variables contributed 50%, topographic variables 33%, and vegetation 17%, with topographic variables contributing more than vegetation.
Figure 5 shows the percentage of response variability explained by the most influential covariates for each soil property. Together, these covariates account for 60% of the total variability. For SOM, the key contributing variables included the mean daily minimum air temperature of the coldest month (TCM_min), annual range of monthly potential evapotranspiration (ETP_range), mean annual air temperature (T_mean), and Elevation, with relative importance values of 8.7%, 8.2%, 7.7%, and 7.6%, respectively. These variables primarily belong to the climatic category. Additionally, the variable Texture contributed 2.9% of relative importance. Similarly, for P, variables such as ETP_min, T_mean, and ETP_range emerged as important contributors, with relative importance values of 7.6%, 6.6%, and 6.9%, respectively. Although variables related to vegetation such as mean land surface temperature from December to February (LST_120102), also emerged as important, their contributions were comparatively lower. Regarding pH levels, mean monthly precipitation amount of the driest quarter (PDQ_mean), precipitation amount of the driest month (PDM), and Elevation were identified as the most important predictor variables. The most influential variables for pH were primarily climatic and topographic.

3.4. Prediction and Uncertainty Maps of Soil Properties

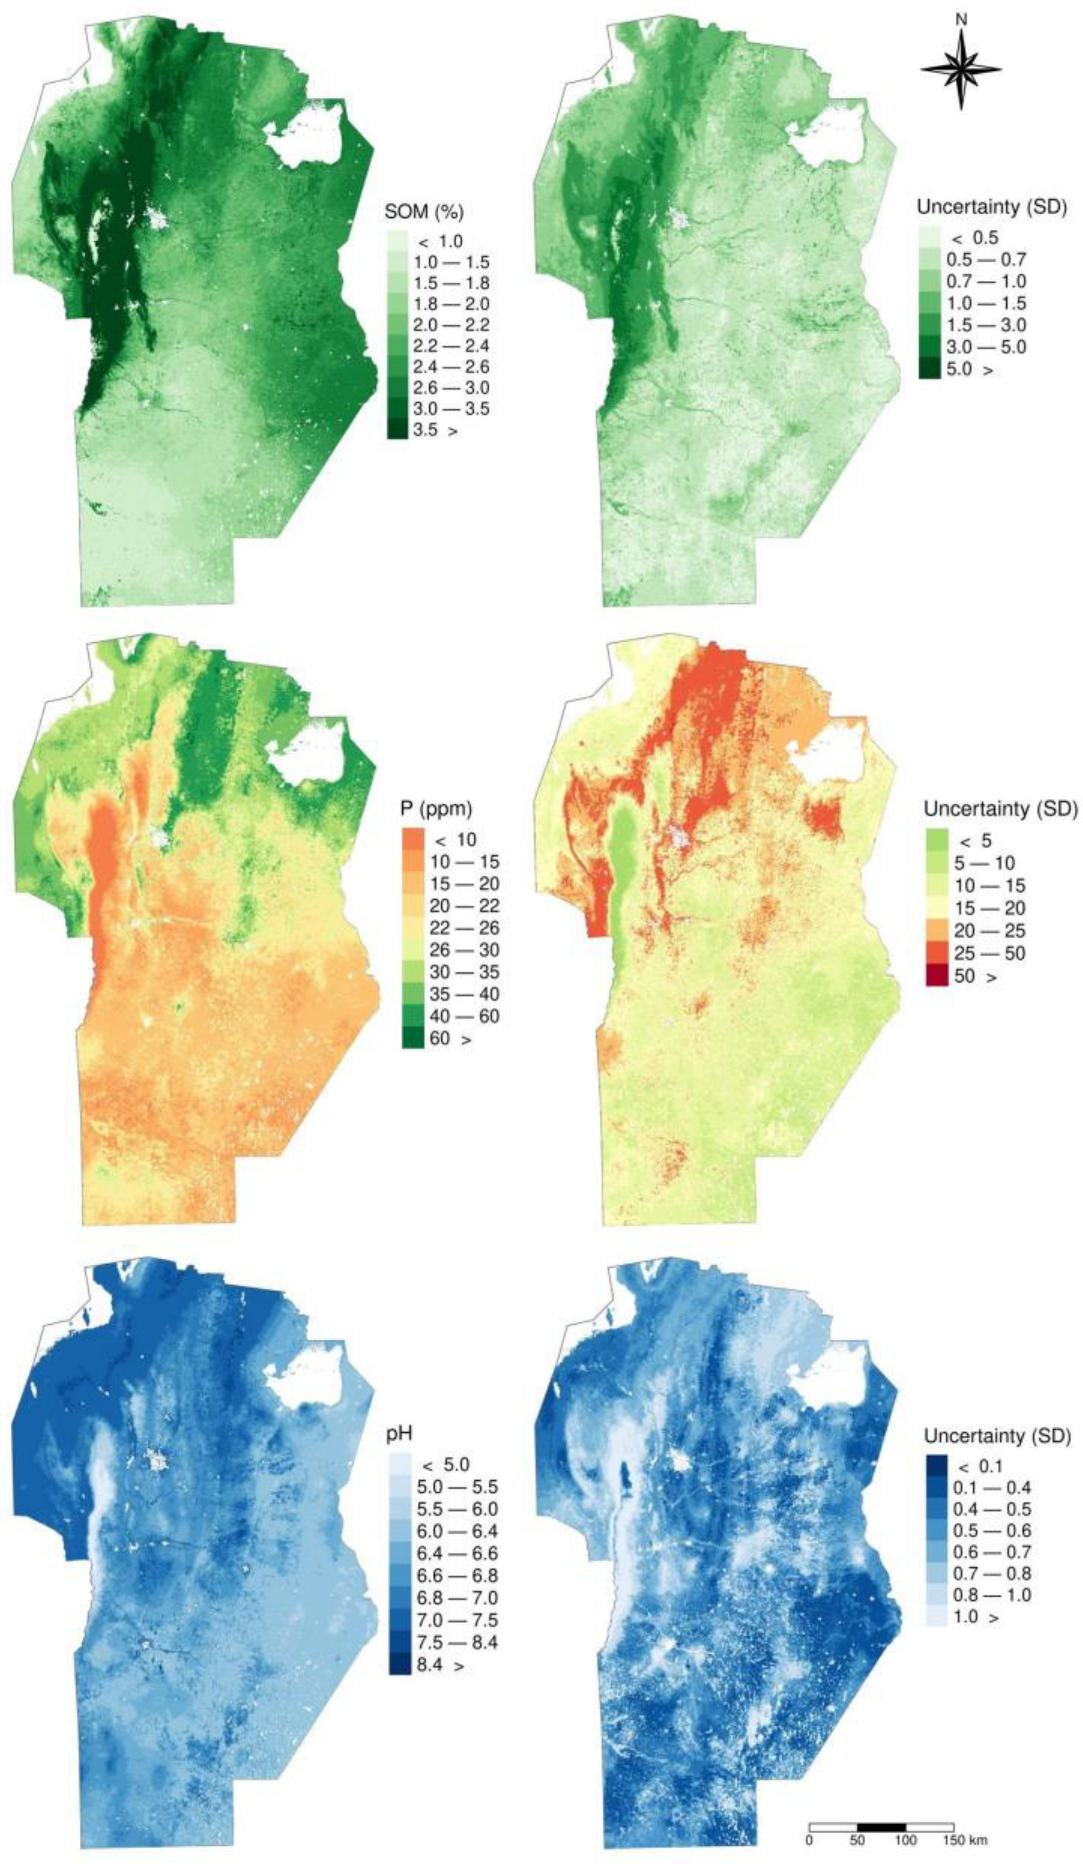
The predicted maps and their associated uncertainty—quantified as the standard deviation (SD) of the conditional distribution estimated by the QRF model—are presented in Figure 6. The predicted mean value of SOM for Córdoba province was 2.39%. Out of the total predicted SOM values, 5% were below 1.37%, while another 5% showed values above 4.2%. Regions with lower values (<1%) were mainly located in high mountainous areas dominated by rocky outcrops and grasslands [48], whereas higher values (>4%) were also observed in mountainous areas but located below 1700 m a.s.l., characterized by lower rock cover and in the foothill region. Values in the range of 1% to 1.5% were mainly identified in the southwest zone, while values between 2.4% and 3% were observed in the central-northern and eastern regions. The average SD of the prediction was 0.93%. Areas with high SD (>3%) corresponded to the northwest zone of the province, where the density of samples for spatial prediction was lower.
For P, the average estimated value was 24.8 ppm, and 5% of the predicted values were below 12.7 ppm, while the same percentage had values above 41.9 ppm. Lower values (<10 ppm) were observed in the provincial highlands (mountain ranges). Values between 10 and 20 ppm occurred across a large portion of the territory (37% of the province), primarily in the central and southern zones. Conversely, values above 30 ppm (30% of the provincial area) were located in the north, northeast, and northwest provincial zones. The average prediction SD values were 17.1 ppm. Similarly to the SOM variable, the highest SD values were located in the mountainous region, where the data density for modeling was low. This region often showed highly contrasting observed values, including the maximum SOM observed (13.2%). The average pH prediction value was 6.64. Out of the total predicted values, 5% were below 6.08, while another 5% had values above 7.35. Values above 7 ocurred in the northwest zone of the province and in swamp and lagoon areas in the southeast. The prediction SD values for this variable averaged 0.60. The areas of highest SD corresponded to those observed with higher SD for SOM and P.

3.5. Temporal Variation in Soil Properties Across Land-Uses

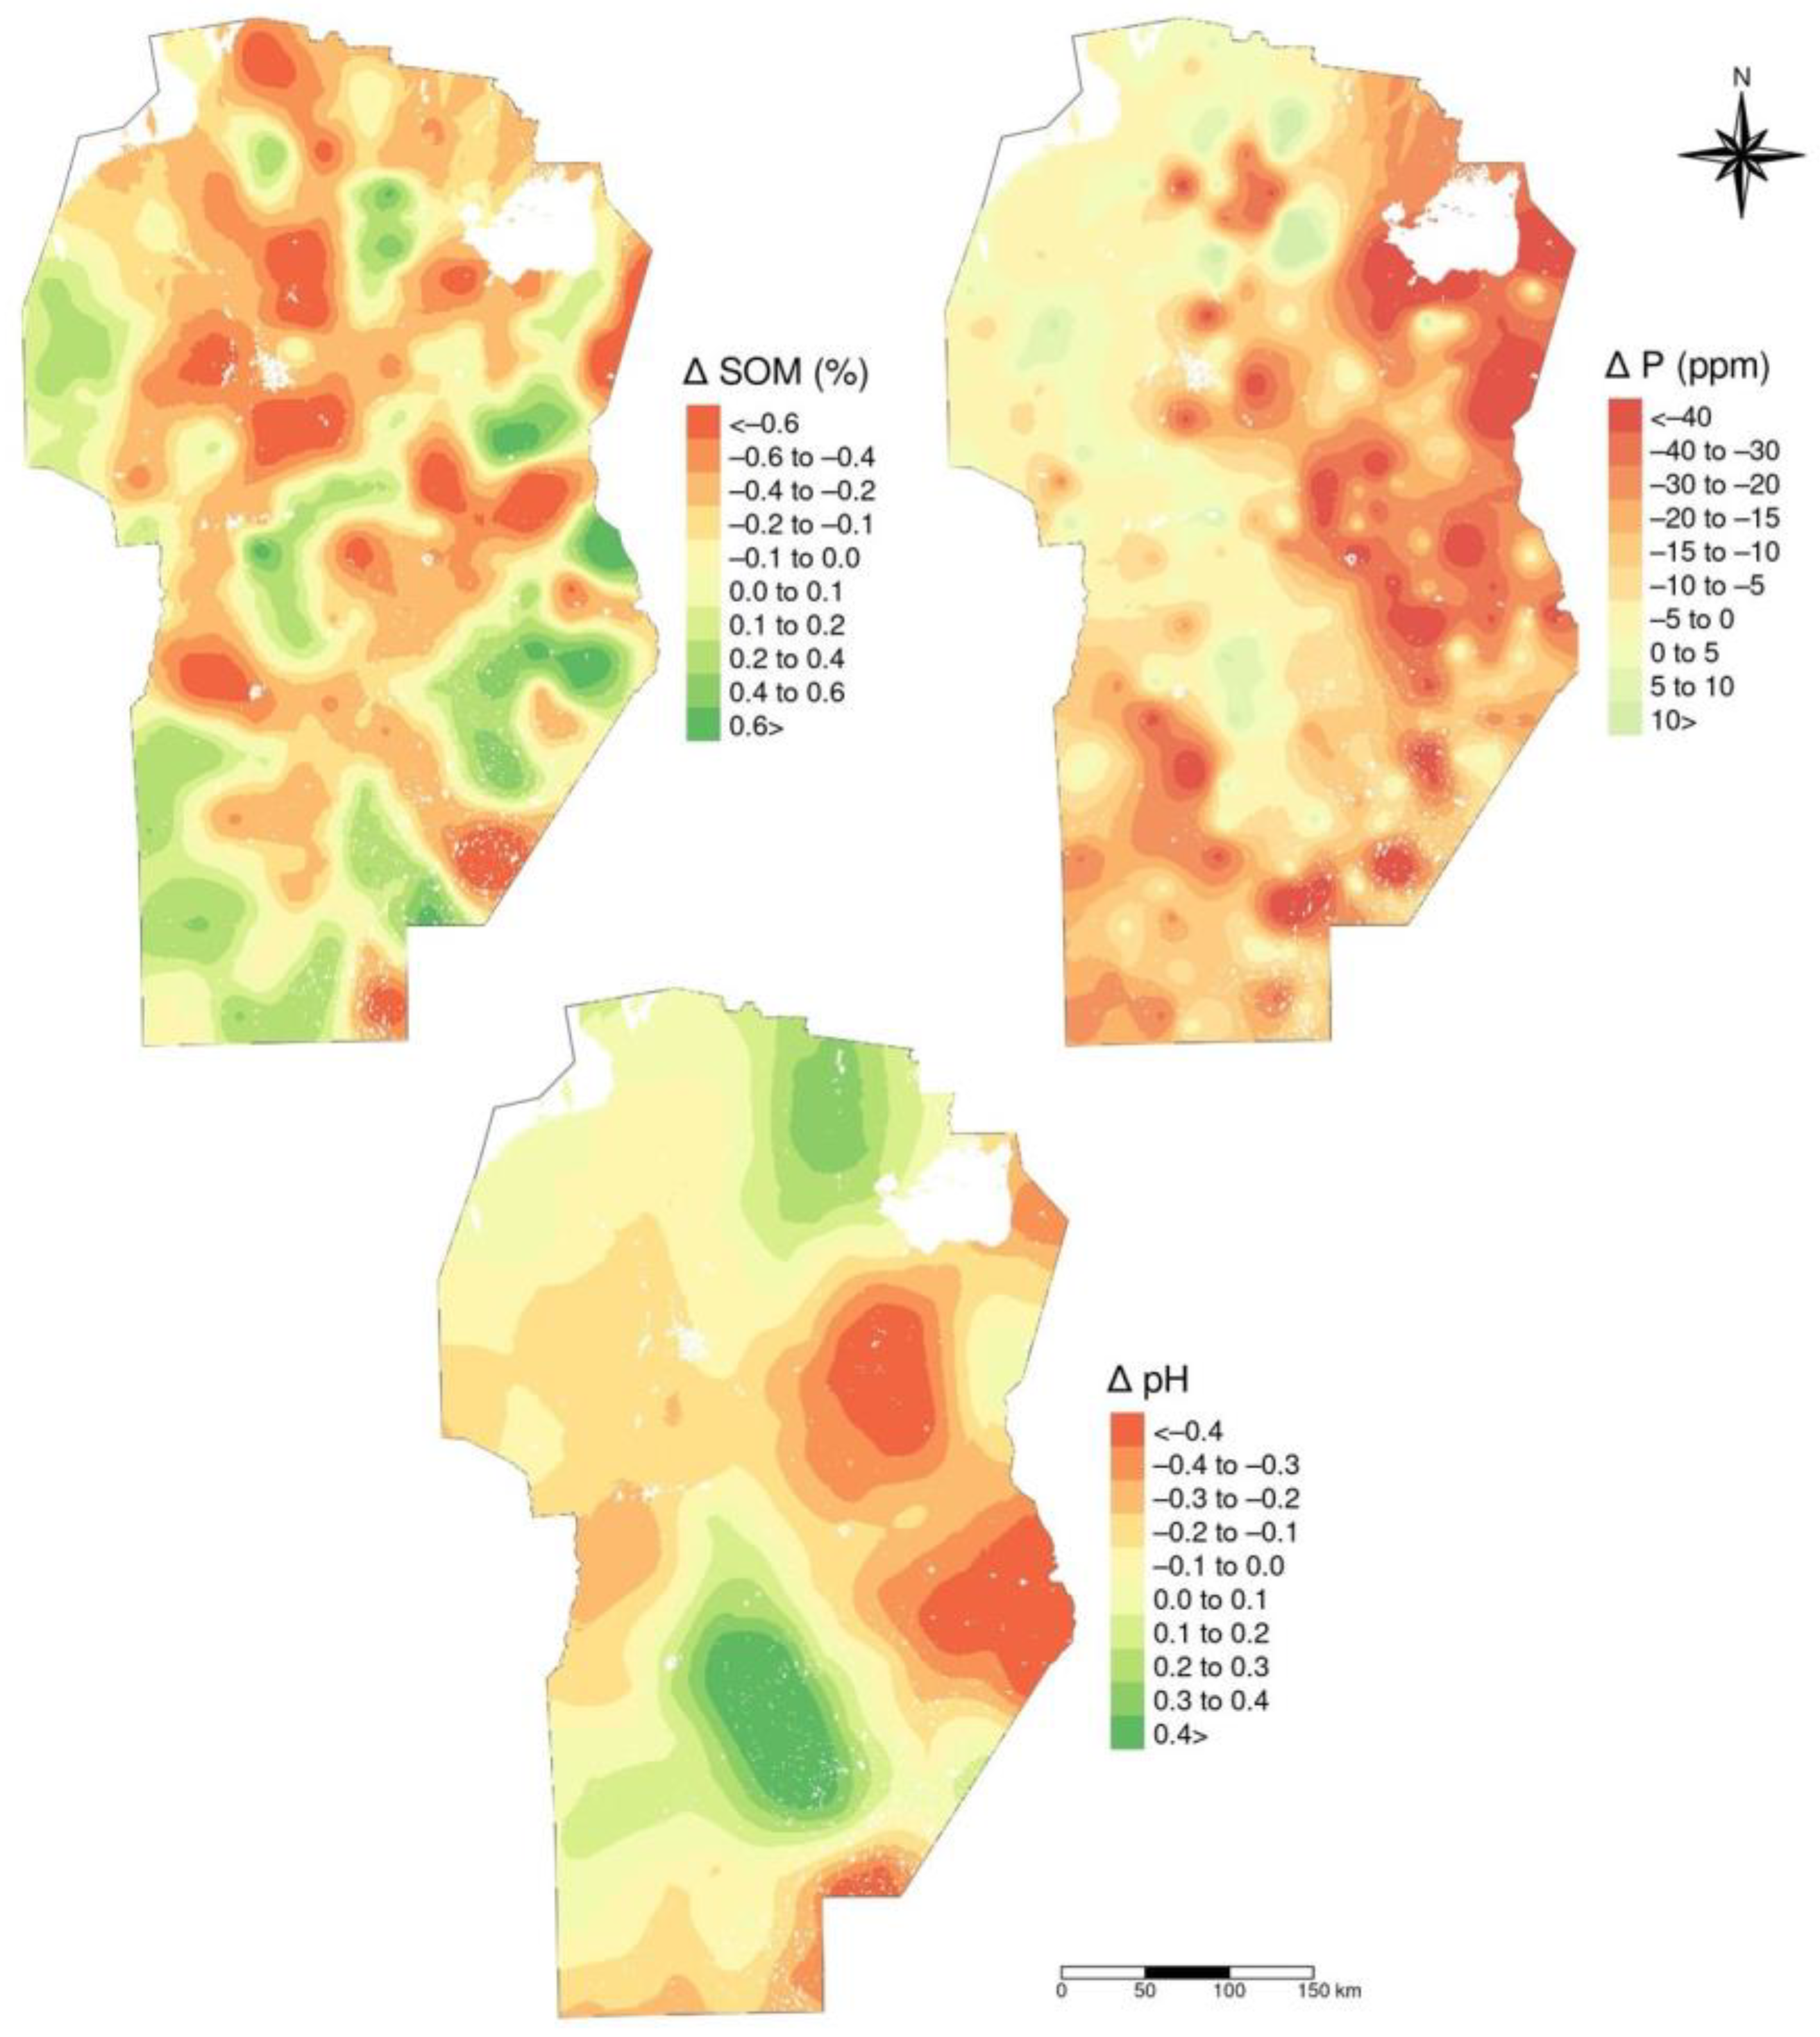
To assess changes in soil properties across land-use categories, we compared average values between 2013 and 2023 (Figure 7). In croplands, SOM declined from 2.24% to 2.09%, P from 35.6 to 23.0 ppm, and pH from 6.70 to 6.49; all three changes were statistically significant. In pastures, SOM decreased slightly from 2.27% to 2.20%, and pH increased from 6.60 to 6.71, but neither change was significant, whereas the decline in P from 35.3 to 26.3 ppm was significant. Forested areas exhibited stable SOM levels (3.05% in both years), a significant decline in P from 34.1 to 28.8 ppm, and a slight, non-significant decrease in pH from 7.15 to 7.00. These trends are further illustrated in the spatial distribution maps of changes in SOM, P, and pH across the province (Figure 8), which reveal heterogeneous spatial patterns, with more pronounced declines in SOM and P occurring in agricultural zones.

4. Discussion

Spatial predictions are primarily used to describe spatial patterns of soil property values at unsampled locations. As the foundation of DSM, spatial predictions capture the continuous nature of soils and account for random variation by modeling spatial correlations in soil properties, which often occur in the landscape. In recent years, several studies have adopted ML algorithms to obtain soil spatial predictions for large-scale DSM applications involving multiple correlated covariates [9,50,51]. DSM algorithms such as Random Forest (RF) or Neural Networks (NN) have been extensively applied in DSM [11]. However, simultaneous comparisons of models such as QRF, Cubist, and SVM remain uncommon—particularly across heterogeneous regions and when combined with temporal analyses of soil property changes.
The main contribution of this study is a comprehensive regional application of QRF, Cubist, and SVM. All evaluated methods showed high accuracy in predicting the spatial variability of soil properties, though each used a different optimal number of covariates. Selecting the best subset of variables for each model reduced processing time and could help mitigate the risk of overfitting caused by an abundance of predictors [11]. Our results suggest that QRF demonstrated superior predictive capacity, achieving the lowest RMSE values, with optimal performance often reached using fewer predictor variables than the other compared ML algorithms. For SVM, the RMSE pattern for SOM did not consistently decrease as more variables were included. This reflects the algorithm’s sensitivity to redundant covariates, whereby additional predictors did not necessarily enhance performance and sometimes destabilized model accuracy—a fluctuating behavior that has also been noted in studies using SVM-RFE for variable selection [52,53]. Although accuracy statistics for QRF and Cubist were similar and better than those for SVM, QRF consistently showed the best accuracy metrics (greater CCC and MEC, and smaller RMSE and MAE) for all the soil properties modeled. Furthermore, QRF was the only ML algorithm evaluated that provided an uncertainty measure associated with the derived predictions [17,54]. Our findings are in agreement with previous studies that have highlighted QRF suitability for soil spatial modeling and prediction [19,55].
Similarly to the work of Qu et al. [12], climate was identified as the main factor explaining the variability of soil properties. Long-term climatic conditions exerted the greatest influence on the formation and modification of spatial distribution patterns of SOM, P, and pH. For SOM, elevation was also important, as known differences exist between mountainous and plain areas. In Córdoba’s plains, where cropland dominates, climate largely explained SOM variability. The influence of vegetation on the spatial distribution of P was stronger than that of topography. Gupta et al. [56] found that NDVI measurements across seasons were important in explaining P variability. In alignment with Zeraatpisheh et al. [1], this analysis suggests a relatively high contribution of covariates related to vegetation cover in delineating the spatial distribution of SOM. This underscores the pivotal role of vegetation variables in shaping P and SOM distribution patterns. Similarly to findings by Falahatkar et al. [57], Taghizadeh-Mehrjardi et al. [58], and Zeraatpisheh et al. [1], our results suggest that remotely sensed vegetation variables are reliable predictors of SOM and P content. The individual contribution of each of the most important variables also varied according to the soil property evaluated. Regarding pH levels, the most important variable was PDQ_mean, which is consistent with the fact that pH was evaluated at a depth of 0–20 cm, and that the leaching of bases and salts occurs from the top down. Accordingly, wetter areas tended to exhibit lower pH levels, whereas drier areas showed higher pH. The results reinforce the differential impacts of climatic, vegetation, and topographic variables on the spatial distribution of soil properties, highlighting the importance of considering multiple environmental factors in DSM. The study of soil properties within Córdoba, central Argentina, reveals a complex interplay between climatic conditions, topography, and vegetation cover. Our study area was defined by the political boundaries of the province rather than by phytogeographic regions. In this context, the influence of climatic conditions on soil properties was prominent, while vegetation played a secondary role. The north–south mountain ranges significantly shape the regional climate, leading to distinct patterns in SOM distribution. Higher SOM levels were observed in mountainous areas (400 to 2790 m a.s.l.), likely due to the combination of lower temperatures and higher precipitation, which reduce decomposition rates. Notably, the high plateau (1900–2300 m a.s.l.) exhibited the lowest SOM values, primarily due to extensive rocky outcrops and grasslands. This is remarkable given that soils developed on granitic substrates and fine-textured eolian deposits generally have high SOM content [59,60,61]. Overall, vegetation indices, elevation, and precipitation-related variables emerged as particularly influential, underscoring their strong role in shaping the variability of SOM, P, and pH across the region. While the study already included a wide range of climatic, topographic, and vegetation covariates, additional covariates such as high-resolution remote sensing or management variables could further improve accuracy.
The SOM map further indicates an east-to-west gradient in daily minimum air temperature of the coldest month and potential evapotranspiration, especially over croplands and pastures. This gradient was disrupted by natural vegetation covers, where SOM levels are higher due to greater aggregate stability and physical protection, which reduces mineralization processes [62]. In the plain agricultural areas, SOM was generally lower and less stratified than natural covers. Land-use changes, particularly the conversion of large areas from native vegetation to no-till cropland or livestock areas, significantly impacted SOM levels [25], especially in the northern regions. Higher SOM values were observed in native forest remnants and along riverbanks, where land-use changes have been pronounced.
The P map shows lower P content in areas with a longer history of agricultural use, while areas under more recent cropland or livestock-related use had higher P levels. These trends were evident in the northwest, which is primarily used for grazing, and in the northeast, which is characterized by alfalfa pasture cultivation and dairy systems. Volcanic sediment in the parent material also contributed to P levels in the southern region of the province [63].
Soil pH varied with climate and elevation, with higher values observed in arid northwestern regions due to reduced leaching of salts and carbonates. Concave relief areas in the southwest, influenced by groundwater, exhibited alkaline soils associated with permanent and temporary water bodies. These soils are not used for agriculture and are covered by natural pastures. In contrast, soils with high SOM content tended to have an acidic pH, likely due to their history of use, where cash crop production has been associated with nitrogen fertilization and consequent decreases in pH [64]. However, Álvarez et al. [65] reported that cropland had minimal or even neutral effects in the Pampa region related to low pH, although they mention that recent proton balances and the absence of carbonates in part of the soil indicate an increasing risk of acidification in the future. In the northwest, the map showed higher pH values. In general, pH values above 8 were associated with poor drainage and sodium exchange >15%, which typically occur in specific areas near water bodies.
It is important to note that the diversity of climatic regions in the study area may obscure other effects, such as those induced by changes in land-use, which have also been reported in soil maps of other regions globally [66,67]. The three soil variables mapped in this study can be significantly influenced by management practices. Although vegetation cover indicates the type of land-use, the impact of different management practices on soil properties can vary substantially even within similar plant communities [24,68]. Another limitation concerns the representation of land-use. In this study, land-use was classified into a few broad categories (croplands, pastures, and forests) to harmonize datasets from multiple sources and to ensure adequate sample sizes within each class. While this simplification ensured consistency, it may obscure differences among specific cropping systems or management practices that also influence soil properties.
Several areas across all maps exhibited high uncertainty in the prediction of soil properties, highlighting important data gaps and underscoring the need for targeted future monitoring. A closer examination of the maps revealed that regions with lower sampling density or greater variability in soil characteristics showed reduced prediction certainty. This was particularly evident in zones covered by natural vegetation, where fewer samples were available compared to agricultural lands. Soils under long-term agricultural use generally presented more homogeneous conditions, whereas greater variability—especially in SOM—was observed in soils under natural vegetation cover [28].
The temporal trends observed for SOM, P, and pH between 2013 and 2023 indicate a depletion of soil fertility indicators across land-uses, particularly croplands and pastures. These trends suggest that both natural processes and management practices contributed to the evolution of soil conditions over time. In croplands, SOM declined by 6.7%, P by 35.4%, and pH decreased moderately. In pastures, SOM and P also decreased, while pH increased slightly. Forested areas remained relatively stable in SOM but still showed a moderate decline in P and a slight drop in pH. The general decline in P aligned with long-term nutrient removal through crop harvesting and potential reductions in fertilization rates [69]. In the Argentine Pampas, a trend toward agricultural system simplification has favored soybean as the predominant crop, influencing P fertilization practices [70]. However, recent studies indicate that current fertilization strategies are generally insufficient to offset the high rates of P exports, particularly in soybean-based systems [23,71]. SOM content showed less temporal variability in forested ecosystems than in agricultural and pasture systems. The latter were especially susceptible to SOM decline, highlighting the importance of sustainable management practices to preserve soil quality. These findings are consistent with previous research showing that land-use changes and intensive agricultural practices often lead to the depletion of soil nutrients and organic matter [2,24,72]. This trend underscores the need to monitor nutrient mining under intensive production systems and to integrate land-use history into DSM.
The spatial and temporal patterns observed should also be interpreted in the context of local conditions. Climate and topography emerged as the main drivers, but soil types, cropping systems dominated by soybean, and limited fertilization practices further influenced the variability of SOM, P, and pH. Beyond these local drivers, methodological considerations must also be taken into account. The comparison between 2013 observed values and 2023 predictions was designed to span a ten-year interval, reflecting the temporal scale at which land-use and management practices are expected to produce measurable changes in soil properties [72]. This timeframe was constrained by data availability, as 2013 corresponds to the most recent soil survey campaign with sufficient coverage for comparison. Moreover, this decade coincided with significant land-use intensification in Córdoba province, where the expansion of croplands over natural and semi-natural areas has been reported [73], providing a relevant context for assessing impacts on soil resources. Nevertheless, the comparison of observed and predicted values may introduce bias. While uncertainty in the 2023 predictions was quantified through QRF-derived standard deviations, the results should be interpreted as indicative of broad trends rather than precise point-level changes. Incorporating uncertainty propagation analysis [74] would further strengthen temporal assessments by accounting for how prediction uncertainties affect subsequent analyses.
The pursuit of high agricultural yields within the context of sustainable practices depends on the application of scientific and technological principles to facilitate responsible land management. A central aspect of this management paradigm is fertility diagnosis, with soil analysis serving as the foundational step for precise assessment. In this regard, the detailed characterization provided by maps depicting SOM, extractable P, and soil pH underscore the importance of DSM in supporting fertility evaluation and guiding management decisions. The integration of digitally generated information with traditional soil surveys enhances the effectiveness of land management strategies by providing spatially explicit, data-driven insights. In this study, the combined use of RFE and established ML algorithms was applied across Córdoba province, a region of high agricultural importance and environmental heterogeneity. This comprehensive regional application demonstrates the practical value of DSM tools for monitoring soil changes and guiding sustainable land-use decisions in complex agroecosystems.
Beyond scientific insights, our findings also align with policy frameworks for sustainable soil management in Argentina. At the provincial level, Córdoba’s Good Agricultural Practices (BPA) program emphasizes soil testing, nutrient budgeting, and conservation practices. The observed declines in P and SOM highlight areas where these practices are most urgently needed, while uncertainty maps identify zones that require additional monitoring. These insights complement national soil conservation guidelines, particularly those focused on nutrient balance and the maintenance of SOM [75]. More broadly, they contribute to sustainability agendas by providing regionally specific evidence of soil fertility trends under land-use intensification.

5. Conclusions

This study assessed the spatial variability and temporal changes in key soil properties—soil organic matter (SOM), extractable phosphorus (P), and pH—in central Argentina, applying advanced machine learning algorithms within a digital soil mapping (DSM) framework. The high-resolution prediction maps revealed complex distribution patterns, primarily shaped by climate, topography, and vegetation. Among the algorithms tested, Quantile Regression Forest (QRF) consistently outperformed Cubist and SVM, providing not only higher predictive accuracy but also valuable estimates of prediction uncertainty, underscoring its suitability for DSM in heterogeneous landscapes. The temporal analysis over a 10-year period highlighted a general decline in soil fertility indicators, particularly extractable phosphorus in croplands. Overall, the integration of high-precision predictive models with uncertainty quantification provides a robust foundation for continuous soil monitoring, the development of improved management strategies, and sustainable land-use planning in one of Argentina’s most important agricultural regions.

Author Contributions

Conceptualization, methodology, software, validation, formal analysis, investigation, resources, data curation, writing—original draft preparation, writing—review and editing, visualization, supervision, project administration, funding acquisition, M.A.C.; data curation and writing—original draft preparation, S.B.H., C.B., C.A., L.F., E.K. and M.V.V.; data curation, M.D.B.; writing—review and editing, supervision, project administration, funding acquisition, M.G.B. All authors have read and agreed to the published version of the manuscript.

Funding

This research was partially funded by the Argentine National Scientific and Technological Promotion Agency (ANPCyT-PICT 2021-0682), the National Scientific and Technical Research Council (CONICET), and the Secretariat for Science and Technology of the National University of Córdoba (UNC). The APC was not funded.

Institutional Review Board Statement

Not applicable.

Informed Consent Statement

Not applicable.

Data Availability Statement

The data presented in this study are available upon request from the corresponding author.

Acknowledgments

We acknowledge the National Institute of Agricultural Technology (INTA) and the Ministry of Bioagroindustry for providing data from the Good Agricultural Practices (BPA) program and the Soil Mapping Plan, through the Soil Laboratory at INTA EEA Manfredi, Córdoba. We also thank the technical staff of Experta AGD, HAB, Orbely, RAVIT, and Seiker for their valuable support in soil data collection.

Conflicts of Interest

The authors declare no conflicts of interest.

Abbreviations

The following abbreviations are used in this manuscript:
AIartificial intelligence
ANNartificial neural networks
CCCLin’s Concordance Correlation Coefficient
CVcoefficient of variation
DLdeep learning
DSMdigital soil mapping
ETP_rangeannual range of monthly potential evapotranspiration
fPARfraction of photosynthetically active radiation absorbed by vegetation
LSTland surface temperature
LST_120102mean land surface temperature from December to February
MAEmean absolute error
MECmodeling efficiency coefficient
MLmachine learning
NDVInormalized vegetation index
Pextractable phosphorus
PDQ_meanmean monthly precipitation amount of the driest quarter
PDMprecipitation amount of the driest month
QRFquantile regression forest
RFrandom forest
RTregression Tree
RFErecursive feature elimination
RMSEroot mean square error
SDstandard deviation
SVMSupport Vector Machine
SOCsoil organic carbon
SOMsoil organic matter
SWIRshortwave infrared
TCM_minmean daily minimum air temperature of the coldest month
T_meanmean annual air temperature

References

  1. Zeraatpisheh, M.; Ayoubi, S.; Jafari, A.; Tajik, S.; Finke, P. Digital Mapping of Soil Properties Using Multiple Machine Learning in a Semi-Arid Region, Central Iran. Geoderma 2019, 338, 445–452. [Google Scholar] [CrossRef]
  2. Wang, Q.; Le Noë, J.; Li, Q.; Lan, T.; Gao, X.; Deng, O.; Li, Y. Incorporating Agricultural Practices in Digital Mapping Improves Prediction of Cropland Soil Organic Carbon Content: The Case of the Tuojiang River Basin. J. Environ. Manag. 2023, 330, 117203. [Google Scholar] [CrossRef]
  3. Läuchli, A.; Grattan, S.R. Plant Stress under Non-Optimal Soil PH. In Plant Stress Physiology; CABI: Oxfordshire, UK, 2017; pp. 201–216. [Google Scholar]
  4. Khan, F.; Siddique, A.B.; Shabala, S.; Zhou, M.; Zhao, C. Phosphorus Plays Key Roles in Regulating Plants’ Physiological Responses to Abiotic Stresses. Plants 2023, 12, 2861. [Google Scholar] [CrossRef]
  5. Hart, M.R.; Quin, B.F.; Nguyen, M.L. Phosphorus Runoff from Agricultural Land and Direct Fertilizer Effects: A Review. J. Environ. Qual. 2004, 33, 1954–1972. [Google Scholar] [CrossRef]
  6. Wadoux, A.M.J.C.; Minasny, B.; McBratney, A.B. Machine Learning for Digital Soil Mapping: Applications, Challenges and Suggested Solutions. Earth Sci. Rev. 2020, 210, 103359. [Google Scholar] [CrossRef]
  7. Akkem, Y.; Biswas, S.K.; Varanasi, A. Smart Farming Using Artificial Intelligence: A Review. Eng. Appl. Artif. Intell. 2023, 120, 105899. [Google Scholar] [CrossRef]
  8. Minasny, B.; McBratney, A.B. Digital Soil Mapping: A Brief History and Some Lessons. Geoderma 2016, 264, 301–311. [Google Scholar] [CrossRef]
  9. Gomes, L.C.; Faria, R.M.; de Souza, E.; Veloso, G.V.; Schaefer, C.E.G.R.; Filho, E.I.F. Modelling and Mapping Soil Organic Carbon Stocks in Brazil. Geoderma 2019, 340, 337–350. [Google Scholar] [CrossRef]
  10. McBratney, A.B.; Mendonça Santos, M.L.; Minasny, B. On Digital Soil Mapping. Geoderma 2003, 117, 3–52. [Google Scholar] [CrossRef]
  11. Khaledian, Y.; Miller, B.A. Selecting Appropriate Machine Learning Methods for Digital Soil Mapping. Appl. Math. Model. 2020, 81, 401–418. [Google Scholar] [CrossRef]
  12. Qu, L.; Lu, H.; Tian, Z.; Schoorl, J.M.; Huang, B.; Liang, Y.; Qiu, D.; Liang, Y. Spatial Prediction of Soil Sand Content at Various Sampling Density Based on Geostatistical and Machine Learning Algorithms in Plain Areas. Catena 2024, 234, 107572. [Google Scholar] [CrossRef]
  13. Quinlan, J.R. Combining Instance-Based and Model-Based Learning. In Machine Learning Proceedings 1993; Elsevier: Amsterdam, The Netherlands, 1993; pp. 236–243. [Google Scholar]
  14. Breiman, L. Random Forests. Mach. Learn. 2001, 45, 5–32. [Google Scholar] [CrossRef]
  15. Meinshausen, N. Quantile Regression Forests. J. Mach. Learn. Res. 2006, 7, 983–999. [Google Scholar]
  16. Drucker, H.; Burges, C.J.; Kaufman, L.; Smola, A.; Vapnik, V. Support Vector Regression Machines. Adv. Neural Inf. Process Syst. 1997, 9, 155–161. [Google Scholar]
  17. Vaysse, K.; Lagacherie, P. Using Quantile Regression Forest to Estimate Uncertainty of Digital Soil Mapping Products. Geoderma 2017, 291, 55–64. [Google Scholar] [CrossRef]
  18. Diks, C.G.H.; Vrugt, J.A. Comparison of Point Forecast Accuracy of Model Averaging Methods in Hydrologic Applications. Stoch. Environ. Res. Risk Assess. 2010, 24, 809–820. [Google Scholar] [CrossRef]
  19. Baltensweiler, A.; Walthert, L.; Hanewinkel, M.; Zimmermann, S.; Nussbaum, M. Machine Learning Based Soil Maps for a Wide Range of Soil Properties for the Forested Area of Switzerland. Geoderma Reg. 2021, 27, e00437. [Google Scholar] [CrossRef]
  20. Parvizi, Y.; Fatehi, S. Geospatial Digital Mapping of Soil Organic Carbon Using Machine Learning and Geostatistical Methods in Different Land Uses. Sci. Rep. 2025, 15, 4449. [Google Scholar] [CrossRef]
  21. Bulmer, C.; Paré, D.; Domke, G.M. A New Era of Digital Soil Mapping across Forested Landscapes. In Developments in Soil Science; Elsevier: Amsterdam, The Netherlands, 2019; pp. 345–371. [Google Scholar]
  22. Lal, R. Managing Soils for Resolving the Conflict between Agriculture and Nature: The Hard Talk. Eur. J. Soil Sci. 2020, 71, 1–9. [Google Scholar] [CrossRef]
  23. Koritschoner, J.J.; Whitworth Hulse, J.I.; Cuchietti, A.; Arrieta, E.M. Spatial Patterns of Nutrients Balance of Major Crops in Argentina. Sci. Total Environ. 2023, 858, 159863. [Google Scholar] [CrossRef] [PubMed]
  24. Guo, L.B.; Gifford, R.M. Soil Carbon Stocks and Land Use Change: A Meta Analysis. Glob. Change Biol. 2002, 8, 345–360. [Google Scholar] [CrossRef]
  25. Apezteguia, H.; Izaurralde, R.; Sereno, R. Simulation Study of Soil Organic Matter Dynamics as Affected by Land Use and Agricultural Practices in Semiarid Córdoba, Argentina. Soil Tillage Res. 2009, 102, 101–108. [Google Scholar] [CrossRef]
  26. Soil Survey Staff. Keys to Soil Taxonomy, 13th ed.; USDA Natural Resources Conservation Service: Washington, DC, USA, 2022.
  27. Jarsún, B.; Gorgas, J.; Zamora, E.; Bosnero, H.; Lovera, E.; Ravelo, A.; Tassile, J. Los Suelos de Córdoba; Agencia Córdoba Ambiente e Instituto Nacional de Tecnología Agropecuaria, EEA Manfredi: Córdoba, Argentina, 2006. [Google Scholar]
  28. Bozzer, C. Cambios de Uso y Degradacion de Los Suelos En La Pampa Medanosa Cordobesa: Evolucion Impactos y Escenarios Futuros. Ph.D. Thesis, Universidad Nacional de Río Cuarto, Córdoba, Argentina, Universidad Federal Rural Do Rio de Janeiro, Rio de Janeiro, Brazil, 2021. [Google Scholar]
  29. Bongiovanni, M.D. Contenido de Carbono Orgánico En Relación al Uso de Suelos Pertenecientes a Las Cuencas Del Rio Cuarto y Arroyos Menores Del Sur de Córdoba: Establecimiento de Un Modelo Descriptivo Simple de Balance de Carbono. Ph.D. Thesis, Universidad Nacional del sur, Bahía Blanca, Argentina, 2022. [Google Scholar]
  30. Malone, B.P.; McBratney, A.B.; Minasny, B.; Laslett, G.M. Mapping Continuous Depth Functions of Soil Carbon Storage and Available Water Capacity. Geoderma 2009, 154, 138–152. [Google Scholar] [CrossRef]
  31. Bray, R.; Kurtz, L. Determination of Total, Organic and Available Form of Phosphorus in Soil. Soil. Sci. 1945, 59, 360–361. [Google Scholar] [CrossRef]
  32. Walkley, A.J.; Black, I.A. Estimation of Soil Organic Carbon by the Chromic Acid Titration Method. Soil. Sci. 1934, 47, 29–38. [Google Scholar] [CrossRef]
  33. Karger, D.N.; Wilson, A.M.; Mahony, C.; Zimmermann, N.E.; Jetz, W. Global Daily 1 km Land Surface Precipitation Based on Cloud Cover-Informed Downscaling. Sci. Data 2021, 8, 307. [Google Scholar] [CrossRef]
  34. Allen, R.G.; Pereira, L.S.; Raes, D.; Smith, M. Crop Evapotranspiration—Guidelines for Computing Crop Water Requirements—FAO Irrigation and Drainage Paper 56; FAO: Rome, Italy, 1998; Volume 56. [Google Scholar]
  35. Myneni, R.; Knyazikhin, Y.; Park, T. MODIS/Terra Leaf Area Index/FPAR 8-Day L4 Global 500m SIN Grid V061; NASA EOSDIS Land Processes Distributed Active Archive Center (DAAC): Sioux Falls, SD, USA, 2021.
  36. Amatulli, G.; McInerney, D.; Sethi, T.; Strobl, P.; Domisch, S. Geomorpho90m, Empirical Evaluation and Accuracy Assessment of Global High-Resolution Geomorphometric Layers. Sci. Data 2020, 7, 162. [Google Scholar] [CrossRef]
  37. Keys, R. Cubic Convolution Interpolation for Digital Image Processing. IEEE Trans. Acoust. 1981, 29, 1153–1160. [Google Scholar] [CrossRef]
  38. Gorelick, N.; Hancher, M.; Dixon, M.; Ilyushchenko, S.; Thau, D.; Moore, R. Google Earth Engine: Planetary-Scale Geospatial Analysis for Everyone. Remote Sens. Environ. 2017, 202, 18–27. [Google Scholar] [CrossRef]
  39. Kuhn, M.; Johnson, K. An Introduction to Feature Selection. In Applied Predictive Modeling; Springer: New York, NY, USA, 2013; pp. 487–519. [Google Scholar]
  40. Hastie, T.; Tibshirani, R.; Friedman, J. The Elements of Statistical Learning; Springer: New York, NY, USA, 2009; ISBN 978-0-387-84857-0. [Google Scholar]
  41. Kuhn, M. Building Predictive Models in R Using the Caret Package. J. Stat. Softw. 2008, 28, 1–26. [Google Scholar] [CrossRef]
  42. Breiman, L. Manual on Setting Up, Using, and Understanding Random Forests v3.1; University of California Berkeley: Berkeley, CA, USA, 2002. [Google Scholar]
  43. Tehrany, M.S.; Pradhan, B.; Mansor, S.; Ahmad, N. Flood Susceptibility Assessment Using GIS-Based Support Vector Machine Model with Different Kernel Types. Catena 2015, 125, 91–101. [Google Scholar] [CrossRef]
  44. Janssen, P.H.M.; Heuberger, P.S.C. Calibration of Process-Oriented Models. Ecol. Modell. 1995, 83, 55–66. [Google Scholar] [CrossRef]
  45. Altmann, A.; Toloşi, L.; Sander, O.; Lengauer, T. Permutation Importance: A Corrected Feature Importance Measure. Bioinformatics 2010, 26, 1340–1347. [Google Scholar] [CrossRef] [PubMed]
  46. Strobl, C.; Boulesteix, A.-L.; Kneib, T.; Augustin, T.; Zeileis, A. Conditional Variable Importance for Random Forests. BMC Bioinform. 2008, 9, 307. [Google Scholar] [CrossRef]
  47. Hang, S.B.; Negro, G.J.; Becerra, M.A.; Rampoldi, E.A. Suelos de Córdoba: Variabilidad de Las Propiedades Del Horizonte Superficial; The National University of Córdoba: Córdoba, Argentina, 2015. [Google Scholar]
  48. IDECOR. Mapa de Cobertura y Uso de Suelo de La Provincia de Córdoba 2022–2023; IDECOR: Córdoba, Argentina, 2023. [Google Scholar]
  49. Córdoba, M.; Paccioretti, P.; Balzarini, M. A New Method to Compare Treatments in Unreplicated On-Farm Experimentation. Precis. Agric. 2025, 26, 4. [Google Scholar] [CrossRef]
  50. Hengl, T.; Leenaars, J.G.B.; Shepherd, K.D.; Walsh, M.G.; Heuvelink, G.B.M.; Mamo, T.; Tilahun, H.; Berkhout, E.; Cooper, M.; Fegraus, E.; et al. Soil Nutrient Maps of Sub-Saharan Africa: Assessment of Soil Nutrient Content at 250 m Spatial Resolution Using Machine Learning. Nutr. Cycl. Agroecosyst 2017, 109, 77–102. [Google Scholar] [CrossRef]
  51. FAO. Country Guidelines and Technical Specifications for Global Soil Nutrient and Nutrient Budget Maps; FAO: Rome, Italy, 2022; ISBN 978-92-5-136795-7. [Google Scholar]
  52. Guo, J.; Wang, K.; Jin, S. Mapping of Soil PH Based on SVM-RFE Feature Selection Algorithm. Agronomy 2022, 12, 2742. [Google Scholar] [CrossRef]
  53. McKearnan, S.B.; Vock, D.M.; Marai, G.E.; Canahuate, G.; Fuller, C.D.; Wolfson, J. Feature Selection for Support Vector Regression Using a Genetic Algorithm. Biostatistics 2023, 24, 295–308. [Google Scholar] [CrossRef]
  54. Veronesi, F.; Schillaci, C. Comparison between Geostatistical and Machine Learning Models as Predictors of Topsoil Organic Carbon with a Focus on Local Uncertainty Estimation. Ecol. Indic. 2019, 101, 1032–1044. [Google Scholar] [CrossRef]
  55. Schmidinger, J.; Heuvelink, G.B.M. Validation of Uncertainty Predictions in Digital Soil Mapping. Geoderma 2023, 437, 116585. [Google Scholar] [CrossRef]
  56. Gupta, S.; Hasler, J.K.; Alewell, C. Mining Soil Data of Switzerland: New Maps for Soil Texture, Soil Organic Carbon, Nitrogen, and Phosphorus. Geoderma Reg. 2024, 36, e00747. [Google Scholar] [CrossRef]
  57. Falahatkar, S.; Hosseini, S.M.; Ayoubi, S.; Salmanmahiny, A. Predicting Soil Organic Carbon Density Using Auxiliary Environmental Variables in Northern Iran. Arch. Agron. Soil. Sci. 2016, 62, 375–393. [Google Scholar] [CrossRef]
  58. Taghizadeh-Mehrjardi, R.; Nabiollahi, K.; Kerry, R. Digital Mapping of Soil Organic Carbon at Multiple Depths Using Different Data Mining Techniques in Baneh Region, Iran. Geoderma 2016, 266, 98–110. [Google Scholar] [CrossRef]
  59. Vaieretti, M.V.; Conti, G.; Poca, M.; Kowaljow, E.; Gorné, L.; Bertone, G.; Cingolani, A.M.; Pérez-Harguindeguy, N. Plant and Soil Carbon Stocks in Grassland Patches Maintained by Extensive Grazing in the Highlands of Central Argentina. Austral Ecol. 2021, 46, 374–386. [Google Scholar] [CrossRef]
  60. Fernández-Catinot, F.; Pestoni, S.; Gallardo, N.; Vaieretti, M.V.; Pérez Harguindeguy, N. No Detectable Upper Limit When Predicting Soil Mineral-Associated Organic Carbon Stabilization Capacity in Temperate Grassland of Central Argentina Mountains. Geoderma Reg. 2023, 35, e00722. [Google Scholar] [CrossRef]
  61. Cabido, M.; Breimer, R.; Vega, G. Plant Communities and Associated Soil Types in a High Plateau of the Cordoba Mountains, Central Argentina. Mt. Res. Dev. 1987, 7, 25. [Google Scholar] [CrossRef]
  62. Koritschoner, J.; Giannini Kurina, F.; Hang, S.; Balzarini, M. Site-Specific Modelling of Short-Term Soil Carbon Mineralization in Central Argentina. Geoderma 2022, 406, 115487. [Google Scholar] [CrossRef]
  63. Bongiovanni, M.D.; Marzari, R.; Ron, M. Fósforo Disponible En Suelos Agrícolas Del Sur de Córdoba y Sudeste de San Luis. In Proceedings of the XXII Congreso Argentino de la Ciencia del Suelo, Rosario, Argentina, 31 May–4 June 2010. [Google Scholar]
  64. Ortiz, J.; Faggioli, V.S.; Ghio, H.; Boccolini, M.F.; Ioele, J.P.; Tamburrini, P.; Garcia, F.; Gudelj, V. Impacto a Largo Plazo de La Fertilización Sobre La Estructura y Funcionalidad de La Comunidad Microbiana Del Suelo. Cienc. Suelo 2020, 38, 45–55. [Google Scholar]
  65. Alvarez, R.; Gimenez, A.; Pagnanini, F.; Recondo, V.; Gangi, D.; Caffaro, M.; De Paepe, J.L.; Berhongaray, G. Soil Acidity in the Argentine Pampas: Effects of Land Use and Management. Soil Tillage Res. 2020, 196, 104434. [Google Scholar] [CrossRef]
  66. Liu, H.; Yin, Y.; Tian, Y.; Ren, J.; Wang, H. Climatic and Anthropogenic Controls of Topsoil Features in the Semi-arid East Asian Steppe. Geophys. Res. Lett. 2008, 35, L04401. [Google Scholar] [CrossRef]
  67. Wei, J.-B.; Xiao, D.-N.; Zeng, H.; Fu, Y.-K. Spatial Variability of Soil Properties in Relation to Land Use and Topography in a Typical Small Watershed of the Black Soil Region, Northeastern China. Environ. Geol. 2008, 53, 1663–1672. [Google Scholar] [CrossRef]
  68. Liu, F.; Zhang, G.-L.; Sun, Y.-J.; Zhao, Y.-G.; Li, D.-C. Mapping the Three-Dimensional Distribution of Soil Organic Matter across a Subtropical Hilly Landscape. Soil Sci. Soc. Am. J. 2013, 77, 1241–1253. [Google Scholar] [CrossRef]
  69. Penuelas, J.; Coello, F.; Sardans, J. A Better Use of Fertilizers Is Needed for Global Food Security and Environmental Sustainability. Agric. Food Secur. 2023, 12, 5. [Google Scholar] [CrossRef]
  70. Cabrini, S.M.; Portela, S.I.; Cano, P.B.; López, D.A. Heterogeneity in Agricultural Land Use Decisions in Argentine Rolling Pampas: The Effects on Environmental and Economic Indicators. Cogent Environ. Sci. 2019, 5, 1667709. [Google Scholar] [CrossRef]
  71. Portela, S.I.; Reixachs, C.; Torti, M.J.; Beribe, M.J.; Giannini, A.P. Contrasting Effects of Soil Type and Use of Cover Crops on Nitrogen and Phosphorus Leaching in Agricultural Systems of the Argentinean Pampas. Agric. Ecosyst. Environ. 2024, 364, 108897. [Google Scholar] [CrossRef]
  72. Kebebew, S.; Bedadi, B.; Erkossa, T.; Yimer, F.; Wogi, L. Effect of Different Land-Use Types on Soil Properties in Cheha District, South-Central Ethiopia. Sustainability 2022, 14, 1323. [Google Scholar] [CrossRef]
  73. De la Casa, A.; Ovando, G.; Díaz, G.; Díaz, P.; Soler, F.; Clemente, J.P. Assessment of Land Use Change in the Dryland Agricultural Region of Córdoba, Argentina, between 2000 and 2020 Based on NDVI Data. AgriScientia 2024, 41, 27–43. [Google Scholar] [CrossRef]
  74. Heuvelink, G.B.M. Uncertainty and Uncertainty Propagation in Soil Mapping and Modelling. In Pedometrics; Springer: Cham, Switzerland, 2018; pp. 439–461. [Google Scholar]
  75. Sainz Rozas, H.; Reussi Calvo, N.; Wyngaard, N.; Eyherabide, M.; Angelini, H.; Larrea, G.; Garello, F.; Avila Manotoba, O.; Orcellet, J.; González San Juan, F.; et al. Impacto de la Agricultura Sobre la Fertilidad de los Suelos de la Región Pampeana Argentina. In Proceedings of the Simposio Fertilidad 2025, Ferilizar Asociación Civil, Buenos Aires, Argentina, 7 May 2025; p. 3. [Google Scholar]
Figure 1. Study area in Argentina and distribution of sampling points (n = 7000) used for DSM.
Soilsystems 09 00109 g001
Figure 2. Schematic workflow of the digital soil mapping process applied in this study. Soil data for SOM, P, and pH were harmonized to a 0–20 cm depth and combined with environmental covariates to build the final database. Variable selection was performed using Recursive Feature Elimination (RFE) with 10-fold cross-validation (Step 1). Machine learning models—Quantile Regression Forest (QRF), Cubist, and Support Vector Machine (SVM)—were then trained and evaluated using 10-fold cross-validation (Step 2). The best-performing model was selected based on error metrics (MAE, RMSE) and agreement metrics (CCC, MEC). QRF was used to generate prediction maps and uncertainty maps, expressed as standard deviation (SD).
Soilsystems 09 00109 g002
Figure 3. Model performance (as root mean square error, RMSE) for each soil property predicted according to the number of predictors selected by the recursive feature elimination procedure for three ML algorithms: Cubist, Quantile Regression Forest (QRF), and Support Vector Machine (SVM). SOM, soil organic matter; P, extractable phosphorus.
Soilsystems 09 00109 g003
Figure 4. Scatter plots of observed versus predicted values for soil organic matter (SOM), extractable phosphorus (P), and pH using Quantile Regression Forest (QRF), Cubist, and Support Vector Machine (SVM). The 1:1 line is shown for reference.
Soilsystems 09 00109 g004
Figure 5. Relative importance of covariates for modeling soil organic matter (SOM), extractable phosphorus (P), and pH using a Quantile Regression Forest (QRF). The x-axis indicates the percentage of response variability explained by each covariate. The covariates shown collectively account for 60% of the total variability. Dev_Mag, maximum deviation from mean elevation; ETP_max, maximum monthly potential evapotranspiration; ETP_min, minimum monthly potential evapotranspiration; ETP_range, annual range of monthly potential evapotranspiration; LST_120102, mean land surface temperature from December to February; LST_091011, land surface temperature from September to November; NDVIsd_120102, standard deviation of normalized vegetation index from December to February; PDM, precipitation amount of the driest month; PDQ_mean, mean monthly precipitation amount of the driest quarter; PWQmean, mean monthly precipitation amount of the wettest quarter; PWM, precipitation amount of the wettest month; Rough_Mag, multiscale roughness variation; TCM_min, daily minimum air temperature of the coldest month; T_mean, mean annual air temperature; TWM_max, mean daily maximum air temperature of the warmest month.
Soilsystems 09 00109 g005
Figure 6. Predicted (left) and uncertainty (right) maps of soil organic matter (SOM), extractable phosphorus (P), and pH, for Córdoba province, central Argentina (0–20 cm depth). Uncertainty corresponds to the standard deviation (SD) of QRF predictions.
Soilsystems 09 00109 g006
Figure 7. Temporal variation in soil organic matter (SOM), extractable phosphorus (P), and pH across different land-use categories (Cropland, Forest, and Pasture) in Córdoba province. Asterisks indicate significant differences between years (p < 0.05), while “ns” denotes non-significant differences.
Soilsystems 09 00109 g007
Figure 8. Spatial distribution of changes in soil organic matter (SOM), extractable phosphorus (P), and pH between 2013 and 2023 across Córdoba province. Changes are calculated as the difference between 2023 and 2013 values (2023 minus 2013). Positive values indicate increases, while negative values represent decreases over the 10-year period.
Soilsystems 09 00109 g008
Table 1. Mean, coefficient of variation (CV), minimum value (Min), maximum value (Max), and 5th and 95th percentiles (P(05) and P(95)) for soil variables across Córdoba province, central Argentina (n = 7000 data points).
VariableMeanCVMin.Max.P(05)P(95)
SOM (%)2.19500.1013.201.003.56
P (ppm)26.54850.05152.005.6872.19
pH6.53104.1011.005.707.71
P, extractable phosphorus; SOM, soil organic matter.
Table 2. Mean absolute error (MAE), root mean square error (RMSE), Lin’s Concordance Correlation Coefficient (CCC) and modeling efficiency coefficient (MEC) of 10-fold cross-validation for digital soil mapping of three soil properties.
VariableML MethodMAERMSECCCMEC
SOMQRF0.3800.5810.8460.715
Cubist0.3880.5930.8380.702
SVM0.4370.6780.7860.611
PQRF9.71515.1970.7430.551
Cubist9.76915.4860.7320.534
SVM10.25116.8460.6790.448
pHQRF0.2980.4440.7430.552
Cubist0.3040.4510.7340.537
SVM0.3240.4780.6950.479
P, extractable phosphorus; QRF, Quantile Regression Forest; SOM, Soil organic matter; SVM, Support Vector Machine.
Disclaimer/Publisher’s Note: The statements, opinions and data contained in all publications are solely those of the individual author(s) and contributor(s) and not of MDPI and/or the editor(s). MDPI and/or the editor(s) disclaim responsibility for any injury to people or property resulting from any ideas, methods, instructions or products referred to in the content.