Abstract
Dragon fruit or pitaya (Hylocereus sp.) is an exotic tropical plant gaining popularity in the United States as it is a nutrient-rich fruit with mildly sweet flavor and a good source of fiber. Although high tunnels are being used to produce specialized crops, little is known about how pitaya growth, physiology and nutrient uptake change throughout the production period. This study aims to evaluate the impact of high tunnels and varying rates of vermicompost on three varieties of pitaya, White Pitaya (WP), Yellow Pitaya (YP), and Red Pitaya (RP), to assess the soil and plant nutrient dynamics, spectral reflectance changes and plant growth. Plants were assessed at 120 and 365 DAP (Days After Plantation). YP thrived in a high tunnel compared to an open environment in terms of survival before 120 DAP, with no diseased incidence and higher nutrient retention. The nutrient accumulation in the RP, WP, and YP shoot samples 120 DAP were ranked in the following order, K > N > Ca > Mg > P > Fe > Zn > B > Mn, while 365 DAP, they were ranked as K > Ca > N > Mg > P > S > Fe > Zn > B > Mn. The nutrient accumulation in the RP, WP, and YP, soil samples 120 and 365 DAP were ranked in the following order: N > Ca > Mg > P > K > Na > Zn. Soil nutrients showed a higher concentration of Na and K grown inside the high tunnels in all three pitaya species due to the increased concentration of soluble salts. Spectral reflectance analysis showed that RP and WP had higher reflectance in the visible and NIR region compared to YP due to their higher plant biomass and canopy cover. This study emphasizes the importance of environmental conditions, nutrition strategies, and plant physiology in the different pitaya plant species. The results suggest that high tunnels with appropriate vermicompost can enhance pitaya growth and development.
1. Introduction
Dragon fruit (Hylocereus spp.) or pitaya is an exotic tropical climbing cactus plant gaining popularity around the world due to the taste, high nutritional and medicinal value of its fruits. The tropical and sub-tropical forest regions of South and Central America are broadly considered to be the origin of dragon fruit [1]. As a highly drought-tolerant plant with desirable fruit production and economic properties, the dragon fruit plant is commercially cultivated in more than 10 countries around the world. Dragon fruit was introduced from Southern Mexico, Guatemala, and Costa Rica into tropical countries of South Asia in 1990 [2]. Based on the physical characteristics of the fruit, it is divided into five major types Hylocereus polyrhizus (pink peel with red pulp inside), Red Pitaya (RP) or Hylocereus costaricencis (pink peel with violet and red pulp), White Pitaya (WP) or Hylocereus undantus (pink peel with white pulp), Yellow Pitaya (YP) or Hylocereus megalanthus (yellow peel with white pulp) and Hylocereus guatemalensis (reddish orange peel with red pulp). In addition to its varieties, pitaya is also equally known for its high nutrient concentrations, which are beneficial to human health. The seeds of dragon fruit include heart-healthy omega−3 and omega 6-fats, while the fruit itself is a great source of vitamins, fiber, iron, magnesium and calcium [3,4,5,6,7]. In addition to its potent antioxidant properties, it may help lower weight and aid those with type 2 diabetes control their blood sugar and cholesterol [8,9].
Dragon fruit’s chemical composition mostly depends on environmental conditions, plant maturity, nutrient availability, and soil type. The interaction between plant and soil chemical concentrations determines fruit quality and quantity [10]. A systematic analysis of soil and plant data helps to unravel the complicated interactions between the plant and soil nutrient uptake while identifying limiting essential nutrients [11,12]. Decreased soil fertility, nutrient imbalances, and environmental pollution from leaching, greenhouse gas emissions, and surface and groundwater contamination have all been related to the extensive use of chemical fertilizers in horticulture production systems [13]. Overall, these inputs can harm soil health by decreasing microbial diversity, interfering with nitrogen cycle, and raising salinity, even while they provide immediate yield gains. Nutrient balance in soil–plant systems can be improved by the addition of organic fertilizers and compost, which increases the quantity and quality of plants and fruit [14]. Sustainable soil–plant nutrient management in dragon fruit production is lacking. When compared to other fruit crops, dragon fruit plants are known for their capacity to thrive in challenging environments, which makes their establishment relatively simpler [15]. However, the excessive use of synthetic pesticides and fertilizers has reduced soil fertility and decreased plant productivity. These create long-term environmental concerns such as nutrient leaching, salinity and microbial diversity reduction. Organic fertilizers and various soil amendments are crucial for the cultivation of dragon fruit to overcome these difficulties and enhance soil fertility and fruit quality. In addition to assisting plants in absorbing nutrients, the organic farming of dragon fruit also satisfies rising customer demand for organic and healthful products.
Spectral reflectance is a non-destructive technique that is useful in monitoring plant growth, physiology, nutrient concentrations, and plant health [16]. Several research studies have established correlations between photosynthetic pigments and leaf reflection or transmission [16,17]. However, plant spectral reflectance can provide significant information about plant water content, internal structure and other plant biophysical characteristics that can help in the further evaluation of plant health status, thus optimizing plant requirements. When spectral reflectance is integrated into precision agricultural systems, it enables site-specific crop management through real-time monitoring and tailored decision-making based on plant requirements.
In recent years, dragon fruit productivity has been decreasing in South Florida due to intense precipitation, increased temperature fluctuations, and high humidity, resulting in poor harvest quality and increased plant diseases [18,19]. The exposure of pitaya plants to high temperatures results in plant sunburn, while low temperatures result in frost injury to plants. The effect of environmental factors on dragon fruit production can be optimized by using a high tunnel or hoop house facility. High tunnels are unheated, plastic-covered structures used in agriculture to protect crops and prolong the growing season.
A high tunnel enables precise nutrient management, creates a favorable microclimate, and extends the growing season. It also serves as a physical barrier and helps in decreasing pest and disease incidence, reducing the need for chemical intervention and promoting environmentally friendly practices [20]. High tunnels can maximize the profitability and sustainable production of dragon fruit in South Florida and beyond. Despite greater initial expenditures, high tunnels help stabilize output, lower losses, and enable earlier and longer harvests, all of which improve the economic and environmental sustainability of dragon fruit growing. Even though dragon fruit cultivation is becoming more popular, there is still a lot to learn about how different varieties compare, how they perform in different growth environments (such as high tunnels versus open fields), and how nutrient sources, especially organic amendments like vermicompost, affect soil fertility and plant productivity.
Hence, this study was carried out to verify the impact of high tunnel facilities on the growth and physiology of three different pitaya species in south Florida. This study also investigates the impact of vermicompost on the morpho-physiological traits of dragon fruit, thereby gaining important knowledge for a comprehensive organic production technique within and outside the high tunnel facility. The specific objectives of the study are (1) assessing how the high tunnel environment influences plant physiology, (2) investigating the interaction between the plant and soil nutrient uptake in two distinct environments, and (3) evaluating the utility of plant spectral reflectance characteristics for plant health and its development monitoring.
2. Materials and Methods
2.1. Experimental Setup
The dragon fruit or pitaya saplings of about 3–4 weeks old were obtained from commercial growers in Miami and included three species of dragon fruits: Hylocereus undatus or White Pitaya (WP), consisting of red peel with white pulp, Hylocereus megalanthus or Yellow Pitaya (YP), consisting of yellow peel with white pulp and Hylocereus costaricenes or Red Pitaya (RP), consisting of red peel with red pulp. With good climate adaptation, WP yields approximately 10.5 kg per pole, matures in 22–27 days, and bears medium-sized fruit (approximately 347 g) [21]. Despite having the smallest fruit (~175 g), the longest maturity (~33 days), and the lowest production (~0.55 kg per pole), YP is prized for its deliciousness. Due to its high antioxidant content, comparable maturity to WP, and greatest yield (~17.6 kg per pole), RP is the best choice for commercial production [22,23].
All the plants were planted on 23 June 2022, using a Randomized Complete Block Design (RCBD), in the Florida International University (FIU) Organic Garden. The FIU Organic Garden, situated in Miami, Florida, at roughly 25.7570° N, −80.3762° W, enjoys a tropical monsoon environment with average temperatures of about 25 °C, 1550 mm of annual rainfall, and an average humidity of 75%. A total of 36 plants of three different species, with four treatments and three replicates per plant species, were set up inside the high tunnel facility, and the same experimental setup with another 36 plants were set up as the control (outside the high tunnel facility). Each plant was provided with a wooden trellis and grown in a 15-gallon pot with drainage holes, enabling the plants to grow effectively. The plants were subjected to four different treatments of vermicompost (Table 1), which were applied at different rates:

Table 1.
Summary of vermicompost treatment rates and corresponding notations for Red, Yellow, and White Pitaya plants grown under open-field and high tunnel conditions.
The vermicompost utilized in the study was collected from Lion Farms, a local farm in Miami, and was applied to the soil surface each season for the plant treatments: T1 (Control), T2 (5 tons per acre), T3 (10 tons per acre), and T4 (20 tons per acre). The vermicompost treatments were applied both at the beginning of the planting phase and at the end of each season. Treatments were named ROT1–ROT4 representing the Red Pitaya (RP), YOT1–YOT4 representing the Yellow Pitaya (YP) plants, and WOT1–WOT4 representing the WP plants grown in an open environment (Table 1). The treatments marked as RT1–RT4, YT1–YT4, and WT1–WT4 are Red, Yellow, and White Pitaya, respectively, cultivated inside the high tunnel (Table 1). The irrigation and other intercultural operations were carried out according to the specific needs and demands. All pots were monitored daily. Weeds were removed manually, and no herbicides and synthetic pesticides were used during organic plant production.
Plant height was chosen as the key growth metric because it is a solid predictor of early vegetative development in dragon fruit. Other features, like flowering and fruiting, were not measured because flowering normally occurs after 13–14 months, which is beyond the study period. Branching was also limited in the first year, with most plants forming only 1–2 primary branches, hence it was excluded from the analysis. The detection of diseases was based on observations. This includes signs such as stem rot and bacterial and fungal infection.
2.2. Plant and Soil Chemical Analysis
Plant and soil samples were collected at 120 and 365 Days After Plantation (DAP), at the active vegetative and at the first flowering stages of the plant, respectively, to capture meaningful growth and nutrient uptake phases. Soil samples of about 100–150 g were collected and dried in an oven at 70 °C for 24 h. Further, the soil samples were ground and sieved through a 2 mm sieve and stored in paper bags at room temperature (18–20 °C) until analysis. The soil samples were analyzed for pH, N, P, K, Ca, Mg, Zn, Na, C, organic matter content (OM), and cationic exchange capacity (CEC). The pH was determined in 0.01 M CaCl2 with a soil to water ratio of 1:2 after 30 min of equilibration. The soil organic matter content was determined using the Loss on Ignition method. The C and N content were analyzed by using a C/N Analyzer. The elemental concentrations of P, K, Ca, Mg, Zn, and Na were determined using ICP-MS (Agilent 7900, Santa Clara, CA, USA). The extraction of exchangeable cations was conducted by the ammonium chloride extraction method where unbuffered 1 M NH4Cl solution was kept for 1 h on a shaker using a soil to solution ratio of 1:10. The cationic exchange capacity was determined as a sum of charge equivalents of exchangeable K, Ca, Mg, Zn, Na, and H.
Plant shoot samples were harvested using a clean cutter to ensure no harm or contamination during the process. Each plant sample was labeled and dried in an oven at 70 °C for 72 h as the pitaya cladodes has high amount of moisture. The dried plant samples were then ground to powder using 8000 M Mixer/Mill (SPEX Sample Prep, Metuchen, NJ, USA) and analyzed for N using a C/N analyzer. P, Ca, K, Mg, S, B, Fe, Mn, and Zn concentrations were analyzed using ICP-MS.
2.3. Plant Spectral Reflectance
A Spectral Evolution spectroradiometer (Spectral Evolution Inc., Haverhill, MA, USA) with a spectral range of 350–2500 nm was used to obtain the reflectance spectra of each individual pitaya at the cladode-level, with a quartz–tungsten–halogen (QTH) lamp as a light source using a contact probe. Diffused light from the contact probe was used to illuminate the cladode surface. Canopy-level reflectance was obtained with sunlight as a source of illumination. The fore optics were aligned vertically and the height of the fore optics from the plant canopy was adjusted so that only the reflectance of the targeted material filled the field of view (FOV) of the instrument. The height of the fore optics from the surface of the targeted plant material in this experiment was kept constant. The same experimental setup was used to obtain the spectra of all the plant samples. The calibration spectrum of a white spectralon panel (Labsphere Inc., North Sutton, NH, USA) was acquired before recording the cladode- and canopy-level spectra. The spectral recording software in the spectroradiometer was set in such a way that each reflectance spectrum recorded was obtained by collecting and averaging 10 individual reflectance spectra. Each spectrum was normalized by dividing it with the measured spectrum of the standard (spectralon panel). The spectral reflectance procedure was reported in detail elsewhere [24,25]. The spectral reflectance data were obtained 120 and 365 Days After Plantation (DAP).
2.4. Statistical Analysis
The significant differences between the treatments were evaluated through the analysis of variance (ANOVA). Tukey’s multiple range test was performed using MINITAB statistical analysis software version 21.1.0. Using a 4 × 2 × 3 factorial design within a Randomized Complete Block Design (RCBD) framework, the statistical analysis was carried out. The growing environment in the experiment is the main plot with two levels (open field and high tunnel), pitaya plant species is the sub-plot with three levels (red, yellow, and white) and the vermicompost rate is the sub-sub-plot with four levels (0, 5, 10, and 20 t/acre). Due to the distinct nature of the growing environments, they were analyzed independently. Within each environment, we analyzed the effects of species and vermicompost using two-way ANOVA.
3. Results
3.1. Plant Growth Characteristics
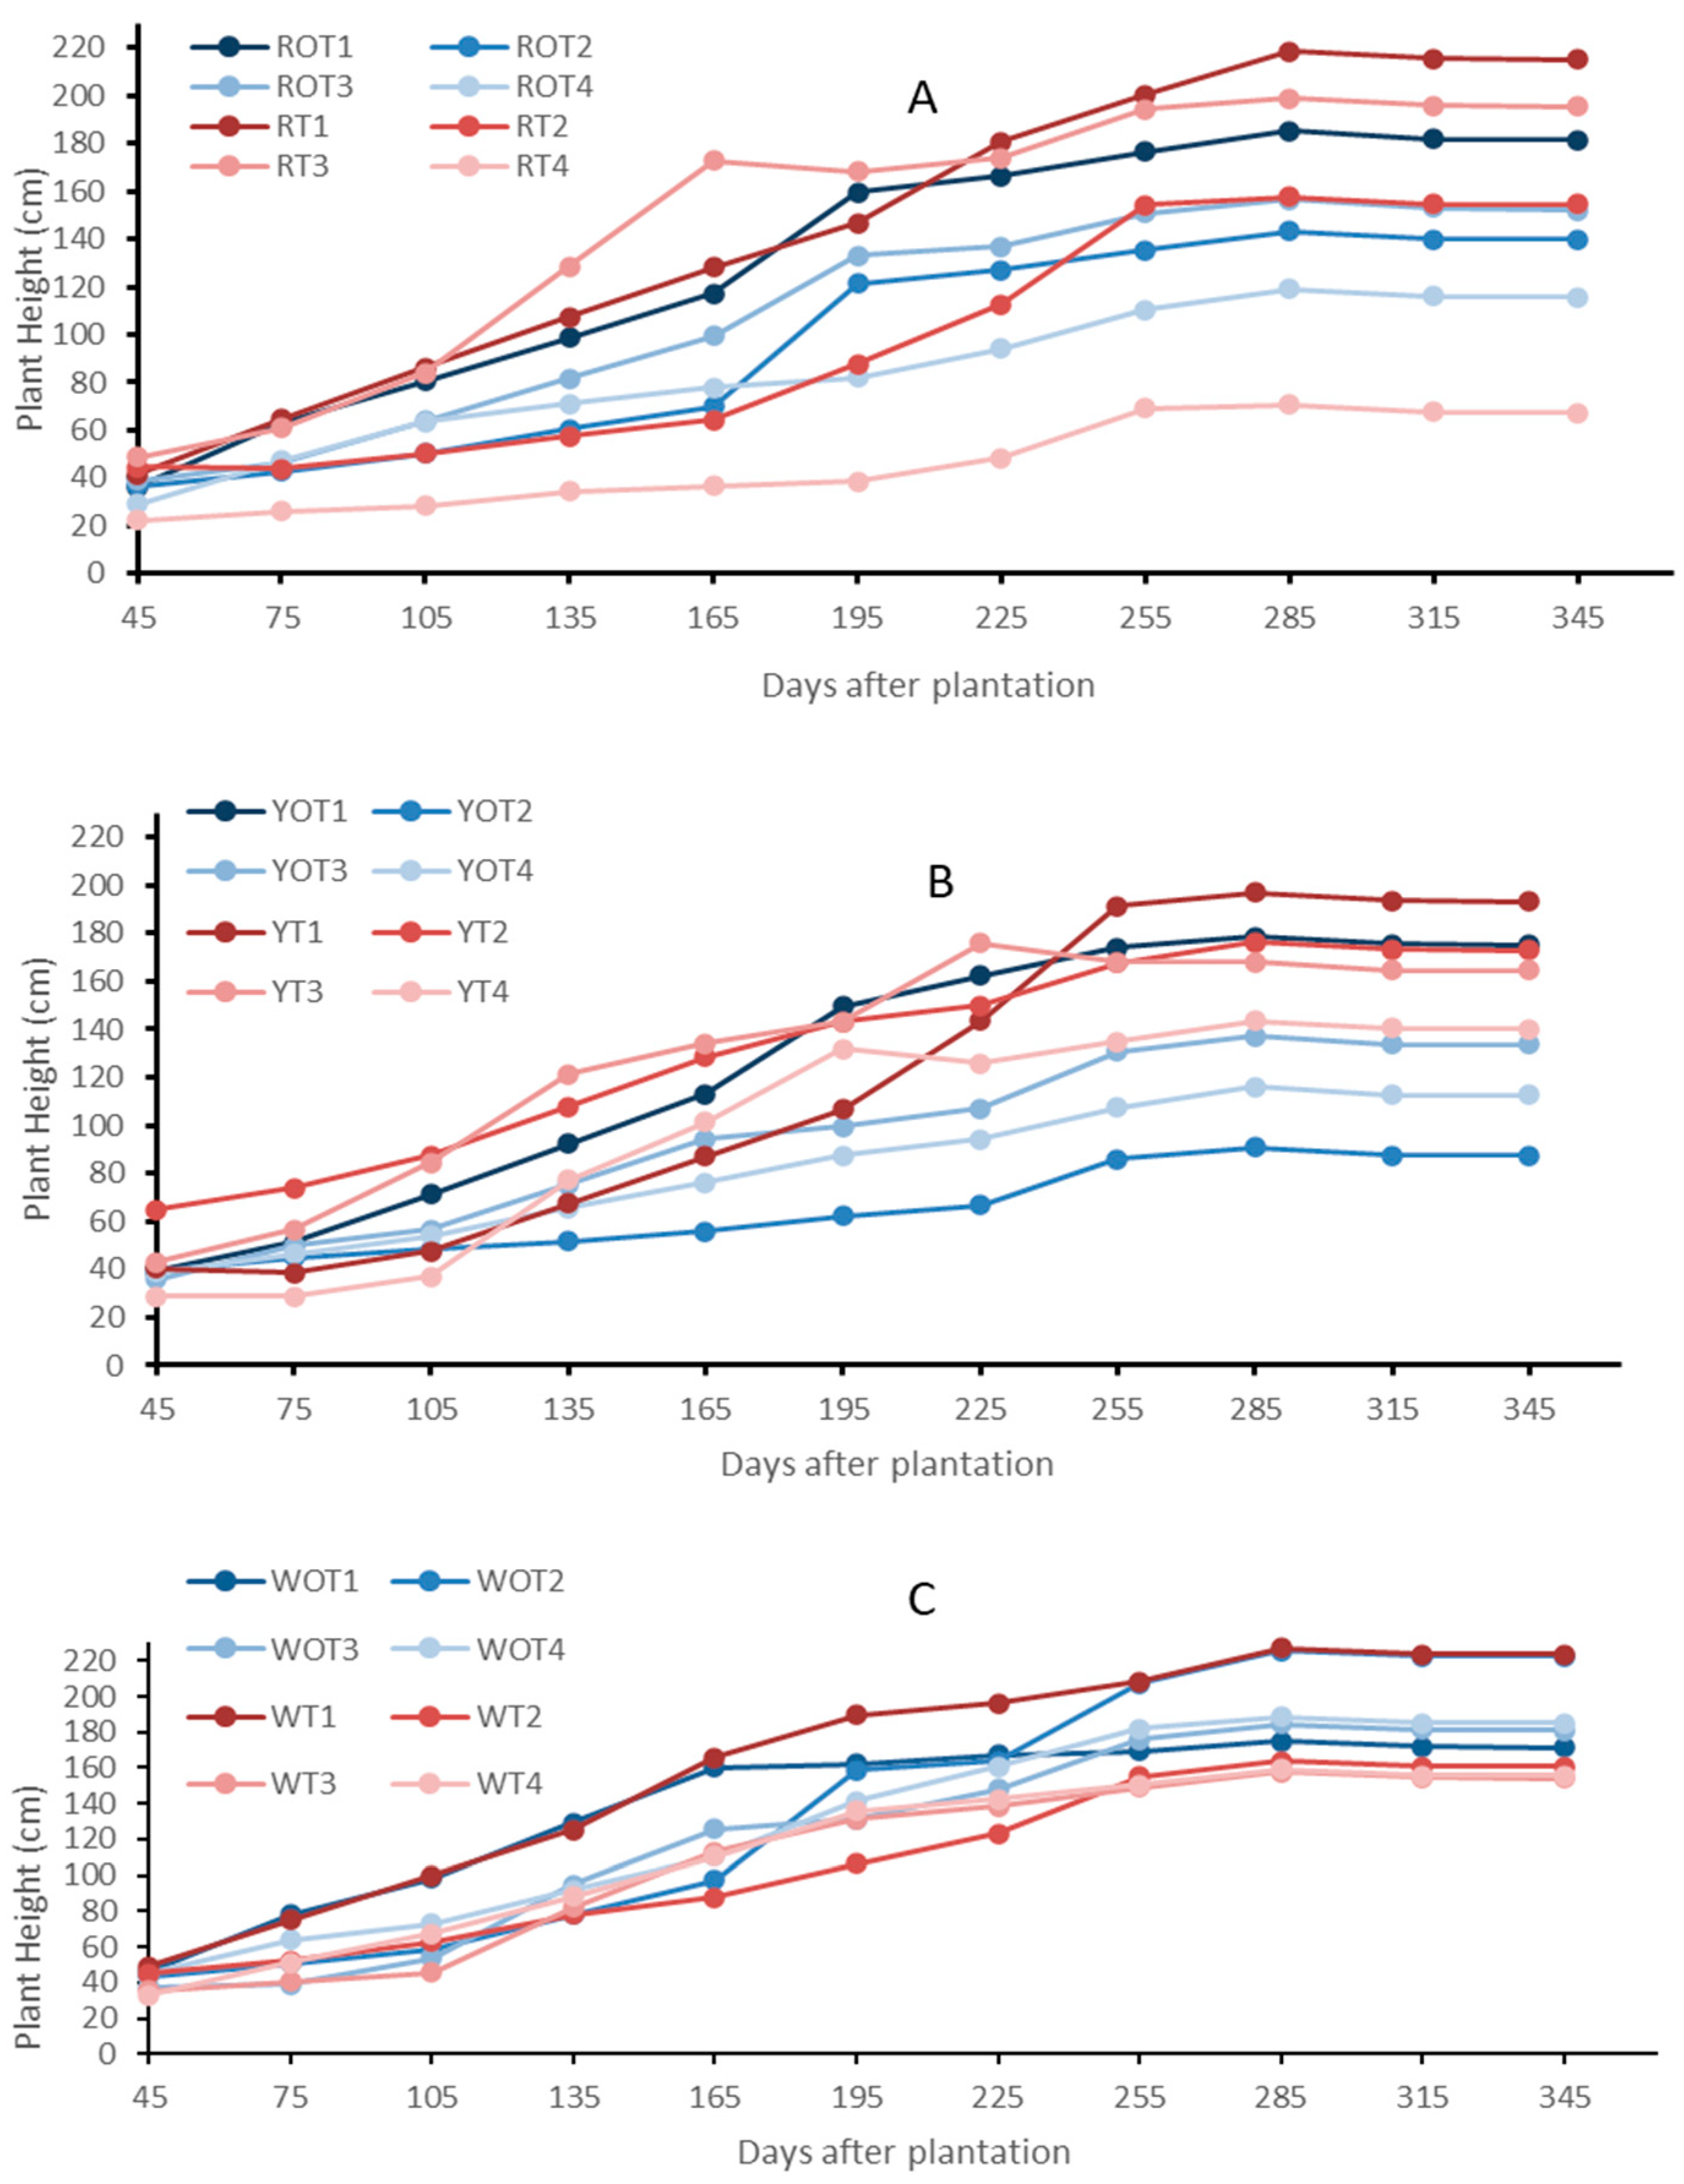
The RP, YP and WP plants treated with varied vermicompost concentrations, inside and outside the high tunnel, grew well during the experiment. The plant height among all three pitaya plant species grown in the open environment facility remained higher compared to the hoop house grown plants (Figure 1). The plant height increased progressively in all the plants (Figure 1). The RP plants (ROT1–ROT4) grown in the open environment showed a higher growth rate compared to the RT1–RT4 treatments grown inside the high tunnel. The growth rates of the ROT4 and RT4 treatments, which received 20 t/acre of vermicompost were lower than the rest of the treatments (Figure 1A). The growth in winter is higher for the high-tunnel-grown plants compared to the open-environment plants. The YP treatments (YT1–YT4) grown inside the high tunnel showed a higher growth rate compared to the YOT1–YOT4 treatments grown in the open environment. The growth rate of the control treatment, which did not receive vermicompost, was higher compared to other treatments (Figure 1B). Similarly, the WP treatments (WOT1–WOT4) grown in the open environment showed a slightly higher growth rate compared to the other treatments grown inside the high tunnel (WT1–WT4). The growth rates of the WOT3 and WT3 treatments, which received 10 t/acre of vermicompost, were lower than the rest of the treatments (Figure 1C). YP exhibited a lower plant height compared to other species in both the open and high tunnel environments (Figure 1). The pitaya plants inside the high tunnel facility showed no visible disease symptoms compared to the plants grown in the open environment facility. Outside the high tunnel facility, early fungal, bacterial diseases (white and brown patches) were observed. Stem canker was also observed in some. Figure 1 shows that plant height exhibited a significant increase in the open environment compared to the hoop house during the initial four months after plantation.
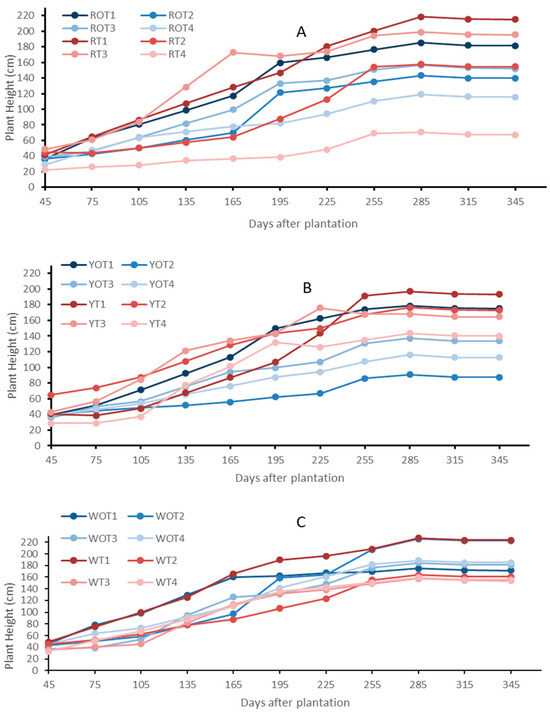
Figure 1.
Plant height measurements of Red Pitaya (A), Yellow Pitaya (B), and White Pitaya (C) grown in the open environment and high tunnel facility. Treatments RT1–RT4, YT1–YT4, and WT1–WT4 are Red, Yellow, and White Pitaya, respectively, grown inside the high tunnel. The treatments marked as ROT1–ROT4, YOT1–YOT4, and WOT1–WOT4 are Red, Yellow, and White Pitaya, respectively, grown in the open environment.
3.2. Plant Chemical Analysis
The macro and micro elemental concentrations in the three pitaya plant species (RP, WP and YP) 120 DAP and 365 DAP are given in Table 2, Table 3 and Table 4.
Table 2.
The concentration of macro nutrients, secondary nutrients and micronutrients in the Red Pitaya (RP) plant species grown inside and outside the high tunnel or hoop house 120 Days and 365 Days After Planting (DAP). The mean values (n = 3) of three replicates are given.
Table 3.
The concentration of macro nutrients, secondary nutrients and micronutrients in the Yellow Pitaya (YP) plant species grown inside and outside the high tunnel or hoop house 120 Days and 365 Days After Planting (DAP). The mean values (n = 3) of three replicates are given.
Table 4.
The concentration of macro nutrients, secondary nutrients and micronutrients in the White Pitaya (WP) plant species grown inside and outside the high tunnel or hoop house 120 and 365 Days After Planting (DAP). The mean values (n = 3) of three replicates are given.
Throughout the investigation, no visible signs of nutrient deficiencies were displayed by any of the plant species cultivated in the open environment or high tunnels. This finding was not based on a comparison with known critical nutrient concentration thresholds for dragon fruit but rather on the lack of recognized deficiency symptoms.
The concentrations of N, P, Ca, Mg, B, Fe, Mn and Zn were higher in all the treatments of RP plants grown in the open environment compared to the plants in the high tunnel 120 DAP (Table 2). The K concentrations in the high-tunnel-grown RP plants were higher than the plants in the open environment. The concentrations of N, P, K, Mg, B, Fe and Zn in the RP plants grown in the outside environments showed an increasing trend with an increase in vermicompost concentrations in ROT1 to ROT3 (Table 2). No trend was shown for the rest of the elements. The ROT4-treated plants showed the lowest concentration of all the macro and micronutrients (Table 2) compared to the rest of the treatments in the plants grown in the open environment. Among the RP plants grown in the high tunnel only, the N concentrations showed an increasing trend with an increase in vermicompost concentrations in RT1 to RT3 (Table 2) and no trend was shown for the rest of the elements 120 DAP (Table 2). The N, K, Ca, and Mg concentrations were significantly higher in the ROT2-ROT4 vermicompost-treated plants compared to the control treatment (ROT1) among the RP plants grown outside the hoop house (Table 2) 365 DAP. No significant trend was observed for the rest of the elements in the RP plants grown inside the hoop house. The concentrations of N, K, Mg and Fe in RP plants grown inside the high tunnel (RT1–RT4) was higher compared to the plants grown outside (ROT1–ROT4) (Table 2). The Zn and B concentrations were higher compared to the S and Mn concentrations in RP plants grown inside the high tunnel (RT1–RT4). The ROT4- and RT4-treated plants applied with 20 t/acre of vermicompost concentrations showed lower K, B, Fe, Mn and Zn concentrations compared to the rest of the treatments (Table 2). Mean grouping was performed using Tukey’s multiple range test at a 5% significance level. For each treatment combination, mean values were calculated from three replicates, considering the same species under the same vermicompost treatment.
The concentrations of Ca, B, Fe, Mn and Zn were higher in all the treatments of YP plants grown in the open environment compared to the plants in the high tunnel 120 DAP (Table 3). The N, P, K, Mg and S concentrations showed no specific trend among the YP plants grown inside and outside the high tunnel (Table 3). No significant differences in the accumulation of macro and micronutrients were observed with an increase in the vermicompost concentrations in YOT1–YOT4- and YT1–YT4-treated plants 120 DAP (Table 3). Moreover, 365 DAP, the concentrations of K, Ca, Mg, and Fe were found to be significantly higher in the YT1–YT4-treated YP plants grown inside the high tunnel compared to the YOT1–YOT4-treated plants grown in the open environment 365 DAP (Table 3). The N, P, S, B, Mn and Zn concentrations in YP plants showed no trend across all the treatments. The N concentrations showed an increasing trend with an increase in vermicompost concentrations in the YT1-YT3 and YOT1–YOT4-treated plants grown in both inside and outside the high tunnel 365 DAP (Table 3).
The concentrations of N and Ca were higher compared to the rest of the elements in all the treatments of WP plants grown in the open environment compared to the plants in high tunnels 120 DAP (Table 4). The K concentrations in the high-tunnel-grown WP plants were higher than those of the plants in the open environment. The concentrations of N and B in the WP plants grown in the outside environments showed an increasing trend with an increase in vermicompost concentrations in WOT1- to WOT3-treated plants (Table 4). No trend was shown among the concentration of elements in the plants grown inside the high tunnel (Table 4). Among the WP plant treatments grown in the high tunnel, only the N concentrations showed an increasing trend with an increase in vermicompost concentrations in WT1- to WT4-treated plants (Table 4) and no trend was shown for the rest of the elements 120 DAP (Table 4).
Furthermore, 365 DAP, the N, K, and Fe concentrations were significantly higher in the WT1–WT4 vermicompost-treated plants grown inside the high tunnel compared to the WOT1–WOT4-treated plants grown outside the high tunnel (Table 4) 365 DAP. No significant difference was observed for the rest of the elemental concentrations in the WP plants grown inside and outside the hoop house.
The N, K, Ca, and Fe, concentrations were significantly higher in the WOT4-treated plants compared to the WOT1-WOT3-treated plants among the plants grown outside the hoop house 365 DAP (Table 3). No significant trend was observed for the rest of the elements. The concentrations of N, K, S, and Fe in WP plants grown inside the high tunnel (WT1–WT4) were higher compared to the plants grown outside (WOT1–WOT4) 365 DAP (Table 4). The WOT4- and WT4-treated plants applied with 20 t/acre of vermicompost concentrations showed higher B concentrations compared to the rest of the treatments with lower vermicompost treatments. However, elements like P, B, Mn, and Zn did not show any statistically significant differences among the treatments 365 DAP (Table 4).
3.3. Soil Chemical Analysis
At 120 DAP, the soil concentrations of Na and K were significantly higher in the RP plants grown inside the high tunnels, while the P and Zn concentrations were higher in the plants grown outside (Table 5). The N, Ca, and CEC concentrations showed no significant differences between the RP plants grown either inside or outside the high tunnel (Table 5). The soil CEC and Ca concentrations among the ROT1–ROT4-treated plants decreased significantly with an increase in the vermicompost concentrations (Table 5), while no significant difference was found in the rest of the elemental concentrations. The Na, K and CEC concentrations among the RT1–RT4-treated plants grown inside the high tunnel increased significantly with an increase in the vermicompost concentrations (Table 5), while the P, Ca and Zn concentrations decreased 120 DAP. The Na concentrations were significantly higher in the RT3- and RT4-treated plants grown inside the high tunnel compared to any other treatments (Table 5). The chemical concentrations of the initial soil and the vermicompost were also included for comparison (Table 5).
Table 5.
Average soil macro nutrients, secondary nutrients and micronutrient concentrations along with the organic matter (OM) and Cation Exchange Capacity (CEC) of the vermicompost and vermicompost-treated Red Pitaya (RP) plant species grown inside and outside the hoop house 120 and 365 Days After Planting (DAP). The mean values (n = 3) of three replicates are given.
At 365 DAP, the Ca, Mg, Na and CEC concentrations in soils were significantly lower in the ROT1–ROT4 vermicompost-treated plants grown outside compared to the RT1–RT4-treated plants grown inside the high tunnel 365 DAP (Table 5). No significant difference was observed for N and OM concentrations in the soils among the various treatments (Table 5). The soil concentrations of Na, Ca and CEC increased, while Zn concentrations decreased with an increase in vermicompost concentrations in the ROT1–ROT4-treated plants grown outside the high tunnel (Table 5). The soil concentrations of Na and Mg increased while P and Zn concentrations decreased with an increase in vermicompost concentrations in the RT1–RT4-treated plants grown inside the high tunnel (Table 5).
At 120 DAP, the P, K, Ca, Na and CEC concentrations were significantly lower in the vermicompost-treated plants (YOT1–YOT4) compared to the plants grown inside the hoop house (YT1–YT4). No significant trend was observed for the rest of the elements (Table 6). The YT4-treated plants applied with 20 t/acre of vermicompost concentrations showed higher concentrations of all nutrients compared to the rest of the treatments with lower vermicompost treatments (Table 6).
Table 6.
Average soil macro nutrients, secondary nutrients and micronutrient concentrations along with the organic matter (OM) and Cation Exchange Capacity (CEC) of the vermicompost and vermicompost-treated Yellow Pitaya (YP) plant species grown inside and outside the hoop house 120 and 365 Days After Planting (DAP). The mean values (n = 3) of three replicates are given.
At 365 DAP, the K, Ca, and Mg concentrations were significantly lower in the vermicompost-treated plants (YOT1–YOT4) compared to the control treatment (YOT4) among the plants grown outside the hoop house. No significant trend was observed for N and OM (Table 6). The N and OM concentrations were higher in the YOT1–YOT4-treated plants compared to the YP plants grown inside the high tunnel. The YT4-treated plants applied with 20 t/acre of vermicompost concentrations showed higher K, P, Mg, Na and CEC concentrations compared to the rest of the treatments with lower vermicompost treatments (Table 6). The YOT1- and YT1-treated plants have high levels of P compared to other treatments in all YP plants.
At 120 DAP, the K, Ca, Na, and CEC concentrations were significantly lower, and P was higher in the vermicompost-treated plants (WOT1–WOT4) compared to the plants grown inside the hoop house (WT1–WT4). No significant trend was observed for N, Z, and OM (Table 7). The N and OM concentrations were lower in the WP plants inside the high tunnel compared to the WP plants grown outside the high tunnel (WOT1–WOT4) (Table 7).
Table 7.
Average soil macro nutrients, secondary nutrients and micronutrient concentrations along with the organic matter (OM), and Cation Exchange Capacity (CEC) of the vermicompost and vermicompost-treated White Pitaya (WP) plant species grown inside and outside the hoop house 120 and 365 Days After Planting (DAP). The mean values (n = 3) of three replicates are given.
P K, Ca, Mg, Na and CEC concentrations were significantly lower in the vermicompost-treated plants (WOT1–WOT4) compared to the control plants grown inside the hoop house. No significant trend was observed for N and OM (Table 7). The WOT2- and WT4-treated plants applied with 20 t/acre of vermicompost concentrations showed lower P and Mg concentrations compared to the rest of the treatments with lower vermicompost treatments (Table 7).
3.4. Plant Spectral Reflectance
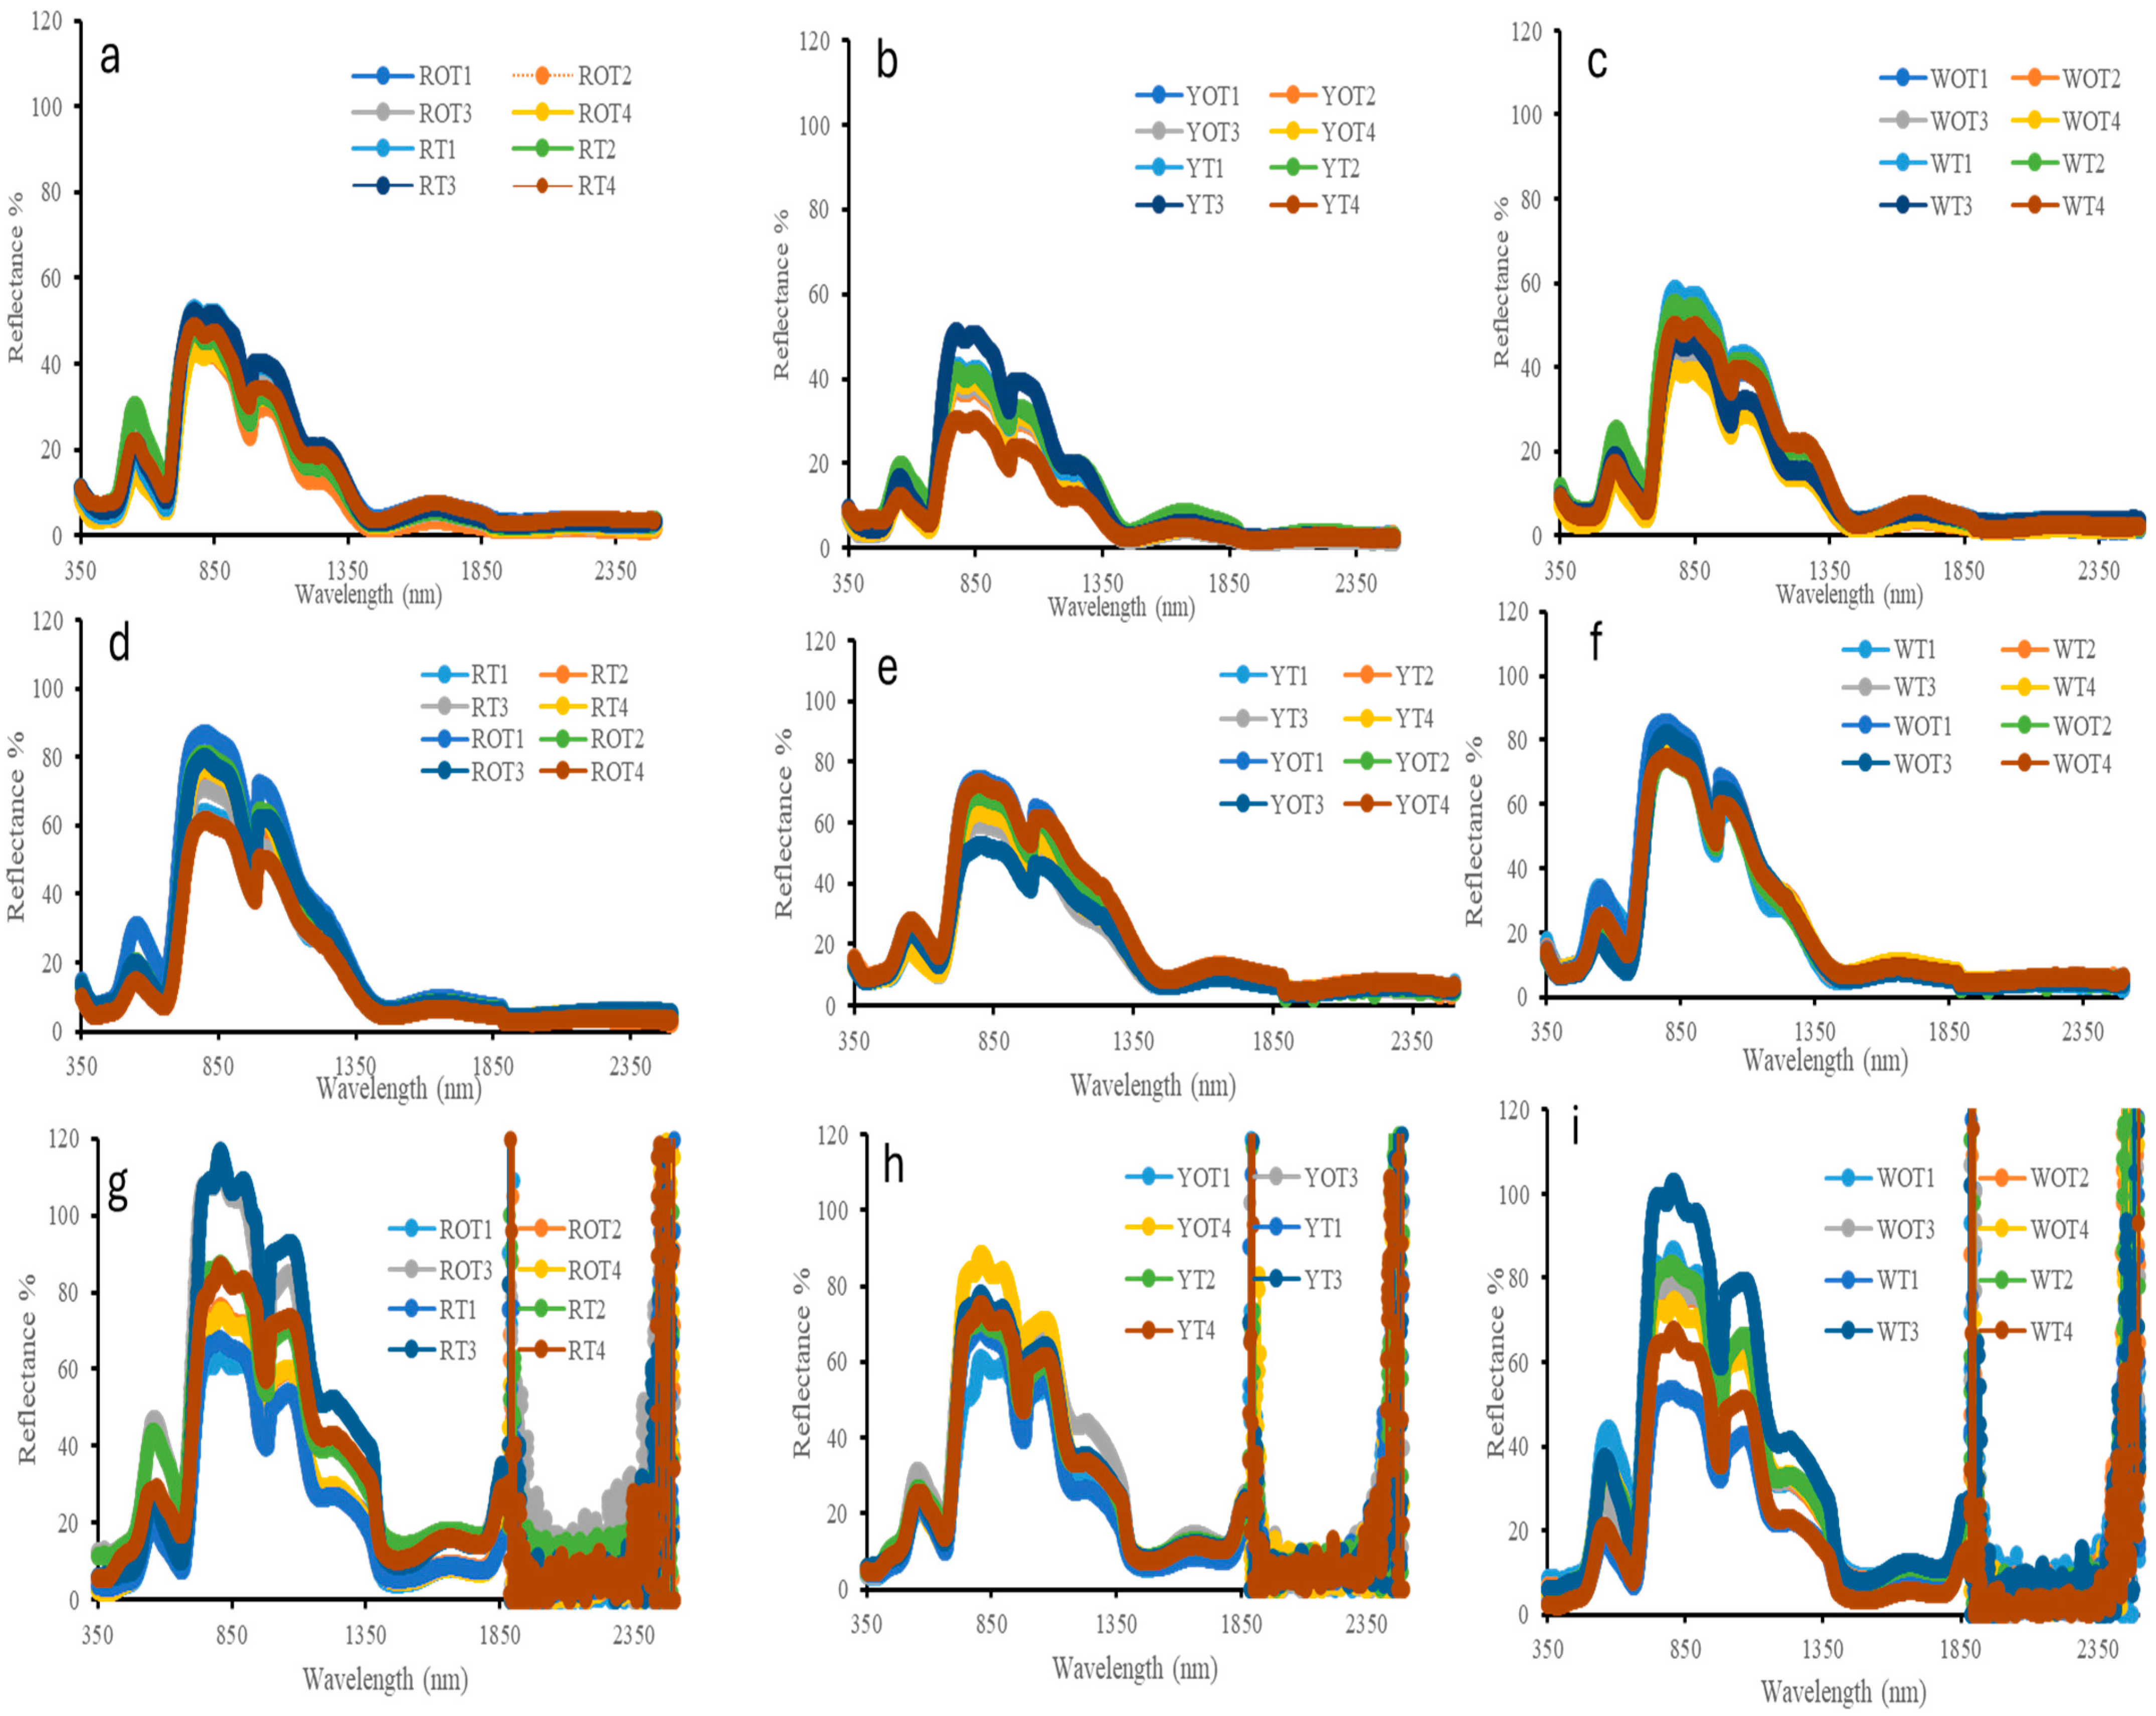
The average cladode-level spectral reflectance of the RP (Figure 2a,d), YP (Figure 2b,e) and WP (Figure 2c,f) plant species of all the treatments grown inside and outside the high tunnel in the visible and near-infrared and short-wave infrared (VIS, NIR and SWIR) regions (350–2500 nm range) during two different time periods at 120 (Figure 2a–c) and 365 DAP (Figure 2d–f) is shown in Figure 2. The canopy-level spectral reflectance obtained 365 DAP for the three species, RP (Figure 2g), YP (Figure 2h) and WP (Figure 2i), of all the treatments grown inside and outside the high tunnel are also shown in Figure 2. RP showed a reflectance range of 40–50% in 120 days and 40–85% in 365 days, while WP displayed a reflectance range of 35–60% in 120 days and 30–85% in 365 days. YP, on the other hand, showed a slightly lower reflectance range of 30–52% in 120 days and 30–75% in 365 days.
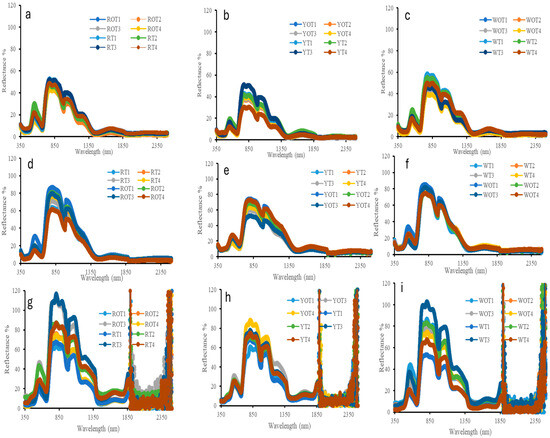
Figure 2.
Averaged cladode-level spectral reflectance of RP (a,d), YP (b,e) and WP (c,f) plant species 120 (a–c) and 365 (d–f) Days After Plantation (DAP). Averaged canopy-level spectral reflectance of RP (g), YP (h) and WP (i) plant species 365 (g–i) Days After Plantation (DAP). The wavelength axis represents the VIS (400–700 nm), NIR (700–1300 nm) and SWIR (1300–2500 nm) and spectral bands are designated to represent pigment absorption, leaf structure, and water content, respectively.
When considering the species of pitaya based on the stem of cladode reflectance, it was observed that RP exhibited the highest reflectance near the visible region of 500–600 nm, around the chlorophyll peak followed by WP inside and outside the hoop house. In the near-infrared (NIR) region, WP displayed higher reflectance compared to RP and YP species. Conversely, YP exhibited weaker reflectance overall in both the visible (400–700 nm), NIR (700–1300 nm) and SWIR (1300–2500 nm) of the spectrum. Low water absorbance was observed in YP plants in both inside and outside the high tunnel compared to the other two species of pitaya.
The canopy-level spectral reflectance obtained 365 DAP for RP exhibited higher reflectance in the visible and NIR followed by WP and YP. This shows a similar trend with the reflectance shown by dragon fruit plant based on the foliar level with the visible range. The reflectance is low due to high absorption by chlorophyll in the blue (400–500 nm) and red (600–700 nm) regions of the spectrum, leaving a chlorophyll peak centered at around 550 nm region. The value ranges from 5–45% to the visible range in each species. However, a change is observed in the NIR, with the value ranging from 50–110%. The reflectance increases dramatically between 690 and 850 nm, indicating the red-band feature of green vegetation. Within the wavelength range (1800–2500 nm), the spectral curves show high noise because of atmospheric water vapor.
4. Discussion
4.1. Plant Nutrients
The majority of the plant nutrient concentrations increased with an increase in vermicompost concentrations (Table 2, Table 3 and Table 4). Vermicompost is widely known to enhance nutrient availability and uptake in plants [26,27,28,29,30,31,32]. Among the RP plants, the K concentration was higher 120 DAP while N, K, Mg, and Fe were higher 365 DAP in high-tunnel-grown plants compared to the plants grown in the open environment (Table 2). The N concentrations increased with higher vermicompost levels in both high-tunnel- and open-environment-grown RP, YP and WP plants (Table 2, Table 3 and Table 4). The N concentrations in pitaya are known to increase with higher application rates of vermicompost [33]. Similarly to RP plants, K, Ca, Mg, and Fe were significantly higher in high-tunnel-grown YP plants 365 DAP (Table 3). The high-tunnel-grown WP plants also had higher N, K, S, and Fe concentrations than the open-field-grown plants 365 DAP. Every year, dragon fruit requires 100–150 kg of nitrogen per hectare [34]. Moreover, 5 t/ha of vermicompost, which has a nitrogen content of 2.26%, yields approximately 113 kg N/ha, which is sufficient to cover most needs and enhance soil health and nutrient uptake [35,36].
The K and Na concentrations were found to be significantly higher in all the pitaya plants grown inside the high tunnel compared to the outside environment, which agrees with the findings of [37,38]. The additional fertilization to the initial soil amendments led to increased concentrations of key nutrients such as Ca, Mg and K, thereby enhancing overall soil fertility [38. Due to organic acids and chelating chemicals that improve nutrient availability, more vermicompost treatment increases nutrient solubility [38,39]. On the other hand, too much vermicompost can increase electrical conductivity and soil soluble salts, leading to osmotic stress and nutritional imbalances that decrease nutrient uptake [39]. As a result, although overapplication may have detrimental effects on plant nutrition due to salt accumulation and nutritional antagonism, moderate application enhances nutrient availability. Given that, based on this study, different pitayas react differently to vermicompost application rates and growing conditions, it may be necessary to customize the ideal vermicompost application rates for each variety [40]. The nutrient accumulation in the RP (Table 2), WP (Table 3), and YP (Table 4) shoot samples 120 DAP were ranked in the following order, K > N > Ca > Mg > P > Fe > Zn > B > Mn (Table 2, Table 3 and Table 4), while 365 DAP, the sample concentrations were ranked as K > Ca > N > Mg > P > S > Fe > Zn > B > Mn (Table 2, Table 3 and Table 4). The shoot nutrient chemical concentration in the initial 120 DAP followed the similar pattern of K > N > Ca > S > Mg > P > Mn > Fe > Zn > B ≥ Cu in the pitaya shoots of Hylocereus undatus [41].
High tunnels significantly influence plant nutrient accumulation and plant growth, enhancing the nutritional quality of crops. Through improved moisture retention, less leaching, and increased microbial activity that promotes nutrient mineralization, high tunnels raise levels of nitrogen and micronutrients [42,43]. High tunnels have been shown to increase N, P, and K levels in dragon fruit, enhancing protein content [42,44]. The accumulation of iron and manganese in dragon fruit plants peaked at selected growth stages in an open environment, indicating that environmental conditions are important for the uptake of micronutrients [44].
4.2. Soil Nutrients
Under both open-field and high tunnel situations, the findings unequivocally show that varying vermicompost rates had a substantial impact on soil nutrient levels and absorption patterns for the three dragon fruit species, RP, YP, and WP, at 120 and 365 DAP (Table 6). The nutrient concentration in the RP (Table 5), YP (Table 6), and WP (Table 7) soil samples 120 and 365 DAP were ranked in the following order: N > Ca > Mg > P>K > Na > Zn. The soil Na and K concentrations were significantly higher in RP plants grown inside high tunnels 120 DAP while the Ca, Mg, Na, and CEC concentrations were higher 365 DAP (Table 5). Organic additions, such as compost and vermicompost, improve soil exchange capacity and base cation availability, especially in Red Pitaya [45]. The high-tunnel-grown YP plants showed high K, Ca, and Mg concentrations compared to the control and the plants grown in the open environment (Table 6). Like RP and YP soil concentrations, the WP soils showed significantly high P, K, Ca, Mg, Na, and CEC concentrations outside the environment (Table 7). This reflects improved nutrient retentions and availability [15].
Different pitaya species have different patterns of nutrient concentration, which is in line with the variation in nutrient concentration among all three species found in our study. Vermicompost application improves nutrient retention and availability. This is consistent with the beneficial effect of vermicompost on nutrient concentrations, especially in YP (Table 6) [37]. The application of vermicompost significantly improved nutrient uptake and increased the plant growth rate in all the pitaya plant species [40,46]. Compost treatments increased plant P, K and Mg concentrations compared to unamended soil [47,48]. In addition to compost treatment, the application of lime significantly enhances the chemical properties of the soil. Liming helps neutralize soil acidity, raising the pH to a more favorable range, typically between 6.6 and 7.0, which is optimal for plant growth. This improved pH facilitates the better availability of essential nutrients such as Ca, Mg and K. Moreover, liming reduces toxic Al concentrations and increases the soil’s base saturation, creating a more conducive environment for pitaya root development and overall plant health [47]. These findings collectively highlight the necessity of species-specific management strategies in pitaya cultivation to maximize plant development and nutrient dynamics across various culture settings. Concerns over possible salinity building are raised by the high quantities of Na and K found in high tunnel soils, especially when the highest vermicompost rate (20 tons/acre) is used. Long-term soil health may be threatened by the accumulation of these soluble salts, which can decrease soil permeability, impede nutrient uptake, and adversely impact microbial activity [49]. Osmotic stress, which can restrict root water absorption and nutrient transport, and nutrient antagonism, such as excessive K+ and Na+, can hinder the uptake of vital cations like Ca2+ and Mg2+ and may be the cause of the decrease in nutrient efficiency at the highest vermicompost dose [50].
The controlled conditions can considerably affect soil nutrient dynamics, resulting in increased Na and K concentrations [32]. The concentrations of soil-extractable nutrients such as P, Na, and Zn increased during two-year high tunnel production [51,52]. The excess Na, Ca and Mg concentrations can negatively impact soil health and plant productivity in high tunnels, emphasizing the need for effective soil fertility management strategies.
4.3. Plant Growth
The plant height among all the RP, YP and WP plant species grown in the open environment facility remained higher compared to the high-tunnel-grown plants (Figure 1). However, the growth rate of all the plant species inside the high tunnels increased 120 DAP (Figure 1). Overall, the growth rate of RP and WP is higher than that of the YP plants grown both outside and inside the high tunnels (Figure 1). The YP plants exhibit slower vegetative growth compared to RP and WP due to inherent genetic differences, lower photosynthetic efficiency, and a less vigorous root system. These factors contribute to shorter branch elongation and limited canopy expansion, as the plant allocates more resources toward producing high-sugar fruits rather than vegetative development [22,23,37]. Pitaya cultivated inside the high tunnels had a higher rate of the accumulation of biomass and height than plants growing outside 365 DAP. This result confirms earlier research on other crops that also showed improved vegetative development under high tunnel conditions [26]. The high tunnel’s controlled atmosphere promotes ideal growth circumstances by lowering stress from temperature swings and pest pressure [27]. The average temperature at the experimental site was 25 °C and 75% relative humidity, which are both within the 21–29 °C and moderate humidity range that have been shown to be ideal for dragon fruit growth in previous research [28]. The more erratic circumstances in the open field, especially during times of heavy rain and high humidity, may have inhibited growth in the open plots, in contrast to the steady biophysical conditions inside the tunnels. The RP and WP plants species did well in both the growth conditions inside and outside the high tunnels. YP did well within high tunnels but poorly outside by 365 DAP. The reason is YP is more sensitive to heat and humidity and is better adjusted to high tunnel conditions [28,29].
In terms of plant disease incidence, our study revealed lower rates of diseases inside high tunnels, a pattern also seen in the production of peppers and cucumbers in high tunnels [30]. In fact, a high tunnel’s controlled environment reduces exposure to diseases and unfavorable weather, promoting the growth of healthier plants. Visible diseases symptoms were not quantified but were compared to general plant health between two distinct environments.
4.4. Plant Spectral Reflectance
The cladode-level spectral reflectance curves at 120 and 365 DAP exhibit a similar trend, indicating a consistent pattern for healthy vegetation (Figure 2). It is evident that the spectral reflectance of dragon fruit stem in the visible range of 400–700 nm is low due to the absorption of incident light by chlorophyll and carotenoid pigments in the 400–500 nm (blue region) and 600–700 nm (red region) of the spectra [53]. The strong chlorophyll peak centered at the 550 nm region indicates the presence of chlorophyll and active photosynthesis and high N concentrations in the plant [54,55,56]. The reflectance then sharply increases between 690 and 850 nm, representing the red-edge characteristic of green plants. Beyond 850 nm, there is a gradual decline in reflectance due to the absorption of water [54].
The changes in the reflectance characteristic within the visible, NIR and SWIR observed in the pitaya species during different periods after plantation are due to the correlation between carotenoid concentrations and increased chlorophyll. Spectral data, especially the NIR region, can be used in precision agriculture as it can detect early stress, enhancing resource use [57,58]. The main factors affecting reflectance values in the visible range are leaf pigments; in the near-infrared region, the canopy and leaf structure, moisture content, and nitrogen status all have a significant impact. When evaluating the many biophysical characteristics of plant canopies and leaves, NIR reflectance is very significant. The absorbance of water causes strong water absorption bands in 1400 and 1900 nm bands [59]. As pitaya plants mature and senesce, the cladodes exhibit increased reflectance at all wavelengths. Reflectance based on canopy is influenced by leaf hemispherical transmittance, leaf area and orientation, other canopy components, soil reflectance, solar zenith angle, look angle, and azimuth angle, requiring additional parameters for accurate predictions [57,58]. The canopy spectral reflectance indicates that the RP and WP plant species have higher reflectance in 900–1300 nm region compared to the YP plant species because of their higher plant biomass and larger canopy size compared to YP plant species (Figure 2g–i). Additionally, plants grown at appropriate vermicompost rates exhibit increased NIR (near-infrared) reflectance, which indicates improved leaf structure and chlorophyll content. This suggests that remote sensing methods might be used to track crop nutrient status in real time. Growers may now identify early indicators of nutrient stress and adjust input applications appropriately thanks to the potential this creates for precision nutrient management [60].
Dragon fruit farming is often supported by South Miami’s subtropical environment, which features high humidity, average annual temperatures close to 24 °C, and more than 1400 mm of rainfall. However, this climate also presents difficulties, such as excessive soil wetness and a higher risk of illness [61,62]. The native soils of South Miami meet the requirements for dragon fruit, which are well-drained, sandy loam soils with a modest amount of organic matter. However, in order to enhance water retention and nutrient supply, organic amendments are frequently required [61,63,64,65]. While tunnel or shielded systems cushion temperature extremes, manage humidity, and prevent excessive moisture, open-field growing in this environment might result in waterlogging and fungal problems during the rainy season. This improves fruit quality and lowers the incidence of illness [1,61]. These biophysical issues are addressed at the FIU Organic Garden through the use of raised beds, organic matter, and cautious irrigation best management practices suggested in the literature for subtropical dragon fruit production [61,62]. Although South Miami has a generally pleasant climate, site-specific management is necessary to reduce the dangers of excessive humidity, rainfall, and sandy soils and guarantee sustainable yields in both open and protected environments.
5. Conclusions
This study revealed significant differences in plant growth and nutrient concentration throughout a period of plant growth among the RP, YP and WP plant species in an open and high tunnel environment. YP plant species thrived in terms of survival, with reduced disease symptoms inside the high tunnel facility better than the open environmental conditions before 120 DAP. All pitaya plants grown inside high tunnels have high concentrations of selected nutrients after 365 days, indicating that the regulated environment may eventually improve nutrient uptake. Vermicompost and growing environmental conditions affected the amounts of nutrients in the soil. This study shows that the growth environment and vermicompost treatments have a substantial impact on pitaya plant growth and nutrient uptake. Based on the conditions and soil type studied in this experiment, an application rate of 10 t/acre (T3) vermicompost was optimal for improving soil fertility and nutrient uptake. This recommendation is specific to the tested pitaya species, vermicompost source, and subtropical soil and climate conditions and may not be generalized to all production systems. It avoids the nutrient dilution or toxicity observed at 20 t/acre while still meeting the nutrient requirements for plant growth. Vermicompost’s long-term impacts on the dynamics of soil nutrients showed significant variation between controlled and open settings, indicating the necessity of customized fertilization strategies for selected farming systems. The foliar- and canopy-level spectral reflectance of RP, YP, and WP species indicates that variations in leaf pigments, water absorption, and canopy structures are the causes of these reflectance discrepancies. Future studies should examine how vermicompost affects soil health metrics including microbial activity and salt accumulation over the long run. A more thorough understanding of plant performance will also be possible by combining physiological and biochemical measurements, such as biomass accumulation, osmolyte levels, and chlorophyll content, with reproductive characteristics like blooming and yield. It is also advised to combine ground-based indicators with spectral reflectance data to improve precision nutrient management in dragon fruit production systems. Our research provides practical insights on how to increase pitaya productivity and sustainability through specific farming methods.
Author Contributions
Conceptualization, P.B.; methodology, P.B. and M.S.B.B.; software, P.B.; validation, P.B.; formal analysis, P.B.; investigation, P.B.; resources, K.J. and M.S.B.B.; data curation, P.B.; writing—original draft preparation, P.B.; writing—review and editing, P.B.; K.J. and M.S.B.B.; visualization, P.B. and M.S.B.B.; supervision, K.J. and M.S.B.B.; project administration, M.S.B.B.; funding acquisition, M.S.B.B. All authors have read and agreed to the published version of the manuscript.
Funding
This research is primarily supported by the USDA-NRCS, USDA-NIFA grants under the award numbers NR224209XXXXG001; AWD13273; NR233A750011G026; AWD15131; 2023-70001-40999; and 2023-77040-41154.
Institutional Review Board Statement
Not applicable.
Informed Consent Statement
Not applicable.
Data Availability Statement
The data presented in this study are available on request from the corresponding author. The data is not publicly available due to privacy or ethical restrictions.
Acknowledgments
We offer our sincere thanks to Ivan Oyege, Divya Yuvaraj, Moses Kiwanuka, Samarah Martin, Jordan, Prats and Sudan Chundali for their invaluable help in the field experiment, data collection, support and encouragement and Peter Fedele of the Lions Fruit Farm, Miami, Florida.
Conflicts of Interest
The authors declare no conflicts of interest.
References
- Mizrahi, Y.; Nerd, A. Climbing and columnar cacti: New arid land fruit crops. Perspect. New Crops New Uses 1999, 1, 358–366. [Google Scholar]
- Pasko, P.; Galanty, A.; Zagrodzki, P.; Ku, Y.G.; Luksirikul, P.; Weisz, M.; Gorinstein, S. Bioactivity and cytotoxicity of different species of pitaya fruits–A comparative study with advanced chemometric analysis. Food Biosci. 2021, 40, 100888. [Google Scholar] [CrossRef]
- Liaotrakoon, W.; Van Buggenhout, S.; Christiaens, S.; Houben, K.; De Clercq, N.; Dewettinck, K.; Hendrickx, M.E. An explorative study on the cell wall polysaccharides in the pulp and peel of dragon fruits (Hylocereus spp.). Eur. Food Res. Technol. 2013, 237, 341–351. [Google Scholar] [CrossRef]
- Bordoh, P.K.; Ali, A.; Dickinson, M.; Siddiqui, Y. Antimicrobial effect of rhizome and medicinal herb extract in controlling postharvest anthracnose of dragon fruit and their possible phytotoxicity. Sci. Hortic. 2020, 265, 109249. [Google Scholar] [CrossRef]
- Martinez, O.; Lazcano, C.; Rojas, M.; Ibañez, M.; Lozano, D. The effect of ethylene on sprouting of areoles of pitahaya (Hylocereus undatus). Acta Hortic. 1996, 434, 261–268. [Google Scholar]
- Nerd, A.; Mizrahi, Y. The effect of ripening stage of fruit quality after storage of yellow pitaya. Postharvest Biol. Technol. 1999, 15, 99–105. [Google Scholar] [CrossRef]
- Tel-Zur, N. Research and development of pitahayas-dragonfruit-vine cacti: Limitations and challenges and the current global market. Acta Hortic. 2013, 1067, 365–370. [Google Scholar] [CrossRef]
- Putriningtyas, N.D.; Cahyati, W.H.; Kusuma, R.A.; Nugraheni, K.; Nisa, A.A. A New Opportunity Related Hypercholesterolemic and the Improvement of Glucose Levels, Lipid Profiles, and Microbial Activity: Red Dragon Fruit (Hylocereus polyrhizus) Peel Yogurt and Animal Study. Unnes J. Public Health 2024, 13, 80–92. [Google Scholar] [CrossRef]
- Omidizadeh, A.; Yusof, R.M.; Ismail, A.; Roohinejad, S.; Nateghi, L.; Bakar, M.Z.A. Cardioprotective compounds of red pitaya (Hylocereus polyrhizus) fruit. J. Food Agric. Environ. 2011, 9, 152–156. [Google Scholar]
- Laekemariam, F.; Kibret, K.; Mamo, T.; Gebrekidan, H. Soil–plant nutrient status and their relations in maize-growing fields of Wolaita Zone, southern Ethiopia. Commun. Soil Sci. Plant Anal. 2016, 47, 1343–1356. [Google Scholar] [CrossRef]
- Aref, F. Influence of zinc and boron nutrition on copper, manganese and iron concentrations in maize leaf. Aust. J. Basic Appl. Sci. 2011, 5, 52–62. [Google Scholar]
- DeLoose, M.; Clúa, J.; Cho, H.; Zheng, L.; Masmoudi, K.; Desnos, T.; Krouk, G.; Nussaume, L.; Poirier, Y.; Rouached, H. Recent advances in unraveling the mystery of combined nutrient stress in plants. Plant J. 2024, 117, 1764–1780. [Google Scholar] [CrossRef] [PubMed]
- Savci, S. An agricultural pollutant: Chemical fertilizer. Int. J. Environ. Sci. Dev. 2012, 3, 73–76. [Google Scholar] [CrossRef]
- Oyege, I.; Bhaskar, M.S.B. Effects of Vermicompost on Soil and Plant Health and Promoting Sustainable Agriculture. Soil Syst. 2023, 7, 101. [Google Scholar] [CrossRef]
- Dey, S.; Datta, S.; Alam, M.; Datta, P. Impacts of vermicompost and different organic growing media on the morpho-physiological characteristics of dragon fruit (Hylocereus costaricensis L.) in new alluvial zone of West Bengal. Pharma Innov. 2022, 11, 315–318. [Google Scholar]
- Da Silva Ferreira, M.V.; de Moraes, I.A.; Passos, R.V.L.; Barbin, D.F.; Barbosa, J.L., Jr. Determination of pitaya quality using portable NIR spectroscopy and innovative low-cost electronic nose. Sci. Hortic. 2023, 310, 111784. [Google Scholar] [CrossRef]
- Merzlyak, M.N. Modeling pigment contributions to spectral reflection of apple fruit. Photochem. Photobiol. Sci. 2006, 5, 748–754. [Google Scholar] [CrossRef]
- Kitinoja, L.; Kasmire, R.F. Making the link: Extension of postharvest technology. Postharvest Technol. Hort. Crops 2002, 3311, 481–509. [Google Scholar]
- Ray, R.C.; Ravi, V. Post harvest spoilage of sweetpotato in tropics and control measures. Crit. Rev. Food Sci. Nutr. 2005, 45, 623–644. [Google Scholar] [CrossRef]
- Shaik, A.; Singh, S.; Montague, T.; Siebecker, M.G.; Ritchie, G.; Wallace, R.W.; Stevens, R. Comparison of organic eggplant yields under open-field and high tunnel production systems in Texas. Farming Syst. 2023, 1, 100049. [Google Scholar] [CrossRef]
- Warusavitharana, A.J.; Peiris, K.H.S.; Wickramatilake, K.M.D.G.; Ekanayake, A.T.; Hettiarachchi, H.A.D.S.; Bamunuarachchi, J. Performance of dragon fruit (Hylocerus undatus) in the low country wet zone (LCWZ) of Sri Lanka. Acta Hortic. 2017, 1178, 31–34. [Google Scholar] [CrossRef]
- Dong, M. Research on Varietal Improvement and Cultivation Techniques for Dragon Fruit (Pitaya). Int. J. Hortic. 2024, 14, 414–425. [Google Scholar] [CrossRef]
- Li, P.; Ma, X.; Li, Z.; Yao, H.; Lu, G.; Hu, H.; Ding, Y. A review on the advances of dragon fruit. Trop. Plants 2024, 3, e041. [Google Scholar] [CrossRef]
- Sridhar, B.B.M.; Vincent, R.K. Spectral reflectance measurements of a microcystis bloom in upper Klamath Lake, Oregon. J. Great Lakes Res. 2007, 33, 279–284. [Google Scholar] [CrossRef]
- Sridhar, N.; Sridhar, B.B.M. Assessment of spectral reflectance to discriminate and monitor the mangrove tree species in South Florida. Int. J. Adv. Remote Sens. GIS 2022, 11, 3521–3530. [Google Scholar]
- Oyege, I.; Bhaskar, M.S.B. The role of vermicompost and vermicompost tea in sustainable corn production and fall armyworm suppression. Agric. 2025, 15, 1433. [Google Scholar] [CrossRef]
- Oyege, I.; Bhaskar, M.S.B. Residual impacts of vermicompost-derived nutrients on strawberry-corn rotation in South Florida. Environ. 2025, 12, 171. [Google Scholar]
- Rey, C.S.; Oyege, I.; Shetty, K.G.; Jayachandran, K.; Bhaskar, M.S.B. Evaluation of vermicompost, seaweed, and algal fertilizers on soil fertility and plant production of sunn hemp. Soil Syst. 2024, 8, 132. [Google Scholar] [CrossRef]
- Oyege, I.; Bhaskar, M.S.B. Evaluation of vermicompost and vermicompost tea application on corn (Zea mays) growth and physiology using optical plant sensors. J Plant Nutr. 2024, 48, 1275–1293. [Google Scholar] [CrossRef]
- Belbase, P.; Bhaskar, M.S.B.; Jayachandran, K.; Bhat, M. Comparative evaluation of dragon fruit performance in high tunnel and field environments in South Florida. In Proceedings of the SSSA Annual Meetings, St. Louis, MO, USA, 29 October–1 November 2023. [Google Scholar]
- Lim, S.L.; Wu, T.Y.; Lim, P.N.; Shak, K.P.Y. The use of vermicompost in organic farming: Overview, effects on soil and economics. J. Sci. Food Agric. 2015, 95, 1143–1156. [Google Scholar] [CrossRef]
- Balasubramanian, A.; Anjali, K.S.; Swathiga, G.; Abbas, G.; Krishnan, S.N. Soil nutrient dynamics and cycling under agroforestry. In Agroforestry to Combat Global Challenges: Current Prospects and Future Challenges; Springer Nature: Singapore, 2024; pp. 109–125. [Google Scholar]
- Masquelier, S.; Sozzi, T.; Bouvet, J.C.; Bésiers, J.; Deogratias, J.M. Conception and development of recycled raw materials (coconut fiber and bagasse)-based substrates enriched with soil microorganisms (Arbuscular Mycorrhizal fungi, Trichoderma spp. and Pseudomonas spp.) for the soilless cultivation of tomato (S. lycopersicum). Agronomy 2022, 12, 767. [Google Scholar] [CrossRef]
- Crane, J.H.; Balerdi, C.F. Pitaya (Dragonfruit) Growing in the Florida Home Landscape (HS303). University of Florida IFAS Extension. 2024. Available online: https://edis.ifas.ufl.edu/publication/HS303 (accessed on 1 June 2025).
- Singh, R.; Sharma, R.R.; Kumar, S.; Gupta, R.K.; Patil, R.H. Vermicompost substitution influences growth, physiological disorders, fruit yield and quality of strawberry (Fragaria × ananassa Duch.). Bioresour. Technol. 2008, 99, 8507–8511. [Google Scholar] [CrossRef] [PubMed]
- Dominguez, J.E.C.A.; Edwards, C.A. Biology and ecology of earthworm species used for vermicomposting. In Vermiculture Technology: Earthworms, Organic Waste and Environmental Management; CRC Press: Boca Raton, FL, USA, 2011; pp. 27–40. [Google Scholar]
- Moreira, R.A.; Cruz, M.M.; Fernandes, D.R.; Silva, E.B.; Oliveira, J. Nutrient accumulation at the initial growth of pitaya plants according to phosphorus fertilization. Trop. Agric. Res. 2016, 46, 230–237. [Google Scholar] [CrossRef]
- Lazcano, C.; Domínguez, J. The use of vermicompost in sustainable agriculture: Impact on plant growth and soil fertility. Soil Nutr. 2011, 10, 187. [Google Scholar]
- Atiyeh, R.M.; Lee, S.; Edwards, C.A.; Arancon, N.Q.; Metzger, J.D. The influence of humic acids derived from earthworm-processed organic wastes on plant growth. Bioresour. Technol. 2002, 84, 7–14. [Google Scholar] [CrossRef]
- Sharma, A.; Sharma, R.P.; Katoch, V.; Sharma, G.D. Influence of vermicompost and split applied nitrogen on growth, yield, nutrient uptake and soil fertility in pole type French bean (Phaseolus vulgaris L.) in an acid alfisol. Legume Res. 2018, 41, 126–131. [Google Scholar]
- Moreira, R.A.; Silva, M.S.L.; Dantas, B.F.; Silva, J.A.G. Nutrient accumulation and distribution in pitaya (Hylocereus undatus) grown in the semi-arid region of Brazil. Rev. Bras. Frutic. 2016, 38, e-385. [Google Scholar]
- Woolley, A.; Sumpter, S.; Lee, M.; Xu, J.; Barry, S.; Wang, W.; Rajashekar, C.B. Accumulation of mineral nutrients and phytochemicals in lettuce and tomato grown in high tunnel and open field. Am. J. Plant Sci. 2019, 10, 125–138. [Google Scholar] [CrossRef]
- Knewtson, S.J.; Carey, E.E.; Kirkham, M.B. Management practices of growers using high tunnels in the central great plains of the United States. HortTechnology 2010, 20, 639–645. [Google Scholar] [CrossRef]
- Lima, D.D.C.; Mendes, N.V.B.; Corrêa, M.C.D.M.; Taniguchi, C.A.K.; Queiroz, R.F.; Natale, W. Growth and nutrient accumulation in the aerial part of red Pitaya (Hylocereus sp.). Rev. Bras. Frutic. 2019, 41, e-030. [Google Scholar] [CrossRef]
- Silva, L.S.D. Caracterização Fenológica, Adubação e Potencial Agronômico de Espécies de Pitaia. Master’s Thesis, Universidade Estadual do Oeste do Paraná, Cascavel, Brazil, 2023. [Google Scholar]
- Zaller, J.G. Vermicompost as a substitute for peat in potting media: Effects on germination, biomass allocation, yields and fruit quality of three tomato varieties. Sci. Hortic. 2007, 112, 191–199. [Google Scholar] [CrossRef]
- Tian, S.; Brecht, J.K.; Rathinasabapathi, B.; Zhao, X. Influence of soil and nutrient management practices on crop productivity and quality in high tunnel organic leafy green production. HortScience 2023, 58, 1610–1621. [Google Scholar] [CrossRef]
- Marshall, K.; Erich, S.; Hutton, M.; Hutchinson, M.; Mallory, E. Nitrogen availability from compost in high tunnel tomato production. Compost Sci. Util. 2016, 24, 147–158. [Google Scholar] [CrossRef]
- Chatterjee, R.; Jana, J.C.; Paul, P.K. Vermicompost substitution influences shelf life and fruit quality of tomato (Lycopersicon esculentum Mill.). Am. J. Agric. Sci. Technol. 2013, 1, 69–76. [Google Scholar] [CrossRef]
- Marschner, H. Mineral Nutrition of Higher Plants, 2nd ed.; Academic Press: London, UK, 1995. [Google Scholar]
- Bi, G.; Li, T.; Gu, M.; Evans, W.B.; Williams, M. Effects of Fertilizer Source and Rate on Zinnia Cut Flower Production in a High Tunnel. Horticulturae 2021, 7, 333. [Google Scholar] [CrossRef]
- Pierre, J.F.; Jacobsen, K.L.; Wszelaki, A.; Butler, D.; Velandia, M.; Woods, T.; Sideman, R.; Grossman, J.; Coolong, T.; Hoskins, B.; et al. Sustaining Soil Health in High Tunnels: A Paradigm Shift Toward Soil-Centered Management. HortTechnology 2024, 34, 594–603. [Google Scholar] [CrossRef]
- Zhang, L.; Hu, S.; Yang, H.; Wu, T.; Tong, Q.; Zhang, F. The Effects of Solar Irradiance Spectra on Calculation of Narrow Band Top-of-Atmosphere Reflectance. IEEE J. Sel. Top. Appl. Earth Obs. Remote Sens. 2013, 7, 49–58. [Google Scholar] [CrossRef]
- Li, Y.; Xu, X.; Lei, B.; Zhuang, J.; Zhang, X.; Hu, C.; Cui, J.; Liu, Y. Magnesium-Nitrogen Co-Doped Carbon Dots Enhance Plant Growth Through Multifunctional Regulation in Photosynthesis. Chem. Eng. J. 2021, 422, 130114. [Google Scholar] [CrossRef]
- Jia, M.; Li, D.; Colombo, R.; Wang, Y.; Wang, X.; Cheng, T.; Zhu, Y.; Yao, X.; Xu, C.; Ouer, G.; et al. Quantifying Chlorophyll Fluorescence Parameters from Hyperspectral Reflectance at the Leaf Scale Under Various Nitrogen Treatment Regimes in Winter Wheat. Remote Sens. 2019, 11, 2838. [Google Scholar] [CrossRef]
- Yang, Z.; Tian, J.; Feng, K.; Gong, X.; Liu, J. Application of a Hyperspectral Imaging System to Quantify Leaf-Scale Chlorophyll, Nitrogen and Chlorophyll Fluorescence Parameters in Grapevine. Plant Physiol. Biochem. 2021, 166, 723–737. [Google Scholar] [CrossRef]
- Moran, J.; Mitchell, A.; Goodmanson, G.; Stockburger, K. Differentiation Among Effects of Nitrogen Fertilization Treatments on Conifer Seedlings by Foliar Reflectance: A Comparison of Methods. Tree Physiol. 2000, 20, 1113–1120. [Google Scholar] [CrossRef] [PubMed]
- Gausman, H.W. Reflectance of Leaf Components. Remote Sens. Environ. 1977, 6, 1–9. [Google Scholar] [CrossRef]
- Weyer, L.G.; Lo, S.C. Spectra-Structure Correlations in the Near-Infrared. Vib. Spectrosc. 2002, 3, 1817–1837. [Google Scholar]
- Gao, X.; Li, S.; He, Y.; Yang, Y.; Tian, Y. Spectrum Imaging for Phenotypic Detection of Greenhouse Vegetables: A Review. Comput. Electron. Agric. 2024, 225, 109346. [Google Scholar] [CrossRef]
- Ali, R.; Rahman, A.; Mahmod, N.; Ramachandran, V. Proximate analysis of dragon fruit (Hylocereus polyrhizus). Am. J. Appl. Sci. 2009, 6, 1341–1346. [Google Scholar] [CrossRef]
- Nerd, A.; Mizrahi, Y. Reproductive biology of cactus fruit crops. In Cactus: Biology and Biotechnology; Nobel, P.S., Ed.; Springer: Dordrecht, The Netherlands, 2010; pp. 61–78. [Google Scholar] [CrossRef]
- Ortiz-Hernández, Y.D.; Carrillo-Salazar, J. Pitahaya (Hylocereus spp.): A Short Review. Commun. Sci. 2012, 3, 220–237. [Google Scholar]
- Xu, J.; Wang, Z.; Shi, T.; He, Y.; Liu, Z. Growth Characteristics and High Sweetness Cultivation Management Plan of Thornless Yellow Dragon Fruit. Int. J. Hortic. 2024, 14, 237–249. [Google Scholar] [CrossRef]
- Reis, L.A.C.; Cruz, M.D.C.M.; Silva, E.D.B.; Rabelo, J.M.; Fialho, C.M.T. Effects of Liming on the Growth and Nutrient Concentrations of Pitaya Species in Acidic Soils. Aust. J. Crop Sci. 2020, 14, 1756–1763. [Google Scholar] [CrossRef]
Disclaimer/Publisher’s Note: The statements, opinions and data contained in all publications are solely those of the individual author(s) and contributor(s) and not of MDPI and/or the editor(s). MDPI and/or the editor(s) disclaim responsibility for any injury to people or property resulting from any ideas, methods, instructions or products referred to in the content. |
© 2025 by the authors. Licensee MDPI, Basel, Switzerland. This article is an open access article distributed under the terms and conditions of the Creative Commons Attribution (CC BY) license (https://creativecommons.org/licenses/by/4.0/).