Article

Soil Solution Viscosity Reduces CO2 Emissions in Tropical Soils: Implications for Climate Change Mitigation

by
Arianis Ibeth Santos-Nicolella
1,2,*,
Kleve Freddy Ferreira Canteral
1,
Wanderson Benerval De Lucena
3,4,
Maria Elisa Vicentini
1,
Alan Rodrigo Panosso
1,
Kurt Spokas
5,
Glauco de Souza Rolim
1,
Thaís Rayane Gomes da Silva
1 and
Newton La Scala, Jr.
1
1
School of Agricultural and Veterinary Sciences, Sao Paulo State University (UNESP), Jaboticabal 14884-900, SP, Brazil
2
Facultad de Ciencias Agropecuarias, Universidad de Panamá, Chiriquí 0819-07289, Panama
3
SolloAgro Program, Luiz de Queiroz College of Agriculture, Sao Paulo University, Piracicaba 13418-900, SP, Brazil
4
UNIMT Integrate Faculties, Água Boa Unit, Água Boa 78635-000, MT, Brazil
5
United States Department of Agriculture, Agricultural Research Service, St. Paul, MN 55108, USA
*
Author to whom correspondence should be addressed.
Soil Syst. 2025, 9(3), 101; https://doi.org/10.3390/soilsystems9030101
Submission received: 1 July 2025 / Revised: 4 August 2025 / Accepted: 5 August 2025 / Published: 13 September 2025

Abstract

Soil CO2 emissions, driven primarily by microbial respiration, represent a major component of terrestrial carbon flux and play a crucial role in global climate change. Although several soil physicochemical factors regulating microbial activity are well known, the role of soil solution viscosity remains largely unexplored. This study evaluated how polyethylene glycol (PEG6000)-induced increases in soil solution viscosity affect microbial activity-derived CO2 emissions in a Rhodic Ferralsol (eutric). Three concentrations of PEG6000 (50, 75, and 100 g L−1), corresponding to viscosities of 1.93, 2.76, and 3.88 cP, respectively, were compared to a water-based control (1.11 cP). Soil CO2 emissions, soil O2 capture, temperature, and water content were measured over a 60-day period using standard methods. Results showed significant reductions in cumulative CO2 emissions of 20%, 25%, and 12% for PEG6000 treatments, respectively, compared to the control. Decreased O2 capture at viscosities of 1.93 and 2.76 cP (50 and 75 g L−1, respectively) indicated reduced microbial activity. These findings reveal a previously underappreciated biophysical mechanism regulating soil carbon emissions. Understanding and managing soil solution viscosity could offer a novel strategy to mitigate CO2 emissions in tropical soils, thus contributing to climate change mitigation and sustainable soil management, particularly in highly weathered tropical ecosystems.

Graphical Abstract

1. Introduction

Global carbon dioxide (CO2) emissions reached approximately 10.9 Pg-C yr−1 during the last decade, representing a 144% increase compared to pre-industrial levels. Alongside methane (CH4) and nitrous oxide (N2O), which emitted between 335 and 383 Tg CH4 yr−1 and 4.2–11.4 Tg N2O yr−1 between 2010 and 2019, these gases constitute the main contributors to anthropogenic climate change [1]. The predominant sources of these emissions include fossil fuel combustion and activities related to land use change and management, such as agriculture, forestry, and other land uses (AFOLU) [2]. Current atmospheric CO2 concentrations are ~427 ppm [3], whereas projections indicate that by 2100, CO2 levels could range from 393 ppm in the low-emission scenario (SSP1-1.9) to 1135 ppm in the very high-emission scenario (SSP5-8.5) [4].
Between 2010 and 2019, AFOLU contributed between 13 and 21% of global greenhouse gas emissions, equivalent to 5.9 Gt CO2, 157 Mt CH4, and 6.6 Mt N2O per year [2]. In Brazil, emissions derived from agricultural products and land use changes accounted for 25.8% and 38.0% of the national total of CO2-eq in 2020, respectively [5]. To mitigate these emissions, initiatives such as the global RECSOIL program have promoted sustainable soil management to increase soil organic carbon (SOC) [6]. Brazil has surpassed its national emission reduction targets, committing to a 37% reduction by 2025 and a 50% reduction by 2030, relative to 2005 levels [5,7].
AFOLU is not only a source of emissions but also acts as a carbon sink, with significant potential to mitigate climate change through carbon capture and storage. Agriculture is a key sector for large-scale short-term CO2 removal, primarily through SOC management [2,8,9], which constitutes the largest terrestrial carbon reservoir, with approximately 677 Pg in the top 30 cm of soil and a global sequestration capacity estimated at 2.45 Pg-C yr−1 [10].
To design effective strategies for mitigating soil carbon loss, it is crucial to understand microbial respiration, which is responsible for a large proportion of organic matter (OM) decomposition and, consequently, CO2 release [11]. Microorganisms access OM through inter- and intra-aggregate soil pores, depending on their motility in the soil solution [12,13,14]. In tropical soils, favorable temperature and moisture conditions increase OM mineralization due to intensified microbial activity [15,16,17]. However, studies are still needed to elucidate the mechanisms regulating this motility and mineralization to optimize carbon sequestration and reduce emissions.
The soil solution, which harbors most microorganisms, presents physical properties such as viscosity that influence microbial flow and movement [14,18]. In other liquid media, such as marine waters or culture media, viscosity has been shown to affect microbial motility rates [19,20,21,22,23,24]. Recently, it has been hypothesized that soil solution viscosity could regulate microbial CO2 emissions by affecting microbial diffusion, although this hypothesis lacks empirical evidence under real conditions [25].
Some biopolymers, such as gelatin, sodium alginate, xanthan gum, and polyacrylamide, have been used as viscosity-modifying agents to reduce evapotranspiration; however, they have shown limited soil infiltration [26]. In contrast, polyethylene glycol 6000 (PEG6000), which is water-soluble and low in toxicity, can infiltrate without affecting plant health [27,28] because its molecules are too large to penetrate microbial or plant cells [29]. This makes it an ideal candidate for studying the effects of increased soil solution viscosity on microbial respiration.
This study hypothesizes that soil solution viscosity regulates microbial CO2 emissions. The objective was to evaluate the effect of different viscosities induced by PEG6000 on soil CO2 emissions.

2. Materials and Methods

2.1. Study Area

This study was conducted from September to November 2021 at the Agroclimatology Experimental Station of the School of Agricultural and Veterinary Sciences of São Paulo State University “Júlio de Mesquita Filho” (UNESP) in Jaboticabal, São Paulo, Brazil (21°14′ S, 48°17′ W; 615 m above sea level). The regional climate is classified as B1rB’4a’ [30,31], mesothermally humid, with an average annual precipitation of 1430 mm and an average annual temperature of 22.2 °C [32]. The local soil was classified as Rhodic Ferralsol (eutric) according to the FAO-WRB classification system [33].

2.2. Experimental Design and Treatments

Four treatments were evaluated, consisting of polyethylene glycol 6000 (PEG6000) solutions at concentrations of 0, 50, 75, and 100 g PEG6000 L−1, labeled as C0, C50, C75, and C100, respectively, to increase the viscosity of the solution applied to the soil.
The treatments were applied once at the beginning of the experiment by uniformly distributing a 2 mm layer of PEG6000 solution over the surface of each lysimeter (1 m2) using a manual watering can. This methodology aimed to ensure homogeneous coverage of the treated area, promoting the infiltration of the solution into the soil profile and facilitating contact with the active microbial community at a depth of 0.10 m. The use of lysimeters prevented interference between treatments and concentrated their effects within a restricted area (Figure 1).
Each adjacent lysimeter had an area and depth of 1 m2 and 1 m, respectively. The total area of the experimental site, including the four lysimeters and the space between them, was 9 m2 (Figure 1). The lysimeters consisted of cement boxes built in the ground and filled with local soil, including native vegetation cover (grass). Built in 1985, these structures have maintained stable physical properties over time and accurately represent the soil conditions surrounding them.
The viscosities of the applied solutions were estimated by using an empirical relationship for PEG6000 viscosity at 25 °C, as reported by [34]. A nonlinear regression model was fitted to the data from that study to relate PEG6000 concentration with viscosity, and this equation was then used to model the viscosities at 50, 75, and 100 g PEG6000 L−1 concentrations.
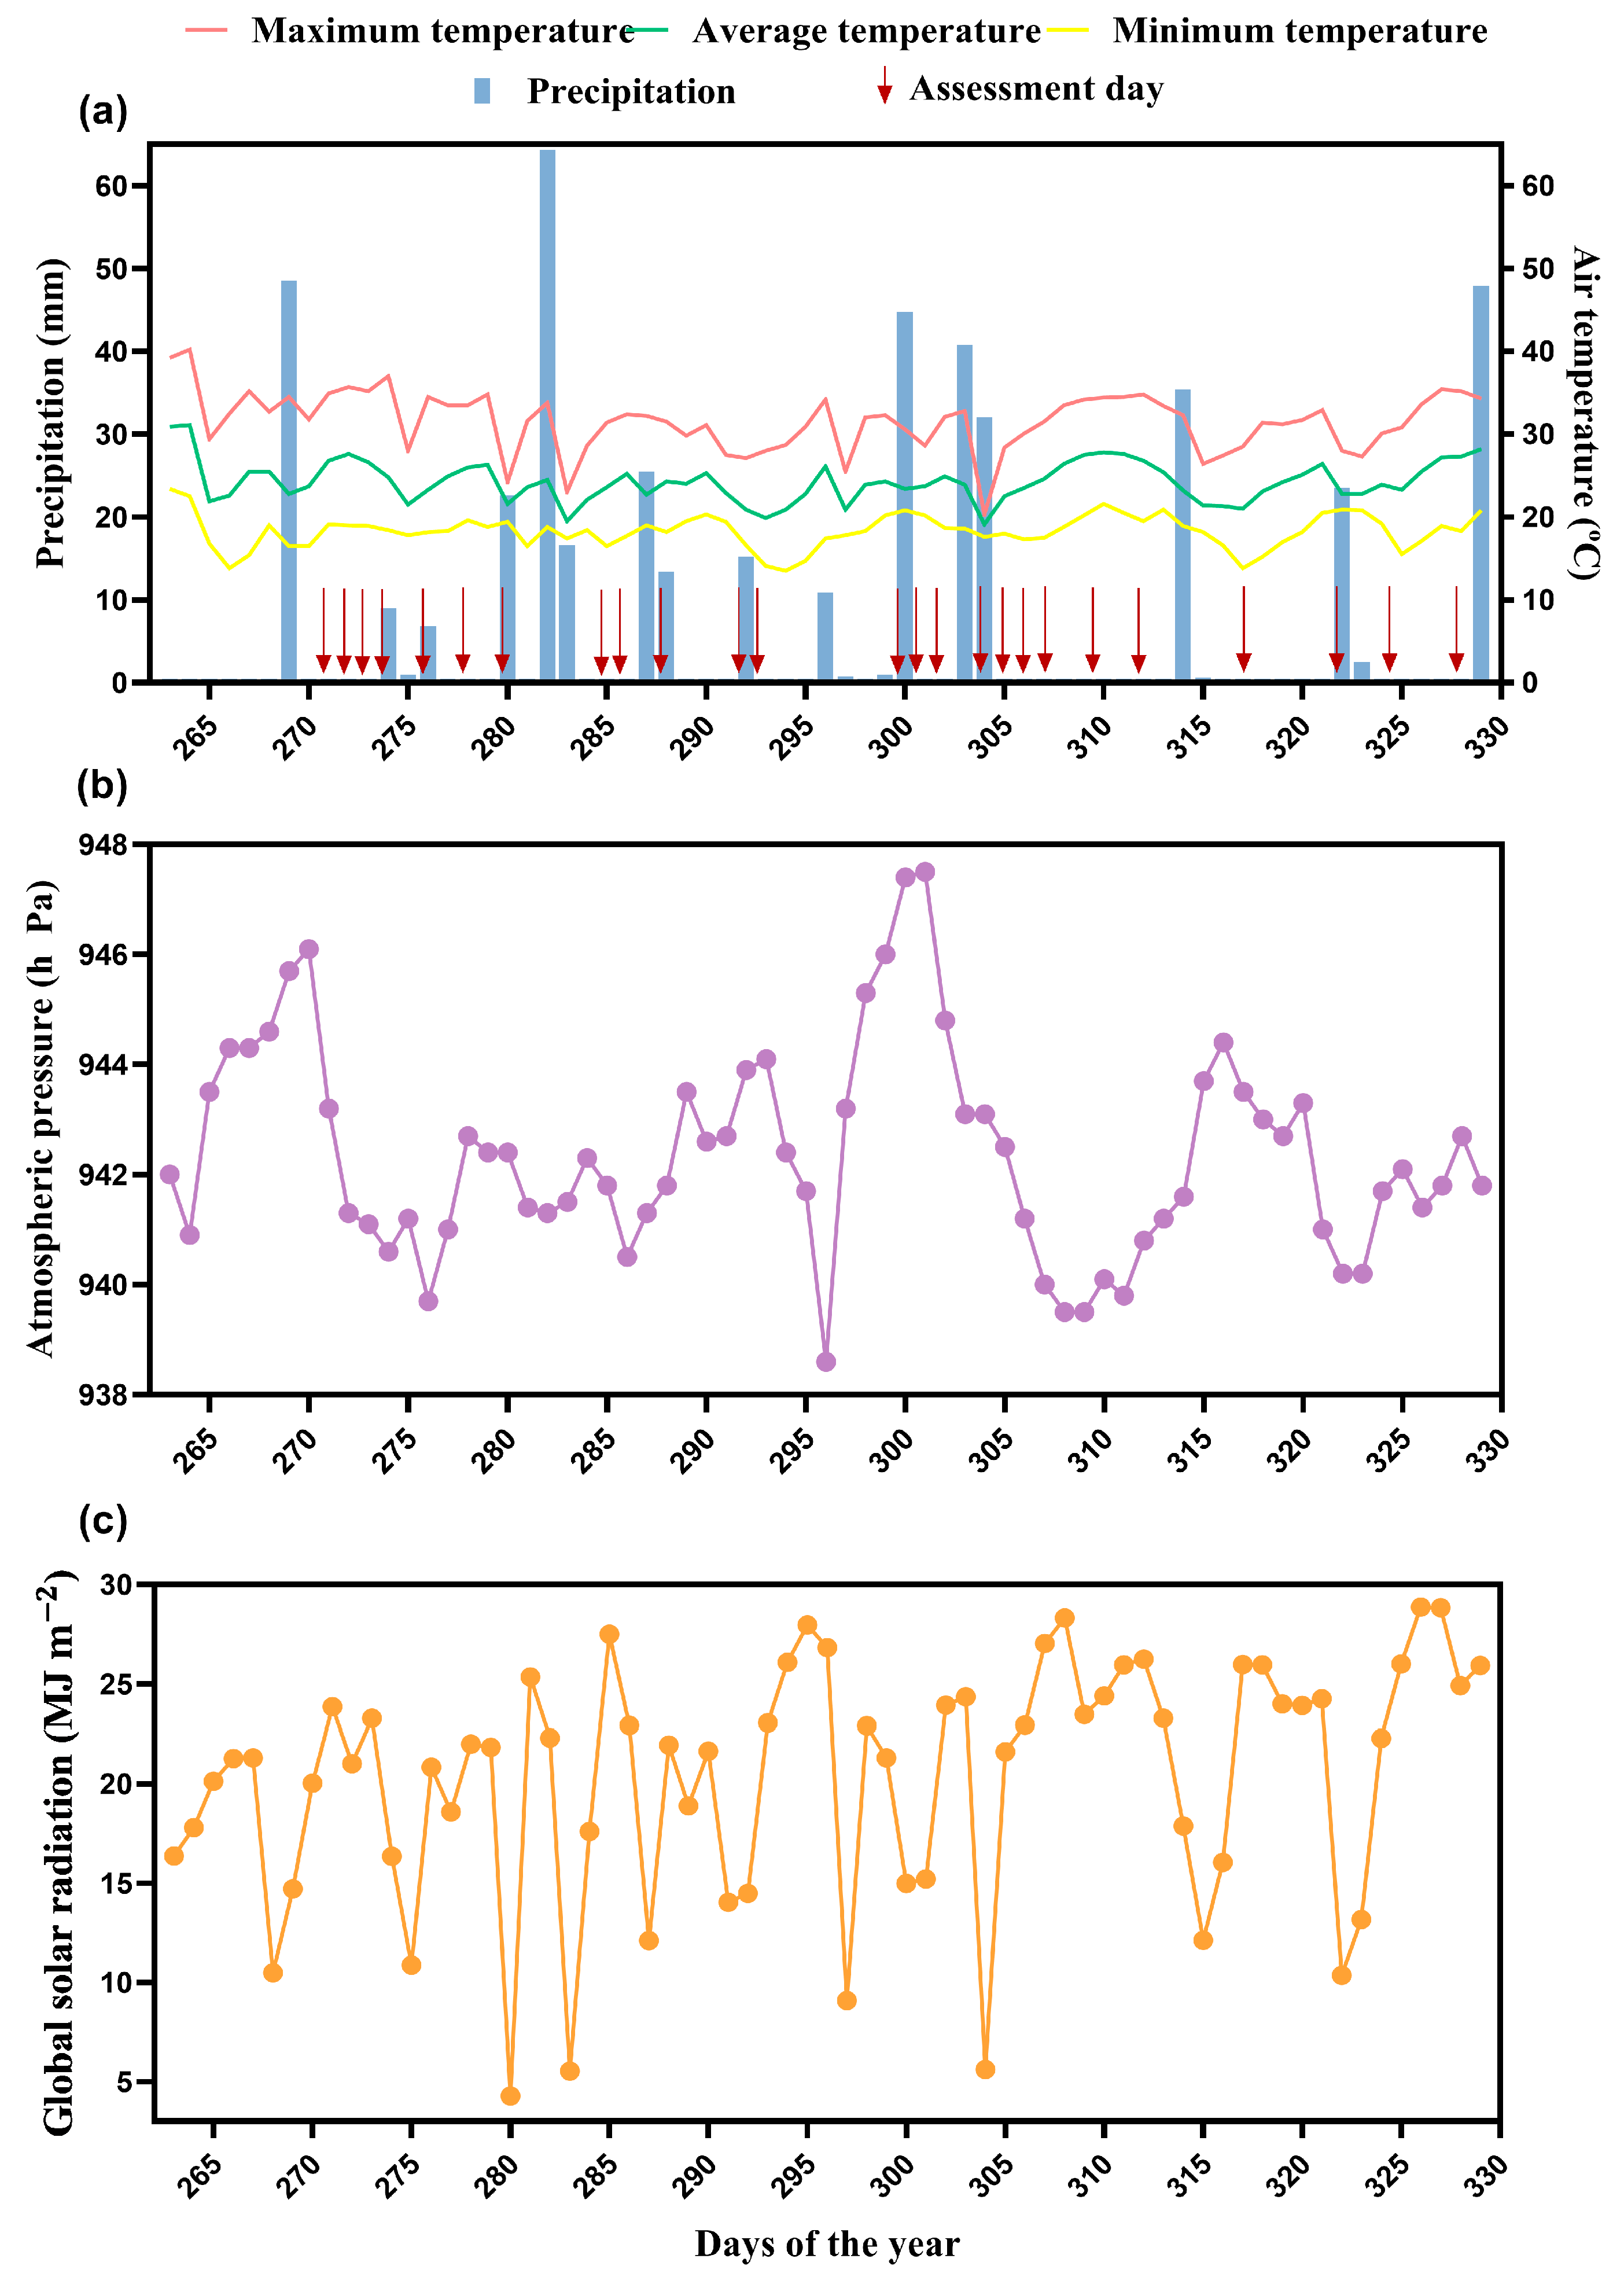
To measure soil CO2 emissions (FCO2) and soil O2 capture (FO2), five polyvinyl chloride (PVC) rings were inserted into the surface of each lysimeter, evenly distributed over the area treated with PEG6000. Each ring, measuring 0.10 m in diameter and 0.04 m in height, served as a coupling interface for the gas measurement chambers, forming five sampling points per treatment group for gas measurements. The same sampling points were used to assess the soil temperature (Ts) and soil water content (SWC) (Figure 1). The variables were measured concurrently on 25 sampling days distributed over a 60-day period between 7:00 and 9:00 a.m., and the sampling days were reported as Julian days. Climatic data (global solar radiation, air temperature, atmospheric pressure, and precipitation) for the study period were obtained from an agroclimatology station located at the same site (Figure 2).

2.3. CO2 Emission, Soil Temperature, and Soil Water Content

Soil CO2 emissions (FCO2) were measured at each sampling point using an automated portable system (LI-8100, LI-COR, Lincoln, NE, USA), which quantifies changes in soil CO2 concentration within a closed chamber connected to PVC collars inserted into the soil using an infrared gas analyzer (IRGA). The total soil CO2 emissions over the 60-day study period were calculated by integrating FCO2 over time.
Soil temperature (Ts) was recorded in the top 0–0.10 m soil layer using a digital thermometer. The soil water content (SWC) at the same depth was determined using portable time-domain reflectometry (TDR-Campbell® system by Hydrosense TM, Campbell Scientific, Garbutt, QLD, Australia). The system was equipped with a probe consisting of two rods, each 12 cm in length, which were inserted vertically into the soil perpendicular to the surface.

2.4. O2 Capture

The oxygen concentration was measured using a fluorescence quenching sensor with ultraviolet (UV) light at 0–25% CO2, using a portable UV flux sensor (CO2 Meter, Inc., Ormond Beach, FL, USA). The UV sensor was connected to a computer, enabling real-time data acquisition through the GasLab® software v2.3.1.4, which was also used to configure and calibrate the device. Soil O2 capture was calculated using the methodologies described by [35,36], by applying the equations presented below.
The soil O2 diffusion rate (dO2/dt) was calculated using the linear interpolation of the oxygen concentration inside the chamber over time Equation (1):
F O 2 ( t ) = d O 2 d t A
where FO2 (t) is the O2 concentration calculated over time, dO2 is the change in concentration with respect to time (dt), and A is the collar-surface area [37,38]. The sensor was mounted on a 0.055 m high PVC cap placed on a 0.03 m high PVC collar, forming a 0.085 m high chamber with a volume of 0.00066 m3 (V) and a soil contact area of 0.008 m2 (A).
The volume measured using the sensor (ppm) was converted to mol of O2 using the ideal gas equation (Equation (2)):
P(∆V) = (∆n) RT
where P is the mean atmospheric pressure (Pa) over the study period (Figure 2b); ∆V is the variation of captured O2 (ppm), times the chamber volume, times 1 × 10⁻⁶ (m−3 s−1); R is the constant for two perfect gases (8.31 J mol−1 K−1); and T is at air temperature (K). The results are expressed in terms of variation of O2 (∆n) (mol s−1).
Soil oxygen capture (FO2) in mg m−2 s−1 was determined by linear interpolation of concentration data as a function of time, considering variables such as atmospheric pressure, temperature, and volume of gas retained in the chamber [39,40], as shown in Equation (3):
F O 2 = d O 2   10 6 P M d t   R T   H  
where FO2 is the oxygen capture (mg m−2 s−1); d O 2   / d t is the amount of O2 (ppm) measured at time t (s); P is the mean atmospheric pressure (Pa) over the study period; M is the molar mass of O2 (g m−3); R is the universal gas constant (8.31 J mol−1 K−1); T is the absolute temperature (K); and H  = V/A is the ratio of the chamber volume (V) to the area (A) of the chamber placed on the ground surface.
Similar to CO2 emissions, total soil O2 capture up to day 60 of this study was calculated by integrating FO2 over time [41].

2.5. Data Processing and Analysis

Descriptive statistics (mean, standard deviation, median, interquartile range [IQR], minimum, maximum, standard error of the mean, and coefficient of variation) were calculated for all variables (Table A1). Normality (Shapiro–Wilk test) and homoscedasticity (Bartlett’s test) were evaluated at a 5% significance level to verify ANOVA assumptions. Because the data did not meet these assumptions, cumulative soil CO2 emissions and O2 capture were log-transformed, soil temperature (Ts) was transformed using the lambda method, and soil water content (SWC) was square-root transformed. However, all results are presented in the original scale in the figures and tables.
Temporal variability was analyzed using repeated measures ANOVA at a 5% significance level, complemented by regression analyses of FCO2, FO2, Ts, and SWC. All statistical analyses were performed in the R environment [42].

3. Results

3.1. Viscosity

The nonlinear regression model shown in (Figure 3a) was generated in the present study based on the tabulated data reported by [34], which describes the relationship between viscosity at 25 °C and PEG6000 concentration. These data were extracted exclusively for comparative and analytical purposes only. The model showed a strong positive correlation, with viscosity increasing as a function of PEG6000 concentration, and exhibited a high degree of fit (R2 = 0.99).
Based on this regression, the viscosities corresponding to the PEG6000 solutions used in the experimental treatments were estimated (Figure 3b). The modeled values were 1.11 cP for the control (C0, tap water), 1.93 cP for C50, 2.76 cP for C75, and 3.88 cP for C100. These results confirmed the concentration-dependent increase in viscosity, supported by a coefficient of determination of R2 = 1.00.

3.2. Temporal Variation of Soil CO2 Emission, Soil O2 Capture, Soil Temperature, and Soil Water Content

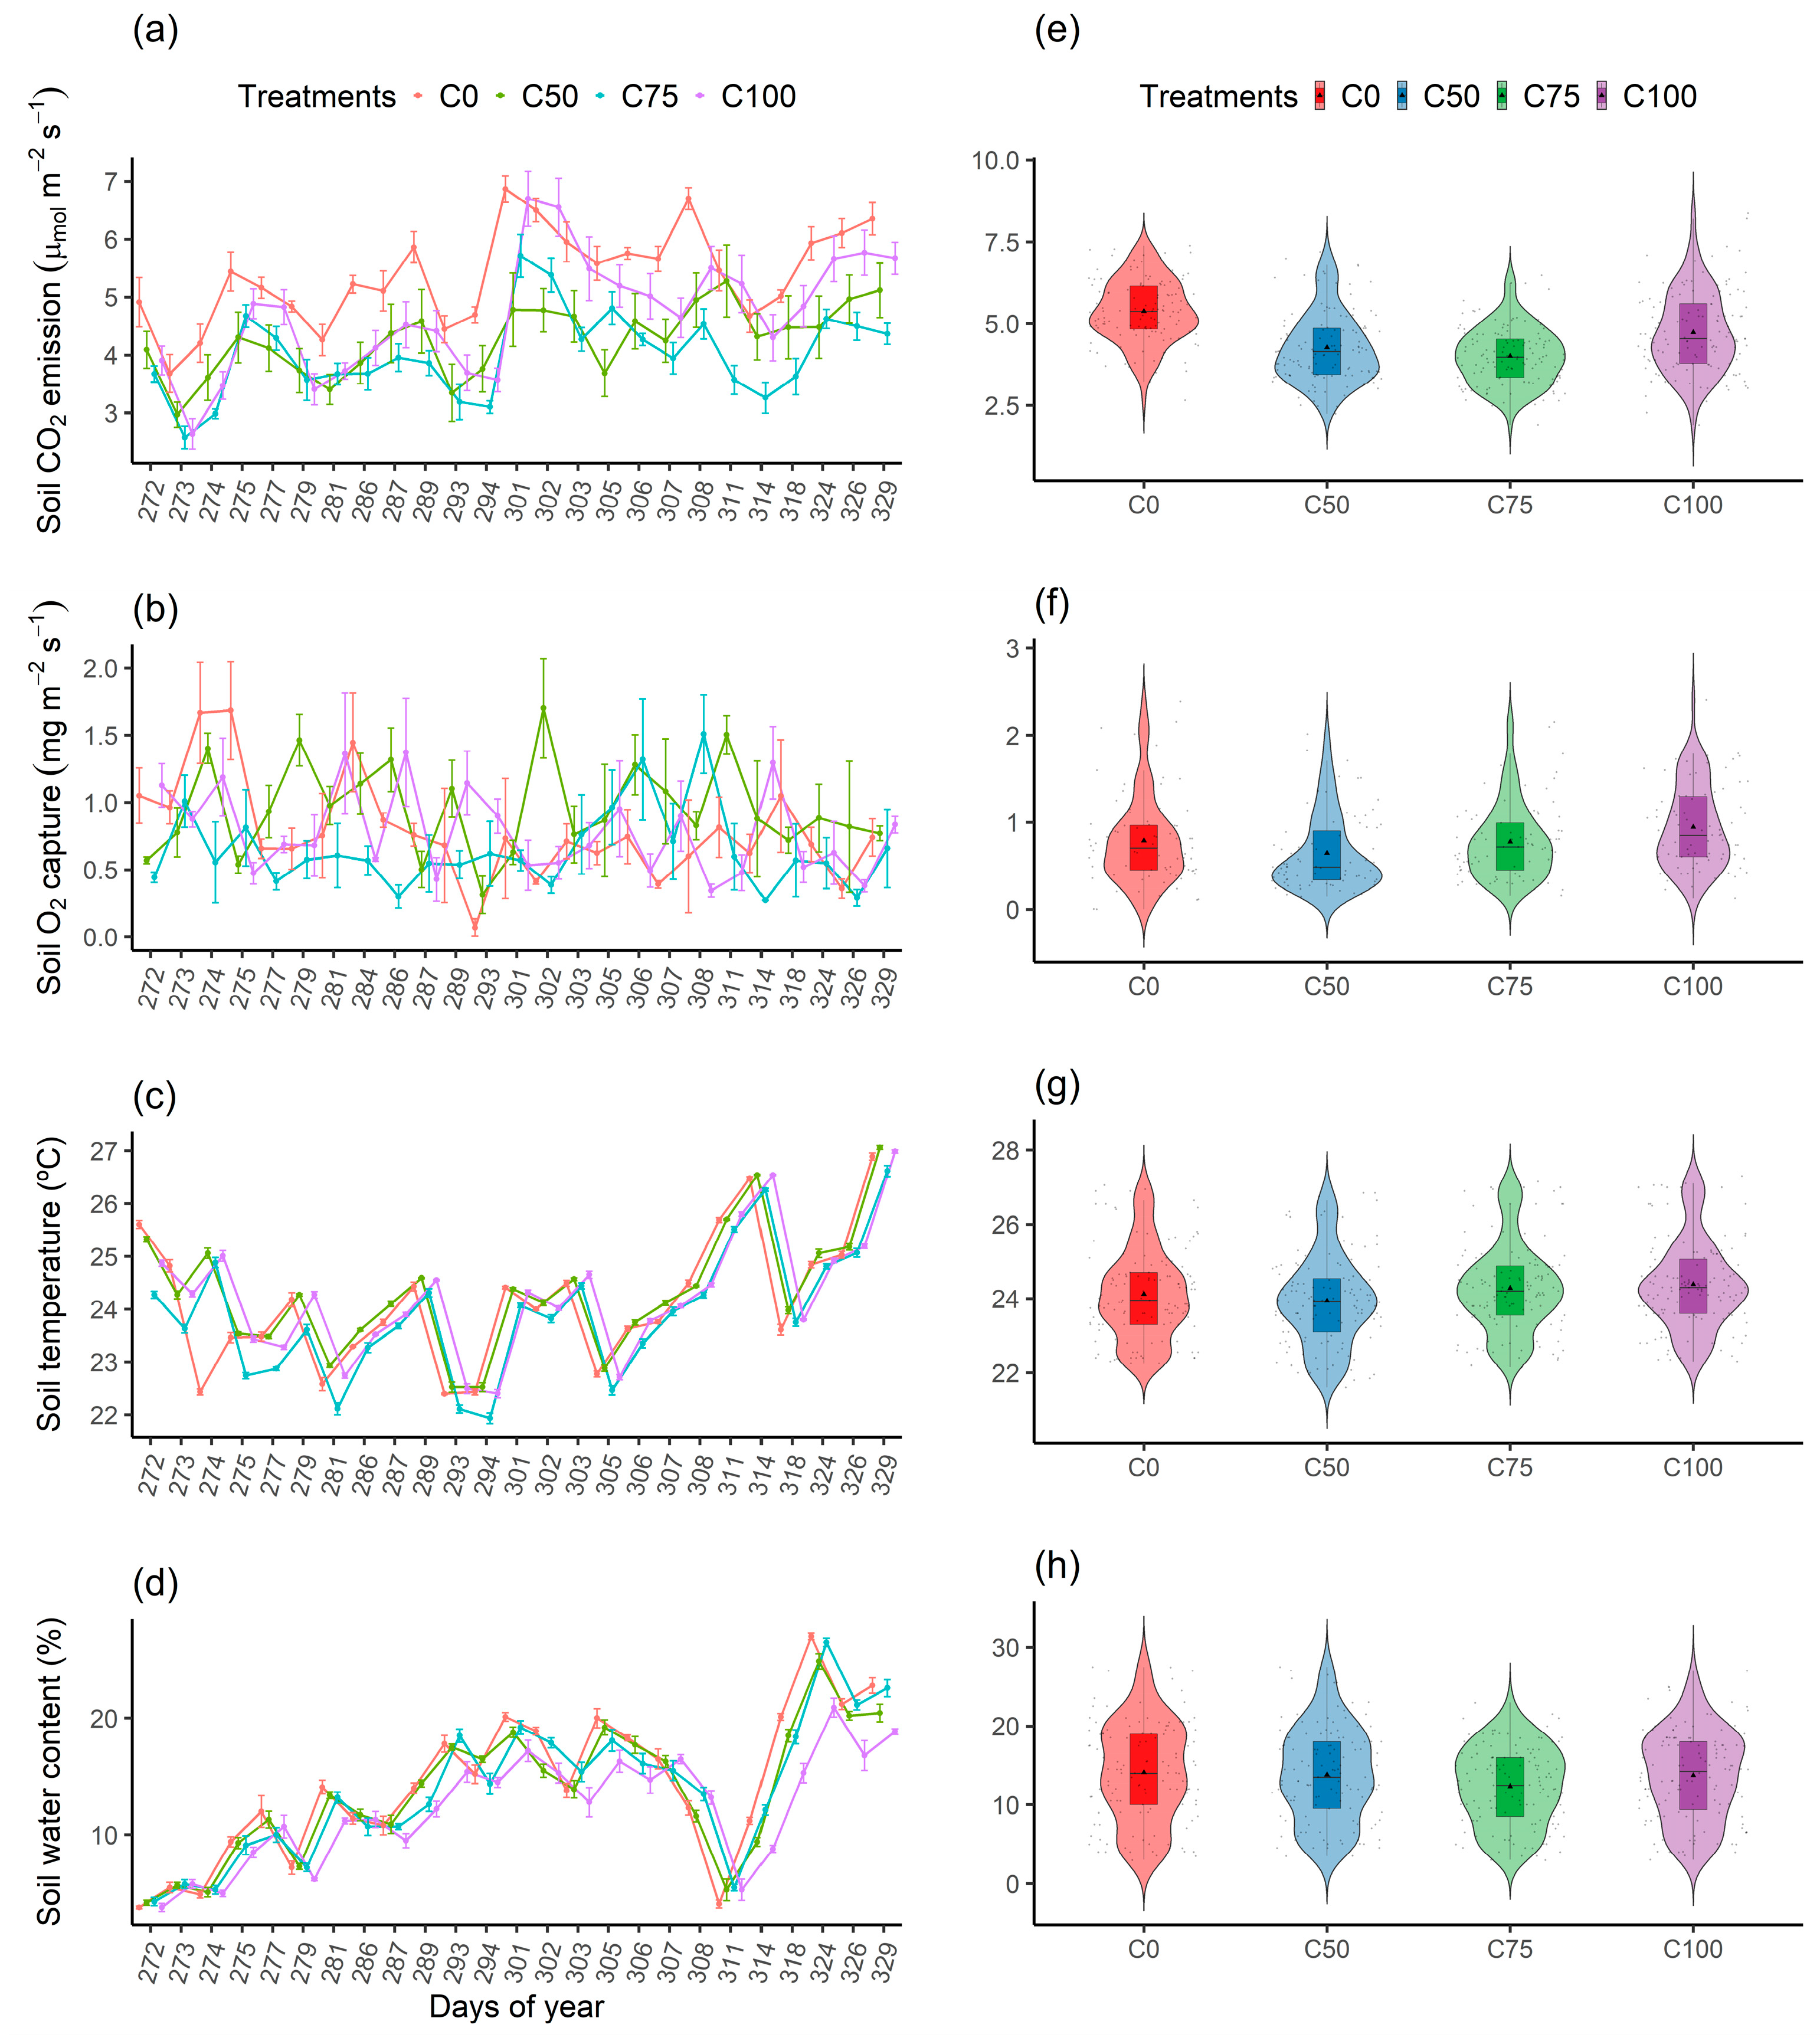
The analysis of variance (ANOVA) for soil CO2 emissions (FCO2) revealed a significant effect of treatment (F = 5.04; p < 0.01), temporal variation (days) (F = 51.84; p < 0.01), and the interaction between these factors (F = 2.77; p < 0.01). Temporal fluctuations in FCO2 were associated with precipitation events. Five distinct increases in FCO2 were recorded throughout the monitoring period, each occurring immediately after rainfall. The first increase was observed on day 275, following a 10 mm precipitation event, with FCO2 values 47–85% higher across all treatments compared to day 273. The highest precipitation-induced peak occurred on day 301 after 44.8 mm of rainfall, with the highest FCO2 observed in C0 (6.86 ± 0.23 µmol m−2 s−1) and the lowest in C50 (4.80 ± 0.63 µmol m−2 s−1), representing a 30% reduction in C50 relative to C0 on that day (Figure 4a).
The lowest FCO2 values were recorded on day 273, following three days without precipitation. Among the treatments, C75 exhibited the lowest emission (2.60 ± 0.20 µmol m−2 s−1), which was also 30% lower than that of C0 (3.69 ± 0.33 µmol m−2 s−1) on the same day. Overall, the highest FCO2 values were observed in the C0 treatment (p < 0.05) on 20 out of the 25 evaluation days, with the most pronounced differences occurring during the first nine days of monitoring (p < 0.05). In contrast, the lowest emissions were consistently observed in the C75 treatment (Figure 4a).
Soil O2 capture (FO2) differed significantly among the treatments (F = 2.96; p < 0.1), over time (F = 2.35; p < 0.01), and in the interaction between these factors (F = 2.36; p < 0.01). The highest FO2 value was observed in treatment C0 on day 275 (1.70 ± 0.36 mg m−2 s−1), whereas the lowest was recorded in the same treatment on day 293 (0.07 ± 0.07 mg m−2 s−1), showing a decreasing trend. From day 297, the FO2 in C0 remained stable until the end of this study (Figure 4b).
The other treatments exhibited greater variability in FO2 during this study. In C50, FO2 fluctuated between 1.50 ± 0.30 mg m−2 s−1 on day 308 and 0.30 ± 0.00 mg m−2 s−1 on day 314. In C75, the maximum and minimum FO2 values were 1.37 ± 0.40 and 0.34 ± 0.05 mg m−2 s−1, recorded on days 286 and 308, respectively. Treatment C100 showed an increasing trend in FO2, rising from 0.32 ± 0.14 mg m−2 s−1 on day 293 to 1.70 ± 0.37 mg m−2 s−1 on day 392 (Figure 4b).
Soil temperature (Ts) varied significantly over time (F = 1854.98; p < 0.01), among treatments (F = 22.69; p < 0.01), and in the interaction between these factors (F = 34.31; p < 0.01). The lowest Ts was recorded in the C50 treatment on day 294 (21.94 ± 0.10 °C; p < 0.05). In contrast, the highest Ts was observed in the C100 treatment on day 329 (27.1 ± 0.05 °C). On that day, the maximum Ts values across treatments were 26.89 ± 0.07 °C (C0), 26.57 ± 0.12 °C (C50), and 26.98 ± 0.05 °C (C75), with C50 showing significantly lower values (p < 0.05) (Figure 4c).
A decreasing trend in Ts was observed from the beginning of this study until day 294, after which the values remained relatively stable. This decrease coincided with the beginning of rainfall events and elevated SWC, suggesting a potential link that may be related to the onset of precipitation events and the associated increase in soil moisture.
Soil water content (SWC) varied significantly over time (F = 448.29; p < 0.01), among treatments (F = 4.49; p < 0.01), and in the interaction between these factors (F = 2.80; p < 0.01). The lowest SWC values were recorded on day 272 across all treatments: 3.8 ± 0.12% (C0), 4.3 ± 0.34% (C50), 3.8 ± 0.34% (C75), and 4.2 ± 0.20% (C100) (Figure 4d). The highest SWC was observed on day 324 in all treatments, although C75 exhibited the lowest moisture content on that day: 27.00 ± 0.27% (C0), 26.50 ± 0.35% (C50), 20.90 ± 0.81% (C75), and 24.87 ± 0.64% (C100).
Between days 305 and 311, a marked decline in SWC was recorded owing to the absence of precipitation and elevated soil temperatures. During this period, the moisture content decreased by approximately 80%, 69%, 68%, and 72% in C0, C50, C75, and C100, respectively.

3.3. Quadratic Regression Analysis of Soil CO2 Emission, Soil O2 Capture, Soil Temperature, and Soil Water Content

Quadratic regression analyses were performed to evaluate the effects of PEG6000 concentrations on soil CO2 emissions (FCO2), soil O2 capture (FO2), soil temperature (Ts), and soil water content (SWC) (Table 1). The analysis of FCO2 revealed a significant influence of the treatments, with a high coefficient of determination (R2 = 0.95). The emissions decreased at C50 (4.26 ± 0.09 μmol m−2 s−1), C75 (4.00 ± 0.08 μmol m−2 s−1), and C100 (4.72 ± 0.11 μmol m−2 s−1) compared to the control C0 (5.38 ± 0.08 μmol m−2 s−1), corresponding to reductions of 20.8%, 25.6%, and 12.3%, respectively (Figure 4e). The model predicted a minimum FCO2 of 4.22 μmol m−2 s−1 at 54.12 g PEG6000 L−1.
For FO2, the quadratic model indicated a decrease at C50 (0.65 ± 0.05 mg m−2 s−1), representing a 17.72% reduction relative to C0 (0.79 ± 0.06 mg m−2 s−1), while C75 (0.77 ± 0.05 mg m−2 s−1) showed a similar capture to C0, and C100 (0.95 ± 0.06 mg m−2 s−1) exhibited a 20% increase. This model presented a strong fit, with R2 = 0.99 (Figure 4f). In contrast, soil temperature showed no significant variation across the treatments (C0: 24.1 ± 0.11 °C; C50: 23.9 ± 0.11 °C; C75: 24.2 ± 0.10 °C; C100: 24.3 ± 0.10 °C) (Figure 4g), with a moderate coefficient of determination (R2 = 0.79) and non-significant parameters for the regression equation. Finally, the analysis of SWC resulted in a low fit (R2 = 0.44) and parameters that were not normally distributed; nevertheless, a notably lower SWC was observed in C75 (12.20 ± 0.43%) than in C0 (14.10 ± 0.56%) (Figure 4h), possibly reflecting treatment-induced changes in soil solution viscosity.

3.4. Quadratic Regression Analysis of Total Soil CO2 Emission and Total Soil O2 Capture

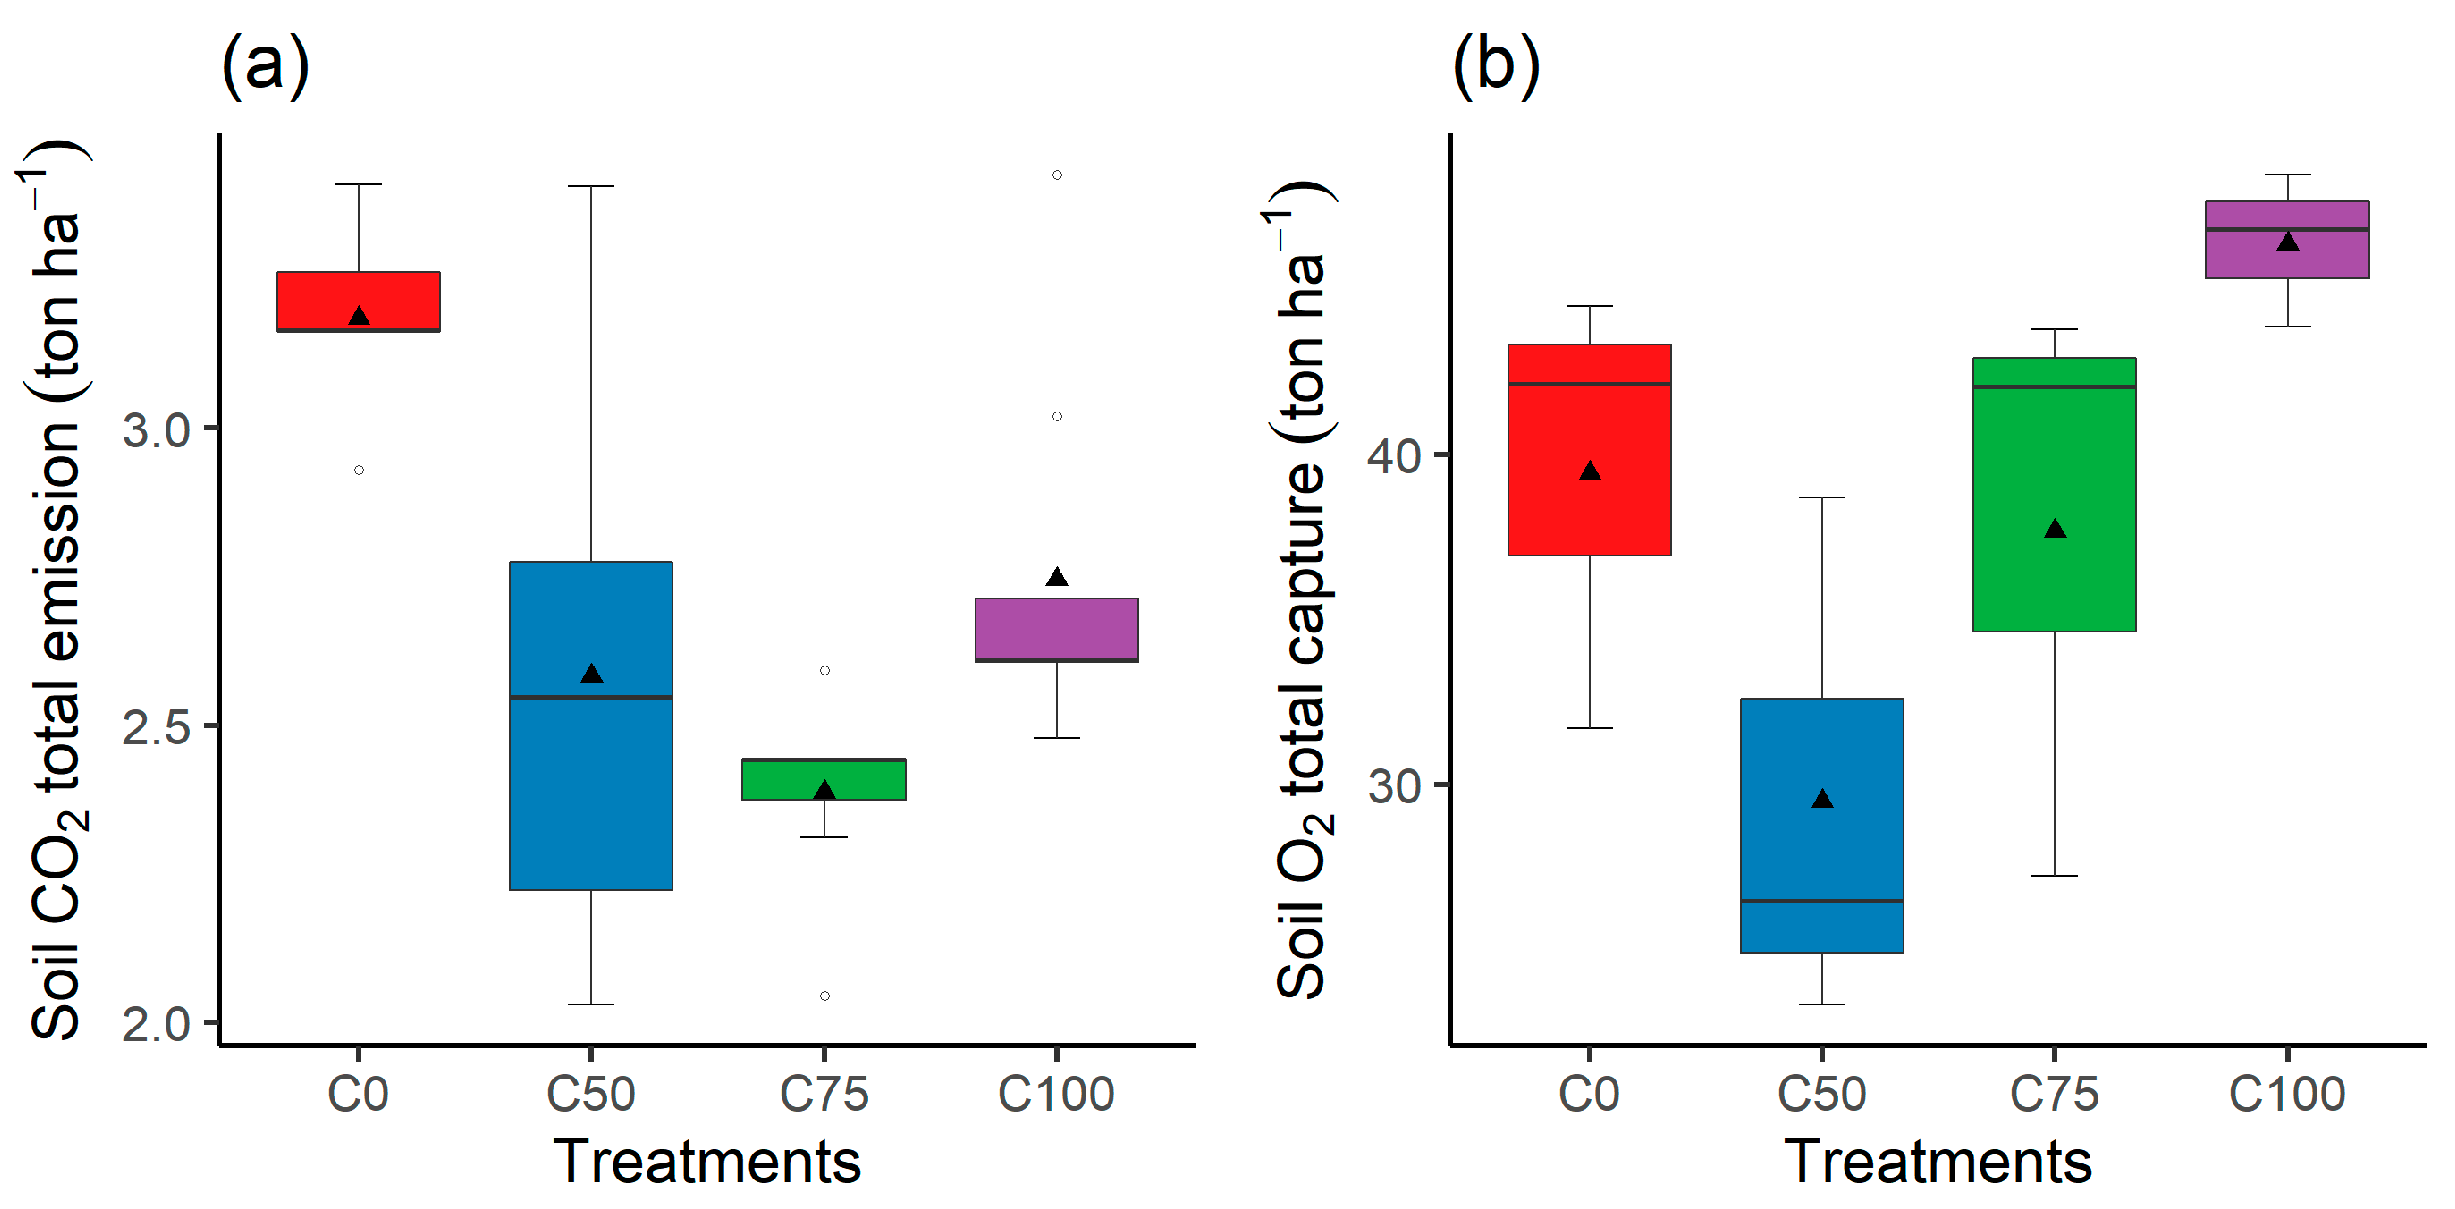
The total soil CO2 emissions averaged 3.185 ± 0.08, 2.544 ± 0.25, 2.365 ± 0.009, and 2.825 ± 0.18 tons CO2 ha−1 for treatments C0, C50, C75, and C100, respectively (Figure 5a). Quadratic regression analysis confirmed the significant effect of the treatments on total emissions, with a coefficient of determination of 0.93 (Table 1). Specifically, treatments C75, C50, and C100 reduced soil CO2 emissions by 25.7%, 20.1%, and 11.3%, respectively, compared with C0. These findings support the hypothesis that solution viscosity influences cumulative CO2 emissions.
Similarly, the average total soil O2 capture was 39.45 ± 3.93, 29.5 ± 4.68, 37.7 ± 5.25, and 46.40 ± 1.35 tons ha−1 for treatments C0, C50, C75, and C100, respectively (Figure 5b). Capture in C100 was 17.57% higher than that in C0, whereas C50 and C75 exhibited reductions of 25.22% and 4.23%, respectively. Quadratic regression corroborated these trends with a determination coefficient of 0.96 (Table 1).

4. Discussion

In this study, the temporal variability of soil CO2 emissions (FCO2) was closely related to changes in soil water content (SWC), which is in agreement with previous reports [16,32,43]. Increases in soil moisture following dry periods likely stimulated microbial respiration, highlighting the crucial role of water in CO2 diffusion and production [14,44]. This effect was more pronounced at the end of the dry season, with the onset of rainfall, when significant increases in FCO2 were recorded, consistent with studies conducted in Rhodic Ferralsols and tropical regions [32,35,45,46]. Conversely, after continuous rainfall (days 277 to 281), a reduction in FCO2 was observed when SWC was higher, likely due to increased water-filled pore space, which limits gas diffusion, as also reported by [32,40].
The direct relationship between soil CO2 emissions driven by microbial activity and factors such as soil moisture and temperature has been widely explored [11,16]. However, other less-explored physical factors, such as soil solution viscosity, could also influence this process [25]. Our results showed that increasing the viscosity of the applied solution from 1.11 cP in the control (C0) to 1.93 cP (C50), 2.76 cP (C75), and 3.88 cP (C100) resulted in a reduction in soil CO2 emissions, with decreases of 20.8%, 25.6%, and 12.3%, respectively. These reductions suggest that higher solution viscosity may act as a limiting factor for microbial respiration, possibly by restricting the movement and access of microorganisms to substrates within the soil matrix. This interpretation is supported by previous studies that have demonstrated a relationship between viscosity and microbial motility in liquid media [20,21,22,23,24].
The observed decrease in oxygen capture (FO2) throughout the experiment was consistent with the oxygen capture patterns reported in tropical forests [35]. Additionally, the low FO2 following rainfall events, also reported by [40], may be related to increased soil water content (SWC), which limits gas exchange in soil pores by reducing oxygen diffusion into the soil [36].
Analysis of mean values per treatment showed a decrease in oxygen uptake (FO2) in C50 compared to the control (C0), suggesting a possible effect of PEG6000. This biopolymer can affect oxygen uptake by hindering its transport due to the increase in medium viscosity, decrease in water potential [47], and increase in osmotic potential, which together reduce water uptake by plant roots [48]. However, this effect was not evident in C75, where the FO2 values were similar to those of the control. In contrast, C100 showed a higher FO2 than the other treatments, as well as higher CO2 emissions (FCO2) than C50 and C75.
These results suggest that there was no linear dose-dependent effect on either FCO2 or FO2, possibly because these processes reflect the respiration activity of the microbial community, a process influenced not only by oxygen availability [36] but also by factors such as microbial mobility [25], water content [16], soil physical structure, and access to organic matter [12]. However, the fitted quadratic model for CO2 (FCO2) emissions predicted a minimum emission at a concentration of 54.12 g PEG6000 L−1, suggesting the existence of an optimal viscosity point beyond which microbial respiration is maximally restricted, without necessarily indicating a linear relationship between PEG6000 dose and CO2 emission.
Throughout this study, soil temperature showed low variability between treatments and in average treatment values, which is typical of tropical environments and has been reported in similar Rhodic Ferralsols [16,32,46]. This relative temperature stability likely favors microbial activity by allowing dormant microorganisms to rapidly activate in response to moisture [49]. Given the low thermal variation observed, the potential effect of temperature on soil CO2 emissions may have been limited in our study. Nevertheless, temperature can influence the viscosity of the soil solution, which in turn affects microbial motility. According to [25], an increase in temperature from temperate to tropical conditions (0 °C to 30 °C) reduces the viscosity of the soil solution by approximately 55%, from 1.78 to 0.80 mPa·s [11]. Previous studies in marine environments have shown that a 10 °C decrease in temperature increases viscosity and reduces microorganism motility by 4–37% [22].
The variation in soil water content (SWC) during the experiment was clearly influenced by precipitation events, with progressive increases following rainfall and decreases during dry periods, consistent with other studies on Rhodic Ferralsols [32,35]. Although no significant differences were observed in the parameters of the quadratic regression analysis, the average SWC in treatments C50, C75, and C100 was lower than that in C0, which could be related to the effect of PEG6000 in decreasing the osmotic potential of the solutions [29], acting as a stress factor on water availability [50].
We acknowledge the practical limitations associated with the use of PEG6000, particularly its potential adverse effects on plants and microorganisms when applied at high concentrations. These effects are primarily related to its osmotic action, which can induce water stress, as previously reported [50]. In this regard, we suggest that future research evaluate the economic viability of this practice, as well as the use of other thickening agents that are more sustainable, effective, and compatible with plant physiological processes. We also recommend incorporating complementary approaches, such as metagenomics or enzyme activity analysis, to differentiate the physical effects associated with viscosity from the potential chemical or toxicological effects of thickening agents.

5. Conclusions

Our results demonstrate that alterations in soil solution viscosity, experimentally induced using PEG6000, can nonlinearly affect gas diffusion and the dynamics of microbial respiration in the short term. In particular, treatments with intermediate viscosity levels (C50 and C75) reduced both oxygen uptake and CO2 emissions compared to the control, suggesting a physical limitation on aerobic microbial activity under these conditions. However, in the highest concentration treatment (C100), oxygen uptake increased, whereas CO2 emissions remained lower than those of the control, indicating a more complex response potentially influenced by additional physicochemical or biological factors that require further investigation.
This study represents a pioneering contribution to the understanding of the role of soil solution viscosity in regulating CO2 emissions, particularly in highly weathered Ferralsols. Despite the practical limitations of PEG6000 for large-scale applications, the results lay the groundwork for developing sustainable strategies that consider viscosity tuning using more suitable, environmentally safe, and economically feasible materials to mitigate climate change.

Author Contributions

A.I.S.-N.: conceptualization, methodology, formal analysis, investigation, data curation, writing—original draft, and visualization. K.F.F.C.: methodology, investigation, formal analysis, data curation, writing—review and editing, and visualization. W.B.D.L.: methodology, formal analysis, data curation, and software. M.E.V.: formal analysis and software. A.R.P.: formal analysis, methodology, writing—review and editing, and visualization. T.R.G.d.S.: writing—review and editing. G.d.S.R.: formal analysis, resources, and writing—review and editing. K.S.: methodology, resources, and writing—review and editing. N.L.S.J.: conceptualization, methodology, resources, writing—original draft, writing—review and editing, and visualization. All authors have read and agreed to the published version of the manuscript.

Funding

This study was financed in part by PROPG/UNESP through call n° 23/2025.

Institutional Review Board Statement

Not applicable.

Data Availability Statement

Dataset available upon request from the authors.

Acknowledgments

The authors would like to thank the National Secretariat of Science, Technology and Innovation (SENACYT) of the Republic of Panama for the scholarship awarded to the main author (Scholarship No. BEPA-D-2019-008).

Conflicts of Interest

The authors declare no conflicts of interest.

Abbreviations

The following abbreviations are used in this manuscript:
CO2carbon dioxide
CH4methane
N2Onitrous oxide
AFOLUAgriculture, forestry, and other land uses
RECSOILRecarbonization of Global Agricultural Soils
SOCSoil organic carbon
OMOrganic matter
PEG6000polyethylene glycol 6000
FCO2Soil CO2 emissions (µmol m−2 s−1)
FO2Soil O2 capture (mg m−2 s−1)
TsSoil temperature (°C)
SWCSoil water content (%)
TFCO2Total soil CO2 emissions (tons ha−1)
TFO2Total soil O2 capture (tons ha−1)

Appendix A

Table A1. Descriptive statistics of the assessed variables in this experiment.
NMeanSDMedianIQRMinMaxMSECV%Curtose
CO2 emission
(µmol m−2 s−1)
C01255.380.965.371.312.657.39±0.0817.88−0.24
C501254.261.074.141.422.247.19±0.0925.230.13
C751254.000.873.951.141.906.47±0.0821.810.03
C1001254.721.244.511.871.908.38±0.1126.21−0.02
O2 capture
(mg m−2 s−1)
C0750.790.510.700.510.0032.38±0.0664.301.38
C50750.650.430.490.570.152.01±0.0666.920.91
C75750.770.430.700.560.162.15±0.0555.991.18
C100750.950.480.860.710.132.40±0.0550.79−0.31
Ts (°C)C012524.101.2024.01.4022.2027.00±0.114.98−0.16
C5012523.901.2023.91.4021.6026.80±0.115.02−0.03
C7512524.201.1324.21.3022.2027.20±0.104.670.31
C10012524.301.1124.21.3022.3027.30±0.104.570.44
SWC (v/v) (%)C012514.106.2314.09.003.0027.50±0.5644.18−0.79
C5012513.705.8413.58.503.5027.50±0.5242.63−0.57
C7512512.204.8412.57.503.0023.00±0.4339.67−0.89
C10012513.605.6314.08.503.0027.00±0.5041.39−0.77
Notes: N is the number of samples; Mean is the mean of the measurements; SD is standard deviation; Median; interquartile range (IQR); Minimum (Min); Maximum (Max); mean standard error (MSE); coefficient of variation (CV); kurtosis of soil CO2 emission; O2 capture; soil temperature (Ts); soil water content (SWC) in soil from four lysimeters applied with four doses of polyethylene glycol 6000 (PEG6000) in grams per liter of water; control (C0): 50 g L−1 (C50), 75 g L−1 (C75), and 100 g L−1 (C100).

References

  1. Canadell, J.G.; Monteiro, P.M.S. Global Carbon and Other Biogeochemical Cycles and Feedbacks. 2021. Available online: https://www.ipcc.ch/report/ar6/wg1/downloads/report/IPCC_AR6_WGI_Chapter05.pdf (accessed on 30 March 2025).
  2. Nabuurs, G.-J.; Mrabet, R. Agriculture, Forestry and Other Land Uses (AFOLU). In IPCC, 2022: Climate Change 2022: Mitigation of Climate Change. Contribution of Working Group III to the Sixth Assessment Report of the Intergovernmental Panel on Climate Change; Cambridge University Press: Cambridge, UK; New York, NY, USA, 2022. [Google Scholar] [CrossRef]
  3. Lan, X.; Tans, P.; Thoning, K.W. Trends in Globally-Averaged CO2 Determined From NOAA Global Monitoring Laboratory Measurements. Version Monday, 14 July 2025. [Google Scholar] [CrossRef]
  4. Meinshausen, M.; Nicholls, Z.R.J.; Lewis, J.; Gidden, M.J.; Vogel, E.; Freund, M.; Beyerle, U.; Gessner, C.; Nauels, A.; Bauer, N.; et al. The shared socio-economic pathway (SSP) greenhouse gas concentrations and their extensions to 2500. Geosci. Model Dev. 2020, 13, 3571–3605. [Google Scholar] [CrossRef]
  5. Estimativas Anuais de Emissões de Gases de Efeito Estufa No Brasil. Brasília. 2022. Available online: https://www.gov.br/mcti/pt-br/acompanhe-o-mcti/sirene/publicacoes/estimativas-anuais-de-emissoes-gee/arquivos/6a-ed-estimativas-anuais.pdf (accessed on 30 March 2025).
  6. FAO. Recarbonization of Global Soils. Rome. 2019. Available online: https://openknowledge.fao.org/server/api/core/bitstreams/9e167594-3d97-4486-b8c9-ed875985dc98/content (accessed on 31 March 2025).
  7. Brazil’s NDC National Determination to Contribute and Transform. Available online: https://unfccc.int/sites/default/files/2024-11/Brazil_Second%20Nationally%20Determined%20Contribution%20%28NDC%29_November2024.pdf (accessed on 2 August 2025).
  8. Tóth, E.; Magyar, M.; Cseresnyés, I.; Dencső, M.; Laborczi, A.; Szatmári, G.; Koós, S. Climate-Smart Agricultural Practices—Strategies to Conserve and Increase Soil Carbon in Hungary. Land 2025, 14, 1206. [Google Scholar] [CrossRef]
  9. Rodríguez, B.C.; Durán-Zuazo, V.H.; Rodríguez, M.S.; García-Tejero, I.F.; Ruiz, B.G.; Tavira, S.C. Conservation Agriculture as a Sustainable System for Soil Health: A Review. Soil Syst. 2022, 6, 87. [Google Scholar] [CrossRef]
  10. Lal, C.R. Digging deeper: A holistic perspective of factors affecting soil organic carbon sequestration in agroecosystems. Glob. Chang. Biol. 2018, 24, 3285–3301. [Google Scholar] [CrossRef]
  11. Zhang, Y.; Zhu, G.; Yin, L.; Ma, L.; Xu, C.; Chen, H.; Ma, T.; Su, Y.; Zhu, Y.; He, L.; et al. Optimal soil water content and temperature sensitivity differ among heterotrophic and autotrophic respiration from oasis agroecosystems. Geoderma 2022, 425, 116071. [Google Scholar] [CrossRef]
  12. Six, J.; Conant, R.T.; Paul, E.A.; Paustian, K. Stabilization mechanisms of soil organic matter: Implications for C-saturation of soils. Plant Soil 2002, 241, 155–176. [Google Scholar] [CrossRef]
  13. Kravchenko, A.N.; Negassa, W.C.; Guber, A.K.; Rivers, M.L. Protection of soil carbon within macro-aggregates depends on intra-aggregate pore characteristics. Sci. Rep. 2015, 5, 16261. [Google Scholar] [CrossRef]
  14. Yang, P.; van Elsas, J.D. Mechanisms and ecological implications of the movement of bacteria in soil. Appl. Soil Ecol. 2018, 129, 112–120. [Google Scholar] [CrossRef]
  15. Vargas-Terminel, M.L.; Flores-Rentería, D.; Sánchez-Mejía, Z.M.; Rojas-Robles, N.E.; Sandoval-Aguilar, M.; Chávez-Vergara, B.; Robles-Morua, A.; Garatuza-Payan, J.; Yépez, E.A. Soil Respiration Is Influenced by Seasonality, Forest Succession and Contrasting Biophysical Controls in a Tropical Dry Forest in Northwestern Mexico. Soil Syst. 2022, 6, 75. [Google Scholar] [CrossRef]
  16. Moitinho, M.R.; Ferraudo, A.S.; Panosso, A.R.; Bicalho, E.d.S.; Teixeira, D.D.B.; Barbosa, M.d.A.; Tsai, S.M.; Borges, B.M.F.; Cannavan, F.d.S.; de Souza, J.A.M.; et al. Effects of burned and unburned sugarcane harvesting systems on soil CO2 emission and soil physical, chemical, and microbiological attributes. CATENA 2021, 196, 104903. [Google Scholar] [CrossRef]
  17. Teodoro, P.E.; Rossi, F.S.; Teodoro, L.P.R.; Santana, D.C.; Ratke, R.F.; de Oliveira, I.C.; Della Silva, J.L.; de Oliveira, J.L.G.; da Silva, N.P.; Baio, F.H.R.; et al. Soil CO2 emissions under different land-use managements in Mato Grosso do Sul, Brazil. J. Clean. Prod. 2024, 434, 139983. [Google Scholar] [CrossRef]
  18. Holthusen, D.; Haas, C.; Peth, S.; Horn, R. Are standard values the best choice? A critical statement on rheological soil fluid properties viscosity and surface tension. Soil Tillage Res. 2012, 125, 61–71. [Google Scholar] [CrossRef]
  19. Schneider, W.R.; Doetsch, R.N. Effect of Viscosity on Bacterial Motility. J. Bacteriol. 1974, 117, 696–701. [Google Scholar] [CrossRef]
  20. Bolton, T.F.; Havenhand, J.N. Physiological versus viscosity-induced effects of water temperature on the swimming and sinking velocity of larvae of the serpulid polychaete Galeolaria caespitosa. Mar. Ecol. Prog. Ser. 1997, 159, 209–218. [Google Scholar] [CrossRef]
  21. Larsen, P.S.; Madsen, C.V.; Riisgård, H.U. Effect of temperature and viscosity on swimming velocity of the copepod Acartia tonsa, brine shrimp Artemia salina and rotifer Brachionus plicatilis. Aquat. Biol. 2008, 4, 47–54. [Google Scholar] [CrossRef]
  22. Sohn, M.H.; Lim, S.; Seo, K.W.; Lee, S.J. Effect of ambient medium viscosity on the motility and flagella motion of Prorocentrum minimum (Dinophyceae). J. Plankton Res. 2013, 35, 1294–1304. [Google Scholar] [CrossRef]
  23. Mirbagheri, S.A.; Fu, H.C. Helicobacter pylori Couples Motility and Diffusion to Actively Create a Heterogeneous Complex Medium in Gastric Mucus. Phys. Rev. Lett. 2016, 116, 198101. [Google Scholar] [CrossRef]
  24. Joiner, K.L.; Baljon, A.; Barr, J.; Rohwer, F.; Luque, A. Impact of bacteria motility in the encounter rates with bacteriophage in mucus. Sci. Rep. 2019, 9, 16427. [Google Scholar] [CrossRef] [PubMed]
  25. La Scala, N., Jr.; Martinez, A.S.; Spokas, K.A.; Gonçalves, D.R.P.; Etto, R.M. Should alterations in water viscosity be addressed in soil carbon models? arXiv 2022. [Google Scholar] [CrossRef]
  26. Adhikari, R.; Mingtarja, H.; Freischmidt, G.; Bristow, K.L.; Casey, P.S.; Johnston, P.; Sangwan, P. Effect of viscosity modifiers on soil wicking and physico-mechanical properties of a polyurethane based sprayable biodegradable polymer membrane. Agric. Water Manag. 2019, 222, 346–353. [Google Scholar] [CrossRef]
  27. Castanho, G.M.; Regitano, J.B.; Tornisielo, V.L.; Abdalla, A.L. Sorption and mobility of polyethylene glycol (PEG 4000) in tropical soils. Toxicol. Environ. Chem. 2009, 91, 1263–1271. [Google Scholar] [CrossRef]
  28. Aliniaeifard, S.; Asayesh, Z.M.; Driver, J.; Vahdati, K. Stomatal features and desiccation responses of Persian walnut leaf as caused by in vitro stimuli aimed at stomatal closure. Trees Struct. Funct. 2020, 34, 1219–1232. [Google Scholar] [CrossRef]
  29. Carpita, N.; Sabularse, D.; Montezinos, D.; Delmer, D.P. Determination of the pore size of cell walls of living plant cells. Science 1979, 205, 1144–1147. [Google Scholar] [CrossRef] [PubMed]
  30. Thornthwaite, C.W. An Approach toward a Rational Classification of Climate. Geogr. Rev. 1948, 38, 55–94. [Google Scholar] [CrossRef]
  31. Rolim, G.d.S.; de Camargo, M.B.P.; Lania, D.G.; de Moraes, J.F.L. Climatic classification of Köppen and Thornthwaite sistems and their applicability in the determination of agroclimatic zonning for the state of São Paulo, Brazil. Bragantia 2007, 66, 711–720. [Google Scholar] [CrossRef]
  32. Santos, G.A.d.A.; Moitinho, M.R.; Silva, B.d.O.; Xavier, C.V.; Teixeira, D.D.B.; Corá, J.E.; Júnior, N.L.S. Effects of long-term no-tillage systems with different succession cropping strategies on the variation of soil CO2 emission. Sci. Total. Environ. 2019, 686, 413–424. [Google Scholar] [CrossRef]
  33. IUSS Working Group WRB. World Reference Base for Soil Resources. In International Soil Classification System for Naming Soils and Creating Legends for Soil Maps, 4th ed.; International Union of Soil Sciences (IUSS): Vienna, Austria, 2022; Available online: https://wrb.isric.org/files/WRB_fourth_edition_2022-12-18_errata_correction_2024-09-24.pdf (accessed on 30 July 2025).
  34. Michel, B.E.; Kaufmann, M.R. The Osmotic Potential of Polyethylene Glycol 6000. Plant Physiol. 1973, 51, 914–916. [Google Scholar] [CrossRef]
  35. Vicentini, M.E.; Pinotti, C.R.; Hirai, W.Y.; de Moraes, M.L.T.; Montanari, R.; Filho, M.C.M.T.; Milori, D.M.B.P.; Júnior, N.L.S.; Panosso, A.R. CO2 emission and its relation to soil temperature, moisture, and O2 absorption in the reforested areas of Cerrado biome, Central Brazil. Plant Soil 2019, 444, 193–211. [Google Scholar] [CrossRef]
  36. De Lucena, W.B.; Vicentini, M.E.; Santos, G.A.D.A.; Silva, B.D.O.; Da Costa, D.V.M.; Canteral, K.F.F.; Román, J.A.N.; Rolim, G.D.S.; Panosso, A.R.; La Scala, N., Jr. Temporal variability of the CO2 emission and the O2 influx in a tropical soil in contrasting coverage conditions. J. S. Am. Earth Sci. 2023, 121, 104120. [Google Scholar] [CrossRef]
  37. Jassal, R.S.; Black, T.A.; Nesic, Z.; Gaumont-Guay, D. Using automated non-steady-state chamber systems for making continuous long-term measurements of soil CO2 efflux in forest ecosystems. Agric. For. Meteorol. 2012, 161, 57–65. [Google Scholar] [CrossRef]
  38. Giacomo, G.; Angelo, F.; Fabio, B.; Stefano, B.; Riccardo, M. Measurements of soil carbon dioxide emissions from two maize agroecosystems at harvest under different tillage conditions. Sci. World J. 2014, 2014, 141345. [Google Scholar] [CrossRef]
  39. Smagin, A.V.; Dolgikhb, A.V.; Karelin, D.V. Experimental studies and physically substantiated model of carbon dioxide emission from the exposed cultural layer of Velikii Novgorod. Eurasian J. Soil Sci. 2016, 49, 450–456. [Google Scholar] [CrossRef]
  40. de Almeida, R.F.; Teixeira, D.d.B.; Montanari, R.; Bolonhezi, A.C.; Teixeira, E.B.; Moitinho, M.R.; Panosso, A.R.; Spokas, K.A.; La Scala, N., Jr. Ratio of CO2 and O2 as index for categorising soil biological activity in sugarcane areas under contrasting straw management regimes. Soil Res. 2018, 56, 373–381. [Google Scholar] [CrossRef]
  41. Whittaker, E.T.; Robinson, G. The trapezoidal and parabolic rules. In The Calculus of Observations: A Treatise on Numerical Mathematics, 4th ed.; Blackie and Son limited Ltd.: London, UK; Glasgow, UK, 1944; pp. 156–158. [Google Scholar]
  42. R: The R Project for Statistical Computing. Available online: https://www.r-project.org/ (accessed on 1 April 2025).
  43. Faimon, J.; Lang, M. What actually controls the minute to hour changes in soil carbon dioxide concentrations? Geoderma 2018, 323, 52–64. [Google Scholar] [CrossRef]
  44. Yan, Z.; Bond-Lamberty, B.; Todd-Brown, K.E.; Bailey, V.L.; Li, S.; Liu, C.; Liu, C. A moisture function of soil heterotrophic respiration that incorporates microscale processes. Nat. Commun. 2018, 9, 2562. [Google Scholar] [CrossRef]
  45. Upadhyay, S.; Singh, R.; Verma, P.; Raghubanshi, A.S. Spatio-temporal variability in soil CO2 efflux and regulatory physicochemical parameters from the tropical urban natural and anthropogenic land use classes. J. Environ. Manag. 2021, 295, 113141. [Google Scholar] [CrossRef]
  46. Xavier, C.V.; Moitinho, M.R.; Teixeira, D.D.B.; Santos, G.A.d.A.; Corá, J.E.; La Scala, N., Jr. Crop rotation and sequence effects on temporal variation of CO2 emissions after long-term no-till application. Sci. Total. Environ. 2020, 709, 136107. [Google Scholar] [CrossRef]
  47. Verslues, P.E.; Ober, E.S.; Sharp, R.E. Root Growth and Oxygen Relations at Low Water Potentials. Impact of Oxygen Availability in Polyethylene Glycol Solutions. Plant Physiol. 1998, 116, 1403–1412. [Google Scholar] [CrossRef]
  48. Tátrai, Z.A.; Sanoubar, R.; Pluhár, Z.; Mancarella, S.; Orsini, F.; Gianquinto, G. Morphological and Physiological Plant Responses to Drought Stress in Thymus citriodorus. Int. J. Agron. 2016, 2016, 4165750. [Google Scholar] [CrossRef]
  49. Salazar, A.; Sulman, B.N.; Dukes, J.S. Microbial dormancy promotes microbial biomass and respiration across pulses of drying-wetting stress. Soil Biol. Biochem. 2018, 116, 237–244. [Google Scholar] [CrossRef]
  50. Tavares, D.S.; Fernandes, T.E.K.; Rita, Y.L.; Rocha, D.C.; Sant’Anna-Santos, B.F.; Gomes, M.P. Germinative metabolism and seedling growth of cowpea (Vigna unguiculata) under salt and osmotic stress. S. Afr. J. Bot. 2021, 139, 399–408. [Google Scholar] [CrossRef]
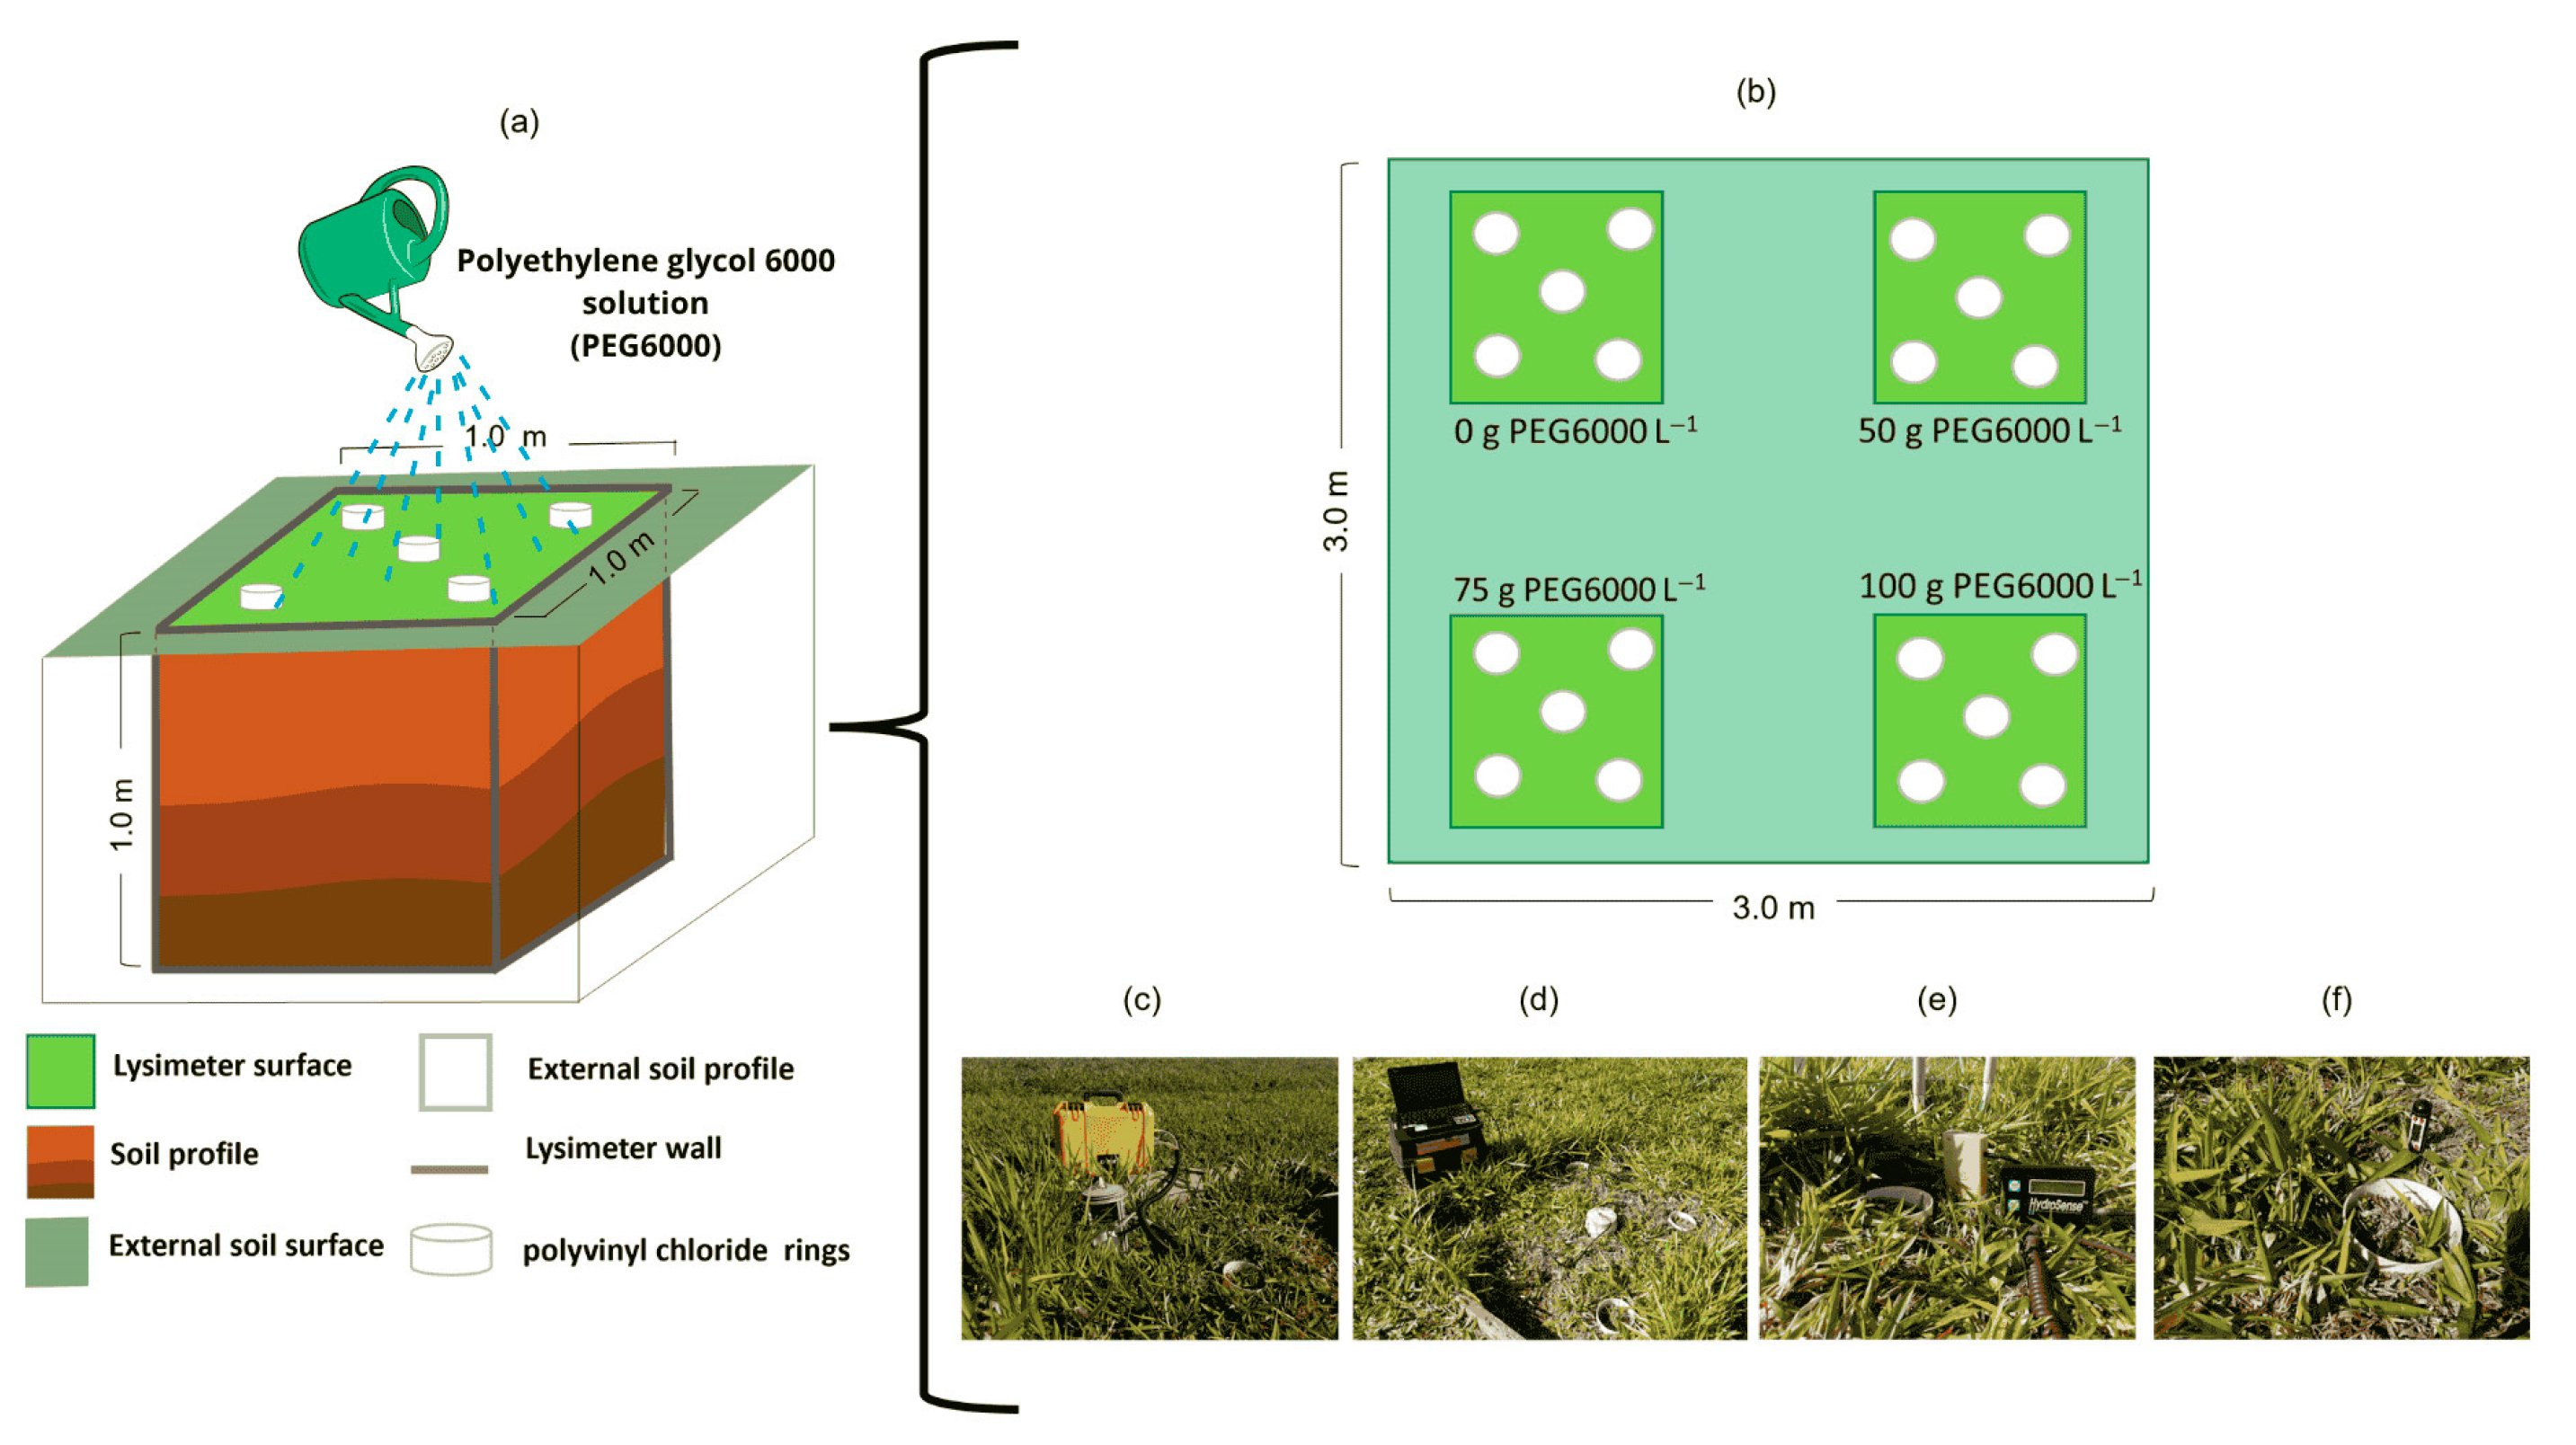
Figure 1. Schematic representation of the experimental arrangement of the treatments and sampling points. (a) Dimensions of the lysimeter and its components. (b) Spatial arrangement of lysimeters. Measurement of variables: (c) Soil CO2 emissions. (d) Soil O2 capture. (e) Soil water content. (f) Soil temperature.
Soilsystems 09 00101 g001
Figure 2. Meteorological data during the study period. (a) Bar graph indicates the precipitation (mm); line graphs show the air temperature (°C) (from top to bottom: maximum, average, and minimum); red arrows indicate the assessment days. (b) Atmospheric pressure (h Pa). (c) Global solar radiation (MJ m 2 ).
Soilsystems 09 00101 g002
Figure 3. PEG6000 viscosity-concentration relationship: (a) Nonlinear regression model generated in the present study based on tabulated data reported by [34], describing the relationship between viscosity at 25 °C and PEG6000 concentration. Data from [34] were extracted solely for comparative and analytical purposes in this study. (b) Estimated viscosities of the PEG6000 solutions applied in the experimental treatments of the present study, calculated from the regression shown in (a).
Soilsystems 09 00101 g003
Figure 4. Temporal variability by treatment of the studied variables (daily mean ± mean standard error): soil CO2 emission (a), soil O2 capture (b), soil temperature (c), and soil water content (d). Quadratic regression analysis of means by treatment of the studied: soil CO2 emission (e), soil O2 capture (f), soil temperature (g), and soil water content (h). The upper and lower box lines represent the interquartile range (25–75 %); the black line indicates the median and the black triangle indicates the mean; ° indicates individual variation, and the width of the figures represents the distribution of the data (wider sections represent a greater number of data). The treatments are doses of 0, 50, 75, and 100 g of polyethylene glycol 6000 per liter of water (C0, C50, C75, and C100, respectively).
Soilsystems 09 00101 g004
Figure 5. Quadratic regression analysis by treatment. Box plots for total soil CO2 emission (a) and total soil O2 capture (b), accumulated during the experiment. The treatments are doses of 0, 50, 75, and 100 g of polyethylene glycol 6000 per liter of water (C0, C50, C75, and C100, respectively). Triangles represent means.
Soilsystems 09 00101 g005
Table 1. Quadratic regression analysis for soil CO2 emissions, soil O2 capture, soil temperature, soil water content, total soil CO2 emissions, and total soil O2 capture.
VariableVariable Quadratic Regression = b0 + b1 C + b2 C2RMSEMinimum
b0b1b2R2 XY
FCO2 (1)5.3958 ± 0.2217 (p = 0.026)−0.0433 ± 0.0101 (p = 0.14)0.0004 ± 0.0001 (p = 0.17)0.950.268154.134.22
FO2 (2)0.7882 ± 0.0190 (p = 0.015)−0.0067 ± 0.0008 (p = 0.08)0.0001 ± 0.000008 (p = 0.06)0.990.029633.500.68
Ts (3)24.0873 ± 0.023 (p = 0.003)−0.0069 ± 0.0061 (p = 0.46)0.0001 ± 0.0001 (p = 0.36)0.790.070938.3323.96
SWC (4)14.2027 ± 1.0725 (p = 0.05)−0.0356 ± 0.0491 (p = 0.60)0.0003 ± 0.0005 (p = 0.68)0.440.574659.5013.14
TFCO2 (5)3.199 ± 0.1562 (p = 0.0311)−0.0256 ± 0.0072 (p = 0.1733)0.0002 ± 0.0001 (p = 0.20)0.930.114564.002.38
TFO2 (6)39.225 ± 2.3491 (p = 0.0381)−0.4133 ± 0.1075 (p = 0.1620)0.0049 ± 0.0011 (p = 0.14)0.961.183642.1730.51
FCO2: Soil CO2 emission. FO2: Soil O2 capture. St: soil temperature. SWC: Soil water content. TFCO2: Total soil CO2 emission. TFO2: Total soil O2 capture. (1) b0: μmol m−2 s−1. b1: μmol m−2 s−1 (g L−1)−1. b2: μmol m−2 s−1 (g L−1)−2. (2) b0: mg m−2 s−1. b1: mg m−2 s−1 (g L−1)−1. b2: mg m−2 s−1 (g L−1)−2. (3) b0: °C. b1: °C (g L−1)−1. b2: °C (g L−1)−2. (4) b0: Vol%. b1: Vol% (g L−1)−1. b2: Vol% (g L−1)−2. (5) b0: ton ha−1. b1: ton ha−1 (g L−1)−1. b2: ton ha−1 (g L−1)−2. (6) b0: ton ha−1. b1: ton ha−1 (g L−1)−1. b2: ton ha−1 (g L−1)−2.
Disclaimer/Publisher’s Note: The statements, opinions and data contained in all publications are solely those of the individual author(s) and contributor(s) and not of MDPI and/or the editor(s). MDPI and/or the editor(s) disclaim responsibility for any injury to people or property resulting from any ideas, methods, instructions or products referred to in the content.