Article

Impact of Land Use Types on Soil Physico-Chemical Properties, Microbial Communities, and Their Fungistatic Effects

by
Giuseppina Iacomino
1,
Mohamed Idbella
2,*,
Salvatore Gaglione
1,
Ahmed M. Abd-ElGawad
3 and
Giuliano Bonanomi
1,4
1
Department of Agricultural Sciences, University of Naples Federico II, Via Università 100, Portici, 80055 Naples, Italy
2
AgroBioSciences (AgBS) Program, College of Agriculture and Environmental Sciences, Mohammed VI Polytechnic University, Ben Guerir 43150, Morocco
3
Plant Production Department, College of Food & Agriculture Sciences, King Saud University, P.O. Box 2460, Riyadh 11451, Saudi Arabia
4
Task Force on Microbiome Studies, University of Naples Federico II, 80138 Naples, Italy
*
Author to whom correspondence should be addressed.
Soil Syst. 2024, 8(4), 131; https://doi.org/10.3390/soilsystems8040131
Submission received: 6 October 2024 / Revised: 11 December 2024 / Accepted: 13 December 2024 / Published: 16 December 2024

Abstract

:
Soilborne plant pathogens significantly impact agroecosystem productivity, emphasizing the need for effective control methods to ensure sustainable agriculture. Soil fungistasis, the soil’s ability to inhibit fungal spore germination under optimal conditions, is pivotal for biological control. This study explores soil fungistasis variability across land-use intensities, spanning deciduous and evergreen forests, grasslands, shrublands, and horticultural cultivations in both open fields and greenhouses. Soil characterization encompassed organic matter, pH, total nitrogen, C/N ratio, key cations (Ca2+, Mg2+, K+, Na+), enzymatic activities, microbial biomass, and soil microbiota analyzed through high-throughput sequencing of 16s rRNA genes. Fungistasis was evaluated against the pathogenic fungi Botrytis cinerea and the beneficial microbe Trichoderma harzianum. Fungistasis exhibited similar trends across the two fungi. Specifically, the application of glucose to soil temporarily annulled soil fungistasis for both B. cinerea and T. harzianum. In fact, a substantial fungal growth, i.e., fungistasis relief, was observed immediately (48 h) after the pulse application with glucose. In all cases, the fungistasis relief was proportional to the glucose application rate, i.e., fungal growth was higher when the concentration of glucose was higher. However, the intensity of fungistasis relief largely varied across soil types. Our principal component analysis (PCA) demonstrated that the growth of both Trichoderma and Botrytis fungi was positively and significantly correlated with organic carbon content, total nitrogen, iron, magnesium, calcium, and sodium while negatively correlated with fluorescein diacetate (FDA) hydrolysis. Additionally, bacterial diversity and composition across different ecosystems exhibited a positive correlation with FDA hydrolysis and a negative correlation with phosphoric anhydride and soil pH. Analysis of bacterial microbiomes revealed significant differences along the land use intensity gradient, with higher fungistasis in soils dominated by Pseudoarthrobacter. Soils under intensive horticultural cultivation exhibited a prevalence of Acidobacteria and Cyanobacteria, along with reduced fungistasis. This study sheds light on soil fungistasis variability in diverse ecosystems, underscoring the roles of soil texture rather than soil organic matter and microbial biomass to explain the variability of fungistasis across landscapes.

1. Introduction

Germination of fungal spores is normally inhibited in soil due to the phenomenon called fungistasis, described for the first time by Dobbs and Hinson in 1953 [1]. Numerous factors directly influence or indirectly change the fungistatic level of soil, including its own physical-chemical properties [2] and, more recently, the functional diversity of the native microbiota [3]. All these factors have been extensively studied over the last 50 years, providing several explanations that have improved understanding of this soil property [4]. Two main hypotheses have been proposed to explain fungistasis. The first hypothesis claims that nutritional competition, due to the native microbiota, for highly degradable organic compounds makes them almost completely unavailable for the germination of fungal spores. In this regard, the application of any exogenous energy source causes a temporary reduction in soil fungistasis [5]. The second hypothesis claims that the presence of inhibitory factors in the soil represents the main control factor of fungistasis [6].
In the last 20 years, numerous studies have highlighted the important role played by soil microorganisms in terms of variations in the level of fungistasis [7,8]. For example, fungistasis can be reduced following the disruption of native microbiota induced in the soil, such as sterilization or the addition of antibiotics [9]. De Boer et al. [10] demonstrated that the composition of the soil microbial community represented an important factor in the control of fungistasis, especially for the presence of bacteria of the Pseudomonas genus. Furthermore, some studies highlight the important role of volatile organic compounds such as ammonia and ethylene, which can reduce or inhibit the germination of the fungal spores of numerous species [11,12]. Many of these compounds with fungistatic action have been detected in neutral or alkaline soils [13].
The quality of the soil, therefore, especially in the presence of reduced organic inputs such as crop residues and organic amendments, degrades in a few years with negative effects on the control of soilborne pathogens [14]. To mitigate these effects, it is necessary to test innovative cultivation techniques. In both organic and conventional agriculture, the use of organic amendments has been proposed to recover soil quality [15]. This solution is proposed to revitalize the soil resource using compost or another organic amendment like manure, green manure, and, more recently, biochar [16]. Complementary mechanisms have been indicated to explain the ability of organic soil improvers to hinder soilborne pathogens: (i) increase in the activity of microbial antagonists; (ii) increased competition for resources to the detriment of pathogens and the onset of fungistasis; (iii) release of fungitoxic compounds during the decomposition of the organic substance; (iv) induction of systemic resistance in host plants. For these reasons, it is important to know the properties of soil that have both a direct and indirect action in regulating the intensity of fungistasis and the resilience time, i.e., the time necessary to restore fungistasis following the imbalance brought to the soil by the addition of soil improvers [5].
In this context, the aim of this study was to assess the level of fungistasis in eight soils collected from various locations within the Campania Region, encompassing both natural ecosystems and agroecosystems. Specifically, we sought to investigate the combined effects of soil type and management history, including organic inputs, mineral fertilizers, and pesticide use, on fungistatic activity. To achieve this, a diverse range of soil types was analyzed to explore the connections between the physical, chemical, and biological characteristics of soils and their fungistatic potential. Given that soil quality is influenced by numerous factors and fungistasis is governed by various processes and properties within the soil system, it was crucial to measure a comprehensive set of chemicals, physical, biological, and microbiological parameters to differentiate the soils based on their ability to induce fungistasis. This interdisciplinary approach involved comparing eight soils from different ecosystems and geographical areas within the Campania Region. Each soil underwent chemical, physical, microbiological, and enzymatic analyses, followed by a bioassay to evaluate fungistatic activity using the pathogenic fungus Botrytis cinerea and the beneficial microbe Trichoderma harzianum. This study aimed to test specific hypotheses regarding these interactions:
  • Pathogenic fungi are more sensitive to fungistasis than beneficial ones;
  • Fungistasis is greater in soils with a higher content of organic substance and subject to greater organic inputs;
  • Fungistasis is greater in soils with higher microbial biomass, activity, and diversity.

2. Materials and Methods

2.1. Study Sites and Soil Collection

Soil samples were collected from eight ecosystems located in the Campania Region of southern Italy (Figure 1). These ecosystems included a grassland dominated by Ampelodesmos mauritanicus L., a shrubland with various Mediterranean shrubs (Euphorbia dendroides L., Juniperus phoenicea L., Myrtus communis L., Pistacia lentiscus L., and Salvia rosmarinus L.), a Pinus forest (Pinus pinea L.), a Quercus forest with both evergreen (Quercus ilex L.) and deciduous species (Quercus pubescens L.), and a Fagus forest dominated by Fagus sylvatica L. Additionally, agroecosystems included an olive orchard (Olea europaea L.), open-field horticultural soils under crop rotation (Lactuca sativa, Solanum lycopersicum, Cucurbita pepo, and Brassica oleracea), and a greenhouse system cultivating Lactuca sativa and Eruca sativa in rotation. The mean annual temperature (MAT) in natural ecosystems ranged from 10.6 °C in the Fagus forest to 17.6 °C in the shrubland, while agroecosystem MATs ranged from 14.8 °C in the olive orchard to 19.6 °C in the greenhouse. Regarding annual rainfall, natural ecosystems received 789 mm in the shrubland and 1480 mm in the Fagus forest. Agroecosystems, on the other hand, were characterized by regular input applications, unlike natural ecosystems, which did not receive fertilizers or pesticides. In the greenhouse and open-field horticultural systems, copper, synthetic fungicides, and insecticides were applied 8 to 16 times annually, with soil fumigated using metham sodium every three years in the greenhouse. The olive orchard was treated with copper twice per year. Tillage also varied across the agroecosystems: greenhouse soils were tilled 4 to 8 times annually, horticultural soils 4 to 6 times annually, and the olive orchard was mowed twice yearly (Table 1). Organic inputs also differed significantly between natural and agroecosystems. Natural ecosystems relied on natural litterfall, ranging from 1 t ha−1 year−1 in the shrubland to 3 t ha−1 year−1 in the Fagus forest. In contrast, agroecosystems incorporated organic amendments such as manure pellets, applied at approximately 0.5 t per year, alongside crop residue management (Table 1).
Soil samples were collected from the top 20 cm of depth after the removal of the litter layer when present in the spring of 2022 (April–May), considered the optimal period for soil collection [17]. To avoid bias in the conducted analyses, a standardized protocol was employed for all samples during the collection step. Specifically, replicate plots of 100 m × 50 m were selected within each ecosystem. Within each replicate plot, a composite sample of 1000 g of soil was collected from ten different positions, each contributing 100 g. This method ensured a representative sampling of the diversity within each ecosystem. Due to logistical constraints, the number of samples collected varied among ecosystems. Specifically, 7 samples were collected from each of the grassland, olive orchard, and Pinus forest; 9 samples from the shrubland, Fagus forest, and horticultural ecosystem; 8 samples from the Quercus forest; and 22 samples from the greenhouse. In total, 78 soil samples were collected for this study. The samples were subsequently placed in polyethylene bags, transferred to the laboratory, and sieved through a special sieve with 2 mm mesh. Biochemical and microbiological analyses and bioassays were carried out on fresh soil samples stored at +4 °C until the time of analyses conducted within 10 days of sampling. Texture and chemical analyses were evaluated on dried samples and kept at room temperature until a constant weight was reached.

2.2. Soil Physical and Chemical Analyses

Physical and chemical analyses were performed on five soil replicates of each ecosystem. The physical and chemical properties of the soils were determined using official methods [18]. Undisturbed soil samples of known volume taken in the first 20 cm of depth were analyzed to determine the bulk density by the gravimetric method after drying for 48 h at 105 °C. To determine the texture, the “pipette” method was used; pH and electrical conductivity were measured using a soil suspension with aqueous extract with ratios of 1:2.5 and 1:5, respectively. Total carbonates (limestone) were determined using the Dietrich–Fruehling calci metric method [19]. The organic C content was evaluated on 1 g of pulverized soil by the chromic acid titration method. Total nitrogen (referred to 30 mg of pulverized soil) was determined by flash combustion with a CNS elemental analyzer (Thermo FlashEA 1112, Thermo Scientific, Bremen, Germany). Available potassium was measured by bicarbonate extraction. Cation exchange capacity was measured following soil treatment with a solution of barium chloride and triethanolamine at pH 8.20. The exchange bases (Ca2+, Mg2+, K+, Na+) were tested by flame atomic absorption spectrometry. Iron, copper, zinc, and manganese were similarly extracted using a solution of diethylethylenetriamine pentacetic acid (DTPA) plus calcium chloride and triethanolamine at pH 7.30 and analyzed by atomic absorption spectroscopy (AAS) [20].

2.3. Microbiological Analyses

Microbial composition, diversity, and activity were evaluated by analyzing different parameters. The microbial activity was quantified with the fluorescein diacetate (FDA) method, which measures the total enzymatic activity (protease, lipase, esterase—non-specific) important during the decomposition of organic substances [21]. Microbial biomass was determined using the fumigation–extraction method of Vance et al. [22]. It consists of causing the death of soil microorganisms by treatment with chloroform (fumigation) and subsequent extraction of the released C with K2SO4. By the difference between the C extracted with K2SO4 from the fumigated samples and the C extracted from the non-fumigated samples (carbon flux), the C associated with the dead microorganisms is determined. In the presence of a strong acid, the organic substance is oxidized, and Cr (+6) is reduced to Cr (+3). The excess dichromate is determined by titration with ferrous ammonium sulfate hexahydrate. For the calculation of the associated carbon to the microbial biomass, the mg of C/100 g of dry matter is divided by the factor 0.45 [22]. For the soil microbiome, DNA was extracted from 0.4 g of soil using the DNeasy PowerSoil Kit (QIAGEN, Germantown, MD, USA). DNA concentration and purity were checked with a Nanodrop 2000 (ThermoFisher, Waltham, MA, USA) and agarose gel electrophoresis. High-throughput sequencing targeted the V3/V4 regions of the 16s rRNA gene for bacterial communities. PCR used specific primers S-D-Bact-0341-b-S-17/S-D-Bact-0785-a-A-21 [23] following the conditions from original studies. Purified PCR products were quantified, pooled, and sequenced on an Illumina MiSeq platform. Demultiplexed fastq files were processed using the DADA2 pipeline. Sequences were trimmed, filtered, and primers removed. Error rates were estimated, and sequence variants were identified using the dada algorithm, followed by chimera removal. Taxonomy was assigned using the SILVA database. Contaminants and singleton ASVs were removed, and relative abundances were recalculated.

2.4. Assessing Soil Fungistasis

Fungistasis was evaluated by quantifying the hyphal development of two fungal species: B. cinerea and T. harzianum. Fungal growth was quantified in soils amended with glucose at increasing concentrations (0%, 0.1%, 0.3%, 1%, 3%) after 48, 96, and 168 h after amendment. Aqueous extracts were prepared from the amended soils by mixing 10 g of soil with 10 mL of distilled-sterile water (water–soil ratio 1:1) in falcon tubes placed on an oscillating platform for 30 min at a speed of 200 rpm and kept at room temperature (20 °C). Subsequently, the soil suspensions obtained were centrifuged for 10 min at 2400× g, and the supernatant was collected and sterilized by microfiltration with filters having pores with dimensions of 0.22 μm and stored at −20 °C until bioassays. The fungistasis of sterile soil extracts was evaluated by measuring the hyphal growth of two fungi belonging to different functional groups: B. cinerea (polyphagous phytopathogen) and T. harzianum (mycoparasite and saprophyte, commercially available in the form of formulations used for as beneficial microbe). In preliminary experiments, the spores of all fungi have been tested for their ability to germinate in water to evaluate their sensitivity to fungistasis. The fungal inoculum for the bioassays was obtained by collecting the viable spores of the fungi (conidia) directly from the germination plates by adding 10 mL of sterile water to the fungal cultures, which were grown in Petri dishes on PDA (potato dextrose agar) for a period of approximately 10 days, and scraping the surface of the fungal mycelium with a spatula to remove the conidia. The water spore suspension thus obtained was filtered, centrifuged, subjected to double washing with sterile water, and brought to a conidia concentration of 10−5 mL−1 using a hemocytometer. The spore suspension used for testing germination with the two fungi was prepared in 10 μL of sterile water. Soil extracts (90 μL) were added to the 96 well plate and incubated at 24 °C. Fungal growth was quantified by spectrophotometric reading (l = 590 nm) after 48 h of incubation using the Thermomax microplate reader (Molecular Devices, Wokingham, UK).

2.5. Statistical Analysis

Alpha diversity metrics, including species richness and the Shannon index, were calculated using PRIMER 7 software (Primer-E Ltd., Plymouth, UK), with the associated boxplots generated in RStudio version 4.2.2 utilizing the ggplot2 package. To evaluate the diversity of soil bacterial communities across ecosystems, a Permutational Multivariate Analysis of Variance (PERMANOVA) with 999 permutations was applied. The bacterial taxa contributing most significantly to ecosystem dissimilarities were identified through Similarity Percentages (SIMPER) analysis based on the Bray–Curtis dissimilarity matrix performed in PAST software (version 4.10). Their distribution across ecosystems was visualized using a biplot PCA graph created with the factoextra package in RStudio. The soil chemistry dataset was standardized using z-scores, and overlay vectors based on Pearson correlation were added to explore the influence of chemical variables on community structure. For bacterial diversity, the Shannon index was used as a measure, while community composition was analyzed using the first axis of a PCoA based on the Bray–Curtis dissimilarity matrix. Variations in alpha diversity metrics and soil chemical variables between ecosystems were assessed using ANOVA, with Tukey post hoc tests applied for pairwise comparisons to identify significant differences between ecosystems. A significance threshold of p < 0.05 was applied for all statistical tests, which were conducted using STATISTICA 13.3 software.

3. Results

3.1. Soil Chemical and Physical Properties

Soil physical and chemical parameters significantly differed among the selected ecosystems (p-value < 0.01). Specifically, greenhouse, grassland, Pinus, Quercus, and Fagus forests have sandy soils, while open-field horticulture, shrubland, and olive orchards have medium-texture soils (Table 2). The Pinus forest and open field horticulture soils exhibited the highest pH, while grassland and olive orchards had the lowest values. The EC shows relatively low values with minimal differences between the eight soils. On the contrary, the limestone content shows large differences with very high values for the Pinus forest, followed by the Fagus and Quercus forest and the open field horticulture. Organic carbon content also shows wide variations, with the highest values in natural ecosystems and the lowest in agroecosystems. Total nitrogen is highest in grassland, followed by Fagus and Quercus forest, with the lowest values for Pinus forest and greenhouse. Consequently, the C/N ratio is maximum, above 18, for the Pinus forest, followed by the Fagus forest. The lowest values of the C/N ratio are found for the soils of agroecosystems subject to greater inputs of nitrogen fertilizers. The phosphorus content is particularly high for greenhouses and open-field horticulture, with low values for grassland and olive orchards. Regarding exchangeable Ca, higher values were found for natural ecosystems, in particular for Fagus forest and grassland, and low for agroecosystems. Exchange Mg was also higher for forest soils (Pinus, Quercus, and Fagus forests) compared to other ecosystems and agroecosystems. Na and K content were particularly high in the Quercus forest, with the lowest values for olive orchards. Cu is particularly high for greenhouses and open-field horticulture, while in natural ecosystems, the values are always low, with the sole exception of the Quercus forest. Zn always shows high values for the Quercus forest and for the greenhouse and Fagus forest. Mn shows similar values for all soils, with low values only for the grassland and, in particular, for the greenhouse. The enzymatic activity quantified with the FDA was maximum for Quercus forest and shrubland and minimum for Fagus forest. On the contrary, microbial biomass was highest for Fagus forest, followed by grassland and shrubland, with the lowest values for greenhouse, olive orchard, and open field horticulture (Table 2).

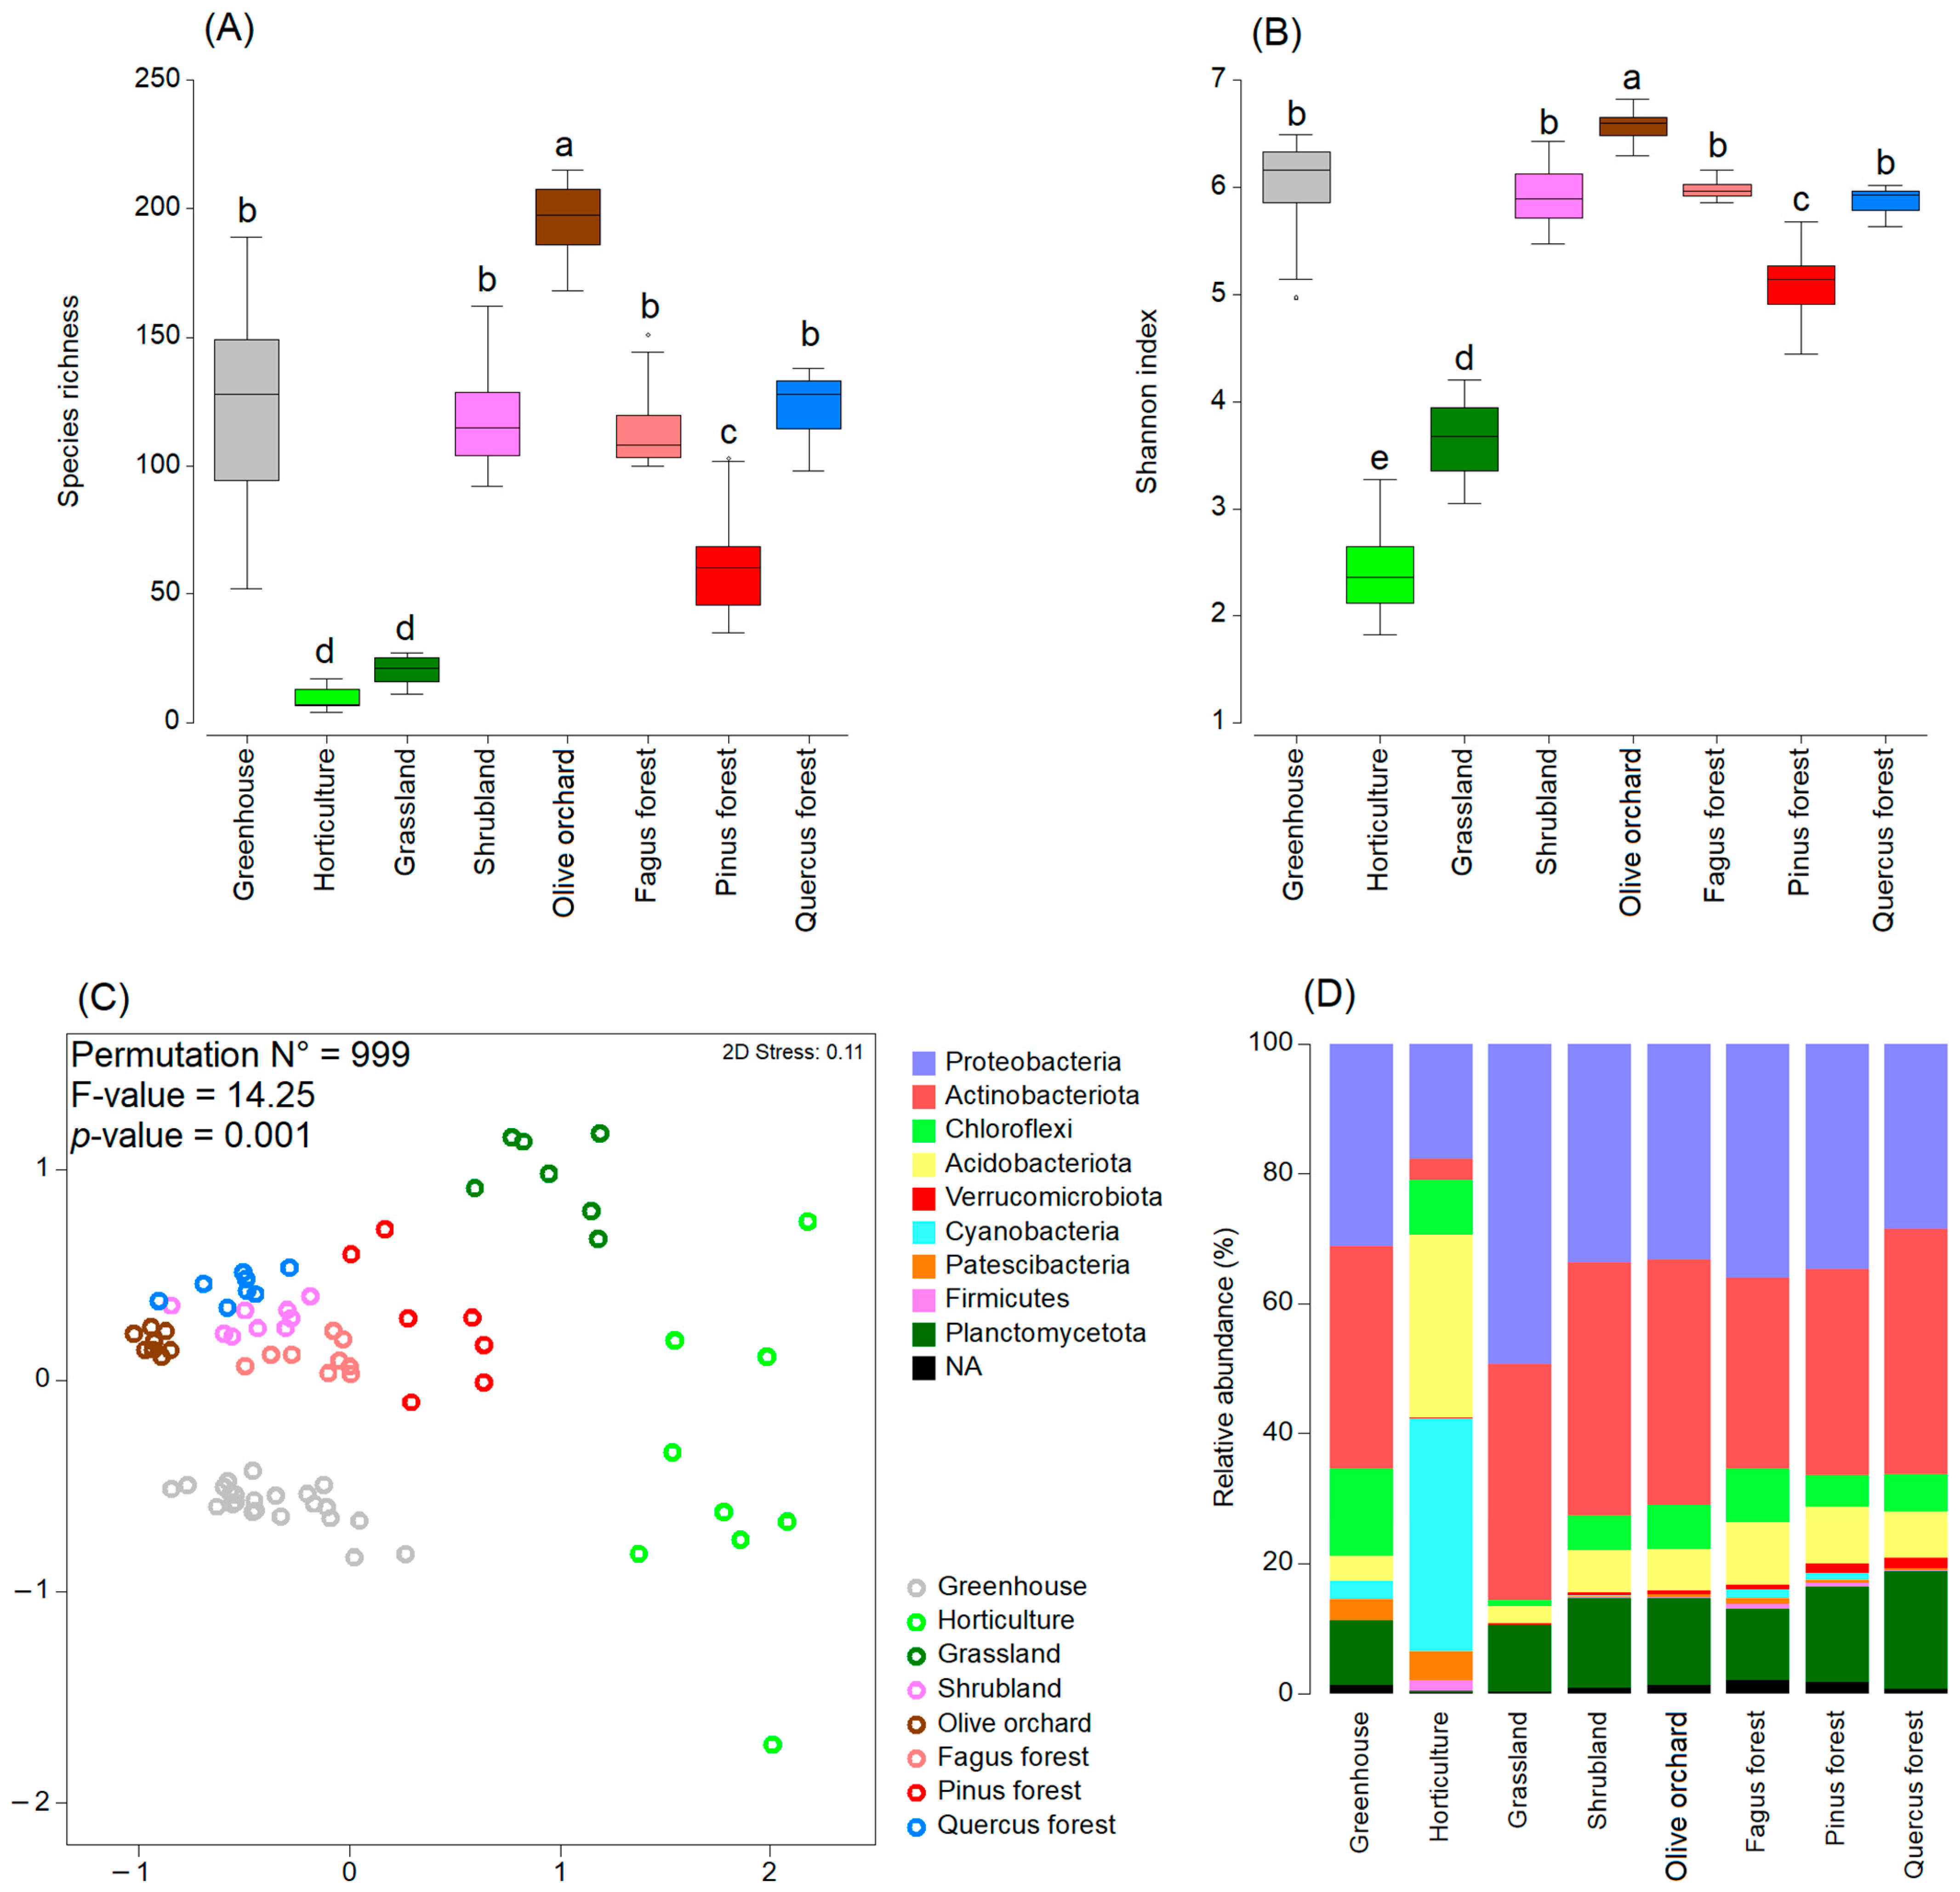
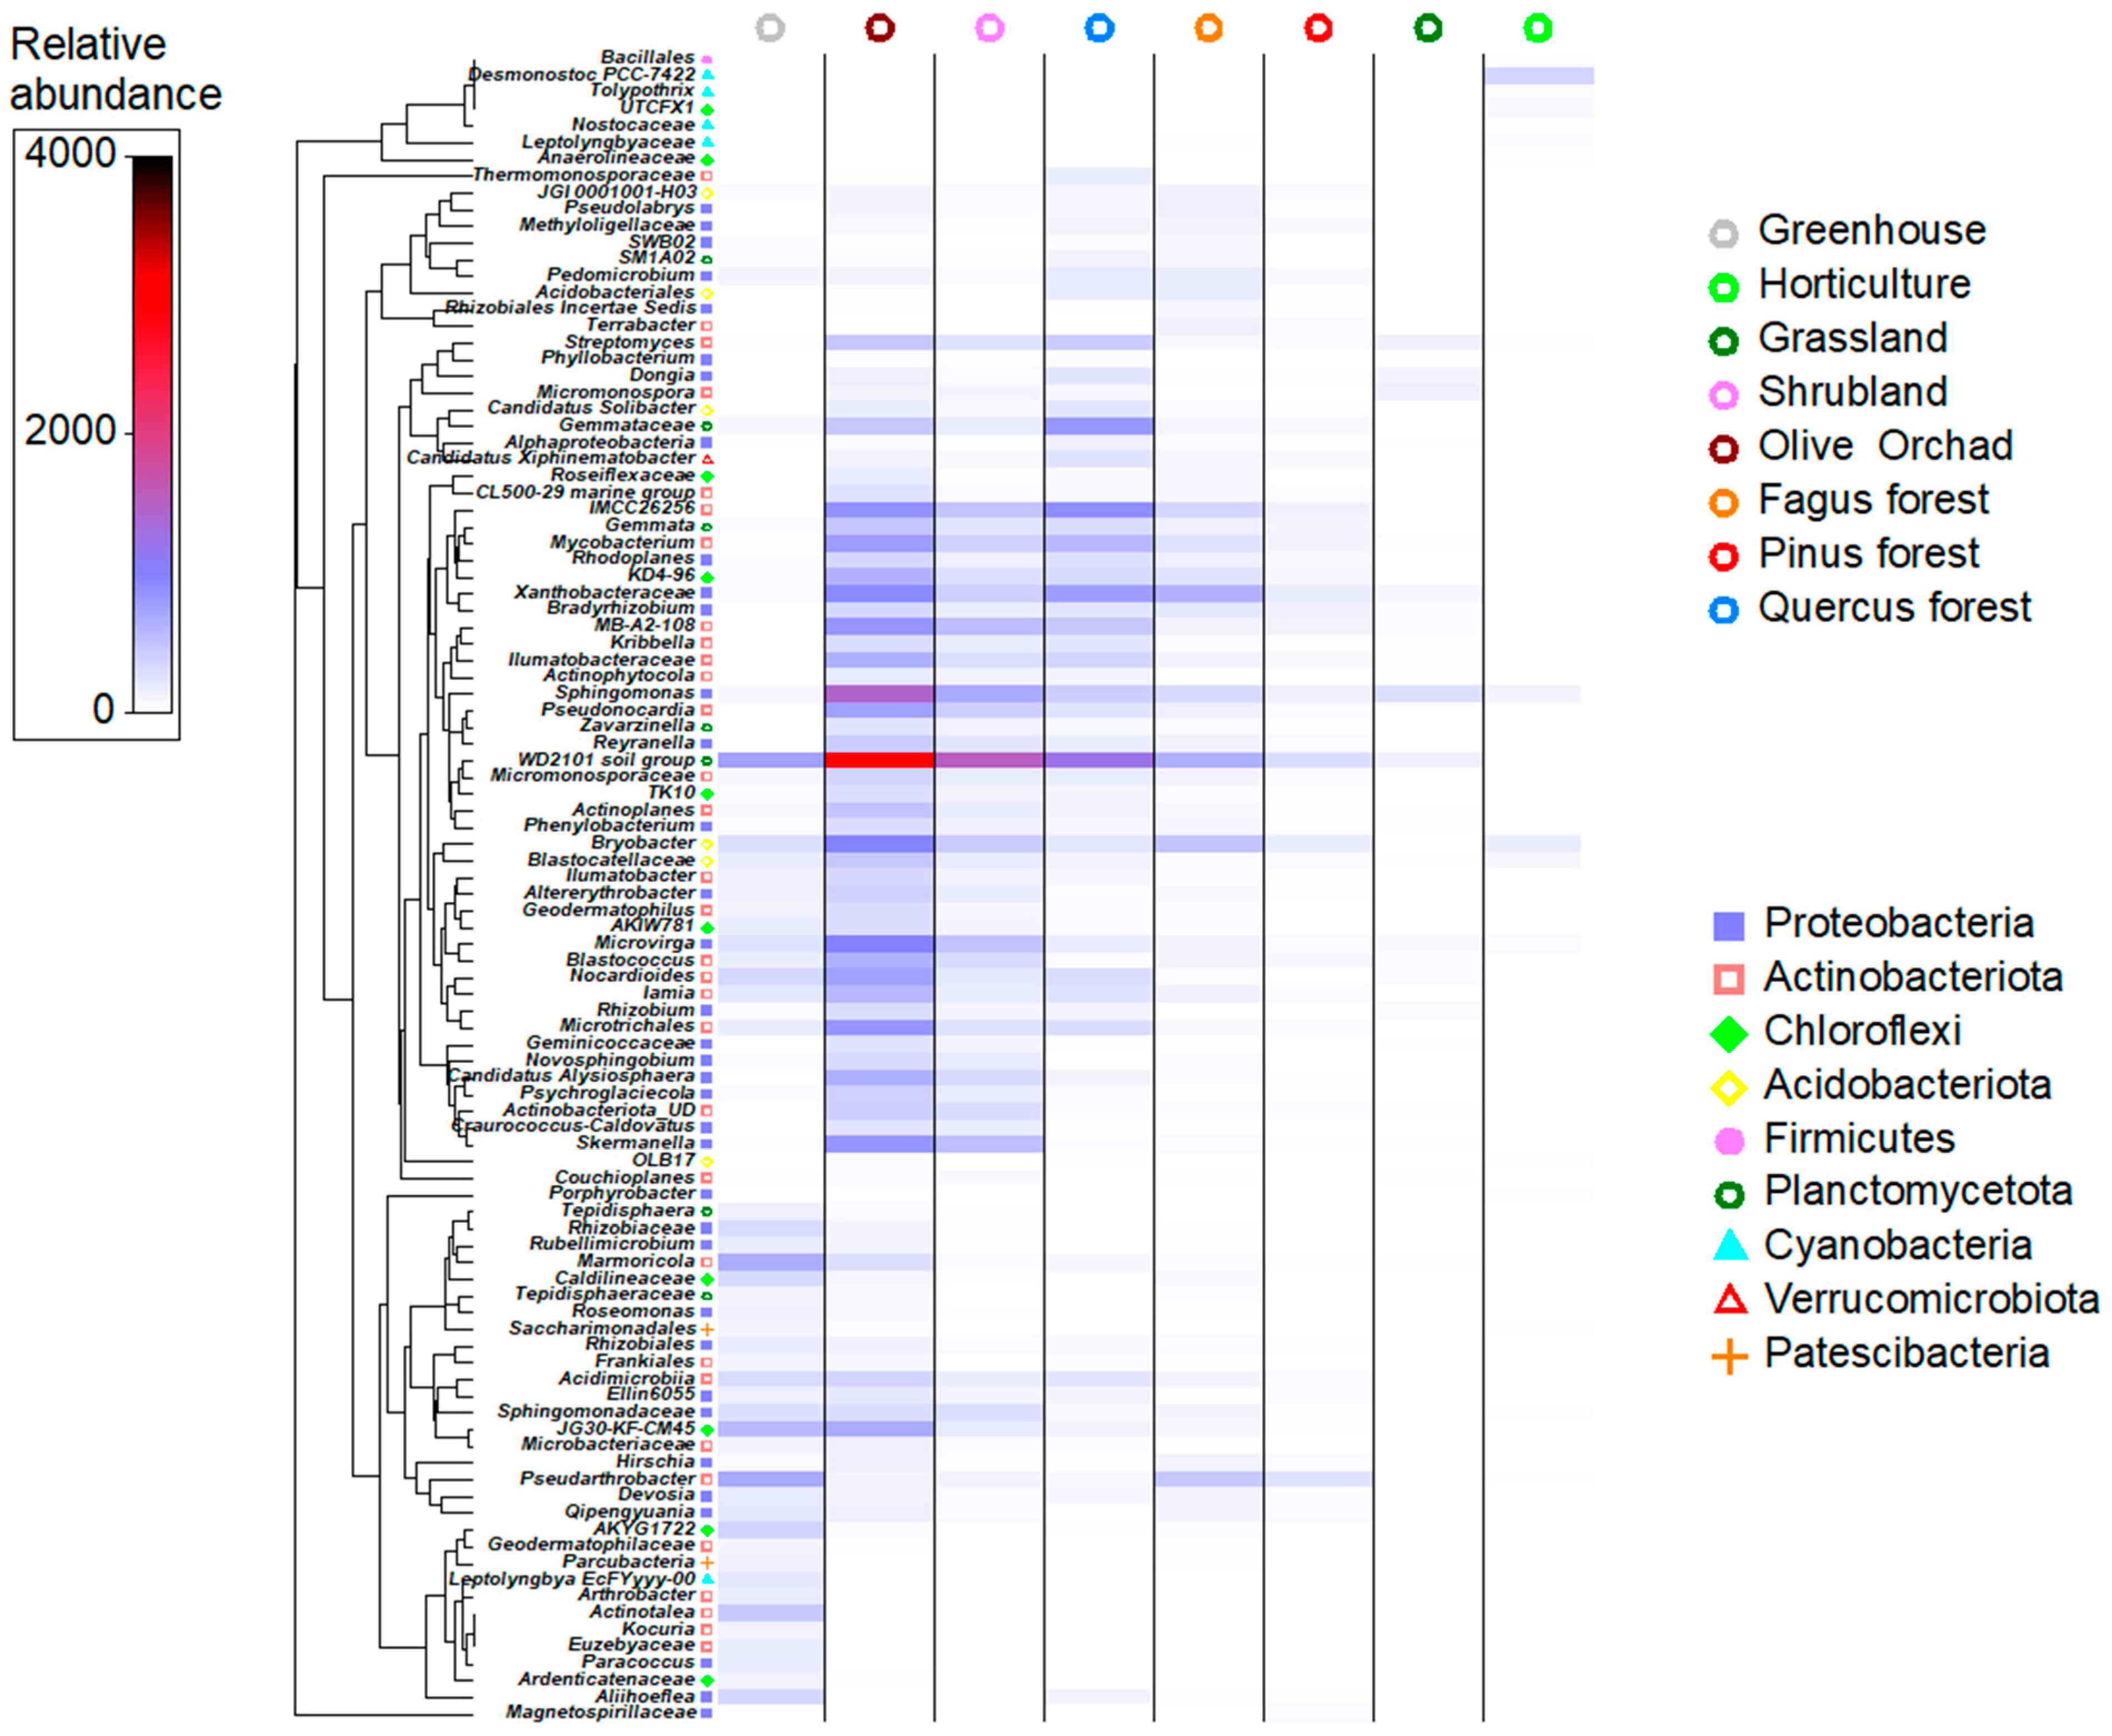
3.2. Soil Microbiome

Species richness and the Shannon index for bacterial communities varied significantly among the ecosystems studied (Figure 2A,B). Bacterial diversity was lowest in horticultural and grassland soils for both metrics. On the other hand, both species richness and the Shannon index were highest in olive orchard soils.
The non-metric multidimensional scaling analysis (NMDS) of bacterial structure (Figure 2C) revealed clear separations among ecosystems (Fvalue = 14.25, p-value = 0.001). Notably, soils from greenhouses, horticultural areas, grasslands, and Pinus forests showed distinct spatial ordination. Although soils from shrubland, Fagus, Quercus, and olive orchards were closer in spatial ordination, they remained clearly distinct from each other. In addition, bacterial composition at the phylum level varied significantly among ecosystems (Figure 2D). While Proteobacteria and Actinobacteria dominated most soils, horticultural soils were primarily dominated by Acidobacteria and Cyanobacteria.
At the lowest taxonomic level, the heatmap representing the 100 most abundant taxa revealed distinct differences between ecosystems (Figure 3). Specifically, the olive orchard ecosystem was characterized by a high abundance of several taxa, including Bryobacter, Microtrichales, Sphingomonas, WD2101, and Microvigra. In contrast, the greenhouse ecosystem exhibited a higher abundance of Marmoricola, Pseudoarthrobacter, Actinotalea, and Aliihoeflea. Additionally, the Quercus forest ecosystem was distinguished by a greater abundance of Thermomonosporaceae, Gemmataceae, and IMCC26256. The horticultural ecosystem, on the other hand, was notably characterized by a higher abundance of Bacillales genera compared to the other ecosystems.

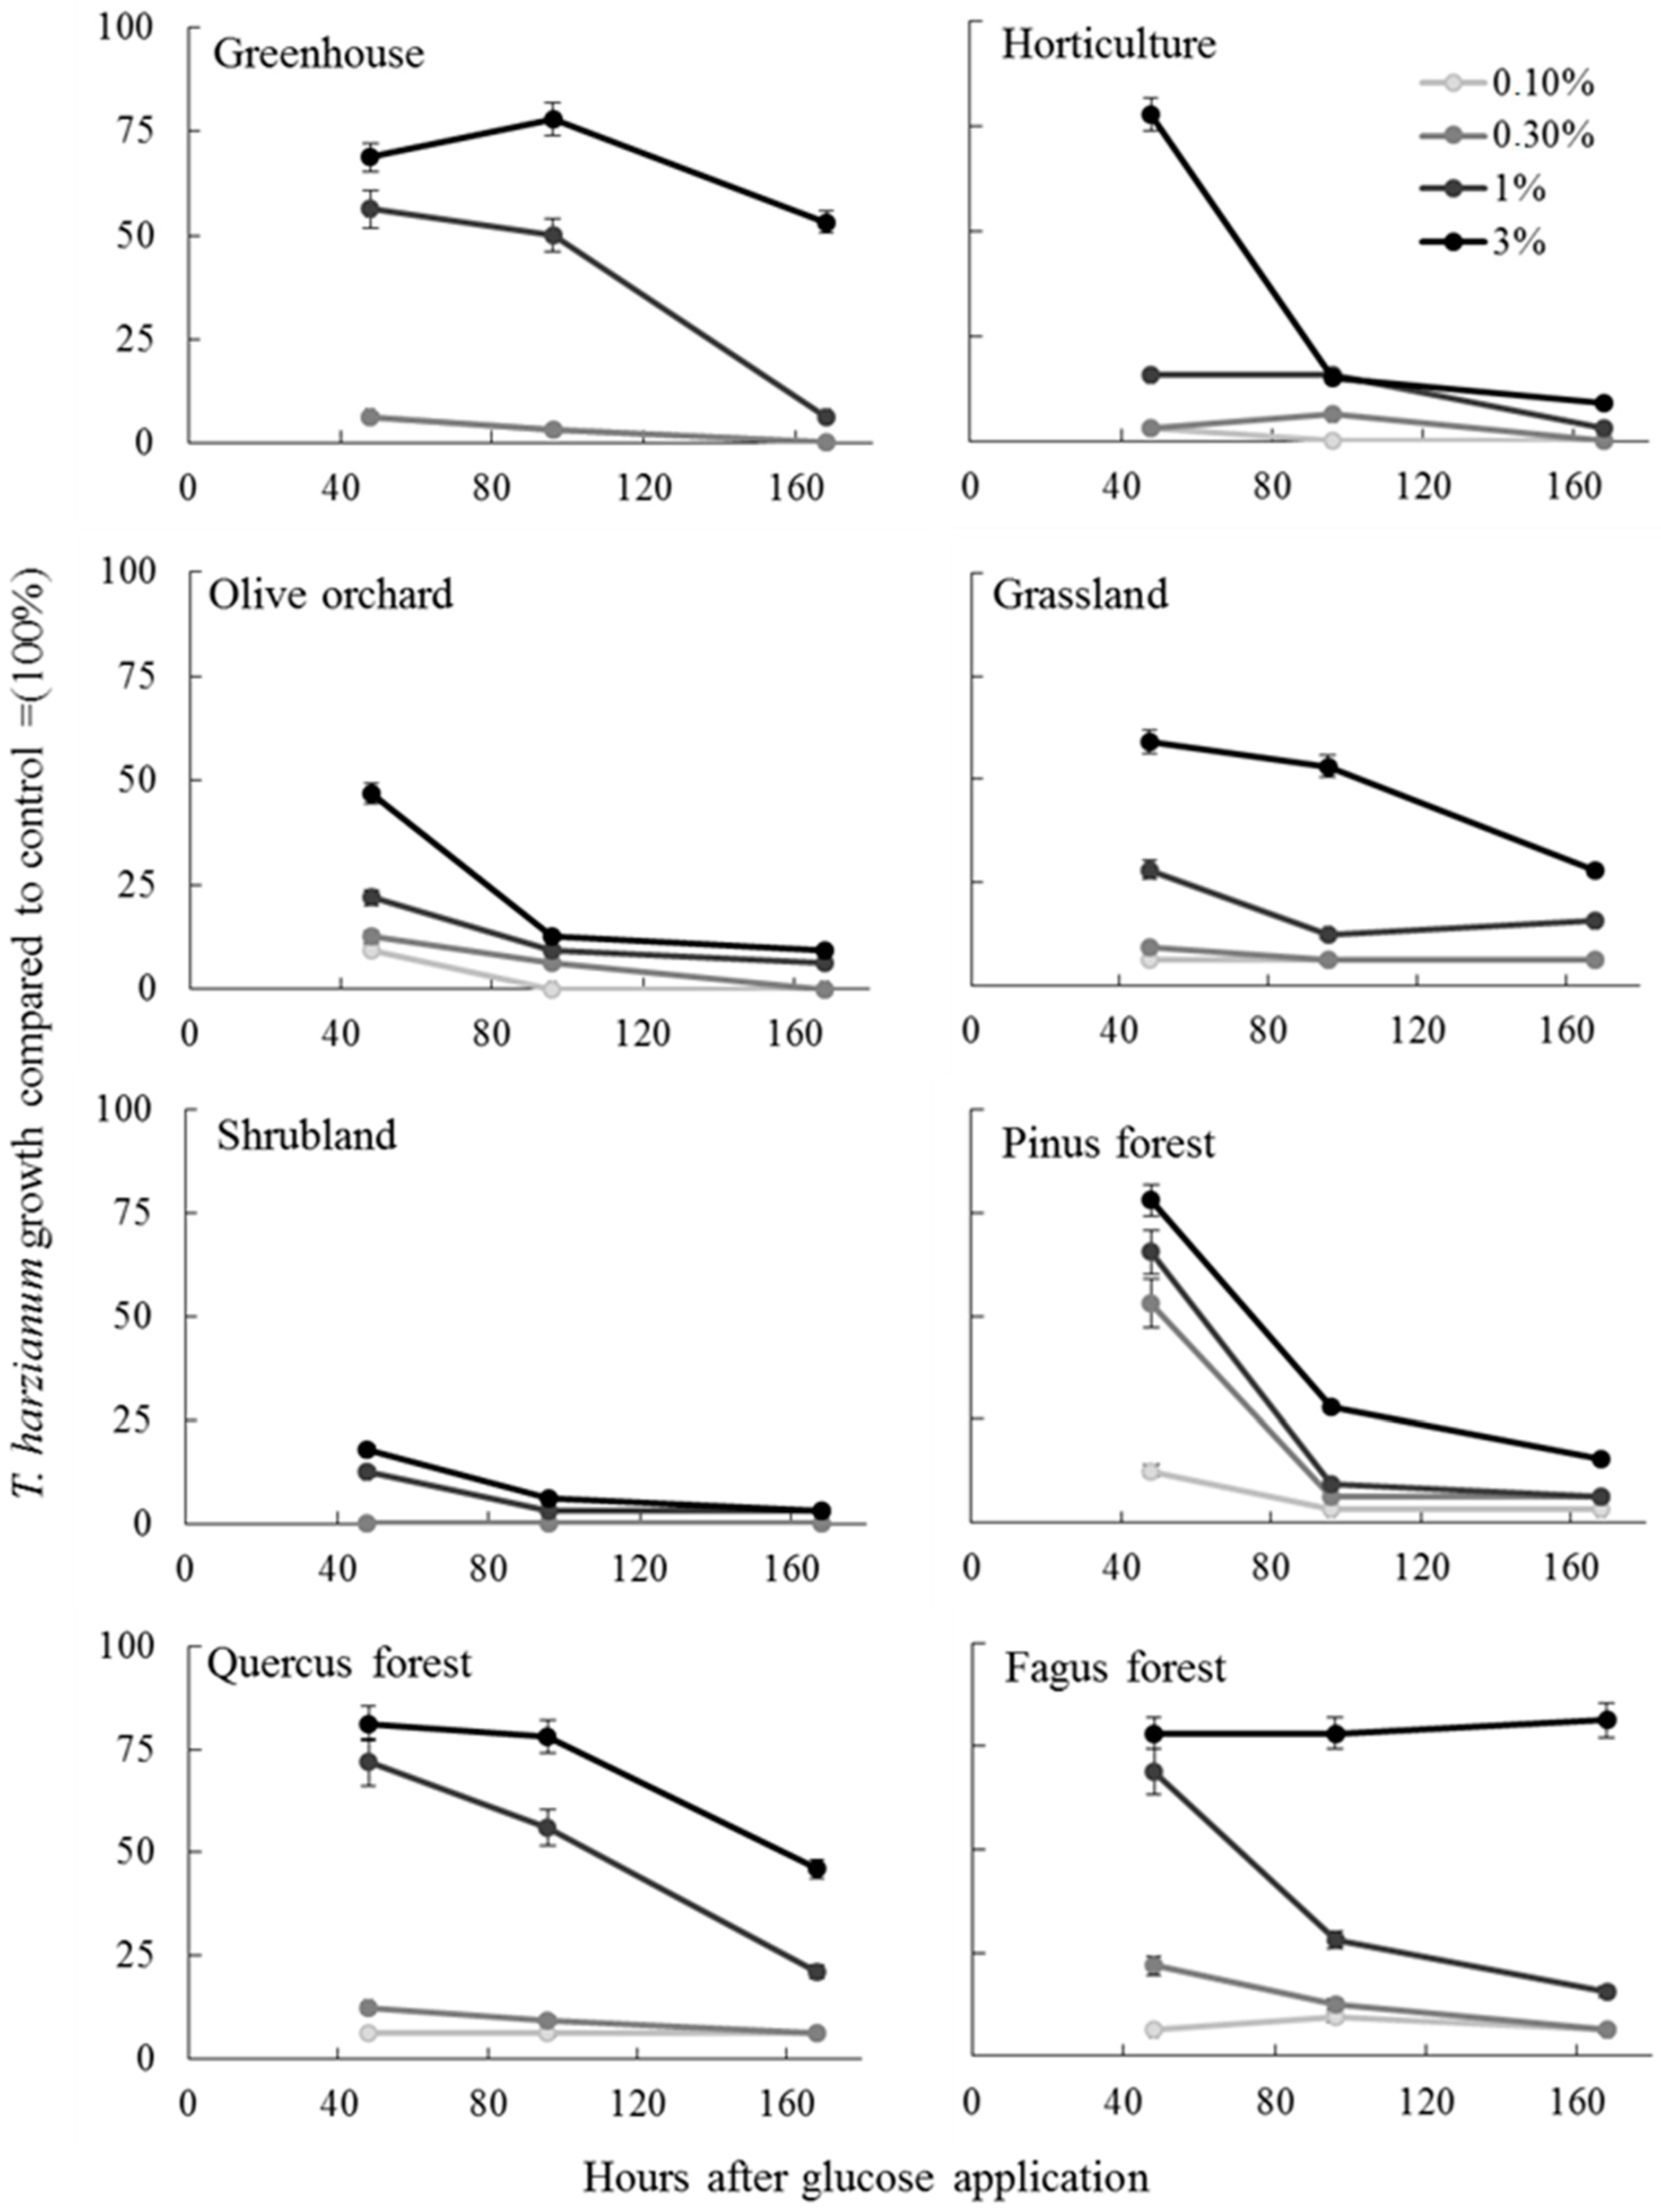
3.3. Soil Fungistasis

In the fungistasis bioassays, soil type, glucose application rate, and incubation times had statistically significant effects on the growth of the two fungal species (three-way ANOVA, p < 0.01 for all three factors). The pulse application of glucose to soil temporarily annulled soil fungistasis for both B. cinerea and T. harzianum (Figure 4 and Figure 5). In control, corresponding to the not amended soil, the growth of B. cinerea and T. harzianum was completely inhibited during the entire experiment, demonstrating that the soil was in a fungistatic condition (Figure 4 and Figure 5). In contrast, the growth of the two fungal species showed a substantial increase (i.e., fungistasis relief) immediately (48 h) after the pulse application with glucose. In all cases, the fungistasis relief was proportional to the glucose application rate, i.e., fungal growth was higher when the concentration of glucose was higher. Thereafter, the growth of all fungal species showed a progressive and statistically significant decrease, with differences related to soil type. For B. cinerea, for example, relief was greater for greenhouse, open field horticulture, Quercus, and Fagus forest soils. At the same time, fungistasis took longer to re-establish in the Fagus forest and greenhouse compared to other soils, such as grassland and olive orchards, where fungistasis was greater. For T. harzianum, the relief was, on average, higher than for B. cinerea, and among the soils, shrubland and olive orchard were those with the greatest fungistasis. For T. harzianum, the time to re-establish fungistasis was also longer than for B. cinerea. In particular, for a greenhouse, Quercus forest, and especially Fagus forest soil after 168 h, fungistasis was still not re-established when the pulse intervention with glucose was carried out at the highest concentrations (1% and 3%).

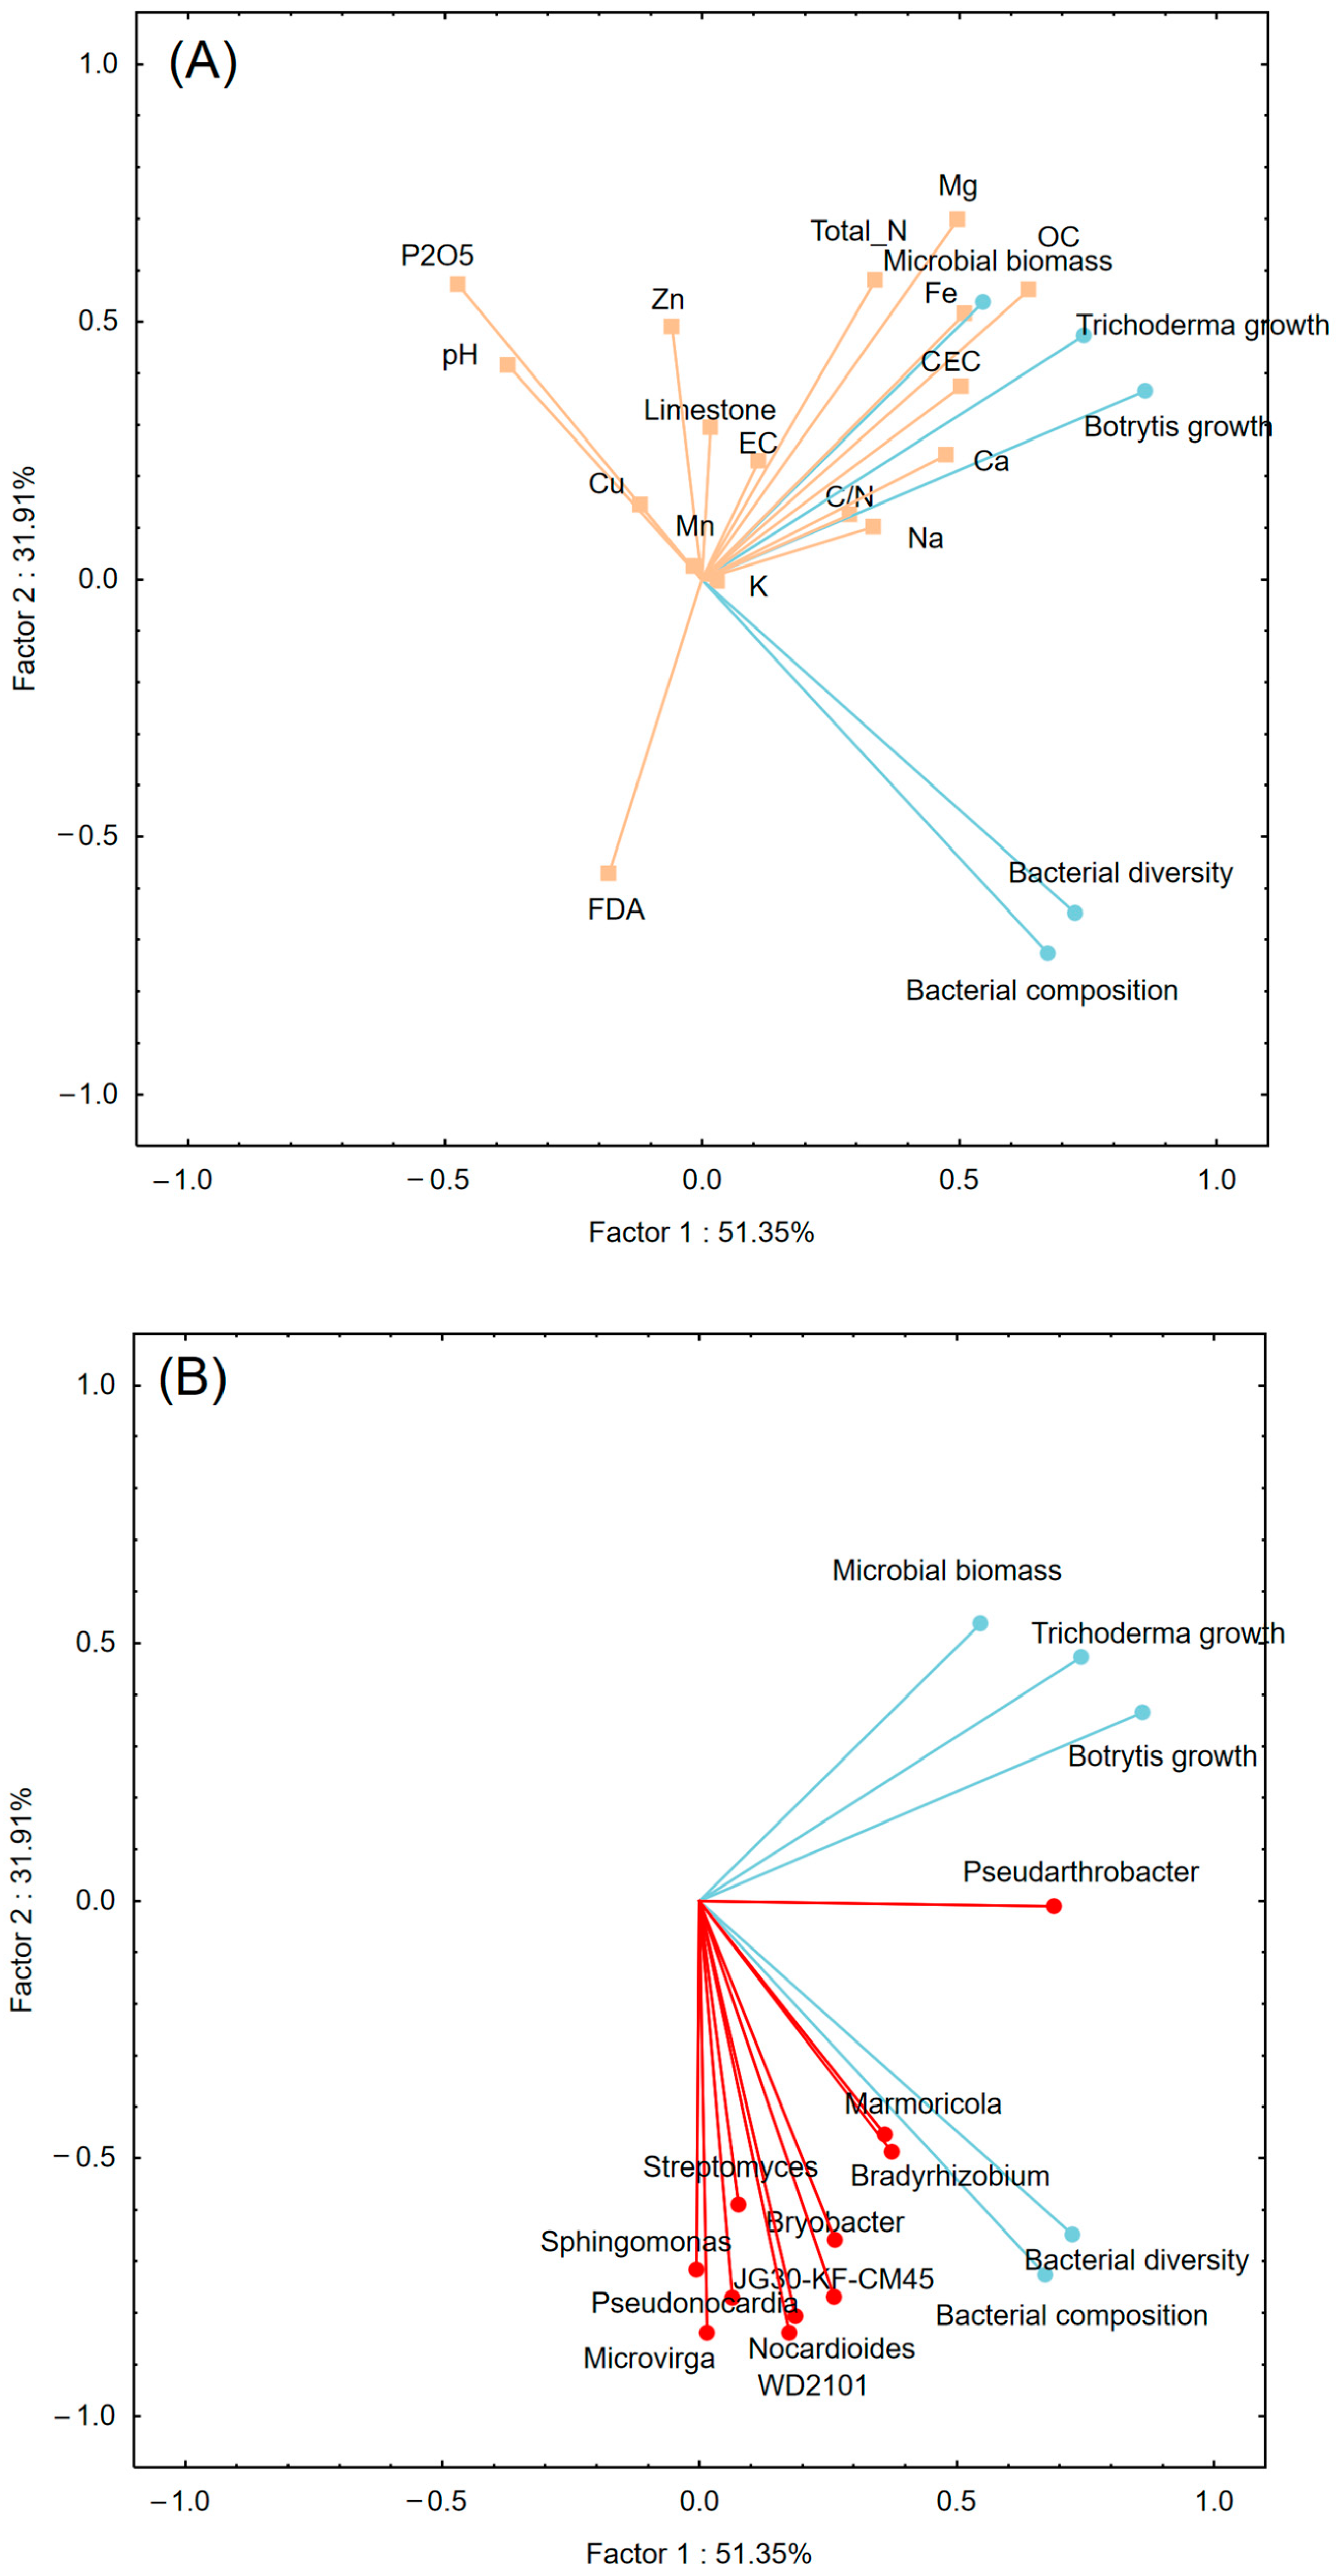
3.4. Linking Soil Fungistasis to Chemical and Microbiological Traits

Our Principal Component Analysis (PCA) results (Figure 6) demonstrated that the growth of both Trichoderma and Botrytis fungi was positively and significantly correlated with organic carbon content, total N, Fe, Mg, Ca, and Na, while negatively correlated with FDA. Additionally, bacterial diversity and composition across different ecosystems exhibited a positive correlation with FDA hydrolysis and a negative correlation with P2O5 and soil pH.
At the lowest taxonomic level, the correlation of fungistasis capacity with the taxa most contributing to observed differences in different ecosystems, as determined by the SIMPER statistical test, revealed that fungal growth was positively and strongly correlated with Pseudoarthrobacter. Furthermore, microbial diversity and composition were positively correlated with higher abundances of various taxa, including Bradyrhizobium, WD2101, Streptomyces, and Nocardioides.

4. Discussion

This study, conducted with two fungal species and eight soil types spanning a broad range of physical, chemical, and microbiological traits, demonstrated that soil fungistasis responds qualitatively similarly but quantitatively differently depending on soil texture and microbiome composition. Specifically, we found that, regardless of fungal species, a pulse application of glucose causes a temporary reduction in soil fungistasis (i.e., fungistasis relief), and the time required for fungistasis restoration (i.e., the recovery of soil’s inhibitory capacity) varies with soil quality. Our results further highlight that soil amendments with organic carbon, such as glucose, have concentration- and timescale-dependent effects on fungistasis: negative in the short term (e.g., hours) and positive in the medium term (e.g., days). A rapid but temporary relief of soil fungistasis following a pulse application of organic amendments has been documented in early studies [24,25] and corroborated by more recent research [10,26]. Furthermore, the intensity of fungistasis relief has been shown to depend on the biochemical properties of the applied organic amendments, with the fastest and most pronounced relief occurring when labile carbon-rich materials are used [5]. However, focusing solely on short-term responses provides only a partial view of the role of organic amendments. Indeed, organic amendments have been observed to exert positive effects on fungistasis in the medium and long term. For instance, Bonanomi et al. [27] demonstrated that repeated applications of organic amendments accelerate fungistasis restoration, a phenomenon linked to enhanced microbial activity that rapidly depletes the labile carbon stock in the soil.
This study underscores as well the practical implications of understanding fungistasis for sustainable agriculture. Organic amendments, such as labile carbon inputs, should be applied with careful consideration of their short- and long-term effects on soil fungistasis. For example, while glucose applications temporarily reduce fungistasis, they can enhance it over the medium term by stimulating microbial activity and depleting labile carbon stocks. An additional avenue for sustainable agriculture is the application of biocontrol agents, including both fungi and bacteria [28,29]. In this context, Trichoderma, a well-known biocontrol agent [30], plays a dual role. As observed in our study, T. harzianum exhibited a slower fungistasis recovery in some soils compared to B. cinerea, likely due to its greater saprophytic capacity [31]. This suggests that Trichoderma’s efficacy is closely tied to the availability of labile carbon and the composition of the soil microbiome. The findings of our study align with existing knowledge, confirming that the application of labile carbon, such as glucose, leads to a temporary disruption of fungistasis, which, however, is restored within a few days. This phenomenon appears to be generalizable, as it was observed across all studied soils and with both fungal species. Despite this general trend, our study revealed considerable variability among soils in terms of the intensity of fungistasis disruption and the time required for its recovery. For instance, in the case of B. cinerea, the intensity of fungistasis disruption was significantly higher in soils from greenhouse, horticultural, and Quercus forest systems compared to those from grassland, shrubland, Pinus forest, and olive orchard. Similarly, for T. harzianum, the intensity of disruption varied widely among soils, with maximum levels in the greenhouse and Fagus forest soils and minimum levels in grassland, shrubland, and olive orchard soils. The rate of fungistasis recovery also exhibited notable variability: it was rapid in soils from grassland, shrubland, and olive orchard but slower in those from greenhouse and Fagus forest systems. These observations underscore the critical role of soil type in shaping the dynamic response of fungistasis.
Our study, which analyzed eight soil types and 21 physical, chemical, and biochemical parameters, provides important insights into the factors influencing fungistasis. Notably, sandy soils, irrespective of their organic matter, nutrient, and microbial biomass content, were found to exhibit weaker fungistatic effects. Additionally, these soils required longer periods to re-establish fungistasis following glucose application. This contrasts with findings from a previous study conducted in Finland, which reported no significant differences in fungistasis among six soils toward Fusarium culmorum [32]. However, the Finnish study explored a narrower texture gradient compared to our investigation. The reduced fungistasis observed in sandy soils relative to silty or clayey soils could be attributed to differences in the resident microbiome or in organic molecule adsorption processes. Surprisingly, fungistasis did not positively correlate with overall enzymatic activity or microbial biomass in our study. Previous research on a limited number of soils [6] suggested that higher microbial and enzymatic activity facilitates the rapid recovery of fungistasis, as the microbiome efficiently metabolizes labile carbon, reinstating fungistatic conditions. The apparent contradiction in our results may stem from differences in soil metabolic capacities. Agroecosystems and grasslands, which typically receive higher inputs of labile organic carbon through litterfall from lignin-poor tissues and root exudates of herbaceous species, appear more adept at rapidly restoring fungistasis. In contrast, Fagus forest soils, despite their high organic carbon content and microbial biomass, required the longest time to restore fungistasis toward T. harzianum. This discrepancy may be explained by the dominance of lignified, labile-carbon-poor organic inputs in Fagus forest ecosystems [33]. It is plausible that the fungal-dominated microbiome in these soils is less efficient at glucose catabolism compared to the microbiomes in grasslands or agroecosystems. Further studies are necessary to validate this hypothesis and elucidate the underlying mechanisms governing fungistasis dynamics in different soil types.
Notably, both fungal species studied (B. cinerea and T. harzianum) exhibited remarkably similar responses to the organic amendment. Specifically, a pronounced relief from fungistasis was observed following the glucose pulse, with restoration occurring within 168 h for most soils. These findings support the nutrient-dependent nature of the selected fungal species, as their spores require an external carbon source to initiate germination [34,35]. Despite these overarching similarities, quantitative differences in the responses of the two fungi to the organic amendments were observed. B. cinerea showed a relatively shorter fungistasis restoration period compared to T. harzianum. This result is consistent with the known greater saprophytic capabilities of T. harzianum relative to the pathogenic B. cinerea [36,37]. Future research could extend this investigation by examining the fungistasis responses of fungal pathogens with high saprophytic capacities (e.g., Sclerotinia spp. or Fusarium spp.) compared to those with lower saprophytic tendencies (e.g., B. cinerea or Verticillium spp.). Additionally, as this study focused on nutrient-dependent fungal species, it remains unclear whether fungistasis is primarily driven by nutrient depletion or the presence of potential soil inhibitors [4,5,6,7,8,9,10,11,12,13,14,15,16,17,18,19,20,21,22,23,24,25,26,27,28,29,30,31,32,33,34,35,36,37,38]. Addressing this limitation in future studies would provide a more comprehensive understanding of the mechanisms underlying fungistasis.

5. Conclusions

This study highlights the importance of considering soil type and microbial dynamics when applying organic amendments to manage soil fungistasis. Future research should explore the responses of various fungal pathogens, particularly those with differing saprophytic capacities, to further elucidate the mechanisms underlying fungistasis. Additionally, studies should aim to differentiate between the effects of nutrient depletion and soil inhibitors in driving fungistasis to better inform soil management practices. Finally, future studies should incorporate fungal community analyses through ITS sequencing to provide a more comprehensive understanding of the microbial interactions driving soil fungistasis.

Author Contributions

Conceptualization, G.B.; methodology, G.B. and M.I.; software, M.I., G.I., G.B. and S.G.; validation, G.B., M.I., G.I., S.G. and A.M.A.-E.; formal analysis, G.B., M.I. and S.G.; investigation, G.I., M.I., G.B. and S.G.; resources, G.B., G.I., A.M.A.-E. and S.G.; data curation, G.I., M.I., G.B. and S.G.; writing—original draft preparation, G.B., G.I. and M.I.; writing—review and editing, G.B., G.I., M.I. and A.M.A.-E.; visualization, G.B., M.I. and A.M.A.-E.; supervision, G.B.; project administration, A.M.A.-E. and G.B.; funding acquisition, G.I., M.I., G.B. and S.G. All authors have read and agreed to the published version of the manuscript.

Funding

This research received no external funding.

Institutional Review Board Statement

Not applicable.

Informed Consent Statement

Not applicable.

Data Availability Statement

Data are available upon request.

Acknowledgments

The authors extend their appreciation to The Researchers Supporting Project number (RSPD2024R676) King Saud University, Riyadh, Saudi Arabia.

Conflicts of Interest

The authors declare no conflicts of interest.

References

  1. Watson, A.G.; Ford, E.J. Soil fungistasis—A reappraisal. Annu. Rev. Phytopathol. 1972, 10, 327–346. [Google Scholar] [CrossRef]
  2. Lockwood, J.L. Soil Fungistasis. Annu. Rev. Phytopathol. 1964, 2, 341–362. [Google Scholar] [CrossRef]
  3. Legrand, F.; Chen, W.; Cobo-Díaz, J.F.; Picot, A.; Floch, G.L. Co-occurrence analysis reveal that biotic and abiotic factors influence soil fungistasis against Fusarium graminearum. FEMS Microbiol. Ecol. 2019, 95, fiz056. [Google Scholar] [CrossRef] [PubMed]
  4. Garbeva, P.; Silby, M.W.; Raaijmakers, J.M.; Levy, S.B.; Boer, W.D. Transcriptional and antagonistic responses of Pseudomonas fluorescens Pf0-1 to phylogenetically different bacterial competitors. ISMEJ 2011, 5, 973–985. [Google Scholar] [CrossRef] [PubMed]
  5. Bonanomi, G.; Gaglione, S.A.; Incerti, G.; Zoina, A. Biochemical quality of organic amendments affects soil fungistasis. Appl. Soil Ecol. 2013, 72, 135–142. [Google Scholar] [CrossRef]
  6. Romine, M.; Baker, R. Soil fungistasis: Evidence for an inhibitory factor. Phytopathology 1973, 63, 756–759. [Google Scholar] [CrossRef]
  7. Alabouvette, C. Fusarium wilt suppressive soils: An example of disease-suppressive soils. Australas. Plant Pathol. 1999, 28, 57–64. [Google Scholar] [CrossRef]
  8. Ellis, R.J.; Timms-Wilson, T.M.; Bailey, M.J. Identification of conserved traits in fluorescent pseudomonads with antifungal activity. Environ. Microbiol. 2000, 2, 274–284. [Google Scholar] [CrossRef]
  9. Bonanomi, G.; Idbella, M.; Abd-ElGawad, A.M. Microbiota management for effective disease suppression: A systematic comparison between soil and mammals gut. Sustainability 2021, 13, 7608. [Google Scholar] [CrossRef]
  10. de Boer, W.; Verheggen, P.; Klein Gunnewiek, P.J.A.; Kowalchuk, G.A.; van Veen, J.A. Microbial community composition affects soil fungistasis. Appl. Environ. Microbiol. 2003, 69, 835–844. [Google Scholar] [CrossRef] [PubMed]
  11. Xu, L.; Baldocchi, D.D.; Tang, J. How soil moisture, rain pulses, and growth alter the response of ecosystem respiration to temperature. Glob. Biogeochem. Cycles 2004, 18, GB4002. [Google Scholar] [CrossRef]
  12. de Boer, W.; Li, X.G.; Meisner, A.; Garbeva, P. Pathogen suppression by microbial volatile organic compounds in soils. FEMS Microbiol. Ecol. 2019, 95, fiz105. [Google Scholar] [CrossRef] [PubMed]
  13. Liebman, J.A.; Epstein, L. Partial characterization of volatile fungistatic compound (s) from soil. Phytopathology 1994, 84, 442–446. [Google Scholar] [CrossRef]
  14. Janvier, C.; Villeneuve, F.; Alabouvette, C.; Edel-Hermann, V.; Mateille, T.; Steinberg, C. Soil health through soil disease suppression: Which strategy from descriptors to indicators? Soil Biol. Biochem. 2007, 39, 1–23. [Google Scholar] [CrossRef]
  15. Bonanomi, G.; Lorito, M.; Vinale, F.; Woo, S.L. Organic amendments, beneficial microbes, and soil microbiota: Toward a unified framework for disease suppression. Annu. Rev. Phytol. 2018, 56, 1–20. [Google Scholar] [CrossRef] [PubMed]
  16. Iacomino, G.; Idbella, M.; Laudonia, S.; Vinale, F.; Bonanomi, G. The suppressive effects of biochar on above-and belowground plant pathogens and pests: A review. Plants 2022, 11, 3144. [Google Scholar] [CrossRef] [PubMed]
  17. Bloem, J.; Hopkins, D.W.; Benedetti, A. Microbiological Methods for Assessing Soil Quality; CABI: Wallingford, UK, 2005. [Google Scholar]
  18. Sparks, D.; Page, A.; Helmke, P.; Loeppert, R. Methods of Soil Analysis. Part 3; Soil Science Society of America: Madison, WI, USA, 1996. [Google Scholar]
  19. Loeppert, R.H.; Suarez, D.L. Carbonate and gypsum. In Methods of Soil Analysis. Part 3; SSSA Book Ser. 5; Sparks, D.L., Ed.; SSSA: Madison, WI, USA, 1996; pp. 437–474. [Google Scholar]
  20. Ministero Politiche Agricole e Forestali (Italy). Metodi Ufficiali di Analisi Chimica del Suolo. Decreto Ministeriale del 13/09/1999; Gazzetta Ufficiale della Repubblica Italiana, n. 248, 21/10/1999 Supplemento Ordinario n. 185. Available online: http://www.gazzettaufficiale.it/eli/gu/1999/10/21/248/so/185/sg/pdf (accessed on 12 February 2018). (In Italian).
  21. Workneh, F.; Van Bruggen, A.H.C.; Drinkwater, L.E.; Shennan, C. Variables associated with corky root and Phytophthora root rot of tomatoes in organic and conventional farms. Phytopathology 1993, 83, 581–589. [Google Scholar] [CrossRef]
  22. Vance, E.D.; Brookes, P.C.; Jenkinson, D.S. An extraction method for measuring soil microbial biomass C. Soil Biol. Biochem. 1987, 19, 703–707. [Google Scholar] [CrossRef]
  23. Berni Canani, R.; De Filippis, F.; Nocerino, R.; Laiola, M.; Paparo, L.; Calignano, A.; De Caro, C.; Coretti, L.; Chiariotti, L.; Gilbert, J.A.; et al. Specific Signatures of the Gut Microbiota and Increased Levels of Butyrate in Children Treated With Fermented Cow’s Milk Containing Heat-Killed Lactobacillus Paracasei Cba L74. Appl. Environ. Microbiol. 2017, 83, e01206-17. [Google Scholar] [CrossRef] [PubMed]
  24. Adams, P.B.; Papavizas, G.C. Survival of root-infecting fungi in soil. X. Sensitivity of propagules of Thielaviopsis basicola to soil fungistasis in natural. Phytopathology 1969, 59, 135–138. [Google Scholar]
  25. Steiner, G.W.; Lockwood, J.L. Soil fungistasis: Mechanism in sterilized, reinoculated soil. Phytopathology 1970, 60, 89–91. [Google Scholar] [CrossRef]
  26. Berendsen, R.L.; Kalkhove, S.I.; Lugones, L.G.; Wösten, H.A.; Bakker, P.A. Germination of Lecanicillium fungicola in the mycosphere of Agaricus bisporus. Environ. Microbiol. Rep. 2012, 4, 227–233. [Google Scholar] [CrossRef]
  27. Bonanomi, G.; Gaglione, S.A.; Cesarano, G.; Sarker, T.C.; Pascale, M.; Scala, F.; Zoina, A. Frequent applications of organic matter to agricultural soil increase fungistasis. Pedosphere 2017, 27, 86–95. [Google Scholar] [CrossRef]
  28. Ayaz, M.; Li, C.H.; Ali, Q.; Zhao, W.; Chi, Y.K.; Shafiq, M.; Ali, F.; Yu, X.Y.; Yu, Q.; Zhao, J.T.; et al. Bacterial and fungal biocontrol agents for plant disease protection: Journey from lab to field, current status, challenges, and global perspectives. Molecules 2023, 28, 6735. [Google Scholar] [CrossRef]
  29. Gokul, A.; Mabaso, J.; Henema, N.; Otomo, L.; Bakare, O.O.; Klein, A.; Daniel, A.I.; Omolola, A.; Niekerk, L.A.; Nkomo, M.; et al. Sustainable agriculture through the enhancement of microbial biocontrol agents: Current challenges and new perspectives. Appl. Sci. 2023, 13, 6507. [Google Scholar] [CrossRef]
  30. Bharti, L.; Yadav, K.; Kumar Chaubey, A. Trichoderma spp.: Approach for bio-control agent. In Challenges in Plant Disease Detection and Recent Advancements; IntechOpen Limited: London, UK, 2024. [Google Scholar]
  31. Zandyavari, N.; Sulaiman, M.A.; Hassanzadeh, N. Molecular characterization and biocontrol potential of Trichoderma spp. against Fusarium oxysporum f. sp. dianthi in carnation. Egypt. J. Biol. Pest Control. 2024, 34, 1. [Google Scholar] [CrossRef]
  32. Sipilä, T.P.; Yrjälä, K.; Alakukku, L.; Palojärvi, A. Cross-site soil microbial communities under tillage regimes: Fungistasis and microbial biomarkers. Appl. Environ. Microbiol. 2012, 78, 8191–8201. [Google Scholar] [CrossRef] [PubMed]
  33. Yang, K.; Zhu, J.J. Impact of tree litter decomposition on soil biochemical properties obtained from a temperate secondary forest in Northeast China. J. Soils Sediments 2015, 15, 13–23. [Google Scholar] [CrossRef]
  34. Yoder, D.L.; Lockwood, J.L. Fungal spore germination on natural and sterile soil. Microbiology 1973, 74, 107–117. [Google Scholar] [CrossRef]
  35. Kamaruzzaman, M.; Lyu, A.; Zhang, J.; Wu, M.; Yang, L.; Chen, W.; Li, G. Competitive saprophytic ability of the hypovirulent isolate QT5-19 of Botrytis cinerea and its importance in biocontrol of necrotrophic fungal pathogens. Biol. Control. 2020, 142, 104182. [Google Scholar] [CrossRef]
  36. Majou, D. Effects of carbon dioxide on germination of Clostridium botulinum spores. Int. J. Food Microbiol. 2024, 427, 110958. [Google Scholar] [CrossRef] [PubMed]
  37. Lijiahong, G.; Yalun, F.; Xiaohua, P.; Zhengkun, Y.; Mengke, Z.; Zhiyu, S.; Ning, G.; Shuangchen, C.; Junliang, C.; Bing, B.; et al. Biocontrol potential of Trichoderma harzianum against Botrytis cinerea in tomato plants. Biol. Control 2022, 174, 105019. [Google Scholar]
  38. Weinmann, M.; Bradáčová, K.; Nikolic, M. Relationship between mineral nutrition, plant diseases, and pests. In Marschner’s Mineral Nutrition of Higher Plants, 4th ed.; Marschner, P., Ed.; Elsevier: Amsterdam, The Netherlands; Academic Press: Amsterdam, The Netherlands, 2023; Chapter 10; pp. 445–476. [Google Scholar]
Figure 1. Images of the selected ecosystems across a climatic and land use intensity gradient in terms of organic amendment input, synthetic fertilizers, and pesticide application in the Campania Region (Southern Italy). All pictures by Giuliano Bonanomi.
Soilsystems 08 00131 g001
Figure 2. Box plots illustrating the variation in species richness (A) and the Shannon diversity index (B) for bacterial communities across the ecosystem soils. The boxes represent the interquartile range (IQR), with the lower and upper bounds indicating the 25th and 75th percentiles, respectively. The horizontal line within each box marks the median, while the whiskers extend to the range of data within 1.5 times the IQR. Different letters indicate significant differences (p < 0.05). (C) Non-metric multidimensional scaling (NMDS) plots depict bacterial community composition in the different soils. The MDS axis1 and MDS axis2 correspond to the two axes of the two-dimensional ordination space, with each point representing a replicate sample. The stress level, shown on each plot, indicates how well the distances between objects are preserved (values closer to 0 indicate a better representation of the data in the ordination space). The p- and F-values represent the results of the PERMANOVA test conducted with 999 permutations on the bacterial data. (D) Bar charts display the relative abundance of bacterial phyla in the different soils.
Soilsystems 08 00131 g002
Figure 3. Heatmap showing the relative abundance of the 100 most frequent Amplicon Sequence Variants in the bacterial community in the soil of each ecosystem. The grouping of variables is based on Whittaker’s association index.
Soilsystems 08 00131 g003
Figure 4. Fungal growth of B. cinerea conidia (expressed as a percentage compared to the control (0%)) on soil watery extracts from the selected ecosystems during a 168 h incubation period that followed a single application of glucose at four application rates (0.10%, 0.30%, 1%, and 3%). Values are averages ± standard deviation.
Soilsystems 08 00131 g004
Figure 5. Fungal growth of T. harzianum conidia (expressed as a percentage compared to the control (0%)) on soil watery extracts from the selected ecosystems during a 168 h incubation period that followed a single application of glucose at four application rates (0.10%, 0.30%, 1%, and 3%). Values are averages ± standard deviation.
Soilsystems 08 00131 g005
Figure 6. Principal component analysis (PCA) based on soil physico-chemical characteristics (A) and SIMPER resulting taxa (B) as variables. Microbial biomass, fungal growth, and bacterial diversity and composition were fitted as factors with significance <0.05 onto the ordination.
Soilsystems 08 00131 g006
Table 1. Land use type, geographical coordinate, elevation, climate (mean annual temperature and rainfall), organic input, pesticide and fertilizer application, tillage regime, and cultivation type in agroecosystems and vegetation cover in natural ecosystems.
EcosystemCoordinatesAltitude (m)Mean Annual Temperature (°C)Mean Annual Rainfall (mm)Pesticides ApplicationOrganic Inputs and Fertilizers ApplicationTillage RegimeCover Vegetation
Greenhouse 40°26′53.59″ N
14°59′20.44″ E
819.6-8 to 16 times application
per year of copper,
synthetic fungicides and insecticides. Soil
fumigation with Metham
sodium
Crop residues (1–2 t ha−1 year−1), pelletized manure 0.5 t ha−1 year−1
180–250 kg
ha−1 year−1
of NPK
Soil
milling 4–8
times a
year
Lettuce (Lactuca sativa), rocket
(Eruca sativa)
Open-field horticulture40°26′49.45″ N
14°59′50.70″ E
10 10508 to 16 times application
per year of copper,
synthetic fungicide and insecticides. Soil
fumigation with Metham
sodium
Crop residues (1–2 t ha−1 year−1), pelletized manure 0.5 t ha−1 year−1
180–250 kg
ha−1 year−1
of NPK
Soil
milling 6–8
times a
year
Lettuce (Lactuca sativa), tomato (Solanum lycopersicon), zucchini (Cucurbita pepo), cabbage (Brassica oleracea)
Grassland40°19′37.81″ N
15°07′22.52″ E
17014.91328-Mowed grasses (2–3 t ha−1 year−1). No mineral fertilizersMowed twice a yearPerennial bunchgrass
dominated by Ampelodes
mauritanics
Shrubland40°01′33.37″ N
15°16′11.37″ E
10517.6789- Natural, mixed litterfall (1 t ha−1 year−1). No mineral fertilizers-Woody shrubs: Euphorbia dendroides, Juniperus phoenicea, Myrtus
communis, Pistacia lentiscus,
Rosmarinus
officinalis,
Olive orchard40°19′42.67″ N
15° 7′25.51″ E
19814.81328Two applications
per year of copper
Mowed mixed grasses (1–2 t ha−1 year−1).
40–60 kg
ha−1 year−1 of NPK
Mowed twice a year, Olea europea
Pinus forest40°25′12.25″ N
14°59′15.43″ E
1717.6987-Natural, mixed litterfall (2.5 t ha−1 year−1). No mineral fertilizers-Pinus pinea
Quercus forest40°24′24.40″ N
15°05′59.16″E
28514.3929-Natural, mixed litterfall (2 t ha−1 year−1). No mineral fertilizers-Dominated by Quercus ilex and Quercus pubescens
Fagus forest40°24′25.19″ N
15°09′24.20″ E
121010.61480-Natural, mixed litterfall (3 t ha−1 year−1). No mineral fertilizers-Dominated by Fagus sylvatica
Table 2. Soil chemical and biochemical traits of different ecosystems. Values are the average of five replicates; different letters within each row indicate significant differences (Duncan test, p < 0.05).
ParameterGreenhouseOpen-Field HorticultureGrasslandShrublandOlive OrchardPinus ForestQuercus ForestFagus Forest
Sand (g/kg)959 a516 c840 a602 b670 b942 a930 a860 a
Loam (g/kg)17 e309 a158 c237 b163 d35 e66 e117 d
Clay (g/kg)24 b175 a2 b161 a167 a23 b4 b23 b
pH7.06 b7.82 a5.79 c7.16 b6.968.01 a7.19 b7.32 b
Electrical conductivity (dS/m)0.213 b0.263 a0.103 d0.131 d0.124 d0.126 d0.274 a0.161 c
Limestone (g/kg)6.79 d47.7 c5.91 d5.78 d4.07 d224 a31.8 c91.9 b
Organic carbon (g/kg)14.4 d13.3 d64.5 ab26.3 c13.7 d30 c41.6 b76.1 a
Total nitrogen (g/kg)1.68 d1.96 d9.56 a3.07 c2.01 d1.64 d4.85 b5.92 ab
C/N ratio8.6 c6.8 d6.7 d8.6 c6.9 d18.3 a8.6 c12.9 b
Phosphoric anhydride (mg/kg)107.1 b272.2 a15.3 d30.8 d19.3 d28.3 d76.4 c61.8 c
Cation exchange capacity (meq/100 g)14.4 c20.1 c40.3 a37.7 ab16.8 c25.1 b36.1 ab51.0 a
Calcium (meq/100 g)10.1 d13.5 d28.2 ab32.1 a14.2 d18.6 c26.2 b38.5 a
Magnesium (meq/100 g)1.83 d3.23 c1.71 d3.12 c1.46 d5.11 b5.05 b9.51 a
Sodium (meq/100 g)0.14 c0.09 d0.13 c0.34 b0.03 d0.06 d0.67 a0.24 b
Potassium (meq/100 g)1.37 b1.93 a0.62 c2.05 a0.63 c0.13 d2.73 a0.96 c
Iron (mg/kg)13.2 b4.87 c59.7 a6.98 c7.57 c7.62 c15.8 b17.9 b
Copper (mg/kg)12.8 a11.1 a1.01 c1.08 c1.11 c0.29 c4.44 b0.94 c
Zinc (mg/kg)10.9 b2.98 c1.91 c1.22 c1.01 c1.94 c19.3 a8.16 b
Manganese (mg/kg)4.11 c15.7 a4.44 c9.39 b14.4 a15.7 a7.43 b16.3 a
Fluorescein diacetate0.41 bc0.21 d0.58 ab0.77 a0.53 b0.39 c0.68 a0.13 d
Microbial biomass (mg C 100 g−1)6.36 e12.11 d58.7 b47.6 bc7.38 d12.71 d33.26 c146.95 a
Disclaimer/Publisher’s Note: The statements, opinions and data contained in all publications are solely those of the individual author(s) and contributor(s) and not of MDPI and/or the editor(s). MDPI and/or the editor(s) disclaim responsibility for any injury to people or property resulting from any ideas, methods, instructions or products referred to in the content.

