Article

Influence of Annual Ryegrass (Lolium multiflorum) as Cover Crop on Soil Water Dynamics in Fragipan Soils of Southern Illinois, USA

by
Amitava Chatterjee
*,
Dana L. Dinnes
,
Daniel C. Olk
and
Peter L. O’Brien
USDA-ARS, National Laboratory for Agriculture and the Environment, Ames, IA 50011, USA
*
Author to whom correspondence should be addressed.
Soil Syst. 2024, 8(4), 126; https://doi.org/10.3390/soilsystems8040126
Submission received: 12 October 2024 / Revised: 18 November 2024 / Accepted: 29 November 2024 / Published: 3 December 2024
(This article belongs to the Special Issue Land Use and Management on Soil Properties and Processes)

Abstract

Fragipans are dense subsurface soil layers that severely restrict root penetration and water movement. The presence of shallow fragipan horizons limits row crop production. We hypothesized that the roots of cover crop might improve soil physiochemical properties and biological activity, facilitating drainage and increasing effective soil depth for greater long-term soil water storage. To evaluate annual ryegrass as one component of a cover crop (CC) mix for promoting the characteristics and distribution of soil water, on-farm studies were conducted at Marion and Springerton in southern Illinois, USA. Soil samples were collected at 15 cm increments to 60 cm (Marion) and 90 cm (Springerton) depths during the fall of 2022. Both sites had low total soil carbon and nitrogen contents and acidic soil pH (≤6.4). A soil water retention curve was fitted using the van Genuchten equation. At Springerton, the CC treatment increased saturated (thetaS) and residual (thetaR) soil water contents above those of the no cover crop (NCC) at the 60–75 cm and 75–90 cm depths. Changes in volumetric soil water content were measured using a multi-depth soil water sensor for the Springerton site during late July to early August of the soybean growing phase of 2022; NCC had higher soil water than CC within the 0–15 cm depth, but CC had higher soil water than NCC at the 30–45 cm depth. These findings indicate that cover crop mix has the potential to improve soil water movement for soils with restrictive subsoil horizon, possibly through reducing the soil hydraulic gradient between the surface and restrictive subsurface soil layers.

1. Introduction

Soils with fragipan as subsurface horizons that restrict root penetration cover a significant area of agricultural land in the United States [1,2]. Fragipan horizons are natural impermeable layers, which constrain water movement through the soil profile [3,4]. Over 11 million hectares that contain soils with fragipan occur in Pennsylvania, Mississippi, New York, Missouri, and Kentucky and are sparsely found in Arkansas, Illinois, Ohio, Indiana, and Tennessee [2]. Fragipans are formed in loess, glacial till, weathered clastic rock, and weathered limestone; they are commonly classified as ‘Fragiudalfs or Fragiaqualfs’, appearing as ‘Btx’ with diagnostic horizon ‘x’ [5]. Due to their high bulk density, fragipan soils frequently have a perched water table and exhibit redoximorphic features [6,7]. Fragipans appearing close to the surface such as within 50 cm normally have a high perched water table in winter and early spring, leading to excess soil water and shallow rooting. In the summer, because of a limited rooting depth, crops are prone to drought conditions under high evapotranspiration (ET) demands. Therefore, crop productivity on fragipans soils suffers due to extreme hydrologic conditions.
Fragipans influence the near-surface hydrologic process due to the combination of low drainable porosity and relatively high lateral saturated conductivity [6]. Fragipans have a bulk density as high as 1.6 Mg m−3 because of the dense packing of individual grains (silt and sand) and inter-grain bridging by clay, silica, and iron granules depending on the genesis [5,8]. At peak ET demand in mid-late summer, a hydraulic gradient is developed between the soil surface and the fragipan horizon [9]. The hydraulic gradient is wide where the fragipan is near to the soil surface.
Crop yields can be significantly reduced when the fragipan is close to the surface or within the rooting depth, typically less than 50 cm [6,10]. Root development and crop yield can be greatly reduced under soils with fragipans because of restricted air and water movement, high bulk densities, and soil strength and high acidity [11]. Roots within the fragipan layer are limited to planar voids between the peds [6]. In West Tennessee, total root lengths and yields of corn (Zea mays L.) and soybean (Glycine max L. Merr.) were significantly reduced in fragipan soils, particularly in a year with below-normal rainfall throughout the growing season [1]. Previously, researchers observed that a decrease in fragipan depth from 60 to 50 cm caused the greatest reduction in grain yield and concluded that to maintain the productivity of fragipan soils, a management system should be designed to preserve a minimum soil thickness above the fragipan of ~60 cm [9]. Management to improve productivity in fragipan soils should target improvements in bulk density, aggregation, infiltration, and organic carbon in the topsoil and changes in subsoil properties such as water storage, total porosity, and rooting depth [12].
The amelioration of the subsoil using deep rooting perennials in the rotation or fall-planted cover crops could be a preferable method over cost-intensive, short-term practices like deep trenching [13] or deep tillage [14]. Instead, ‘bio-drilling’ through the creation of bio-pores by deeply penetrating tap roots and the subsequent use of these root channels as low-resistance pathways for the roots of succeeding crops are promising options to reduce the perched water table and improve water movement through fragipan soils. It was reported that increasing cover crop root counts reduced penetration resistance [15]. Other researchers found that the presence of ryegrass in fields lowered bulk densities in the ‘Btx1’ and ‘Btx2’ horizons by 8% and 6%, respectively, compared to a control, attributing these trends to the solubilization of cementing agents by ryegrass root exudates [3].
In this study, we determined the potential of cover crop mix containing annual ryegrass to improve soil properties and soil water retention in two on-farm experiments with corn-soybean production in Southern Illinois. We also compared changes in volumetric soil water content following the annual ryegrass cropping on fragipan soils. We hypothesized that the inclusion of annual ryegrass as one of the winter cover crops would improve the soil physical environment through increasing porosity and facilitating water movement through restrictive fragic layers of the profile during the growing season.

2. Materials and Methods

All measurements were conducted in existing on-farm experiments near Marion (37.70, −88.94) and Springerton (38.17, −88.42), in southeast Illinois (Figure 1a). The climate in southeast Illinois is humid subtropical. During the 2022 growing season, annual precipitation was 116 cm (above 3 cm than 30-year average); February was the wettest month (16.5 cm), followed by July (16.1 cm) [16] (Figure 1c). The highest average monthly air temperature was observed in July (31.8 °C); it was close to normal (31.4 °C).
The Marion site soil is classified as a fine-silty, mixed active, mesic Fragic Oxyaquic Hapludalf in the Rend soil series, and the Springerton soil is classified as a fine, smectitic, mesic Aeric Fragic Epiaqualf in the Bluford soil series (Figure 1b) [17]. Based on the Official Soil Description of soil horizons, Marion has a fragipan horizon (Btx) at 60 cm (~100 cm thickness) and Springerton has a fragipan horizon (Btgx) at 90 cm (~10 cm thickness). Both fields have been managed as no-till since 2010 and under a maize (Zea mays L.) and soybean (Glycine max L. Merr.) rotation. Both growers used a similar cover crop mix containing annual ryegrass (Lolium multiflorum) with a seeding rate of 6.7 kg ha−1, and Hairy Vetch (Vicia villosa) and Crimson Clover (Trifolium incarnatum) at the rate of 4.5 kg ha−1. At the Marion site, field-long strips of dimension ~275 m by 3 m with (CC) and without (NCC) cover crop mix were laid out in a randomized complete block design with three replications. At the Springerton site, there were four replications of field-long strips of ~300–400 m length and 24 m width with two treatments, CC and NCC, similar to Marion. Plots with and without annual ryegrass were initially established in 2019 at Marion and in 2013 at Springerton. Crop phases were synchronized at both sites; all plots were under corn during 2015, 2017, 2019, 2021, and 2023, and under soybean during 2014, 2016, 2018, 2020, and 2022.
From each site, soil core samples were collected from each plot using a hydraulic probe in line with a plastic sleeve of diameter ~5 cm during 18–19 October 2022. A total of fourteen cores were collected, six from Marion (three replications and two treatments, CC and NCC) and eight cores from Springerton sites (four replications and two treatments, CC and NCC). After transporting cores to the laboratory, soil core samples were separated into 15-cm increments to the 60 cm depth for Marion and to the 90 cm depth for Springerton. The differences in depths of separation were due to soil types having different depths to the fragipan horizon (Figure 1b). Soil samples were dried in an oven at 105 °C for at least 48 h to determine gravimetric water content and bulk density (BD). Soil samples were ground and processed to pass through a 2 mm sieve for the subsequent physical and chemical analyses following standard protocols. Briefly, soil pH was measured using a 1:1 soil:water slurry; total soil carbon was measured using an automated combustion analyzer (FlashSmart elemental analyzer, Thermo Fisher Scientific, Waltham, MA, USA) as outlined by Nelson and Sommers (1996), and Mehlich-3 extractable nutrients were determined using inductively coupled plasma spectroscopy (Avio 500 ICP-OES, Perkin-Elmer, Shelton, CT, USA) [18].
Due to time and labor constraints, particle size distribution was measured on only one set of representative soil samples (from replication one) each for the CC and NCC treatments from either site. Particle size distribution was determined from a well-dispersed slurry of soil in a sodium hexametaphosphate solution. The sand was removed and collected by wet sieving using a 53 µm mesh sieve. Silt and clay were determined with a particle size analyzer (Cilas Particle Size Analyzer (PSA) model 1190) (CPS US Inc. Madison, WI, USA) using 6 µm as the silt-clay cutoff [19].
To measure soil water retention characteristics, 2-mm sieved soil samples were wetted to saturation overnight on ceramic plates. Gravimetric water contents were determined at −330, −1000, −2000, −3000, −4000, and −15,000 cm H2O suction using a pressure plate apparatus [20], and gravimetric water contents were determined. These values of gravimetric water contents were converted to volumetric water content using the bulk density values of the respective samples. Soil water retention curves were fitted to the soil matric potential (h cm H2O) and corresponding volumetric soil water (θ) content data using the van Genuchten equation [21]:
θ = θ s θ r + 1 + α h n + θ r
where thetaS (θs cm3 cm−3) is the saturated volumetric water content; thetaR (θr cm3 cm−3) is the residual volumetric water content; h (cm H2O) is the tension head; and alpha (α, 1/cm H2O), n (-), and m (-) are the shape parameters. The soilphysics package [22] in R version 4.3.3 [23] was used for the curve fitting. Plant available water is calculated by the difference between thetaS and thetaR and multiplying by the depth increment (15 cm). Soil water storage was calculated by summing the plant available water for the 0–60 cm and 0–90 cm depth increments for Marion and Springerton, respectively.
At the Springerton site, soil volumetric water content (n = 4) was also measured by 15 cm depth increments up to 60 cm depth, from 4 July 2022 (DOY: 201) to 27 September (DOY:262), 2022, using a multi-depth soil water sensor based on .ime Domain Transmissometry (TDT) (GROPOINT Profile, RIOT Technology Corp., North Saanich, BC, Canada). Sensors were attached to a CR-1000 datalogger (Campbell Scientific, Logan, UT, USA). Soil water storage of the 0–60 cm depth was calculated by multiplying volumetric water content with soil depth increment and summing the water storage for the 60 cm depth. We could not measure the soil water at the Marion site due to the failure of soil water sensors.
For the soil water sensor data from the Springerton, the number of days for the soil water drydown at the 0–15 cm depth was calculated using the following equation:
SWC = A e−t/τ + θres
where SWC = the volumetric water content (m3 m−3), A = the initial soil water content m3 m−3, t = days since a rainfall event, τ = the constant that modulates the rate at which the soil dries, and θres = residual soil water content (m3 m−3). Soil water drydown events are identified in the soil water time series as periods in which the temporal change in soil water was negative for greater than or equal to five days [24]. For each drydown period, the equation was fitted to soil water using non-linear least square fitting. We compared the differences in the rate of drydown between CC and NCC.
Statistical analysis and model fitting were carried out using R version 4.3.3 [23]. A linear mixed model was fitted and summarized using the lme function of nlme and emmeans packages [25]. Changes in soil water for different depths were analyzed using day of the year, treatment, and their interaction as a fixed factor with autoregressive component (corAR1), and a pairwise comparison of means was carried out using the ‘Tukey’ method at the 90% significance level. Pearson correlation coefficient (r) values were calculated to determine the relationship between plant available water and soil properties for each depth increment, separately for both sites (p = 0.10).

3. Results and Discussion

3.1. Particle Size Distribution

The Marion site had a silt loam texture within the 0–60 cm depth (Table 1). The Springerton site also had a silt loam texture, except 30–60 cm depths under NCC treatment had silty clay loam and 15–30 cm under CC treatment also had silty clay loam. The dominant soil series found in Marion and Springerton are Rend and Bluford, respectively; they occur together in map units and are considered in close association [17]. Both sites showed an increase in clay content, with soil depth indicating illuviation of clay like other fragipan soils [26,27]. The major difference between the two sites is that Springerton had more sand and less silt content compared to the Marion site. The fragipan layer had the highest packing density (0.74), in which the coarse sand (2–0.2 mm) was more densely packed than all other horizons [8].

3.2. Bulk Density

At Marion, the highest soil BD value (1.27 Mg m−3) was observed at the 15–30 cm depth for both CC and NCC, but both treatments had similar BD throughout the soil profile (Table 2). At Springerton, soils under CC had higher BD than NCC for the 15–30 cm, 30–45 cm, 45–60 cm, and 60–75 cm depth increments. For the NCC treatment, BD increased gradually from the surface to lower depths, with the highest value of 1.36 Mg m−3 at the 75–90 cm depth. However, for the CC, this same trend was interrupted by an abrupt increase in the BD value from 1.17 Mg m−3 within 0–15 cm to 1.36 Mg m−3 within the 15–30 cm depth. High soil BD could be expected within the compacted fragipan horizon [28]. One possible explanation for this sudden increase at a shallow depth for CC is that plant roots modify soil water content, pore size distribution, and bulk density [29]. The compaction of soils around the roots for soils with low microporosity and/or isolated pores was reported by researchers [29,30]. Previous studies that observed roots in the fragipan are limited to planar voids between the peds [6]. For this study, we separated soil cores into conventional depth increments of 15 cm, but this will likely fail to fully separate fragipan and non-fragipan horizons, particularly for sampling depths below 15 cm.

3.3. Soil pH and Nutrients

The Springerton soil had a pH range of 4.02–5.09, and the Marion soil had a pH range of 5.22–6.40. At Marion, soil pH increased from 0–15 cm to the 15–30 cm soil depth and decreased at lower depths. The soil pH of the Springerton site continuously decreased with soil depth. Soil pH did not vary between CC and NCC at both sites for all depths (Table 2). Previous studies concluded that fragipan soils are generally acidic in nature due to a high perched water table and the presence of soluble iron, aluminum, and manganese ions [26,31]. Researchers also reported pH values of 4.8–4.9 for the Btx horizon, with base saturation ranging from 45 to 64% [7].
Soil C and N reduced drastically with increasing soil depth and were low at all depths. Both sites have similar total soil C and N distributions throughout the profile, without any difference between CC and NCC. Similarly, in other studies of fragipan soils, soil C and N content were extremely low compared to surrounding non-fragipan soils [1,2,8].
In general, concentrations of Mehlich-3 extractable nutrients were similar for NCC and CC at both sites. As one exception at Marion, the NCC soil within the 30–45 cm depth had more Mehlich 3-P than the CC did; we speculate this might indicate P uptake by ryegrass roots. Fragic properties like brittleness and slaking due to the solubility of particle-bridging agents might be attributable to the presence of free- or combined-oxide forms of Fe, Al, and Si [5,31]. Concentrations of Mehlich-3 extractable iron and aluminum were higher for Springerton than Marion soil, particularly at the 30–60 cm depth. At Springerton, the CC treatment within the 45–60 cm depth had higher Mehlich-3 extractable aluminum levels than NCC treatment.

3.4. Soil Water Retention Parameters

Within the 0–15 cm depth, the Marion soil had numerically higher thetaS contents than the Springerton soil (Table 3), which follows the soil C content differences between the two sites (Table 2). At Marion, both treatments had similar thetaS and thetaR values throughout the soil depth increments. At Springerton, CC had a higher thetaS content compared to NCC at the 60–75 cm and 75–90 cm depth increments, and the CC treatment also had a higher thetaR content than NCC at the 45–60 cm, 60–75 cm, and 75–90 cm depth increments. The greater responses of thetaS and thetaR values to cover cropping at Springerton than at Marion might be due to the greater duration of cover cropping or shallower fragipan at Springerton. Cover cropping increased soil water content at field capacity (−100 cm H2O), indicating less drainage of water from the field [32]. In this study, increases in thetaS and thetaR values under CC might result from the penetration of annual ryegrass root systems into the fragipan layer, inducing changes in pore dynamics. After root decay, bio-macropores and root-induced micropores are formed, facilitating water transport through the soil [33].
In the van Genuchten equation, ‘n’ is the slope of the water retention curve, and a low n value indicates a broader pore size distribution [34]. Marion soil had higher ‘n’ values than Springerton soil for all depth increments. The NCC soil had higher a ‘n’ value than CC at the 45–60 cm depth at Marion and at the 30–45 cm depth at Springerton (Table 3), suggesting a broader pore size distribution for CC than NCC at these depths. The water content of soils with smaller n value (a broader distribution of pore sizes) varies more gradually as the matric suction varies.
Plant available water was similar in between CC and NCC for all depths at both sites, except only within the 45–60 cm depth at Marion, where CC had higher plant available water than NCC (Table 3). Although CC had higher soil water storage value than NCC at both sites, the differences were not statistically significant. This might indicate that the duration of the cover cropping was not enough to make a statistical difference.

3.5. Relationships Between Plant Available Water and Soil Properties

Pearson’s correlation coefficient between plant available water and soil properties is presented in Table 4. For the Marion soil, plant available water content within 45–60 cm had a significant positive relationship with silt content (p = 0.05) and a negative association with clay content (p = 0.05). For the Springerton site, plant available water showed a positive association with pH and a negative association with Mehlich 3-Fe within 0–15 cm, a positive association with pH and BD within the 15–30 cm depth, a negative association with Mehlich 3-P within the 30–45 cm depth, and a negative association with Mehlich 3-Fe within the 75–90 cm depth. Plant available water had a different pattern of associations between Marion and Springerton. At Marion, plant available water content was linked to soil particle size distribution limited to only the restrictive soil layer of 45–60 cm, whereas plant available water content was more linked to soil chemical characteristics throughout the profile. The differences in relationships between the Marion and Springerton soils may be at least partially driven by the dominant smectitic 2:1 clay mineral content in Springerton.

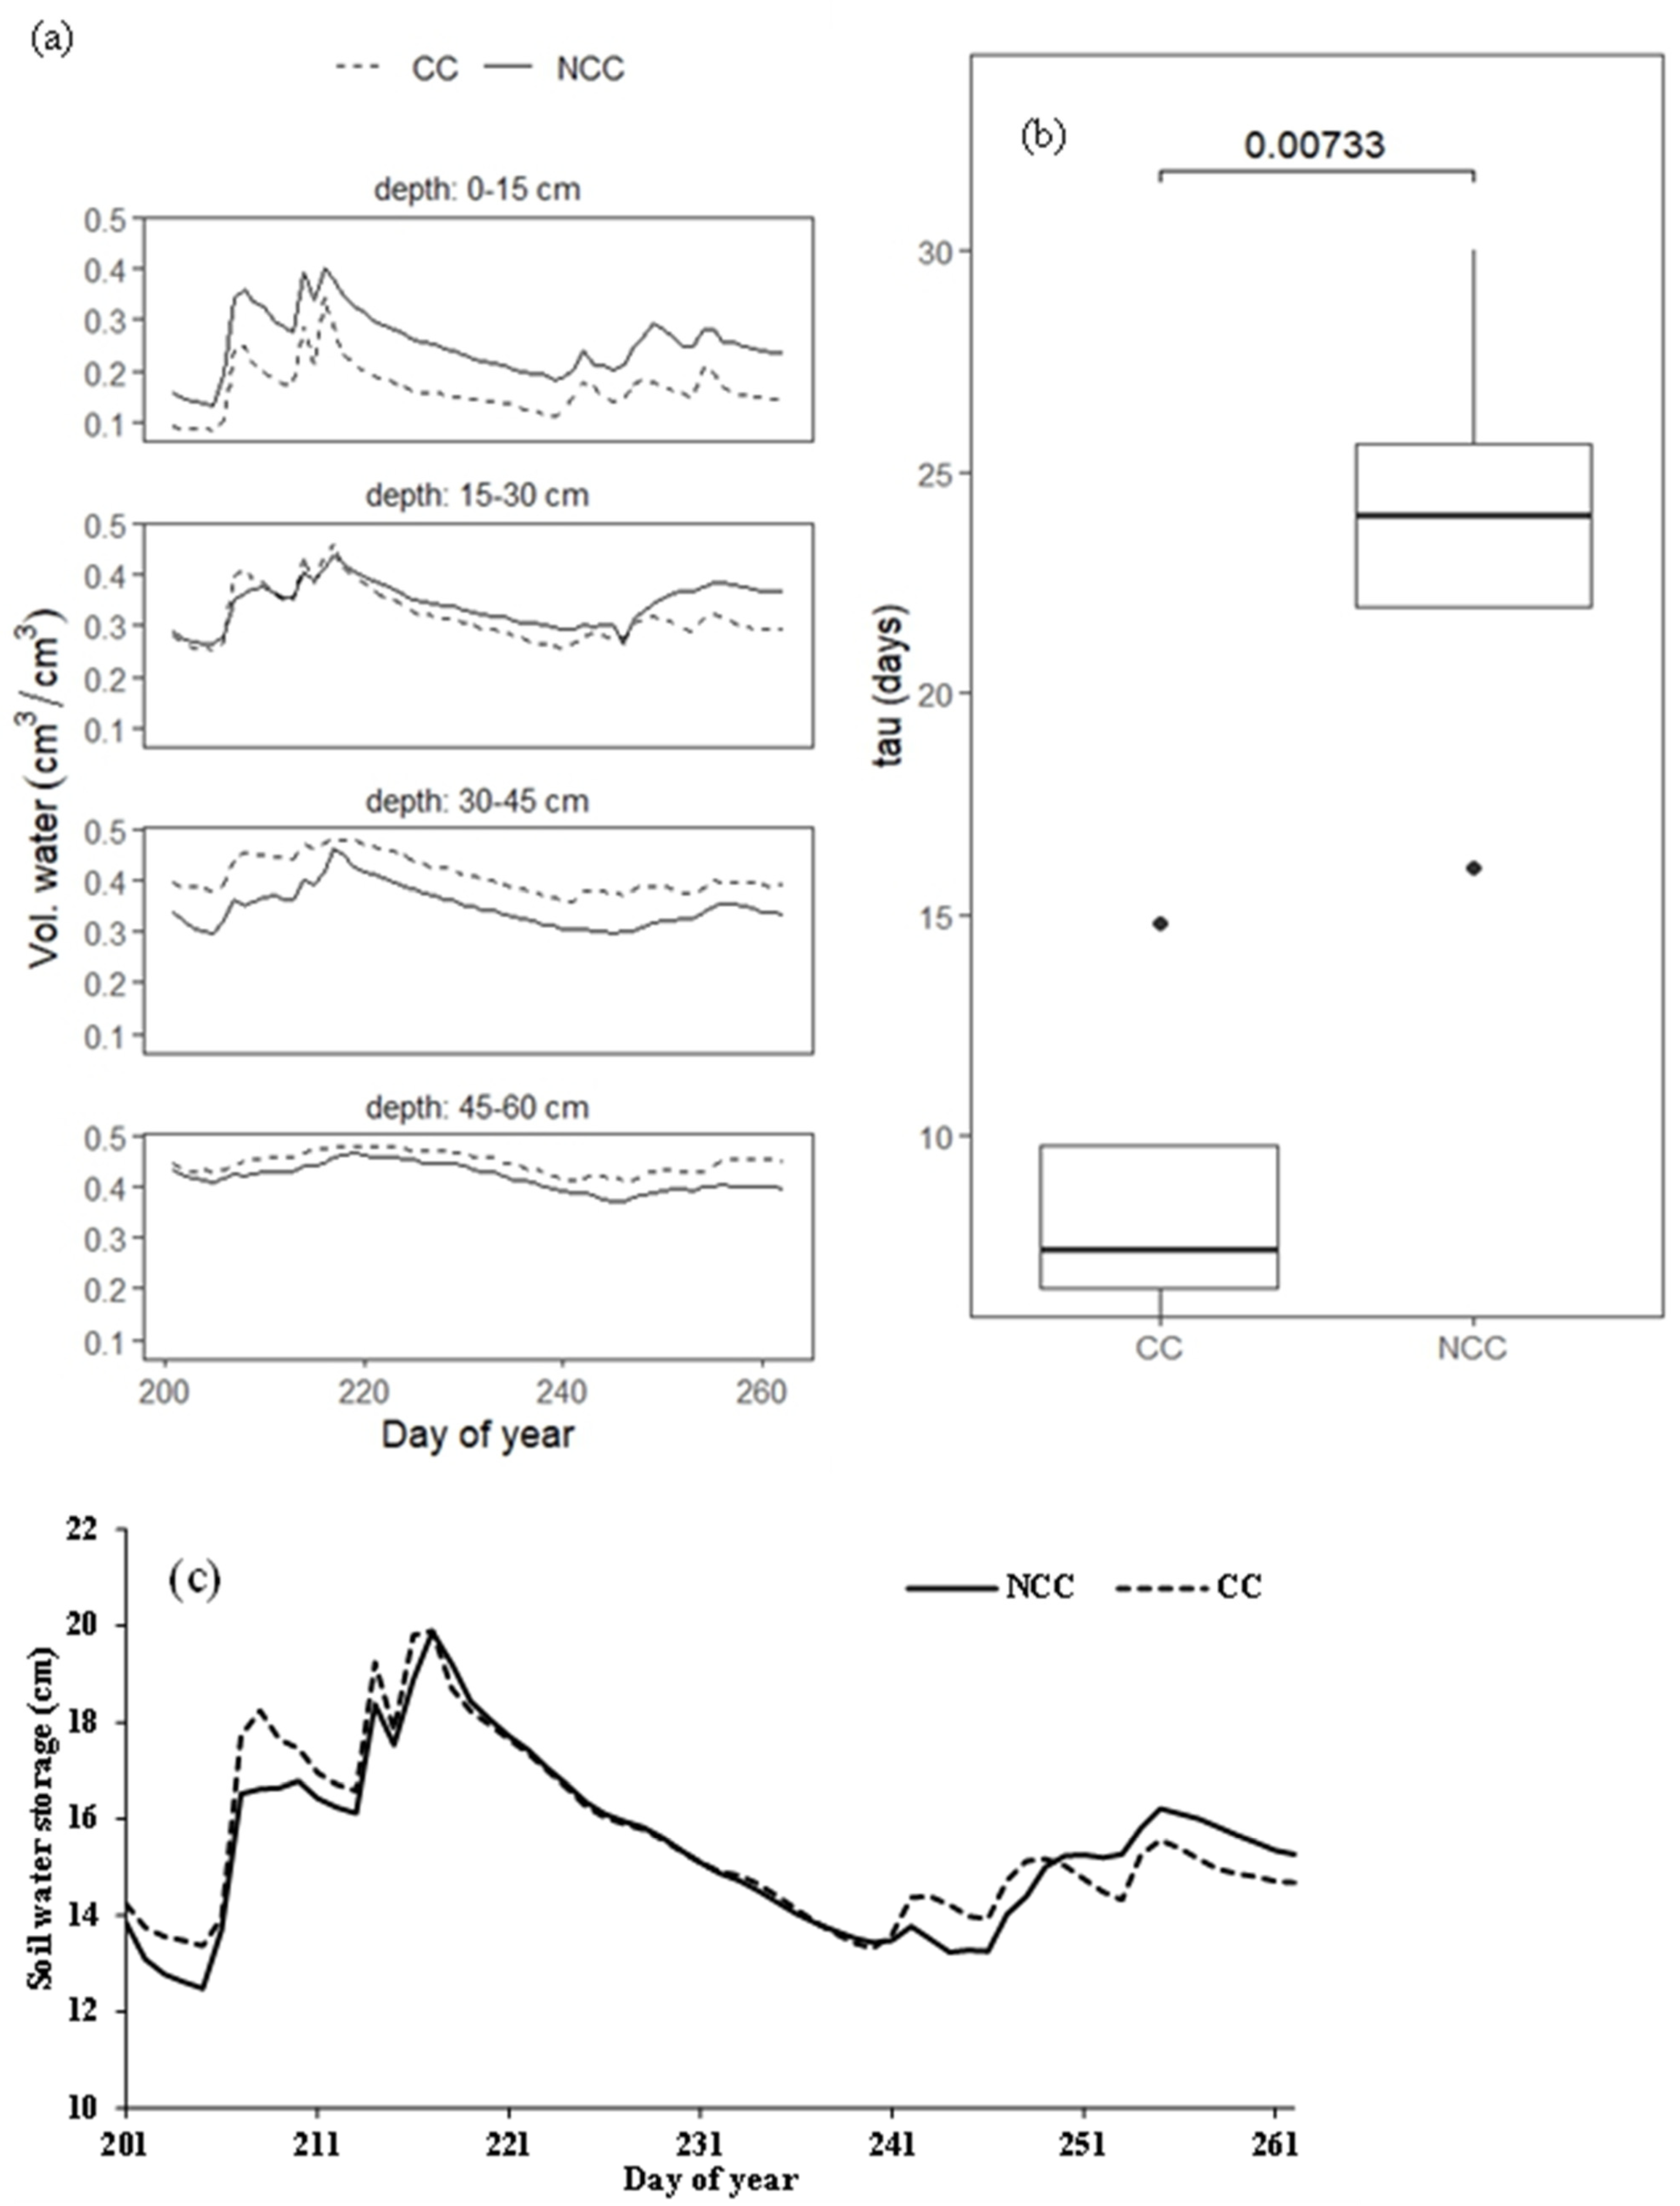
3.6. Changes in Soil Water at Springerton During Soybean Growth Phase (2022)

At Springerton, changes in soil profile water content (0–60 cm) were significantly influenced by cover crop (<0.01) and day of the year (<0.01). As shown in Figure 2a, in the 0–15 cm depth the NCC treatment had higher (p < 0.10) soil water content (daily average 0.30 cm3 cm−3) than CC (average 0.20 cm3 cm−3) during 25 July (DOY 206)–18 August (DOY 230), except on 4 August (DOY 216). Within the 15–30 cm soil depth, both treatments (CC: 0.32 cm3 cm−3, and NCC: 0.34 cm3 cm−3) had similar mean daily soil water contents. Within the 30–45 cm depth, CC had higher (p < 0.10) soil water content (0.43 cm3 cm−3) than NCC (0.34 cm3 cm−3) during 22 July (DOY 203)–1 August (DOY 213), except on 25 July (DOY 206). Within the 45–60 cm depth, CC had higher mean daily soil water content (0.45 cm3 cm−3) than NCC (0.34 cm3 cm−3) during 14 September–19 September (DOY 257–262). As shown in Figure 2b, CC treatment had a shorter drydown time (9 days) compared to the NCC treatment (24 days) following a rainfall event. These findings support the hypothesis that the penetration of annual ryegrass into the fragipan might facilitate the downward movement of water during the early growing season. Soil water storage (0–60 cm) during the peak growing season and high ET demand period (DOY: 201–262) was not significantly different between CC and NCC (Figure 2c).
The extent to which water permeates a soil profile is a critical measure of potential productivity as it partially determines soil’s capability to sustain plant growth [35]. The seasonal perched water table under fragipan soils rises relatively rapidly in response to snowmelt and precipitation and falls rapidly during the growing season due to evapotranspiration [6]. For a fragipan soil from northeastern Pennsylvania, 63% of the total input water moved laterally through soil horizons above the fragipan, 10% moved through interconnected prism faces within a 50-cm-thick fragipan horizon, and 27% moved vertically through a 50-cm-thick fragipan horizon [36]. Our results showed that the introduction of annual ryegrass encourages the vertical water movement through the subsurface layers, as indicated by lower water content at the surface and higher water within subsurface layer. Finally, annual ryegrass did not change soil water storage between CC and NCC, and annual ryegrass did not limit soybean water use.

4. Conclusions

Soil properties and water dynamics are markedly different between restrictive soil layers with fragic properties found approximately at the 60 cm depth in Marion and at the 90 cm depth in Springerton, from the above layers. Due to the perch water table and limited root penetration, studied soils had poor physical and chemical environments, nutrient availability, and soil water dynamics. Soils with a restrictive layer and perched water table are vulnerable to loss of productivity over time. This study showed that the introduction of annual ryegrass as winter cover crop might improve the water distribution throughout the profile probably during the peak crop ET demand period of mid- to late-summer. For shallow fragipan soils, the use of an annual ryegrass cover crop to create a deeper soil profile reservoir that a main crop can root into to extract water and nutrients offers a relatively low-cost management tool that could improve farm economics.

Author Contributions

Conceptualization, D.L.D. and D.C.O.; methodology, A.C. and D.L.D.; formal analysis, A.C.; investigation, A.C., D.L.D. and D.C.O.; resources, P.L.O. and D.C.O.; data curation, D.L.D.; writing—original draft preparation, A.C.; writing—review and editing, P.L.O., D.L.D. and D.C.O.; visualization, A.C.; supervision, D.C.O.; and project administration, D.C.O. and A.C. All authors have read and agreed to the published version of the manuscript.

Funding

This research received no external funding.

Institutional Review Board Statement

Not applicable.

Informed Consent Statement

Not applicable.

Data Availability Statement

Data presented in this article are available upon request.

Acknowledgments

The authors very much appreciate and acknowledge the cooperation of Ralph “Junior” Upton and John Pike for the use of their long-term annual ryegrass cover crop field sites and sharing of their field management records, field data, and their observations and wisdoms. The authors also thank Jeff Cook, Gavin Simmons, Eric Rivera Santiago, and Ana P. Hummes for their substantial contributions in conducting field sampling, laboratory analyses, and expertise in monitoring instrument deployment, programming and maintenance. We thank Amy Morrow and her Analytical Lab team for the soil chemical analyses.

Conflicts of Interest

The authors declare no conflicts of interest.

References

  1. Graveel, J.G.; Tyler, D.D.; Jones, J.R.; McFee, W.W. Crop yield and rooting as affected by fragipan depth in loess soils in the southeast USA. Soil. Till Res. 2002, 68, 153–161. [Google Scholar] [CrossRef]
  2. Bockheim, J.G.; Hartemink, A.E. Soils with fragipans in the USA. Catena 2013, 104, 233–242. [Google Scholar] [CrossRef]
  3. Matocha, C.J.; Karathanasis, T.D.; Murdock, L.W.; Grove, J.H.; Goodman, J.; Call, D. Influence of ryegrass on physico-chemical properties of a fragipan soil. Geoderma 2018, 317, 32–38. [Google Scholar] [CrossRef]
  4. Lindbo, D.L.; Rhoton, F.E.; Bigham, J.M.; Hudnall, W.H.; Jones, F.S.; Smeck, N.E.; Tyler, D.D. Loess Toposequences in the Lower Mississippi River Valley.1. Fragipan Morphology and Identification. Soil. Sci. Soc. Am. J. 1995, 59, 487–500. [Google Scholar] [CrossRef]
  5. Franzmeier, D.P.; Norton, L.D.; Steinhardt, G.C. Fragipan Formation in Loess of the Midwestern United States1. In Fragipans: Their Occurrence, Classification, and Genesis; Wiley Online Library: Hoboken, NJ, USA, 1989; pp. 69–97. [Google Scholar]
  6. McDaniel, P.A.; Regan, M.P.; Brooks, E.; Boll, J.; Bamdt, S.; Falen, A.; Young, S.K.; Hammel, J.E. Linking fragipans, perched water tables, and catchment-scale hydrological processes. Catena 2008, 73, 166–173. [Google Scholar] [CrossRef]
  7. Wilson, M.A.; Indorante, S.J.; Lee, B.D.; Follmer, L.; Williams, D.R.; Fitch, B.C.; McCauley, W.M.; Bathgate, J.D.; Grimley, D.A.; Kleinschmidt, K. Location and expression of fragic soil properties in a loess-covered landscape, Southern Illinois, USA. Geoderma 2010, 154, 529–543. [Google Scholar] [CrossRef]
  8. Falsone, G.; Bonifacio, E. Pore-size distribution and particle arrangement in fragipan and nonfragipan horizons. J. Plant Nutr. Soil. Sci. 2009, 172, 696–703. [Google Scholar] [CrossRef]
  9. Rhoton, F.E. Soybean Yield Response to Various Depths of Erosion on a Fragipan Soil. Soil. Sci. Soc. Am. J. 1990, 54, 1073–1079. [Google Scholar] [CrossRef]
  10. Frye, W.W.; Murdock, L.W.; Blevins, R.L. Corn Yield—Fragipan Depth Relations on a Zanesville Soil. Soil. Sci. Soc. Am. J. 1983, 47, 1043–1045. [Google Scholar] [CrossRef]
  11. Bradford, J.M.; Blanchar, R.W. Profile Modification of a Fragiudalf to Increase Crop Production. Soil. Sci. Soc. Am. J. 1977, 41, 127–131. [Google Scholar] [CrossRef]
  12. Olson, K.R.; Mokma, D.L.; Lal, R.; Schumacher, T.E.; Lindstrom, M.J. Erosion impacts on crop yield for selected soils of the north central United States. In Soil Quality and Soil Erosion; CRC Press: Boca Raton, FL, USA, 1999; pp. 259–283. [Google Scholar]
  13. Bradford, J.M.; Blanchar, R.W. The Effect of Profile Modification of a Fragiudalf on Water Extraction and Growth by Grain-Sorghum. Soil. Sci. Soc. Am. J. 1980, 44, 374–378. [Google Scholar] [CrossRef]
  14. Duiker, S.W. In-row subsoiling benefits maize yield on soil with a shallow fragipan. Crop Forage Turf Man. 2020, 6, e20008. [Google Scholar] [CrossRef]
  15. Chen, G.H.; Weil, R.R. Penetration of cover crop roots through compacted soils. Plant Soil. 2010, 331, 31–43. [Google Scholar] [CrossRef]
  16. Illinois State Water Survey. Illinois Climate Network: Station Metadata: Snicarte. Available online: https://warm.isws.illinois.edu/warm/climnet/stationmeta.asp?site=SNI (accessed on 17 November 2024).
  17. Natural Resource Conservation Service (NRCS); United States Department of Agriculture. Soil Series Classification Database. 2024. Available online: https://www.nrcs.usda.gov/resources/data-and-reports/official-soil-series-descriptions-osd (accessed on 29 March 2024).
  18. Soltanpour, P.N.; Johnson, G.W.; Workman, S.M.; Jones, J.B., Jr.; Miller, R.O. Inductively Coupled Plasma Emission Spectrometry and Inductively Coupled Plasma-Mass Spectrometry. In Methods of Soil Analysis; Wiley Online Library: Hoboken, NJ, USA, 1996; pp. 91–139. [Google Scholar]
  19. Faé, G.S.; Montes, F.; Bazilevskaya, E.; Añó, R.M.; Kemanian, A.R. Making Soil Particle Size Analysis by Laser Diffraction Compatible with Standard Soil Texture Determination Methods. Soil Sci. Soc. Am. J. 2019, 83, 1244–1252. [Google Scholar] [CrossRef]
  20. Dane, J.H.; Hopmans, J.W. 3.3.2 Laboratory. In Methods of Soil Analysis; Wiley Online Library: Hoboken, NJ, USA, 2002; pp. 675–720. [Google Scholar]
  21. Vangenuchten, M.T. A Closed-Form Equation for Predicting the Hydraulic Conductivity of Unsaturated Soils. Soil Sci. Soc. Am. J. 1980, 44, 892–898. [Google Scholar] [CrossRef]
  22. da Silva, A.R.; de Lima, R.P. An R package to determine soil preconsolidation pressure. Comput. Geosci. 2015, 84, 54–60. [Google Scholar] [CrossRef]
  23. R Core Team. R: A Language and Environment for Statistical Computing; R Foundation for Statistical Computing: Vienna, Austria, 2024. [Google Scholar]
  24. Patrignani, A. 69: Soil Moisture Drydowns. Available online: https://soilwater.github.io/pynotes-agriscience/exercises/drydowns.html (accessed on 29 March 2024).
  25. Lenth, R.V. emmeans: Estimated Marginal Means, aka Least-Squares Means. R Package Version 1.10. 4.900001. 2024. Available online: https://CRAN.R-project.org/package=emmeans (accessed on 29 March 2024).
  26. Karathanasis, A.D. Mineral Solubility Relationships in Fragiudalfs of Western Kentucky. Soil Sci. Soc. Am. J. 1987, 51, 474–481. [Google Scholar] [CrossRef]
  27. Norfleet, M.L.; Karathanasis, A.D. Some physical and chemical factors contributing to fragipan strength in Kentucky soils. Geoderma 1996, 71, 289–301. [Google Scholar] [CrossRef]
  28. Drohan, P.J.; Thompson, J.A.; Lindbo, D.L.; Beaudette, D.E.; Dadio, S.D. Redefining the fragipan to improve field recognition and land use relevance. Soil Sci. Soc. Am. J. 2020, 84, 1055–1066. [Google Scholar] [CrossRef]
  29. Ogilvie, C.M.; Ashiq, W.; Vasava, H.B.; Biswas, A. Quantifying Root-Soil Interactions in Cover Crop Systems: A Review. Agriculture 2021, 11, 218. [Google Scholar] [CrossRef]
  30. Lucas, M.; Schlüter, S.; Vogel, H.J.; Vetterlein, D. Roots compact the surrounding soil depending on the structures they encounter. Sci. Rep. 2019, 9, 16236. [Google Scholar] [CrossRef] [PubMed]
  31. Weisenborn, B.N.; Schaetzl, R.J. Range of fragipan expression in some Michigan soils: I. Morphological, micromorphological, and pedogenic characterization. Soil Sci. Soc. Am. J. 2005, 69, 168–177. [Google Scholar] [CrossRef]
  32. Nichols, V.A.; Moore, E.B.; Gailans, S.; Kaspar, T.C.; Liebman, M. Site-specific effects of winter cover crops on soil water storage. Agrosystems Geosci. Environ. 2022, 5, e220238. [Google Scholar] [CrossRef]
  33. Bodner, G.; Leitner, D.; Kaul, H.P. Coarse and fine root plants affect pore size distributions differently. Plant Soil 2014, 380, 133–151. [Google Scholar] [CrossRef]
  34. Benson, C.H.; Chiang, I.; Chalermyanont, T.; Sawangsuriya, A. Estimating van Genuchten parameters α and n for clean sands from particle size distribution data. In From Soil Behavior Fundamentals to Innovations in Geotechnical Engineering: Honoring Roy E. Olson; Academic Press: Cambridge, MA, USA, 2014; pp. 410–427. [Google Scholar]
  35. Rhoton, F.E.; Romkens, M.J.M. Water distribution in a fragipan soil during the growing season. Agron. J. 1998, 90, 368–375. [Google Scholar] [CrossRef]
  36. Day, R.L.; Calmon, M.A.; Stiteler, J.M.; Jabro, J.D.; Cunningham, R.L. Water balance and flow patterns in a fragipan using in situ soil block. Soil Sci. 1998, 163, 517–528. [Google Scholar] [CrossRef]
Figure 1. (a) Location of two growers’ fields, Marion and Springerton in southern Illinois, (b) schematic diagram of soil profile of two dominant soil series, ‘Bluford’ and ‘Rend’ found at Springerton and Marion and sites, respectively, and (c) daily high and low air temperatures (°C) and precipitation (cm) during 2022 growing season in Carbondale, Illinois.
Soilsystems 08 00126 g001
Figure 2. (a) Changes in volumetric soil moisture content (cm3 cm−3), (b) comparison of drydown time (days), and (c) changes in soil water storage (cm) with (CC) and without (NCC) annual ryegrass as cover crop during 2022 (soybean growing phase) at Springerton, Illinois.
Soilsystems 08 00126 g002
Table 1. Particle size distributions of soils under control (NCC) and with annual ryegrass (CC) at Marion (n = 3) and Springerton (n = 4), Illinois (p = 0.10). Standard deviation values are in brackets. Different small letters indicate significant difference between NCC and CC at p = 0.10.
DepthSand%Silt%Clay%
(cm)NCCCCNCCCCNCCCC
Marion
0–155.33 (0.96) a5.53 (0.06) a74.2 (0.62) a74.3 (0.64) a20.5 (0.47) a20.1 (0.57) a
15–304.37 (2.25) a3.73 (0.76) a69.9 (1.85) a70.3 (1.04) a25.8 (0.76) a26.0 (0.70) a
30–452.70 (1.49) a2.80 (1.40) a72.7 (0.31) a70.5 (1.47) b24.5 (1.19) a26.7 (2.03) a
45–602.17 (0.57) a2.33 (0.31) a74.4 (0.35) a74.5 (1.95) a23.5 (0.91) a23.2 (1.69) a
Springerton
0–1511.6 (5.91) a13.5 (4.54) a66.7 (4.28) a66.1 (3.98) a21.7 (2.08) a20.5 (1.04) a
15–307.05 (3.90) a6.18 (3.71) a67.0 (2.92) a66.6 (4.28) a26.0 (1.18) a27.2 (2.35) a
30–454.55 (2.83) a7.48 (4.84) a68.0 (2.21) a67.0 (3.31) a27.5 (0.91) a25.0 (1.66) b
45–604.65 (1.71) a5.05 (5.44) a68.1 (2.97) a68.6 (3.67) a27.3 (1.53) a26.3 (2.15) a
60–754.88 (2.17) a9.58 (5.59) a69.5 (3.41) a66.8 (4.02) a25.7 (2.66) a23.6 (3.06) a
75–9013.8 (3.26) a12.5 (7.95)62.7 (0.88) a65.9 (6.19) a23.6 (2.44) a21.7 (2.94) a
Table 2. Mean values of soil properties with (CC) and without annual ryegrass as cover crop (NCC) within different depth increments at two sites in southern Illinois. Different lowercase letters with values in bold indicate significant differences between NCC and CC at the 90% significance level.
Depth (cm)Bulk Density
(Mg m−3)
pHTotal Carbon
(g kg−1)
Total N
(g kg−1)
Mehlich3-P
(mg kg−1)
Mehlich3-Fe
(mg kg−1)
Mehlich 3-Al
(mg kg−1)
NCCCCNCCCCNCCCCNCCCCNCCCCNCCCCNCCCC
Marion
0–151.17 a1.22 a5.91 a5.44 a11.7 a10.2 a1.40 a1.27 a27.3 a22.5 a237 a226 a616 a672 a
15–301.27 a1.27 a6.40 a6.02 a4.33 a5.33 a0.63 a0.83 a9.16 a10.5 a169 a173 a760 a749 a
30–451.18 a1.20 a5.95 a6.14 a3.07 a2.73 a0.60 a0.53 a12.1 a9.00 b172 a159 a897 a820 a
45–601.25 a1.20 a5.22 a5.51 a2.40 a2.03 a0.53 a0.50 a9.2 a10.3 a198 a172 a1018 a892 a
Springerton
0–151.17 a1.17 a5.09 a4.98 a11.7 a10.91.35 a1.40 a16.4 a16.6 a200 a208 a762 a754 a
15–301.22 b1.36 a4.82 a4.73 a4.20 a2.97 a0.68 a0.58 a5.75 a4.67 a183 a161 a1073 a1073 a
30–451.22 b1.29 a4.04 a4.10 a2.38 a1.93 a0.55 a0.53 a2.69 a2.33 a237 a213 a1432 a1403 a
45–601.25 b1.31 a4.02 a4.02 a4.20 a1.65 a0.60 a0.50 a5.48 a3.74 a260 a246 a1362 b1509 a
60–751.30 b1.36 a4.06 a4.07 a1.90 a1.33 a0.48 a0.43 a8.44 a6.56 a251 a202 a1253 a1314 a
75–901.36 a1.33 a4.14 a4.12 a1.40 a1.17 a0.35 a0.30 a9.29 a9.83 a200 a186 a1086 a1157 a
Table 3. Mean (±standard deviation) of soil water retention parameters for different soil depth increments and soil water storage (mm) with (CC) and without (NCC) annual ryegrass at Marion and Springerton sites in southern Illinois. Different lowercase letters indicate significant differences at 90% significance level between NCC and CC.
Depth (cm)ThetaS
(cm3 cm−3)
ThetaR
(cm3 cm−3)
Alpha
(KPa−1)
nPlant Available Water (mm)
NCCCCNCCCCNCCCCNCCCCNCCCC
Marion
0–150.45 a0.43 a0.08 a0.06 a0.01 a0.01 a2.72 a2.73 a55.8 a54.6 a
15–300.40 a0.42 a0.11 a0.10 a0.01 a0.01 a2.77 a2.99 a44.4 a47.3 a
30–450.40 a0.42 a0.12 a0.10 a0.01 a0.01 a2.85 a2.71 a43.1 a47.8 a
45–600.44 a0.45 a0.17 a0.12 a0.01 a0.02 a2.87 a2.23 b41.4 b48.7 a
Storage 202 a220 a
Springerton
0–150.34 a0.33 a0.09 a0.09 a0.01 a0.01 a4.39 a4.49 a37.5 a36.5 a
15–300.36 a0.40 a0.14 a0.12 a0.01 a0.0 a4.06 a3.34 a31.9 a42.6 a
30–450.39 a0.42 a0.20 a0.20 a0.01 a0.01 a5.15 a3.25 b29.5 a33.6 a
45–600.41 a0.46 a0.17 b0.22 a0.01 a0.01 a3.22 a2.95 a35.4 a36.0 a
60–750.40 b0.45 a0.17 b0.21 a0.01 a0.01 a3.62 a3.29 a34.4 a36.3 a
75–900.38 b0.42 a0.16 b0.19 a0.01 a0.01 a3.67 a3.58 a33.3 a35.0 a
Storage 184 a198 a
ThetaS: Saturated water content, ThetaR: residual soil water content, and alpha and n are van Genuchten curve fitting parameters.
Table 4. Pearson correlation coefficient (r) between plant available water (mm) and soil properties at different depth increments for Marion (n = 6) and Springerton (n = 8) sites at 90% significance level.
SiteMarionSpringertonMarionSpringertonMarionSpringertonMarionSpringertonSpringerton
Depth0–15 cm15–30 cm30–45 cm45–60 cm60–75 cm75–90 cm
Sand0.16−0.410.480.010.100.42−0.07−0.12−0.210.39
Silt0.230.46−0.70−0.01−0.73−0.270.800.480.51−0.06
Clay−0.420.170.35−0.010.60−0.59−0.80−0.57−0.31−0.73
BD−0.280.36−0.300.66−0.280.500.220.280.600.37
pH−0.490.71−0.550.640.27−0.070.25−0.170.260.50
Mehlich 3-P−0.06−0.440.260.300.11−0.690.14−0.340.330.60
Mehlich 3-Al0.22−0.23−0.46−0.50−0.65−0.18−0.370.49−0.20−0.49
Mehlich 3-Fe−0.10−0.730.60−0.44−0.40−0.23−0.370.33−0.47−0.67
Disclaimer/Publisher’s Note: The statements, opinions and data contained in all publications are solely those of the individual author(s) and contributor(s) and not of MDPI and/or the editor(s). MDPI and/or the editor(s) disclaim responsibility for any injury to people or property resulting from any ideas, methods, instructions or products referred to in the content.

