Article

No-Till and Crop Rotation Are Promising Practices to Enhance Soil Health in Cotton-Producing Semiarid Regions: Insights from Citizen Science

1
Edward E. Whitacre Jr. College of Engineering, Texas Tech University, Lubbock, TX 79409, USA
2
Department of Biological Sciences, Texas Tech University, Lubbock, TX 79409, USA
3
Climate Center, Texas Tech University, Lubbock, TX 79409, USA
*
Author to whom correspondence should be addressed.
Soil Syst. 2024, 8(4), 108; https://doi.org/10.3390/soilsystems8040108
Submission received: 17 August 2024 / Revised: 10 October 2024 / Accepted: 16 October 2024 / Published: 21 October 2024
(This article belongs to the Special Issue Research on Soil Management and Conservation: 2nd Edition)

Abstract

:
This on-farm study was conducted to assess the impact of six prevalent crop management practices adopted by growers in West Texas on various indicators of soil health. This study is a part of a citizen science project, where we collaborated with cotton growers who helped with standardized sample and data collection from 2017 to 2022. This project aimed to identify soil management practices that increase carbon sequestration, enhance biological activities, and improve overall soil health. We monitored soil moisture, soil organic matter (SOM), inorganic nitrogen (NH4+-N and NO3-N) and other exchangeable nutrients, and soil microbial abundances as obtained via fatty acid methyl ester (FAME) in 85 fields, incorporating different management practices during the cotton growing season. In our study, volumetric moisture content (VWC) was increased by no-till, irrigation, and crop rotation, but the addition of residue decreased VWC. No-till, irrigation, and crop rotation increased SOM, but a cover crop decreased SOM. No-till and residue retention also increased microbial biomass carbon (MBC). Tillage, irrigation, and crop rotation influenced the abundance of the main microbial groups, including bacterial, fungi, and arbuscular mycorrhizal fungi (AMF). Additionally, water content, SOM, and microbial abundances are correlated with clay percentage. Our results indicate that no-till and crop rotation are the two most crucial soil management approaches for sustainable soil health. As such, implementing both no-till and crop rotation in the cropping systems has the most promising potential to increase the soil resilience in dryland cotton production in semiarid regions, thereby helping growers to maintain cotton production.

1. Introduction

Arid and semiarid regions, which contain 41% of the world’s croplands [1], are particularly vulnerable to climate change [2]. Growers in these regions will need to adopt regenerative management practices to help reduce the risk of desertification of these vulnerable regions. Here, we present our findings from a large grower citizen science project involving on-farm research in semiarid West Texas, involving twenty cotton growers and a combined total of 85 fields. We focus on cotton because 40% of the USA’s cotton (Gossypium hirsutum) crop and 60% of the Texas’ cotton crop is produced within this region [3]. As the majority of cotton acreage is dryland [4], production is entirely dependent upon the frequency and amount of precipitation. In the High Plains of West Texas, growers are facing two challenges for growing crops. First, climate change in this region is expected to increase aridity, with more frequent extreme heatwaves and dry spells [2]. Second, the supply of water for irrigation is drastically decreasing. Since the 1940s, growers in the region have relied solely on the Ogallala aquifer for irrigation [5]. When farmlands are irrigated in these water-limited ecosystems, economic returns and production can increase four-fold [6]. However, despite the fact that the Ogallala is the largest aquifer in the United States, long-term over-usage has resulted in water being extracted far faster than it is being replenished by rainfall. As such, in some areas, growers are unable to irrigate sufficiently to meet crop demand [7]. To be able to support the region’s agriculture-based economy, alternative soil and crop management practices are needed to conserve water from the aquifer while capturing and retaining as much precipitation as possible. These efforts will require the adoption of regenerative agricultural practices that improve soil health and increase water storage and infiltration [8,9,10].
Soil health is the capacity of soil to sustain life such as plants and animals. Soil health in general can be measured using different indicators, including soil organic matter (SOM) levels, pH, nutrient concentrations and mineralization rates, and soil microbial diversity and functional attributes [11,12,13,14]. Agricultural management practices geared towards improving soil health [15] will increase the resiliency (recover quickly to capacity from adverse conditions) of soils to climate extremes and help increase the moisture retention of soils through soil carbon sequestration [16]. Promising practices to improve soil health include no-till [15,17], residue retention [18], cover crops [19], and crop rotation [20]. Management practices may affect soil health and ultimately can hurt or enhance the crop yield depending on climate, soil type, and interaction with other cultivation techniques. For example, cover crops are shown to improve soil health in hot and dry semiarid climatic conditions [18] by reducing erosion loss, increasing nutrient content, and promoting root exudation, thereby influencing soil carbon storage and biological activity of the soil [21,22,23]. However, other studies demonstrated a decline in water availability and soil carbon with cover crops [24,25] because of competition with the main crop for water and nutrients, which might have detrimental impacts on crop yield, especially in a dry environment [22]. Burke et al. [26] showed that while cover crops reduced available soil moisture initially in the semiarid High Plains, water availability was greater across the growing season than in fields with no stubble residue and did not account for reduced lint production often associated with stubble management.
Management practices that increase SOM storage increase resilience to climate extremes while increasing water retention. Some soil health indicators, such as increased SOM content, have been associated with no-till management [27]. In conventional tillage practices, soil aggregates containing nutrients and microbes are broken down, thereby accelerating the loss of SOM, decreasing rainfall infiltration, and increasing erosion [28]. Furthermore, constant tilling of the soil coupled with little to no precipitation and the limited addition of residue further reduces the SOM storage [29], thereby degrading the soil health. Conservation tillage practices lead to an increase in soil carbon capture for semiarid agroecosystems [30]. For example, no-till management practices lowered carbon loss through CO2 emissions and resulted in higher sequestration of carbon in the soil when compared to conventional tillage systems [31]. Similarly, other soil management practices, such as crop residue retention, cover cropping, and crop rotation practices, have also been shown to promote carbon sequestration [32]. Crop residue can contain up to 40% organic carbon and not only provides carbon input to the soil but also minimizes soil carbon loss by regulating the SOM decomposition process [33].
Soil microbial communities are also considered a major indicator of soil health. Crop management practices such as crop rotation and cover crops that result in more diverse microbial communities have been shown to be linked to greater soil health while minimizing the negative effects of environmental stresses [12,34]. A study from European cereal-based cropping systems, however, explained that the duration of the cover crops in the rotation is more important for soil microorganisms than crop diversity [35]. Cover crops and crop rotation practices can add carbon from above- and belowground biomass as well as increasing root exudates, which in turn improves microbial growth, leading to increased microbial diversity and functional capacity [36]. Furthermore, combining cover crops with no-till practices can lead to further changes in the microbial community composition and increase diversity [34]. For semiarid systems, which have low SOM accumulation rates, no-till practices minimize soil disturbance and increase the SOM level, thus promoting the growth of beneficial soil microbes, such as arbuscular mycorrhizal [37].
Even though many studies have been conducted on identifying soil management practices and their effects on soil health, they were mainly conducted in limited fields or small plots that did not capture the system’s complexity as effectively as on-farm studies, which are more realistic [15]. A drawback with using active farms is that this practice does not represent a typical controlled study. However, while our study was observational, the growers provided scenarios for what actually occurs in production systems from year to year. Combined with the fact that this study encompassed a large spatial extent (Figure 1), citizen science is a powerful tool to address some of the larger challenges that society faces in terms of food and fiber production. Despite the pressing need to adapt to and mitigate the negative effects of climate change on crops, citizen science aimed at increasing food security is sorely lacking [38]. Other advantages of the involvement of farmers include increased engagement through increased interest, motivation, and knowledge transfer among farmers [39]. The willingness of farmers to implement the findings of on-farm research has been found to be higher than their willingness to implement the findings of research not conducted on-farm [40]. In addition, citizen science gives a new avenue for interdisciplinary insights and collaboration with diverse perspectives in agricultural research, thereby creating an opportunity for scientists to use farmers’ own agricultural knowledge, sometimes passed on through generations, as a resource [41]. Hence, our study will contribute to overcoming the lack of on-farm studies that aim to improve soil health through management practices that are already on hand. The goal of our five-year grower citizen science study was to determine which soil management practices (1) improve nutrient availability, (2) increase SOM, (3) retain more moisture, and (4) increase microbial diversity. We also monitored the soil temperature and moisture environment for the duration of each growing season (June until September). We hypothesized that no-till or minimal till, crop rotation, and the presence of cover crops increase SOM and microbial abundance, including beneficial fungi such as arbuscular mycorrhizal fungi (AMF), and have a stabilizing influence on soil temperature and moisture. These practices should enhance soil health and lead to more sustainable cotton production in semiarid regions.

2. Materials and Methods

2.1. Study Sites

We monitored soil properties and microbial dynamics in cotton fields belonging to twenty different growers within 100 miles of Lubbock (33.67° N, 101.82° W). Lubbock has a mean annual temperature of 16.4 °C (1993–2022 period, weather.gov) and a mean total precipitation for the same period of 456 mm, ranging from a minimum of 149 mm in 2011 and a maximum of 845 mm in 2004. During the study period (2017–2022), wet years alternated with dry years (2017: 558 mm, 2018: 388 mm, 2019: 619 mm, 2020: 293 mm, 2021: 522 mm, and 2022: 383 mm). The study region has a semi-arid climate, and cotton is a major commercial summer crop grown by farmers. The fields included in this study encompassed a large spatial variation, thus also exhibiting the differences in inherent soil properties (Figure 1).

2.2. Citizen Science Implementation Model and Soil Sample Collection

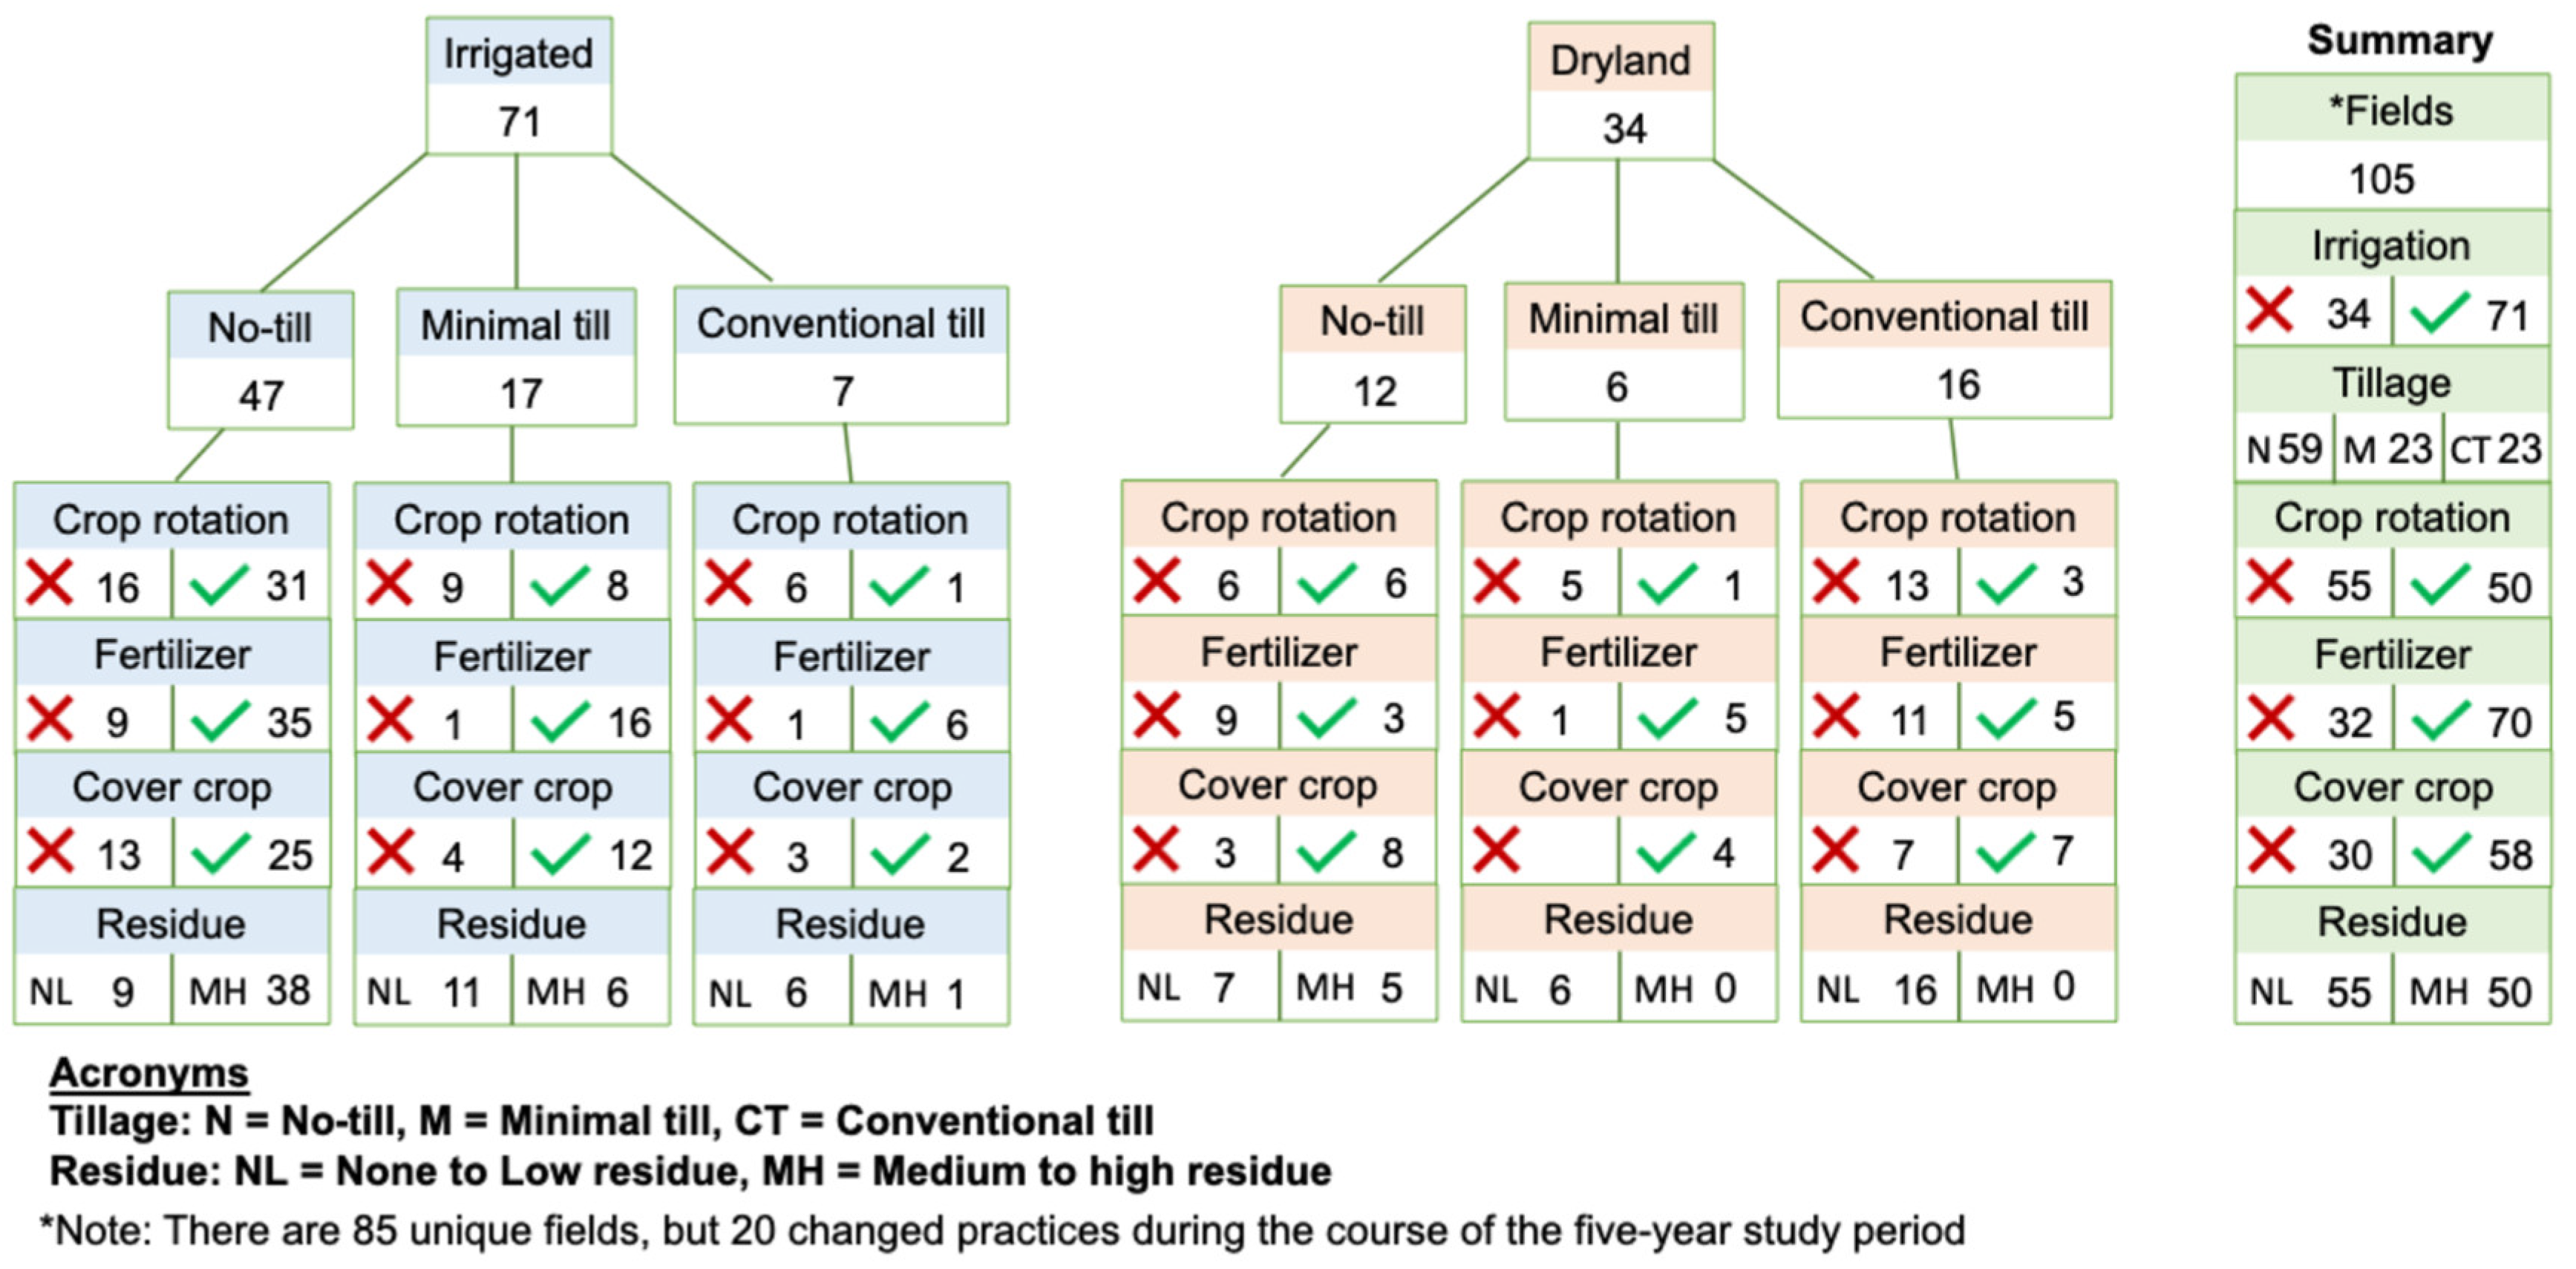
The study presented here was part of a grower citizen science project where twenty growers contributed to soil sampling efforts and data collection at their farm. These fields generated income for the growers, and as such, they were managed differently for each grower. Hence, while our study was observational, the growers provided scenarios for what actually occurs in production systems from year to year to allow producers to grow a crop that provides economic return. As each grower contributed multiple fields to this project, we had 85 unique fields to evaluate in total (see Figure 1 for field locations). The project started small, with 16 fields in 2017, 33 fields in 2018, 39 fields in 2019, 45 fields in 2021 (no field work in 2020 because of COVID-19), and 47 fields in 2022. Fields that were monitored year-after-year did not always have the same management practices. Twenty of them had minor changes (e.g., transitioning to cover crops instead of fallow, or fertilized one year but not the other). As a result, our ultimate analysis used 105 combinations of agricultural practices, ranging from more traditional practices (tillage, continuous cotton, no residue, fallow in winter) to regenerative (no-till, crop rotation, a cover crop in winter, and residue retention) (Figure 2). The large dataset enabled us to separate the fields into various categories and to perform exploratory analyses on how the different practices each grower employed affected soil properties and microbial communities. We also explored temporal dynamics for each field, as the growers performed sampling about a month after planting (early to -mid-June), during the peak growing season (late July), and during the late growing season prior to harvest (early to mid-September).
To standardize soil sample collections across fields, we demonstrated to the growers each year at the first sample collection how to collect and transport or ship the soil samples to us. They collected three approximately 500 g samples per field (0–15 cm soil depth), with samples collected at least 50 m from each other. Sampling locations were marked by flags to ensure that soil samples over the course of the growing season were collected in similar areas by the growers. Samples were stored in Ziploc bags and kept cool in the field with ice packs and a large cooler and then transferred to a cold room (4 °C) until analysis. All growers except one (living the farthest from Lubbock) were able to drop off the samples in our lab on the same day of collection.

2.3. Management Practices

The management practices we considered for this study were crop residue, crop rotation, use of cover crops, tillage, irrigation, and fertilizer use. Regarding tillage, the practices of conventional tillage, minimal till, and no-till were applied on different farmlands by different growers. According to NRCS (www.nrcs.usda.gov), conventional tillage involves the mechanical manipulation of soil to prepare it for planting, manage crop residues, or control weeds. In minimally tilled fields, soil disturbance is minimized by keeping tillage intensity lower than in conventional systems or using specialized equipment like a chisel plow or stripped tilling. In a no-till system, the soil is not mechanically tilled, and crop residues are left on the field surface after harvest, which helps to protect the soil and improves its properties over time.
We categorized fields into irrigated and dryland based on irrigation practices; however, irrigation methods varied by growers. We did not consider irrigation method in this study (e.g., center-pivot irrigation, drip irrigation, etc.), nutrient type (e.g., different kinds of inorganic fertilizer, compost or no fertilizer), and fertilization rates. The amount and type of residue on the field also varied among growers. For simplicity and to enable the detection of overall patterns in the data by having sufficient replication in each subgroup, we treated fertilizer, crop rotation, and cover crops as binary variables, and we categorized residue levels into two categories: none–low and medium–high.

2.4. Soil Environmental Data

We used 5TM and/or TEROS12 sensors connected to ZL6/EM50 data loggers (METER Group, Inc., Pullman, WA, USA) to monitor soil temperature and volumetric water content (VWC) every 30 min throughout the growing season, from June to September/October. Sensors were placed just below the surface (0–2 cm) and at a 15 cm depth. We chose these depths to help determine whether precipitation that infiltrated the surface made it further down into the soil profile. Most of the roots are located within these soil depths.
We also calculated the daily temperature range (DTR) of soil at both depths; it is a measure of how much the soil temperature varies each day. We calculated DTR by calculating the difference in the maximum and minimum temperature experienced over a 24 h period. All daily environmental data were then averaged on a monthly basis prior to statistical analysis.

2.5. Laboratory Analysis for Different Soil Health Indicators

The soil health indicators included in this study were soil chemical properties, SOM, microbial biomass carbon (MBC), dissolved organic carbon (DOC), MBC to soil organic carbon ratio (MBC: SOC), and abundance of main microbial groups. Available inorganic nitrogen (NH4+–N, NO3–N), phosphorus, and a suite of other exchangeable nutrients (K, Ca, Mg, S, B, Mn, Zn, Fe and Cu), SOM, and pH were analyzed by Waters Agricultural Laboratories (Owensboro, KY, USA) within 5 days of sample collection. The inorganic nitrogen was extracted with a 2 M KCl solution and analyzed on a FIA analyzer (FIA Lab Instruments, Inc., Seattle, WA), whereas the other nutrients were extracted with a Mehlich III solution and analyzed on an ICP (Thermo Scientific iCAP, Thermo Fisher Scientific, Inc., Waltham, MA, USA). SOM was determined via the loss-on-ignition method using a temperature of 350 °C for 2 h. Soil organic carbon was calculated by multiplying SOM by 0.58 [42]. Soil texture was determined using the hydrometer method [43]. In short, soil was blended with a sodium metaphosphate solution and inverted in a graduated cylinder. The hydrometer and a thermometer were placed inside the cylinder with an initial reading taken after 40 s and the second reading taken after 2 h. Soil pH was analyzed in distilled water using a 1:1 soil to water ratio. We also measured the gravimetric water content of soil samples shortly after collection (within 1–2 days) by using the oven-drying method. As semiarid soils could contain gypsum and lose water from the crystal structure, we dried our samples at 70 °C until reaching a constant weight.
Microbial biomass carbon was evaluated using the chloroform-fumigation method described by Vance et al. [44]. For each field-moist sample, we weighed four 5 g dry-weight-equivalent soil samples. Of these four samples, two were fumigated for 48 h with chloroform, while the other two did not receive a fumigation treatment (i.e., served as controls). We added the soils to 50 mL of 0.5 M K2SO4 and used a reciprocal shaker (E6000, Eberbach Corporation, Belleville, MI) to mix for 1 h. We then filtered the samples using Whatman Grade 43 filter paper (Whatman International Ltd., Maidstone, UK). We measured the absorbance of the filtrate at 280 nm using a GENESYS 150 UV-Visible Spectrophotometer (ThermoFisher Scientific, Madison, WI, USA). The MBC was calculated by subtracting extractable carbon contained in the chloroform-treated samples from the control samples and assuming a KEC value of 0.45 [45]. The K2SO4-extracted carbon measured in the control samples served as a proxy for DOC [46,47,48]. This measure, however, could overestimate actual DOC, as some inorganic carbon (e.g., carbonates) could be present.
The abundances of main microbial groups were measured by means of the fatty acid methyl-ester (FAME) procedure. Using FAME analysis rather than barcode sequencing allowed us to better understand the impacts of environmental or management factors on the aggregated microbial functional outcomes and community composition, such as the absolute abundances of saprophytic fungi and arbuscular mycorrhizal fungi (AMF), and hence is a better measure of changes in functional capacity rather than in taxonomic groups. The results of the FAME analysis have been used by other papers dealing with soil health [49,50]. We calculated total FAME levels (as a proxy of total microbial biomass), the absolute abundances of saprophytic fungi and AMF, and the fungi/bacteria (FB) ratio. We used EL-FAME analysis as described by Schutter and Dick [49], but with some modifications [50]. In short, 3 g dry-weight-equivalent soil samples were taken from each sample and incubated in 15 mL of 0.2 M methanolic KOH for 1 h in a water bath at 37 °C and vortexed every 15 min during that time. Then, the fatty acids were neutralized by adding 3 mL of 1.0 M acetic acid and incubated at room temperature (25 °C). A 1:1 hexane/methyl tert-butyl ether (MTBE) solution was added to separate the FAMEs into the organic phase. This mixture was vortexed and centrifuged at 26.67 Hz for 20 min, and then the top organic phase (hexane layer) was carefully transferred to a clean test tube, and the hexane was evaporated under N2 for 15–20 min. The FAMEs were dissolved using a standard solution (hexane with 19:0 internal standard), transferred to a gas chromatography vial, and analyzed via gas chromatography. The markers for microbial groups were selected from the data library established over the years for several soil types, management systems, and regions [51,52,53]. We used the FAME marker 16:1 w5c for AMF and 18:3 w6c, 18:0 iso, 18:4 w3c, 18:2 w6c, 18:1 w9c, 18:1 w7c, and 18:1 w5c for saprophytic fungi. Gram-positive (G+) bacteria (a14:0, i14:0, a15:0, i15:0, a16:0, i16:0, a17:0, i17:0, and i19:0), Gram-negative (G−) bacteria (cy17:0 ω7c, 18:1 ω7c, 18:1 ω5c, cy19:0 ω7c, cy19:0 ω9c), and Actinobacteria (10Me 16:0, 10Me 17:0, 10Me 18:0, 10Me17:1ω7c, 10Me 18:1ω7c, and 10Me 19:1ω7c) were also evaluated. The absolute amounts of FAMEs were indicated in nmol g−1 soil for the individual peak data for each fatty acid. The FB ratio was calculated from fungal and bacterial FAME data.

2.6. Statistical Analysis

R, open-source software, (R version 4.3.1) was used to perform statistical analysis and visualizations [54]. We used linear mixed effect models using the ‘lmer’ function in ‘lme4’ package [55] with different soil management practices such as tillage, irrigation, residue, cover crops, fertilizer use, and crop rotation as categorical predictors (see Management Practices for detail), to determine if these management techniques have significant effects on soil moisture, soil temperature, MBC, SOM, total FAME levels, bacterial FAME levels, fungal FAME levels, AMF, FB ratio, and the ratio of MBC to SOC. Regarding the latter response variable, MBC is a more sensitive indicator of changes in the carbon cycle and occurs at shorter time-scales than changes in SOM [56,57], and hence, the ratio could give an early indication of whether the soil is gaining or losing carbon [56].
Prior to statistical analyses, the three replicates per field were averaged at each time point to obtain one representative value per field. To account for non-independence of the data (fields were sampled over time), we included the field ID and sampling period as the random effects. Multiple mixed-effects models were fit for each response variable and the model with the lowest Akaike information criterion (AIC) value was selected as the final model. We used ‘glmulti package’ [58] for model fitting and model selection. A post hoc pairwise comparison test (Tukey test) was also performed to determine where statistical significance existed among the different levels of categorical predictors. We used the emmeans package [59] for the pairwise comparison. The percentage change was also calculated from the mean values calculated using the emmeans package. Additionally, similar a model fitting and model selection procedure was repeated for each response variable where soil variables such as clay percentage, soil moisture, soil pH, and the availability of different macro- and micro-nutrients were used as the predictors. Adding all the nutrient data into the model might cause the overfitting of the model. To avoid such problems, we first performed a principal component analysis (PCA) on the available nutrient data, and then loadings of PC1 and PC2 were used as predictors in the model (referred to as non-nitrogen soil nutrient availability). Nitrogen availability is a major limiting factor for crop production in the High Plains of West Texas, and most growers apply large amounts of nitrogen fertilizers in their fields. To evaluate the effects of nitrogen on soil health separately, total available nitrogen (ammonium and nitrate) was excluded from PCA and kept as a separate predictor in the model. In both models, the response variable was log-transformed whenever the residuals of the models did not follow a Gaussian distribution. Log transformation was applied to the data for total available nitrogen, available phosphorus, MBC, and FAME biomarker levels of different microbial groups. The transformed data were subsequently back-transformed to the original scale for visualization and interpretation. A post hoc mixed model was fit to evaluate the interaction between the most important predictor from the previous two models. When crop rotation was an important predictor in the model, we ran another post hoc analysis using the major crop type used in rotation (cotton–maize, cotton–sorghum, cotton–cereals, cotton–maize–cereals, and cotton–multispecies) as a predictor (and using “none” if the field had continuous cotton). We also used random forest models to evaluate the predictive power of the predictors used in the mixed effect model. Both categorical and continuous predictors were used in a single random forest model and the ranking of the variables were conducted using the varimp() function from the package “party” [60]. Lastly, we performed non-metric dimensional scaling (NMDS) to visualize the abundances of microbial groups across different management practices. The differences in abundances of different microbial groups across soil management practices were analyzed using the PERMANOVA test in the ‘vegan’ package [61]. We used ggplot2 for visualizations [62].

3. Results

Average soil temperatures at a 15 cm depth were lower in fields that implemented no-till (χ2 = 9.65, p = 0.008), irrigation (c2 = 117.74, p < 0.001), and crop rotation (χ2 = 10.06, p = 0.005), while at the soil surface, only fields that used irrigation (χ2 = 94.75, p < 0.001) and crop rotation (χ2 = 18.90, p < 0.001) had a lower soil temperature. Soil temperatures showed a negative correlation with clay content both at the soil surface (χ2 = 14.30, p = 0.008) and a 15 cm depth (χ2 = 12.50, p = 0.002). We found that DTR at a 15 cm depth was lower (i.e., the thermal environment was more stable) when fields received irrigation (χ2 = 60.17, p < 0.001) and fertilizer addition (χ2 = 5.19, p = 0.023), retained residue (χ2 = 4.15, p = 0.042), and in soils with a higher clay percentage (χ2 = 10.77, p = 0.005). Likewise, at the surface, DTR was lower in irrigated fields (χ2 = 20.59, p < 0.001) and fertilized fields (χ2 = 8.46, p = 0.004), but now fields with crop rotation (χ2 = 4.75, p = 0.029) and cover crops (χ2 = 6.41, p = 0.011) were stronger predictors than DTR at a 15 cm depth. We further found that DTR had a negative correlation with VWC (Figure S1), and hence, thermal stability was higher in wetter soils.
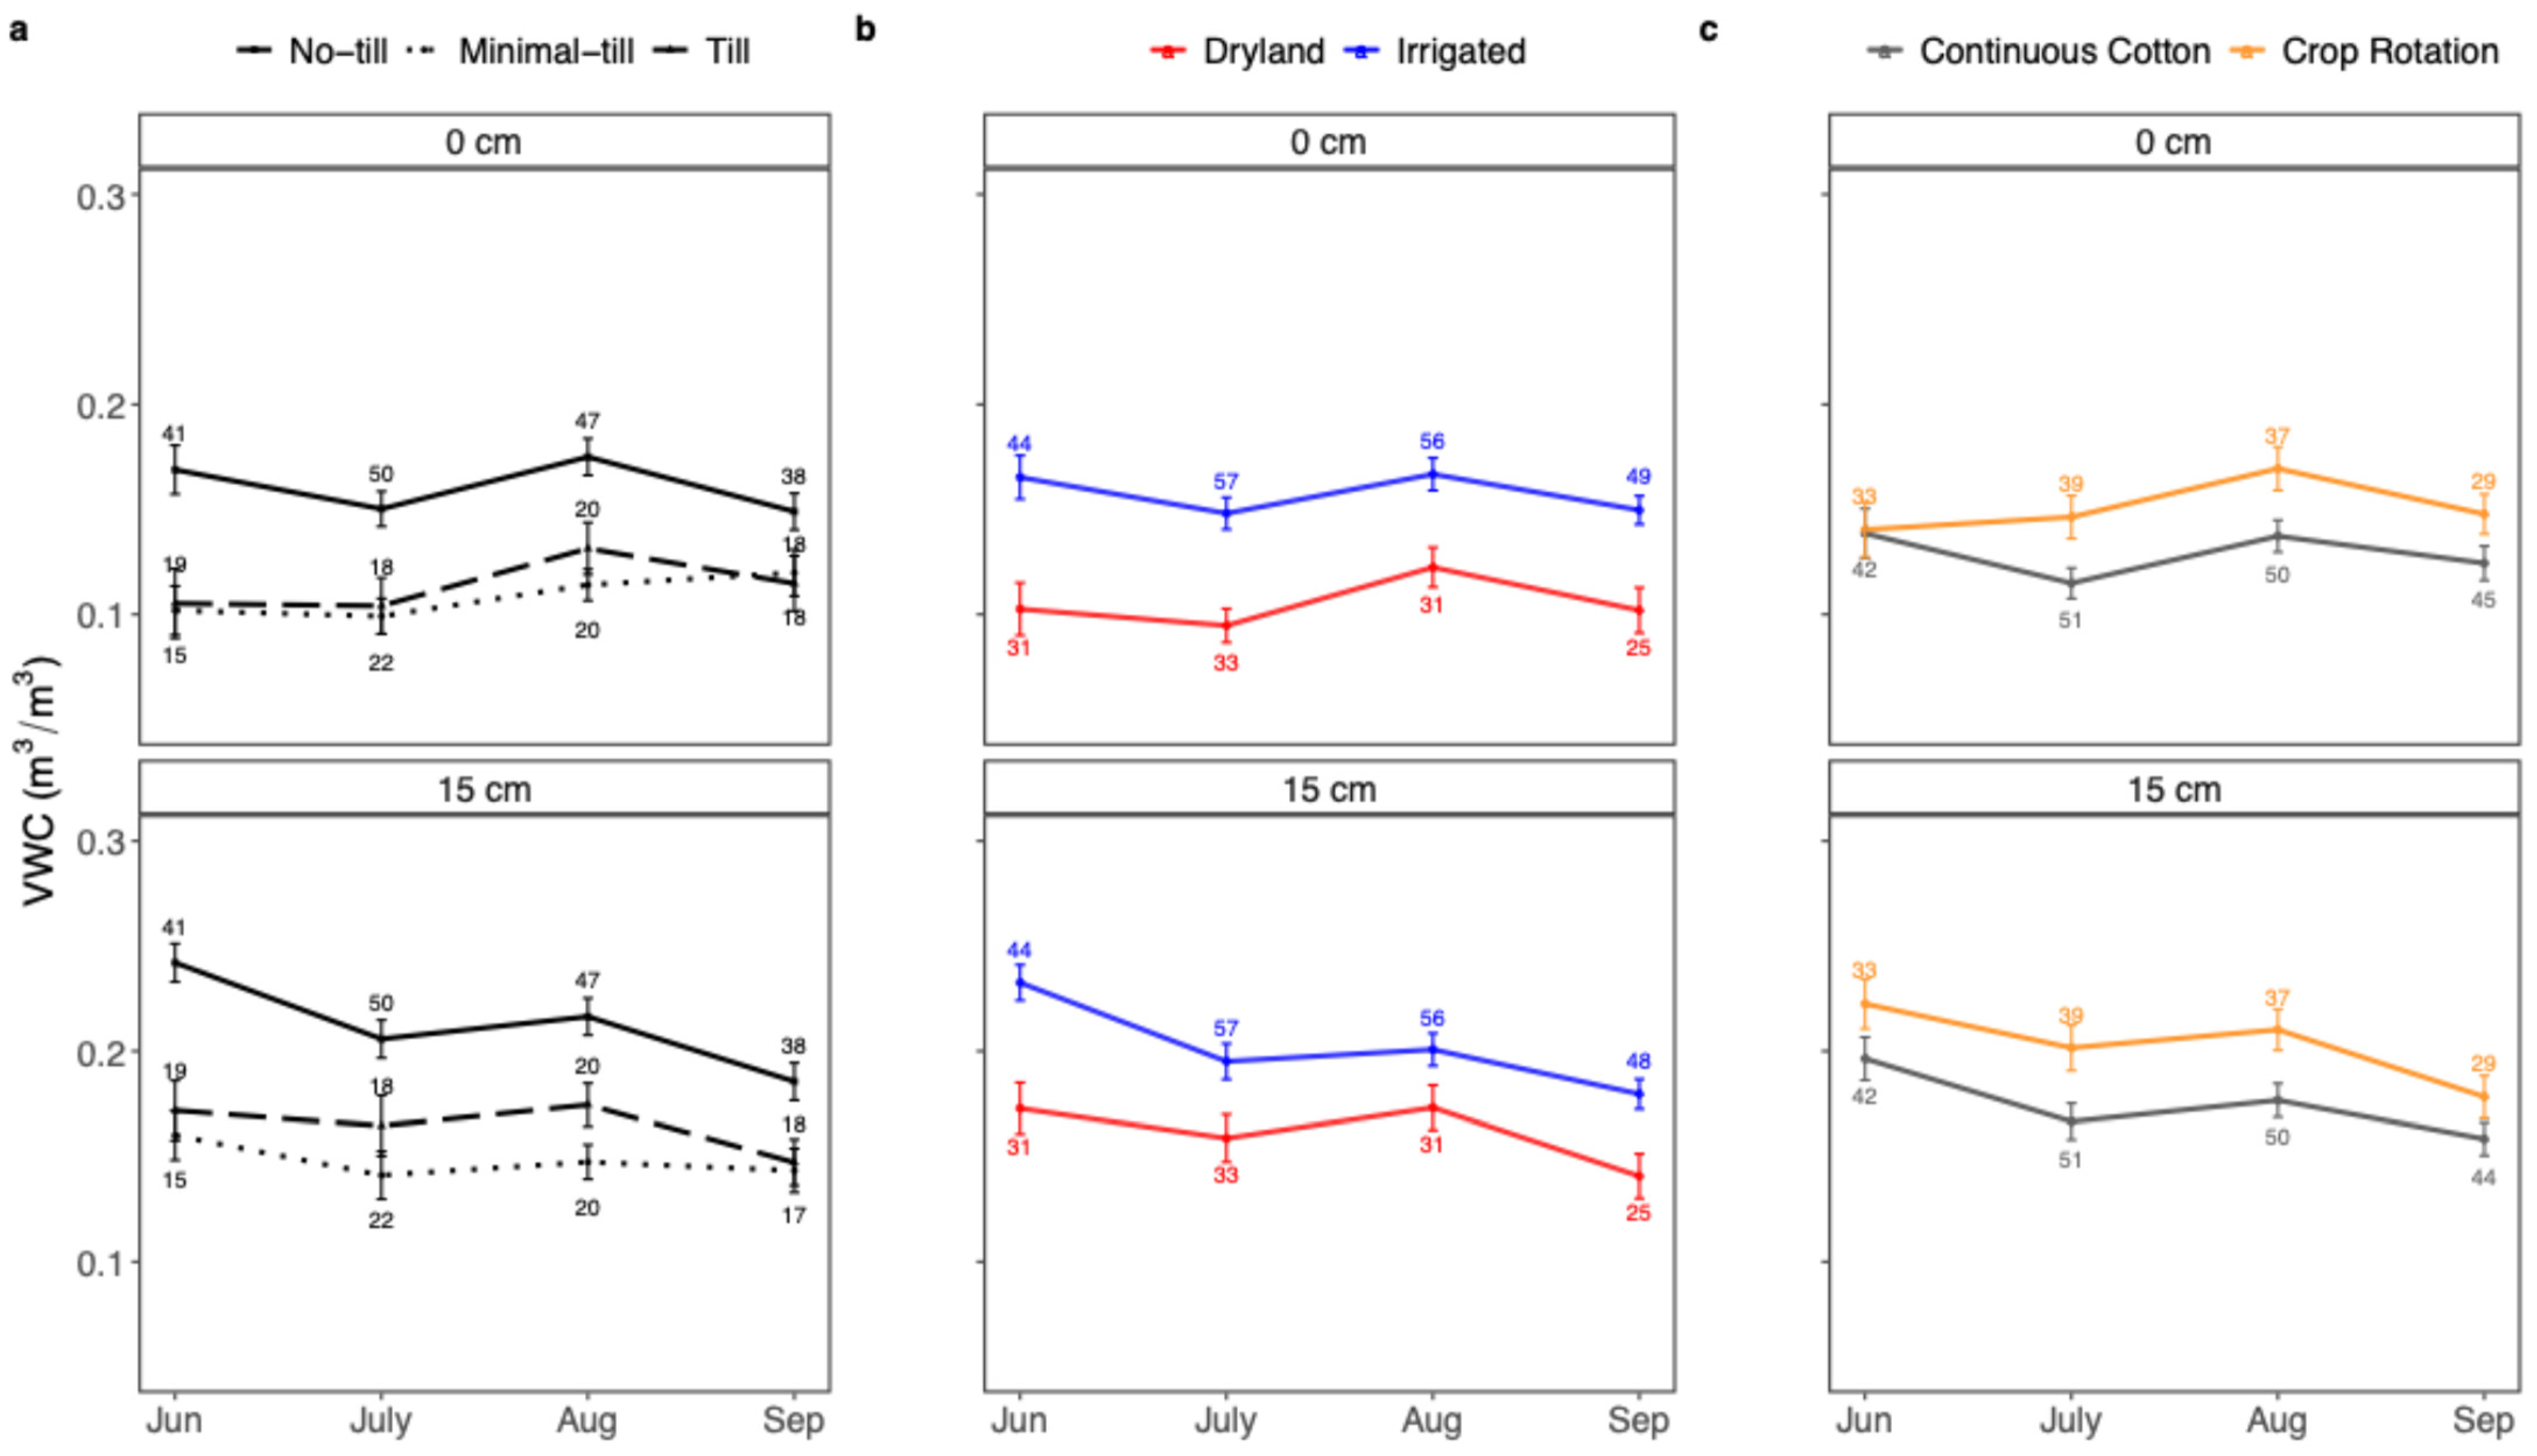
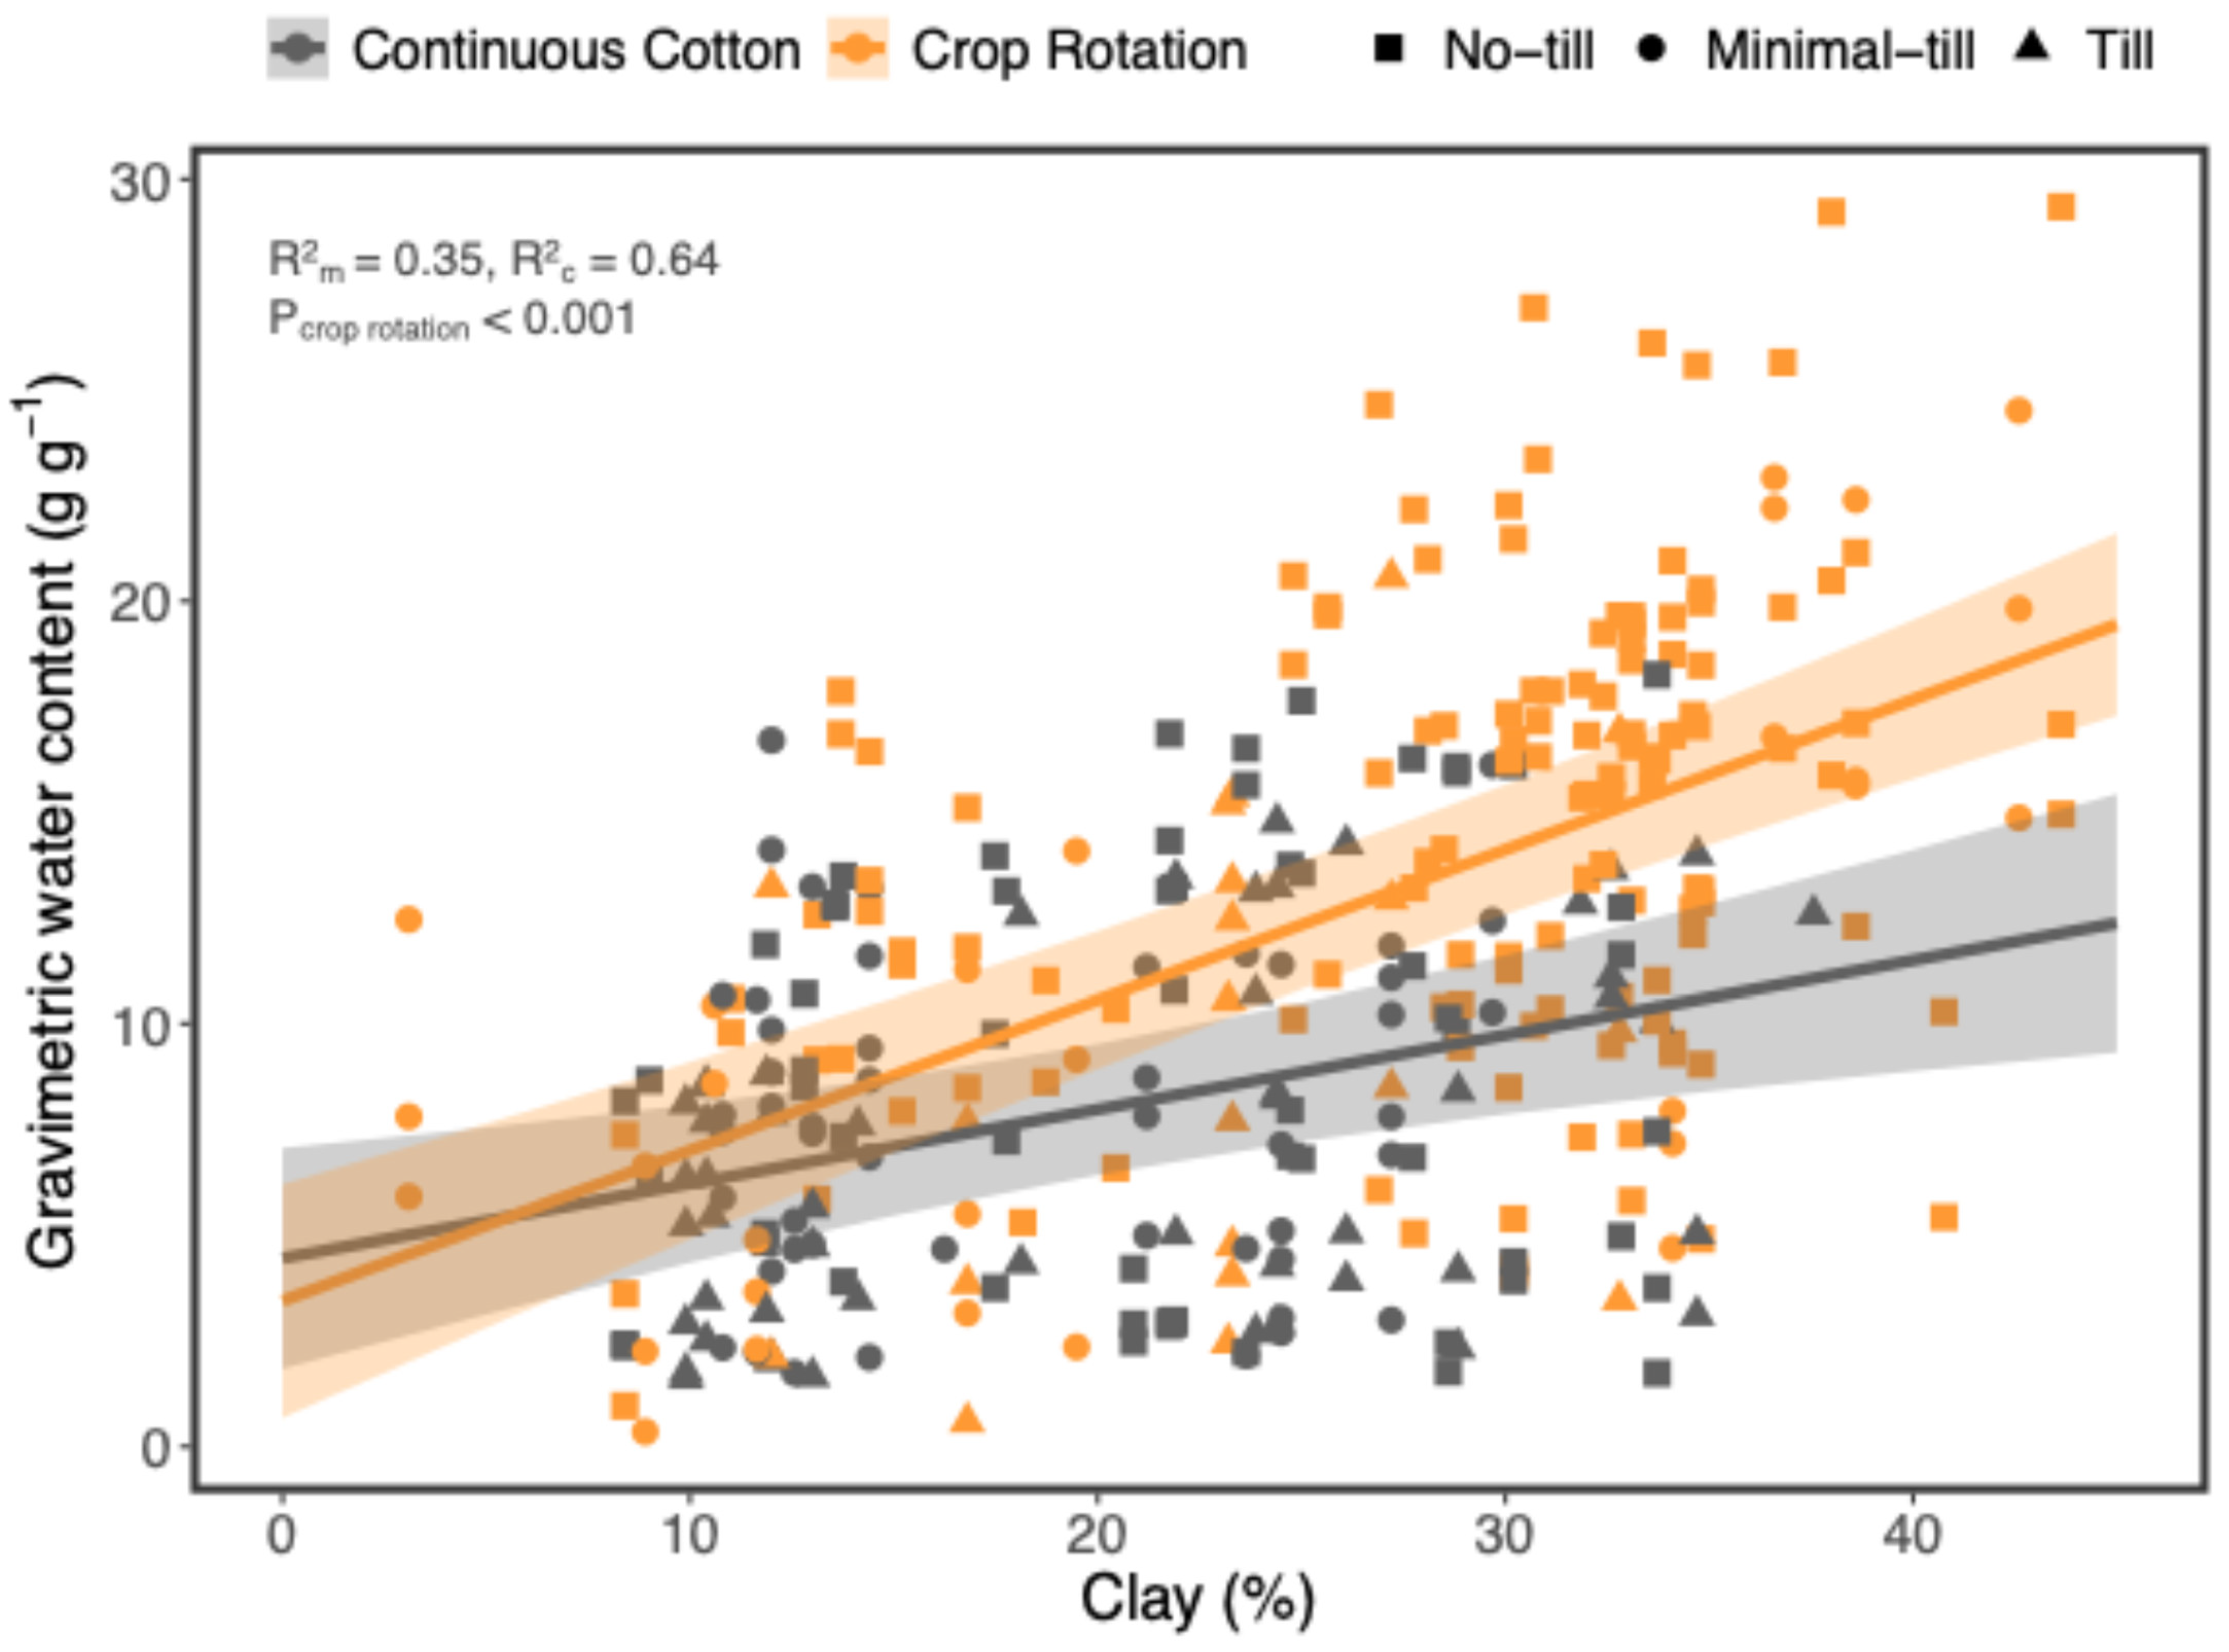
The volumetric water content at a 15 cm depth was higher in fields that implemented no-till (χ2 = 33.79, p < 0.001) and irrigation (χ2 = 8.62, p = 0.003) and in soils with a higher clay content (χ2 = 150.68, p < 0.001). Fields with residue had a generally lower VWC (χ2 = 6.90, p = 0.009) compared to fields with medium to high residue. Similarly, at the soil surface, VWC was higher in fields with no-till (χ2 = 9.40, p = 0.009), when irrigated (χ2 = 6.24, p = 0.012), and when clay content was higher (χ2 = 69.54, p < 0.001; Figure 3). Additionally, VWC was also higher when fields were fertilized (χ2 = 24.36, p < 0.001) and underwent crop rotation (χ2 = 6.54, p = 0.011) and irrigation. Similarly, the gravimetric water content (GWC) in the soil samples collected from a depth of 0 to 15 cm was significantly higher when management practices included no-till (χ2 = 15.62, p < 0.001), irrigation (χ2 = 30.06, p < 0.001), and crop rotation (χ2 = 18.83, p < 0.001), and, as before, was positively related to clay content (χ2 = 100.90, p < 0.001) (Figure 4).
Total inorganic nitrogen (NH4+-N and NO3-N combined) was higher in fertilized fields (χ2 = 4.31, p = 0.038) and in fields with crop residue (χ2 = 12.76, p < 0.001). We also found a positive relationship between total nitrogen and SOM (χ2 = 21.01, p < 0.001) (Figure S2). With respect to available phosphorus, no-till fields had significantly higher levels compared to tilled fields (χ2 = 19.99, p < 0.001). Phosphorus availability was also higher in fields that were irrigated (χ2 = 11.97, p < 0.001) and had fertilizer added (χ2 = 17.64, p < 0.001) and was positively related to SOM (χ2 = 10.27, p < 0.001) (Figure S2). Cation exchange capacity (CEC) and non-nitrogen elemental nutrients such as Ca, Cu, Mn, Mg, K, B, Zn, Fe, S, and P, were evaluated by means of PCA with a total of 60% (PC1, 39.9%, and PC2, 2.1%) variation explained by PC1 and PC2. Mg, B, Mn, Cu, K, and CEC had large positive loadings on PC1, while P, Fe, Zn, and S had large negative loadings on PC2. Ca is positively correlated with PC2 (Figure S3).
Soil organic matter was 32.5% higher in no-till fields (1.14%) compared to conventionally tilled soils (0.86%) (χ2 = 12.41, p = 0.002) (Figure 5a), 15.2% higher in irrigated fields (1.06%) relative to dryland fields (0.92%) (χ2 = 4.34, p = 0.037) (Figure 5b), and 15.4% higher in fields with crop rotation (1.05%) compared to fields with continuous cotton (0.91%) (χ2 = 4.38, p = 0.036) (Figure 5c). In fields that used cover crops, SOM was 19.4% lower (χ2 = 13.14, p < 0.001) (Figure 5d), while SOM was similar in fields with and without crop residue. To isolate the effect of crop rotation from tillage, we compared crop rotation practices in fields that were no-till and in fields that had either minimal or conventional tillage. Organic matter was higher when crop rotation was implemented irrespective of tillage practice (Figure 5e,f). In both cases, crop rotation fields had 30% more organic matter compared to fields with continuous cotton (p < 0.001 for both). Furthermore, we observed the highest SOM content in the fields with cotton–maize–cereal rotation (1.39%), followed by cotton–maize rotation (1.34%), while fields with cotton–multispecies rotation had the lowest SOM (0.63%).
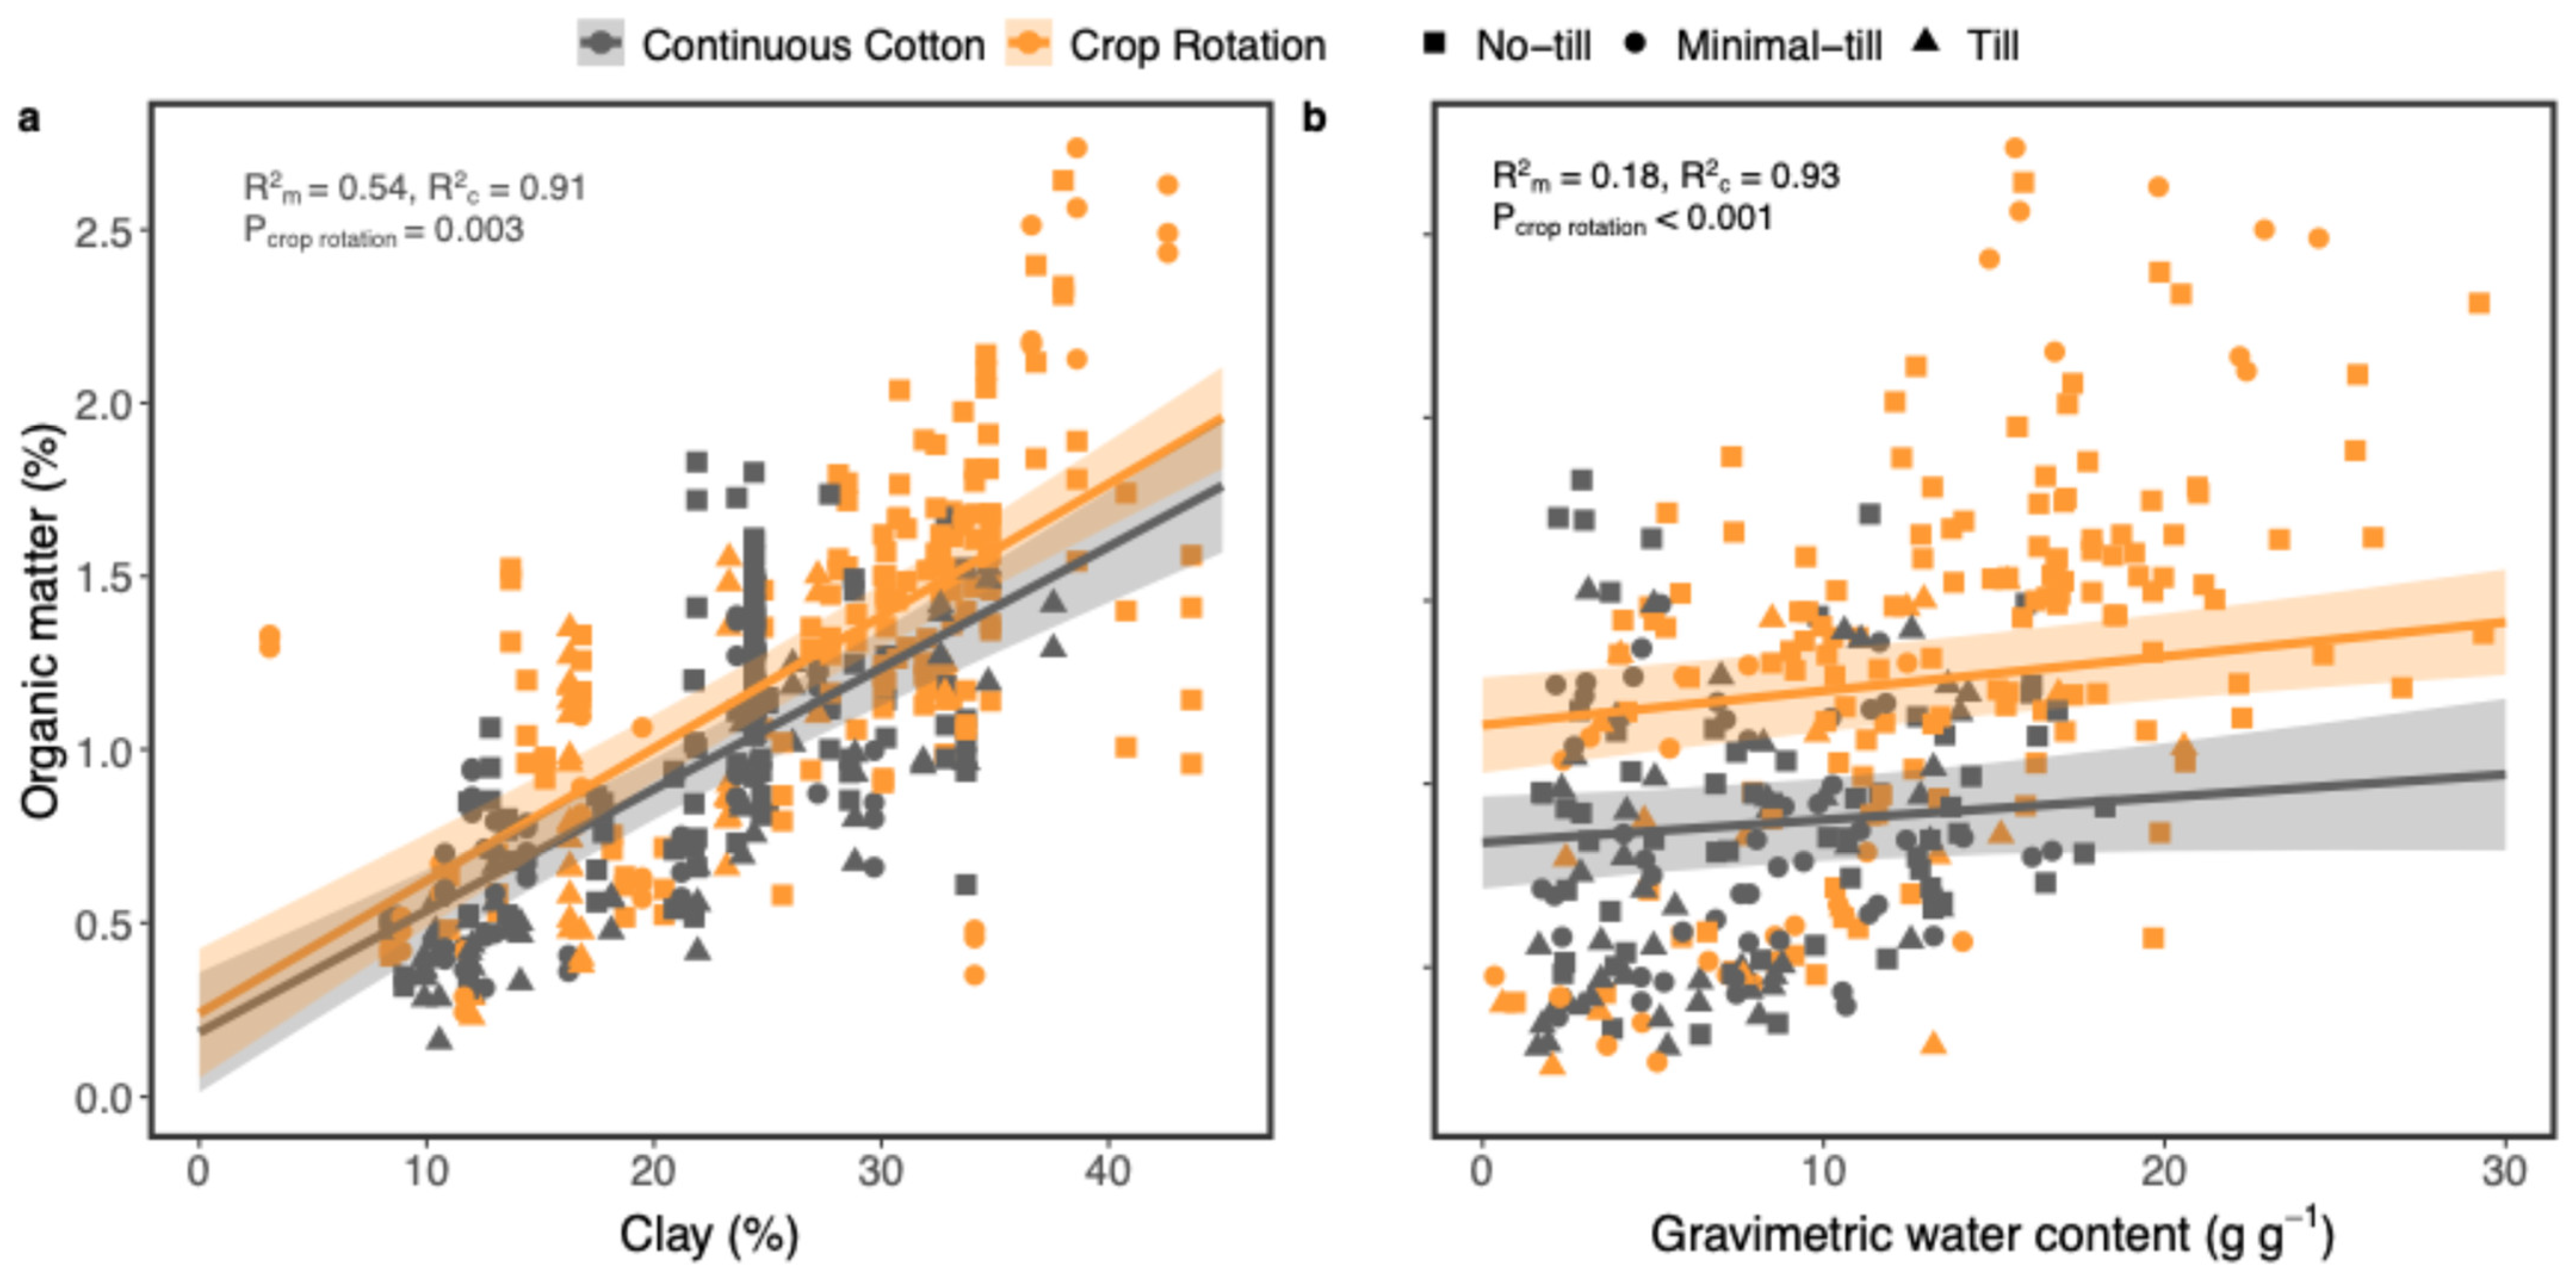
There was a positive relationship between SOM and clay content (χ2 = 194.30, p < 0.001) (Figure 6a) and with gravimetric soil moisture (χ2 = 9.91, p < 0.001) (Figure 6b). Regarding MBC, tilled soils had 6.3% lower MBC compared to no-till fields (χ2 = 10.02, p = 0.006), but MBC did not differ between minimal tilling and the other two practices (i.e., conventional tillage and no-till). Fields that were fertilized (χ2 = 24.41, p < 0.001) and fields with residue (χ2 = 9.22, p = 0.002) had 8.9% and 5.5% higher MBC, respectively, but irrigation, crop rotation, and cover crops were not important predictors of MBC in our study. As with SOM, MBC also had a positive relationship with gravimetric soil moisture (χ2 = 75.17, p < 0.001) (Figure S4), but a negative one with clay content (χ2 = 14.17, p < 0.001) (Figure S5). Non-nitrogen nutrient availability (as described by PC1, and PC2) had a negative relationship with MBC, while total inorganic nitrogen had a positive relationship with MBC. We observed 45.4% higher DOC in irrigated fields (χ2 = 27.15, p < 0.001) compared to dryland and 32.5% higher DOC with medium–high residue retention as compared to none-low residue (χ2 = 14.64, p < 0.001). We also observed a significant positive relation between clay content and DOC (χ2 = 6.65, p = 0.009). The ratio of MBC to organic carbon was 38.2% higher in fertilized fields compared to nonfertilized fields (χ2 = 23.23, p < 0.001), 25.5% higher in fields with cover crops compared to fallow fields (χ2 = 12.70, p < 0.001), and 25.5% higher in fields with medium to high residue retention compared to fields with no or low residue (χ2 = 12.42, p < 0.001). The strongest continuous predictor of the ratio of MBC to organic carbon was clay content, which exhibited a negative relationship between the two (χ2 = 49.24, p < 0.001).
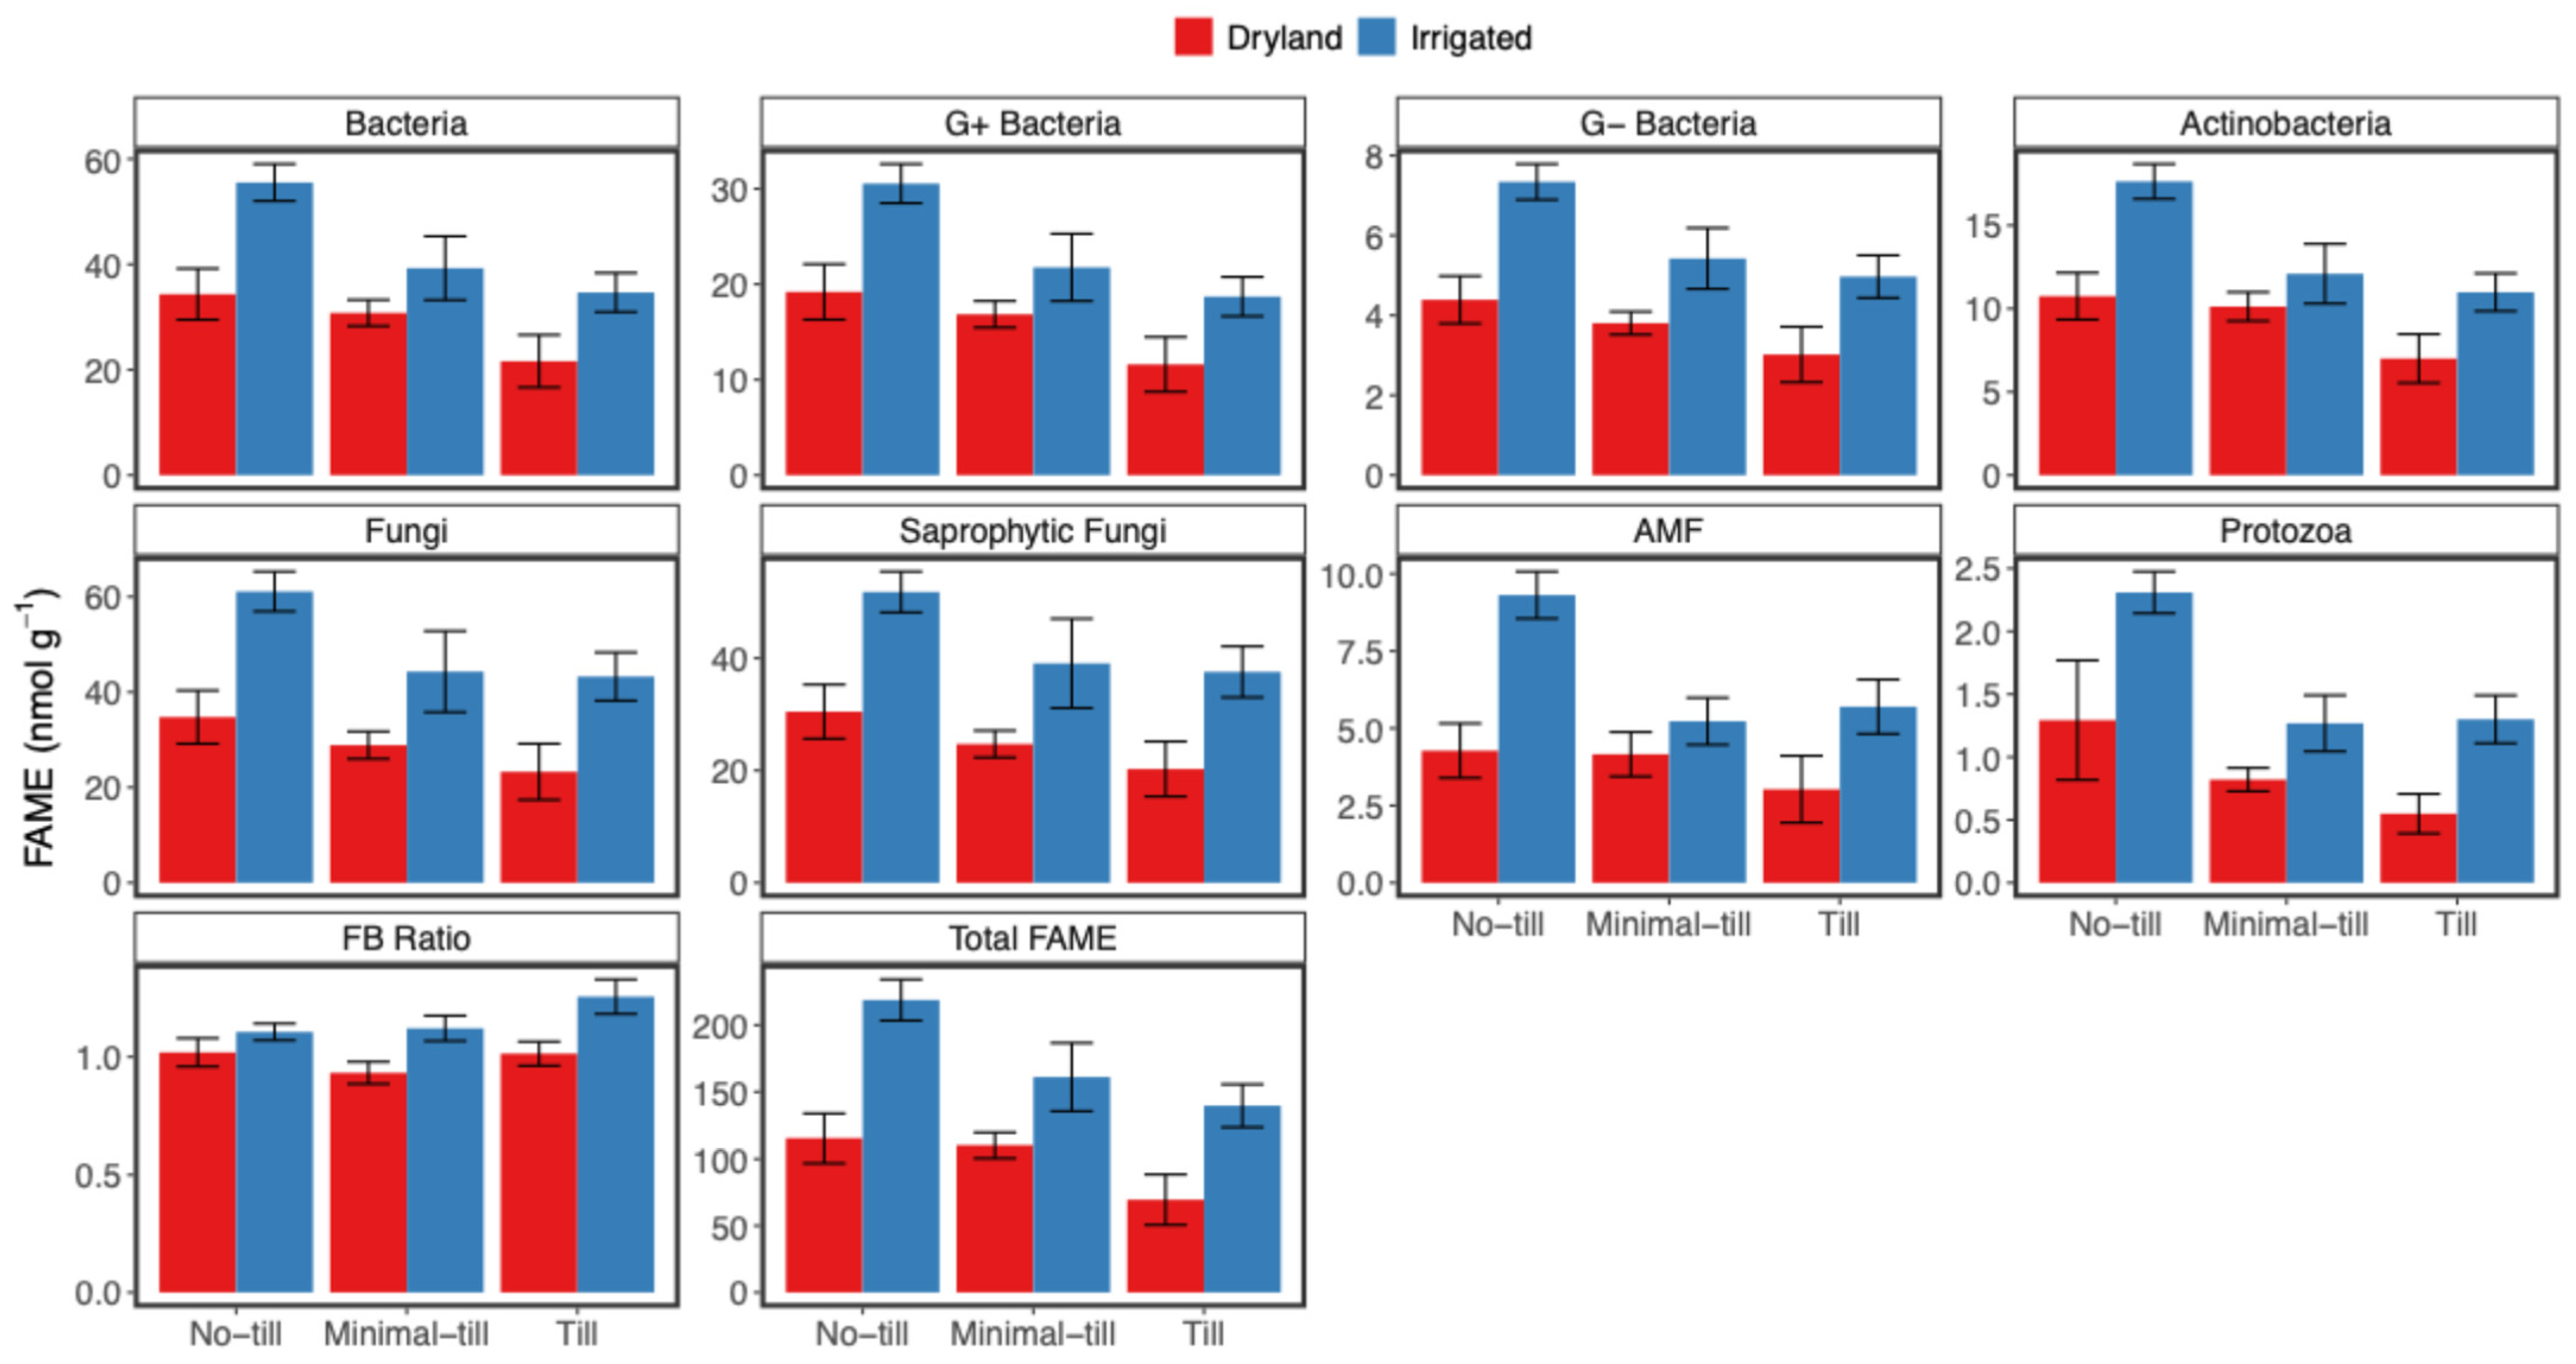
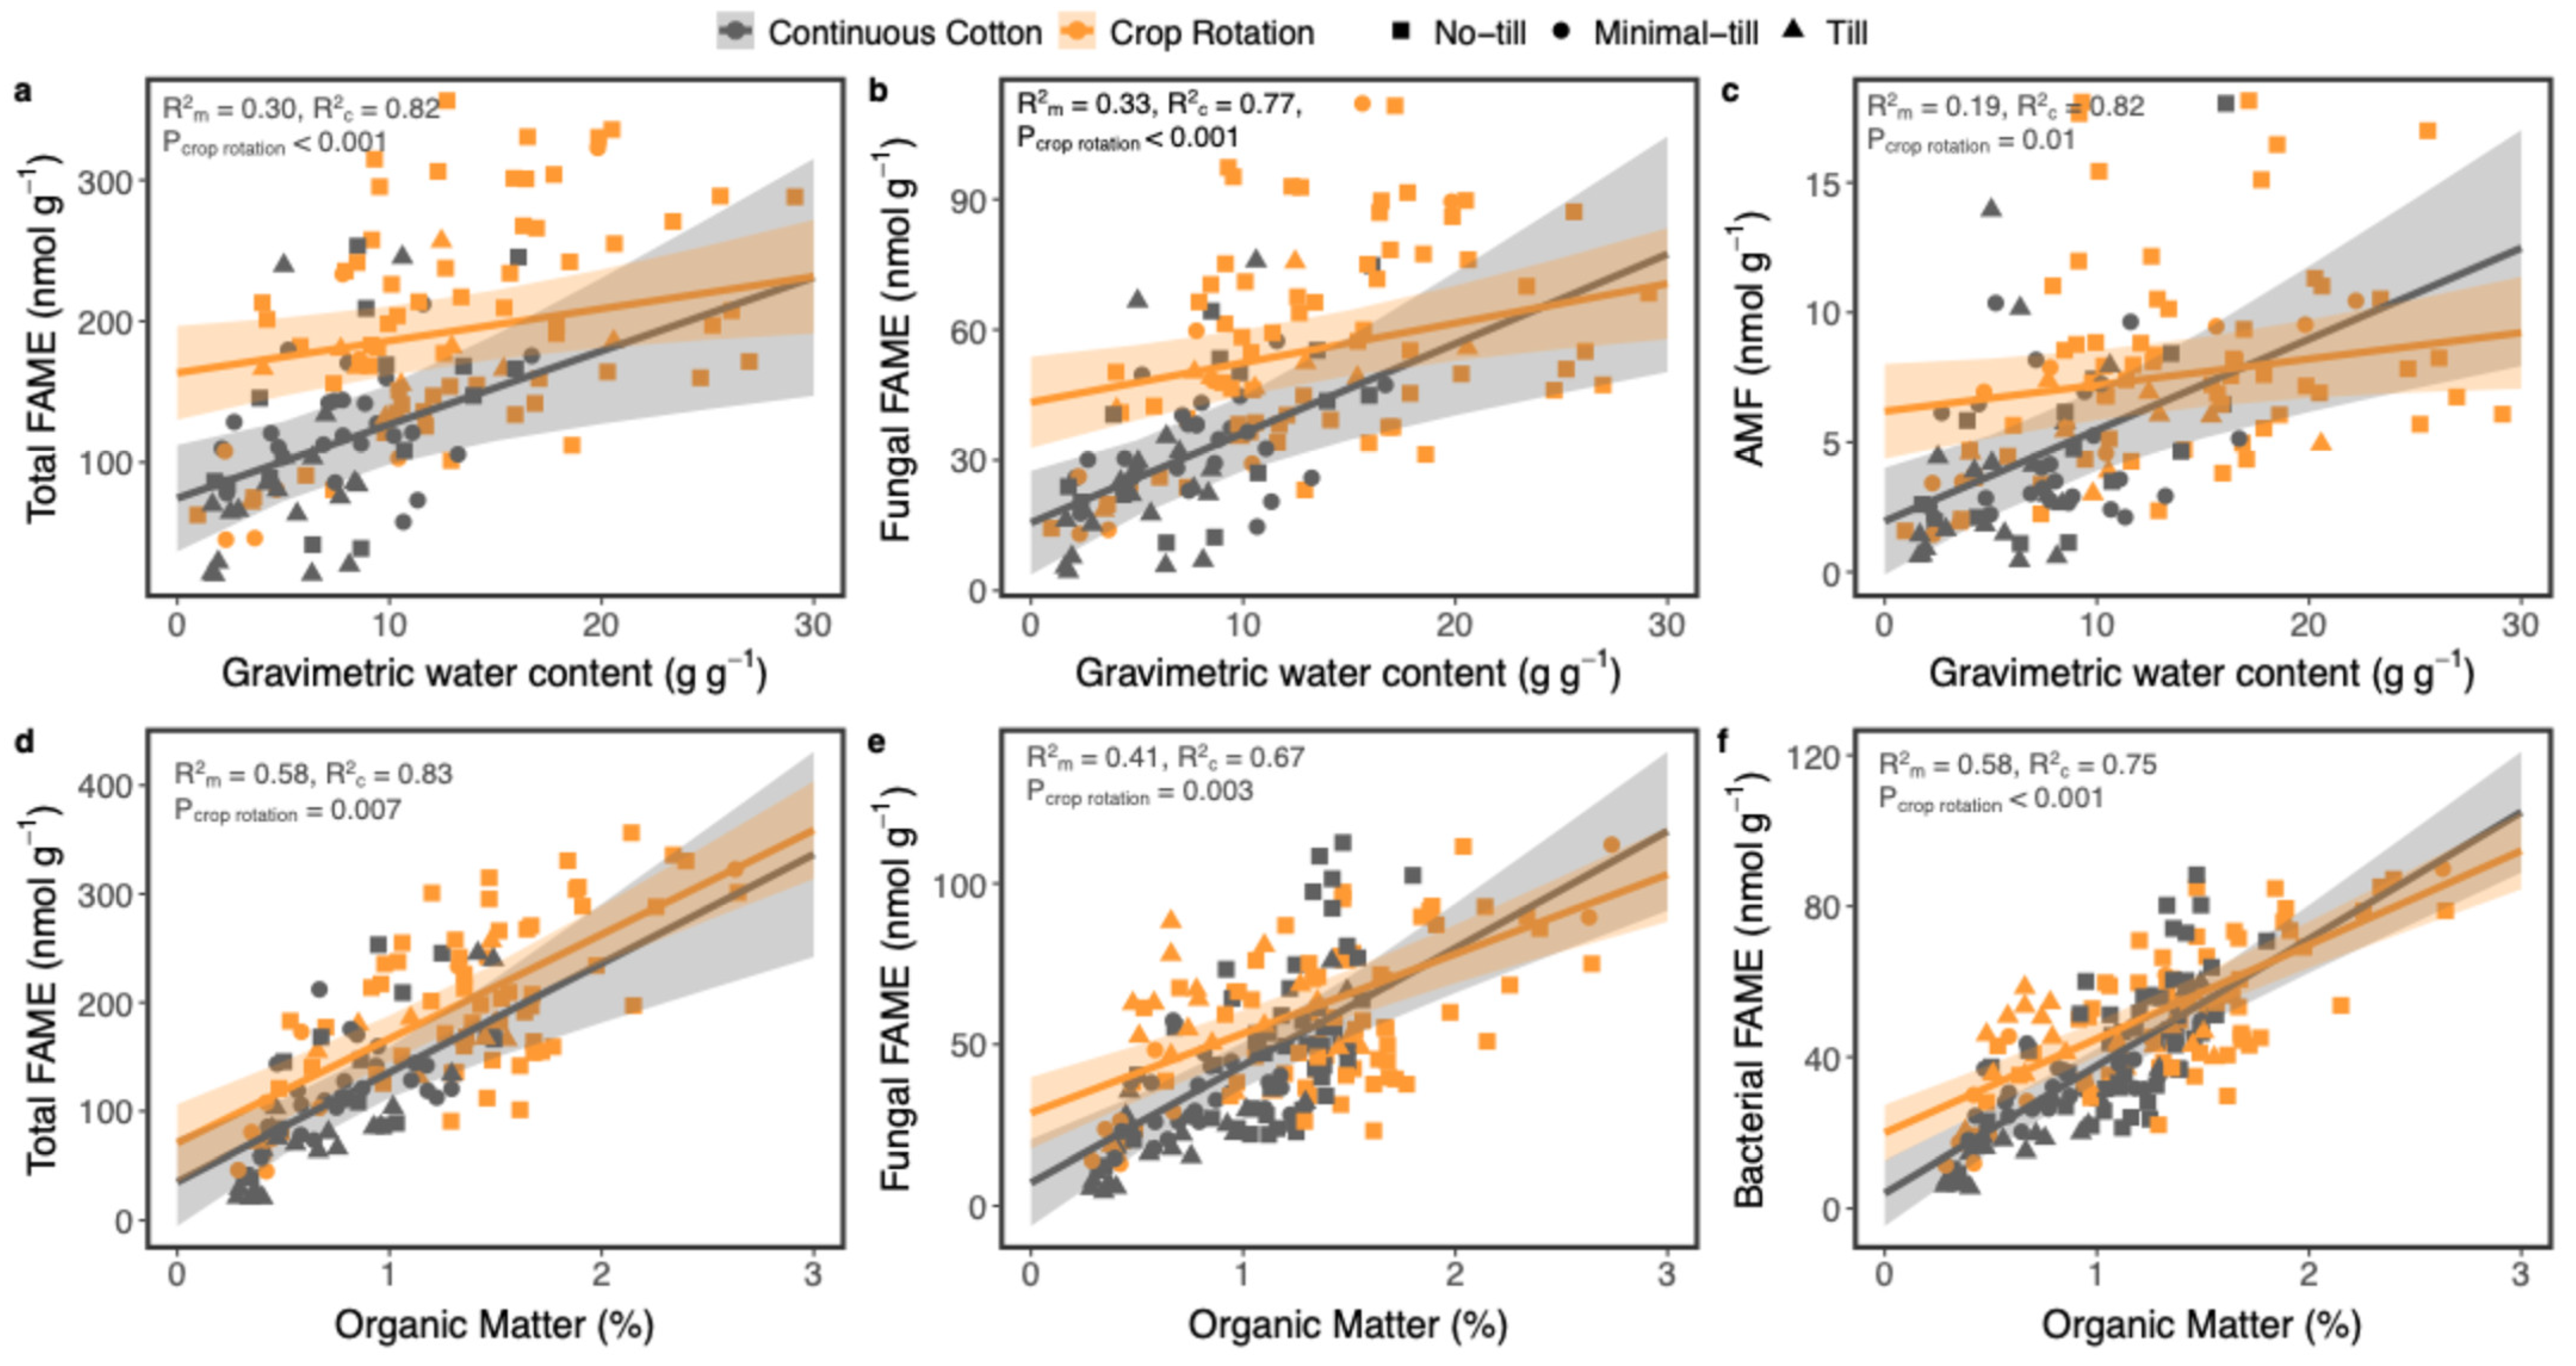
Bacterial FAME marker levels were 32.5% lower in tilled fields compared to no-till fields (χ2 = 13.93, p < 0.001), but there was no difference between no-till and minimal-till fields (Figure 7). Fields that were irrigated had 38.6% higher bacterial FAME marker levels compared to dryland (χ2 = 9.18, p = 0.002; Figure 7), and fields with crop rotation had 33.8% higher bacterial FAME markers compared to fields with continuous cotton (χ2 = 9.31, p = 0.002; Figure 8f). The highest bacterial FAME level was observed in fields with cotton–maize rotation followed by those with cotton–sorghum rotation. Other crop rotation systems did not result in a significant difference in bacterial FAME level compared to continuous cotton. Residue, fertilizer use, and cover crops also had no effects on bacterial FAME marker levels. Regarding continuous predictors, organic matter had a positive relationship with bacterial FAME markers (χ2 = 31.71, p < 0.001) (Figure 8f). Non-nitrogen soil elemental availability (PC2) had a negative relationship with bacterial FAME markers (χ2 = 14.71, p < 0.001).
Fungal abundances were 24.3% lower in tilled fields compared to no-till fields (χ2 = 8.72, p < 0.012), while irrigated fields had 52.4% higher fungal FAME marker levels compared to dryland fields (χ2 = 20.73, p < 0.001) (Figure 7), and fields with crop rotation (χ2 = 8.83, p = 0.003) had 36.8% higher fungal FAME marker levels compared to fields with continuous cotton (Figure 8e). We observed the highest fungal abundances in cotton–maize rotation systems and the lowest in the continuous cotton fields. Regarding continuous predictors, SOM (χ2 = 61.48, p < 0.001) (Figure 8e), gravimetric soil moisture (χ2 = 7.50, p = 0.006) (Figure 8b), and non-nitrogen soil nutrient availability (PC2) (χ2 = 17.71, p < 0.001) all had a significant positive relationship with fungal FAME marker levels. AMF fungal maker levels were reduced in tilled fields compared to no-till fields (35.9%, χ2 = 8.88, p = 0.012), increased in irrigated fields relative to dryland fields (64.4% (χ2 = 30.27, p < 0.0001), and 32.5% higher in fields with crop rotation relative to fields with continuous cotton (χ2 = 4.17, p = 0.041). The AMF abundances, however, did not differ with the types of crops included in the rotation system.
Similarly, total FAME biomass (bacteria, fungi, and protists) was lower in tilled fields (9.5%) compared to no-till fields (χ2 = 8.78, p = 0.012) (Figure 7), but there was no significance between no-till and minimal-till fields. Total FAME biomass was higher in irrigated fields relative to dryland fields (81.4%; χ2 = 16.75, p < 0.001) and also higher in fields that rotated crops compared to fields producing only cotton (66.4%; χ2 = 3.91, p = 0.048). The cotton–maize rotated fields had the highest amount of total FAME makers. With respect to continuous predictors of total FAME biomass, there were positive relations with SOM (χ2 = 19.77, p < 0.001; Figure 8d), soil moisture (χ2 = 4.45, p = 0.033; Figure 8a), and non-nitrogen soil nutrient availability (PC2) (χ2 = 22.39, p < 0.001). The FB ratio was higher in tilled soil (χ2 = 7.83, p = 0.019), being 11.0% and 15.2% higher compared to no-till fields and fields with minimal tilling, and 10.7% higher in irrigated fields compared to dryland fields (χ2 = 20.03, p < 0.001) (Figure 7).
The PERMANOVA test showed that irrigation (F = 92.72, p < 0.001), tillage (F = 56.63, p < 0.001), and crop rotation (F = 22.72, p < 0.001) were the most important predictors of abundances of main microbial groups in the soils. Tillage, irrigation, and crop rotation explained 15%, 12%, and 3% variation in abundance of FAME markers among the microbial groups, respectively. Non-metric multidimensional scaling (NMDS) further confirmed the distinct clustering of microbial groups between irrigation and tillage treatment (Figure S6).
Additionally, the variable ranking using the random forest model aligns closely with the trends observed in mixed effect model. Predictors that ranked higher in the random forest model also had stronger significant effects in the mixed-effects model. For example, the random forest model showed that the clay percentage had the strongest effect on GWC. Irrigation, residue, and crop rotation were important management practices that influenced the GWC in soil. The strongest predictors of soil organic matter were clay percentage and gravimetric moisture content. Of the management practices, both tillage and crop rotation were the most important ones that affected soil organic matter content. Similarly, residue, irrigation, and tillage were the major predictors of dissolved organic matter. MBC was strongly influenced by organic matter content. Additionally, fertilizer, residue, and irrigation practices have strong associations with MBC. The organic matter content was the strongest predictor for FAME biomarker levels (total FAME levels, bacteria, fungi, and AMF). Besides organic matter, clay also influenced total FAME and bacterial FAME levels, but had a weaker effect on fungal FAME levels. Among the management practices, crop rotation, irrigation, and tillage were the major practices influencing the abundances of major microbial groups (Supplemental Figure S7).

4. Discussion

Our study is uniquely important to the agricultural communities not just in our study region but also in other semiarid regions worldwide, since it includes different management practices that are practiced by growers in these regions to address climate impacts and water use issues. We focused on identifying regenerative practices that growers can implement rather than sustainable practices. Regenerative practices are those that are aimed at rebuilding soil health and are closer to mimicking ecosystem services of a more natural ecosystem, and as such, adopts a more holistic worldview compared to sustainable practices, which are considered to be anthropocentric and focused on slowing or preventing further damage to an ecosystem [63]. By including a variety of growers and soil management practices, we used a holistic approach to determine which management practices may have a greater influence on soil health indicators that can expand the sustainability of cotton and other crop production in this economically important region over the next several decades. Unlike traditional field experiments, our study included multiple management practices that were specific to soil type, crop, and weather impacts that allowed us to address these issues in a more realistic and complex analysis. Importantly, this study provided a unique insight into the yearly decisions that producers have to make to produce an economically viable crop in response to climatic constraints.

4.1. Effects of Soil Management on Soil Temperature and Moisture

Our study aligns with other studies conducted in semiarid environments that showed that soil moisture increased in no-till fields [64,65]. When soil is tilled, the bulk density decreases as soil aggregates are broken into smaller particles, which disrupts the soil structure and reduces the water holding capacity of soil [66]. The majority of no-till fields had medium to high residue, which could have played a role in keeping moisture in the ground through reduced evaporation [67], but surprisingly, residue retention was not an important predictor in our models. An important result of increased water retention of soils is that it increases the heat capacity of that soil, such that soils are less easily heated or cooled and thus are more thermally stable (i.e., decreased DTR in wetter soils). A more thermally stable environment could enhance the growth and activity of microbes, which, in turn, can promote plant growth, providing positive feedback to soil moisture levels [68].
Unexpectedly, crop rotation was an important predictor of soil moisture. Crop rotation has been shown to decrease evapotranspiration from soils and/or increase the infiltration rate, either of which could result in higher soil moisture [69]. Alternatively, crop rotation has been shown to promote soil aggregate formation and stability [70], which in turn would improve the water holding capacity of soils. This positive effect on soil aggregation was even stronger when crop rotation was combined with other practices, such as no-till and residue retention [70], stressing the importance of implementing different regenerative practices in concert. Indeed, in our study we found that crop rotation increased SOM levels similarly whether the fields were tilled or not. Another way that crop rotation could affect soil moisture is, counterintuitively, through the roots. Each crop exhibits distinct root architectures, with some crops having more fibrous root systems (e.g., maize and wheat), that could increase SOM (via root mortality) and hence increase the water retention of soils compared to soils containing crops with a sparser root architecture, such as cotton. Indeed, we found a higher SOM content in fields subjected to crop rotation versus fields with continuous cotton, and, in particular,, SOM was highest in fields subjected to cotton–maize–cereals rotation or cotton–maize rotation. However, because crop rotation is often carried out in combination with other regenerative practices (e.g., residue retention and no-till), we cannot attribute the higher levels of organic matter to crop rotation only. This suggests that crop rotation along with residue retention and no-till practices should be implemented to enhance the overall water retention of soils, thereby promoting irrigation conservation and more efficient rainwater usage.

4.2. Effects of Soil Management on Nutrient Availability

Nitrogen availability was higher in fields with crop residue, which indicates that the mineralization of crop residue could be an important mechanism to increase nitrogen availability in the soil. In fact, we found that fertilizer addition was a weaker predictor of nitrogen availability than residue retention. For phosphorus, residue retention was not an important predictor. Instead, we observed a decrease in phosphorus availability in tilled fields. Perhaps disturbances to the soil system due to tillage might have decreased bacterial and fungal activities, which are crucial in altering organic phosphorus availability [71]. Furthermore, tillage in dry environments promotes losses of phosphorus through wind erosion and exposes the soil particles, which could increase phosphorus adsorption to the clay mineral surfaces and the precipitation of inorganic phosphorus with calcium, iron, and aluminum [72,73], which may have contributed to the decreased available phosphorus content in the tilled fields. Additionally, the higher soil pH in dry soils promotes the precipitation of inorganic phosphorus and decreases the synthesis of organic phosphorus by reducing microbial activity [74], thereby reducing phosphorus availability. On the other hand, soils retained more phosphorus when employing no-till practices [75]. No-till can increase alkaline phosphatase activity in semi-arid soils [76,77], thereby increasing the release of phosphorus from plant and animal tissues.

4.3. Effects of Soil Management on Soil Organic Matter and Abundances of Main Microbial Groups

Fields that were conventionally tilled had a lower SOM compared to no-till fields. When tillage is used as a soil management tool, the process disturbs soil aggregation, increasing microbial access to SOM, which increases mineralization loss. On the other hand, no-till protects the soil carbon in the soil aggregates from microbial breakdown, thereby increasing soil carbon storage [78]. However, another study from semiarid regions in Canada reported no significant differences in organic carbon levels between no-till and conventional tillage practices after 4 years of no-till treatment [79], potentially because SOM change is a slow process which takes a longer period to attain a noticeable change, especially in cooler climates where microbial activity is substantially reduced over much of the year as compared to semiarid environments. In the same study, however, residue retention increased the organic carbon content, which is in line with our findings.
No-till fields had the highest MBC levels compared to fields with minimal-till and conventional tillage in a cotton–corn rotational system, a finding consistent with [80]. Higher levels of MBC might be the result of enhanced microbial growth resulting from either an improved soil microhabitat, such as moisture availability, or increased substrate availability, along with a reduced destruction of fungal mycelium. We also found a significant increase in bacterial, fungal and total FAME biomarkers in fields with no-till, which is in line with other studies conducted in dry soils [81,82]. Crop residue also had a significant impact on MBC in this study, but did not affect microbial FAME levels. Stegarescu et al. [83] had also found that crop residue increased MBC in diverse ways. They suggested that an increase in MBC with crop residue may result from the increase in habitat from the different types of carbon available to fungi and bacteria in the residue and interactions among the soil microbial communities during decomposition and mineralization. A potential reason that FAME levels did not increase concomitantly with MBC levels is because we only looked at the FAME biomarker level of the main microbial groups (fungi, bacteria, and protists), whereas the chloroform fumigation method used for MBC might have extracted all microbe-derived carbon.
In our study, irrigation increased soil moisture, SOM levels, and bacterial, fungal, and total FAME levels, but not MBC compared to dryland fields. Irrigation in another study from the semiarid climate of Colorado also had higher levels of SOM under no-till due to higher above- ground biomass production [84]. Regarding soil microbial levels, Calderon et al. [85] reported that irrigation only affected fungal abundances but no other microbial groups in wheat-based cropping systems in semiarid Colorado. In our study, we found significant positive effects of irrigation on all the microbial groups, including soil fungi. Perhaps the discrepancy is because the microbial response to irrigation varies and depends on the cropping system [86] or is affected by differences in the amount of energy supplied to microbes through growing roots and crop residues [87] or irrigation-mediated changes in the soil properties such as soil pH, nutrient availability, soil aggregation, and pore distribution in the soil [88,89].
We observed a lower SOM content in the fields with cover crops, but no changes in other soil health indicators, such as MBC and FAME marker levels. This contrasts with studies that showed that cover crops increase soil organic carbon [18,89]. Perhaps because cover crops can maintain a more active microbial community even without affecting microbial biomass) due to an increase in readily available carbon in the form of root exudates [90], the lower SOM could be the result of increased microbial decomposition. Additionally, there is a threshold of cover crop residue required to build organic matter [91], and in semiarid regions, this threshold may not always be met. Crop rotation was an important predictor of soil carbon and total microbial and bacterial FAME levels. In our analysis, crop rotation increased the SOM content and the abundances of the main microbial groups. The choice of crop in the rotation system may play a crucial role for carbon sequestration. Different crops have different aboveground biomass and root structures, which in turn affect the soil carbon input in the soils [92]. Usually, including a high biomass producing crop in the cropping system improves carbon sequestration, and hence soil carbon storage. For example, Dold et al. [93] compared soil carbon levels in corn and soybean fields and observed higher carbon sequestration in the corn season, especially during low soil moisture and high temperature conditions, mainly because of increased carbon flux entering the soil through increased biomass during the corn season and low carbon input from the subsequent crop in the rotation. Most of the fields included in this study had corn–cotton and sorghum–cotton rotations, with both corn and sorghum being high-residue crops, and thus the increased carbon input might have contributed to the increased SOM as compared to the continuous cropping system or cotton being the cash crop in a given year. Similarly, crop rotation has been associated with relatively higher microbial abundance [94], perhaps because different crops may be able to provide different levels and varieties of carbon and nutrients and habitats including carbon through root exudates. As a result, the diversified crop residue could create more favorable substrates and environmental conditions for soil microorganisms [95].

4.4. The Significance of Soil Texture on Soil Health

Soil texture is an important soil characteristic influencing soil health in this study. Clay content from the fields used in this study influenced both abiotic and biotic dynamics in the associated field: clay amounts were positively correlated with soil moisture and SOM content and displayed a weak but significant negative correlation with MBC. Clay particles have a larger surface area and smaller pore spaces, which increases the water content of the soil [96]. Similarly, clay soil has physical and chemical properties that hinder microbial access to SOM (i.e., protect organic matter through hydrogen bonding), thereby limiting how much energy microbes can receive through decomposition [97]. Hence, soils with a higher clay percentage could have a lower microbial biomass.

4.5. Limitation and Future Suggestions

A weakness of our study is that it is an observational study, not a controlled experiment. Hence, we cannot infer causal links between management practices and soil health, which is why we describe it in terms of patterns in the data. Additionally, more predictors should have been included that could have affected the studied properties. This includes the type of fertilizer, pesticides, and irrigation, and at what rates these are applied, but also the duration of each practice (e.g., how long no-till practices have been employed). We suggest that future studies include these additional predictors, and thus also should add many more independent observations across the different practices to increase statistical power. Because crop rotation unexpectedly stood out as one of the most important predictors, we suggest that future studies investigate the link between crop root traits and microbial abundance and diversity. Lastly, to gain a more ecological insight and to better tie microbial community structure to function, we also suggest using an integrated multi-omics approach to examine the microbial communities.

5. Conclusions

While the field management practices and crop types grown by the citizen science producers varied, the soil management practices which enhanced overall soil health across this semi-arid region were no-till and crop rotation. For producers that currently have sufficient irrigation levels, using irrigation with no-till and crop rotation to improve soil health may increase sustainability as irrigation capacity decreases and they are able to better use existing rainfall. These practices improved soil moisture, SOM, and microbial abundance, increasing the resiliency of the soil to potential extreme climate events. Therefore, incorporating these practices into the cropping system might benefit growers in West Texas and other semiarid regions to mitigate the adverse consequences of climate change and maintain cotton production.

Supplementary Materials

The following supporting information can be downloaded at: https://www.mdpi.com/article/10.3390/soilsystems8040108/s1, Figure S1: Relation between volumetric water content (VWC) and daily temperature range (DTR) along irrigation practices at 0 cm and 15 cm soil depth; Figure S2: Relationship between (a) Total nitrogen and soil organic matter content across the management practices, crop residue and fertilization (b) total phosphorus and organic matter content across management practices, tillage and irrigation; Figure S3: Principal component analysis (PCA) biplot showing the availability of different elemental nutrients; Figure S4: Relationship between microbial biomass carbon estimated using chloroform fumigation extraction technique and soil moisture content for agricultural systems across tillage and residue management practices; Figure S5: Relative abundance of main microbial groups estimated through FAME analysis across irrigation and tillage management; Figure S6: Non-metric multidimensional scaling (NMDS) ordination plot showing abundances of different microbial FAME levels; Figure S7: Relative importance of predictors for (a) GWC, (b) OM, (c) DOC, (d) MBC, (e) total FAME, (f) Bacterial FAME, (g) Fungal Fame, and (h) AMF FAME measured using random forest model.

Author Contributions

Conceptualization, J.C.Z. and N.v.G.; Data curation, T.A.H., P.D., T.O.O., R.K.S. and N.v.G.; Formal analysis, P.D. and N.v.G.; Funding acquisition, J.C.Z. and N.v.G.; Investigation, T.A.H., P.D., T.O.O., R.K.S. and N.v.G.; Methodology, T.A.H., P.D., T.O.O., R.K.S., J.C.Z. and N.v.G.; Project administration, T.A.H., P.D., T.O.O., R.K.S. and N.v.G.; Resources, J.C.Z. and N.v.G.; Software, P.D. and N.v.G.; Supervision, T.A.H., J.C.Z. and N.v.G.; Validation, T.A.H., J.C.Z. and N.v.G.; Visualization, P.D. and N.v.G.; Writing—original draft, T.A.H., P.D., T.O.O., R.K.S., J.C.Z. and N.v.G.; Writing—review and editing, T.A.H., P.D., T.O.O., R.K.S., J.C.Z. and N.v.G. All authors have read and agreed to the published version of the manuscript.

Funding

This study was funded by Cotton Incorporated (#17-042) and by the James “Buddy” Davidson Foundation.

Institutional Review Board Statement

Not applicable.

Informed Consent Statement

Not applicable.

Data Availability Statement

All data and codes used for the data analysis of this study can be accessed here (https://github.com/ppawand/Citizen_Science, accessed on 9 October 2024).

Acknowledgments

We thank Verónica Acosta-Martínez for her support by providing permission to perform the FAME analysis in her lab at the USDA-ARS (Lubbock, TX) and Kater Hake for providing us with constructive suggestions and support. We are also thankful to all the growers who participated in and contributed to this study.

Conflicts of Interest

The authors declare that they do not have any competing interests.

References

  1. Gaur, M.K.; Squires, V.R. Climate Variability Impacts on Land Use and Livelihoods in Drylands; Springer International Publishing: New York, NY, USA, 2017; 348p. [Google Scholar] [CrossRef]
  2. IPCC. Summary for Policymakers. In Climate Change 2023: Synthesis Report. A Report of the Intergovernmental Panel on Climate Change. Contribution of Working Groups I, II and III to the Sixth Assessment Report of the Intergovernmental Panel on Climate Change; Lee, H., Romero, J., Eds.; IPCC: Geneva, Switzerland, 2023; pp. 1–34. [Google Scholar]
  3. Mauget, S.A.; Adhikari, P.; Leiker, G.; Baumhardt, R.L.; Thorp, K.R.; Ale, S. Modeling the effects of management and elevation on West Texas dryland cotton production. Agric. For. Meteorol. 2017, 247, 385–398. [Google Scholar] [CrossRef]
  4. Jones, J.B. Agronomic Handbook: Management of Crops, Soils, and Their Fertility; CRC Press: Boca Raton, FL, USA, 2003. [Google Scholar]
  5. Terrell, B.L.; Johnson, P.N.; Segarra, E. Ogallala aquifer depletion: Economic impact on the Texas high plains. Water Policy 2002, 4, 33–46. [Google Scholar] [CrossRef]
  6. Fernández Cirelli, A.; Arumí, J.L.; Rivera, D.; Boochs, P.W. Environmental Effects of Irrigation in Arid and Semi-Arid Regions. Chil. J. Agric. Res. 2009, 69, 27–40. [Google Scholar] [CrossRef]
  7. Basso, B.; Kendall, A.D.; Hyndman, D.W. The future of agriculture over the Ogallala Aquifer: Solutions to grow crops more efficiently with limited water. Earths Future 2013, 1, 39–41. [Google Scholar] [CrossRef]
  8. Schreefel, L.; Schulte, R.P.O.; De Boer, I.J.M.; Schrijver, A.P.; van Zanten, H.H.E. Regenerative agriculture-the soil is the base. Glob. Food Secur. 2020, 26, 100404. [Google Scholar] [CrossRef]
  9. Luján, S.R.; Martínez-Mena, M.; Cuéllar, P.M.; de Vente, J. Restoring soil quality of woody agroecosystems in Mediterranean drylands through regenerative agriculture. Agric. Ecosyst. Environ. 2020, 306, 107191. [Google Scholar] [CrossRef]
  10. Khangura, R.; Ferris, D.; Wagg, C.; Bowyer, J. Regenerative Agriculture—A Literature Review on the Practices and Mechanisms Used to Improve Soil Health. Sustainability 2023, 15, 2338. [Google Scholar] [CrossRef]
  11. Van Bruggen, A.H.C.; Semenov, A.M. In search of biological indicators for soil health and disease suppression. Appl. Soil. Ecol. 2000, 15, 13–24. [Google Scholar] [CrossRef]
  12. Schloter, M.; Dilly, O.; Munch, J.C. Indicators for evaluating soil quality. Ecosyst. Environ. 2003, 98, 255–262. [Google Scholar] [CrossRef]
  13. Bünemann, E.K.; Bongiorno, G.; Bai, Z.; Creamer, R.E.; Deyn, G.D.; de Goede, R.; Fleskens, L.; Geissen, V.; Kuyeper, T.W.; Mäder, P.; et al. Soil quality—A critical review. Soil Biol. Biochem. 2018, 120, 105–125. [Google Scholar] [CrossRef]
  14. Lehmann, J.; Bossio, D.A.; Kögel-Knabner, I.; Rillig, M.C. The concept and future prospects of soil health. Nat. Rev. Earth Environ. 2020, 1, 544–553. [Google Scholar] [CrossRef] [PubMed]
  15. Williams, H.; Colombi, T.; Keller, T. The influence of soil management on soil health: An on-farm study in southern Sweden. Geoderma 2020, 360, 114010. [Google Scholar] [CrossRef]
  16. Hussain, S.; Hussain, S.; Guo, R.; Sarwar, M.; Ren, X.; Krstic, D.; Aslam, Z.; Zulifqar, U.; Rauf, A.; Hano, C.; et al. Carbon sequestration to avoid soil degradation: A review on the role of conservation tillage. Plants 2021, 10, 2001. [Google Scholar] [CrossRef] [PubMed]
  17. Mikha, M.M.; Rice, C.W. Tillage and Manure Effects on Soil and Aggregate-Associated Carbon and Nitrogen. Soil Sci. Soc. Am. J. 2004, 68, 809–816. [Google Scholar] [CrossRef]
  18. Thapa, V.R.; Ghimire, R.; Acosta-Martínez, V.; Marsalis, M.A.; Schipanski, M.E. Cover crop biomass and species composition affect soil microbial community structure and enzyme activities in semiarid cropping systems. Appl. Soil Ecol. 2021, 157, 103735. [Google Scholar] [CrossRef]
  19. Wood, S.A.; Bowman, M. Large-scale farmer-led experiment demonstrates positive impact of cover crops on multiple soil health indicators. Nat. Food 2021, 2, 97–103. [Google Scholar] [CrossRef]
  20. Romero-Salas, E.A.; Navarro-Noya, Y.E.; Luna-Guido, M.; Verhulst, N.; Crossa, J.; Govaerts, B.; Dendooven, L. Changes in the bacterial community structure in soil under conventional and conservation practices throughout a complete maize (Zea mays L.) crop cycle. Appl. Soil Ecol. 2021, 157, 103733. [Google Scholar] [CrossRef]
  21. Possinger, A.R.; Byrne, L.B.; Breen, N.E. Effect of buckwheat (Fagopyrum esculentum) on soil-phosphorus availability and organic acids. J. Plant Nutr. Soil Sci. 2013, 176, 16–18. [Google Scholar] [CrossRef]
  22. Blanco-Canqui, H.; Shaver, T.M.; Lindquist, J.L.; Shapiro, C.A.; Elmore, R.W.; Francis, C.A.; Hergert, G.W. Cover Crops and Ecosystem Services: Insights from Studies in Temperate Soils. Agron. J. 2015, 107, 2449–2474. [Google Scholar] [CrossRef]
  23. Miner, G.L.; Delgado, J.A.; Ippolito, J.A.; Stewart, C.E. Soil health management practices and crop productivity. Agric. Environ. Lett. 2020, 5, e20023. [Google Scholar] [CrossRef]
  24. Krstić, D.; Vujić, S.; Jaćimović, G.; D’Ottavio, P.; Radanović, Z.; Erić, P.; Ćupina, B. The Effect of Cover Crops on Soil Water Balance in Rain-Fed Conditions. J. Atmos. 2018, 9, 492. [Google Scholar] [CrossRef]
  25. Hao, X.; Abou, N.M.; Steenwerth, K.L.; Nocco, M.A.; Basset, C.; Daccache, A. Are there universal soil responses to cover cropping? A systematic review. Sci. Total Environ. 2023, 861, 160600. [Google Scholar] [CrossRef]
  26. Burke, J.A.; Lewis, K.L.; Delaune, P.B.; Cobos, C.J.; Keeling, J.W. Soil Water Dynamics and Cotton Production Following Cover Crop Use in a Semi-Arid Ecoregion. Agronomy 2022, 12, 1306. [Google Scholar] [CrossRef]
  27. Acree, A.; Fultz, L.M.; Lofton, J.; Haggard, B. Soil biochemical and microbial response to wheat and corn stubble residue management in Louisiana. Agrosyst. Geosci. Environ. 2020, 3, e20004. [Google Scholar] [CrossRef]
  28. Jat, H.S.; Datta, A.; Choudhary, M.; Yadav, A.K.; Choudhary, V.; Sharma, P.C.; Gathala, M.K.; Jat, M.L.; McDonald, A. Effects of tillage, crop establishment and diversification on soil organic carbon, aggregation, aggregate associated carbon and productivity in cereal systems of semi-arid Northwest India. Soil Till Res. 2019, 190, 128–138. [Google Scholar] [CrossRef]
  29. Busari, M.A.; Kukal, S.S.; Kaur, A.; Bhatt, R.; Dulazi, A.A. Conservation tillage impacts on soil, crop and the environment. Int. Soil Water Conserv. Res. 2015, 3, 119–129. [Google Scholar] [CrossRef]
  30. Khan, W.A.; Wang, G. Conservation Tillage: A Sustainable Approach for Carbon Sequestration and Soil Preservation. A Review. J. Agric. Sustain. Environ. 2023, 2, 1–24. [Google Scholar] [CrossRef]
  31. Brevik, E.C. The potential impact of climate change on soil properties and processes and corresponding influence on food security. Agriculture 2013, 3, 398–417. [Google Scholar] [CrossRef]
  32. King, A.E.; Blesh, J. Crop rotations for increased soil carbon: Perenniality as a guiding principle. Ecol. Appl. 2018, 28, 249–261. [Google Scholar] [CrossRef]
  33. Fu, B.; Chen, L.; Huang, H.; Qu, P. Impacts of crop residues on soil health: A review. Environ. Pollut. Bioavailab. 2021, 33, 164–173. [Google Scholar] [CrossRef]
  34. Kim, N.; Zabaloy, M.C.; Guan, K.; Villamil, M.B. Do cover crops benefit soil microbiome? A meta-analysis of current research. Soil Biol. Biochem. 2020, 142, 107701. [Google Scholar] [CrossRef]
  35. Garland, G.; Edlinger, A.; Banerjee, S.; Degrune, F.; García-Palacios, P.; Pescador, D.S.; Herzog, C.; Romdhane, S.; Saghai, A.; Spor, A.; et al. Crop cover is more important than rotational diversity for soil multifunctionality and cereal yields in European cropping systems. Nat. Food 2021, 2, 28–37. [Google Scholar] [CrossRef]
  36. Vukicevich, E.; Lowery, T.; Bowen, P.; Úrbez-Torres, J.R. Cover crops to increase soil microbial diversity and mitigate decline in perennial agriculture. A review. Agron. Sustain. Dev. 2016, 36, 1–14. [Google Scholar] [CrossRef]
  37. Srour, A.Y.; Ammar, H.A.; Subedi, A.; Pimentel, M.; Cook, R.L.; Bond, J.; Fakhoury, A.M. Microbial Communities Associated With Long-Term Tillage and Fertility Treatments in a Corn-Soybean Cropping System. Front. Microbiol. 2020, 11, 522658. [Google Scholar] [CrossRef]
  38. Ryan, S.F.; Adamson, N.L.; Aktipis, A.; Andersen, L.K.; Austin, R.; Barnes, L.; Beasley, M.R.; Bedell, K.D.; Briggs, S.; Chapman, B.; et al. The role of citizen science in addressing grand challenges in food and agriculture research. Proc. R. Soc. B 2018, 285, 20181977. [Google Scholar] [CrossRef]
  39. Kyveryga, P.M. On-Farm Research: Experimental Approaches, Analytical Frameworks, Case Studies, and Impact. Agron. J. 2019, 111, 1–3. [Google Scholar] [CrossRef]
  40. Pires, C.B.; Krupek, F.S.; Carmona, G.I.; Ortez, O.A.; Thompson, L.; Quinn, D.J.; Reis, A.F.B.; Werle, R.; Kovács, P.; Singh, M.P.; et al. Perspective of US farmers on collaborative on-farm agronomic research. Agron. J. 2024, 116, 1590–1602. [Google Scholar] [CrossRef]
  41. van de Gevel, J.; van Etten, J.; Deterding, S. Citizen science breathes new life into participatory agricultural research. A review. Agron. Sustain. Dev. 2020, 40, 35. [Google Scholar] [CrossRef]
  42. Heaton, L.; Fullen, M.; Bhattacharyya, R. Critical Analysis of the van Bemmelen Conversion Factor used to Convert Soil Organic Matter Data to Soil Organic Carbon Data: Comparative Analyses in a UK Loamy Sand Soil. Espaço Aberto 2016, 6, 35–44. [Google Scholar] [CrossRef]
  43. Gee, G.W.; Bauder, J.W. Particle Size Analysis by Hydrometer: A Simplified Method for Routine Textural Analysis and a Sensitivity Test of Measurement Parameters. Soil Sci. Soc. Am. J. 1979, 43, 1004–1007. [Google Scholar] [CrossRef]
  44. Vance, E.D.; Brookes, P.C.; Jenkinson, D.S. An extraction method for measuring soil microbial biomass C. Soil Biol. Biochem. 1987, 19, 703–707. [Google Scholar] [CrossRef]
  45. Joergensen, R.G. The fumigation-extraction method to estimate soil microbial biomass: Calibration of the kEC value. Soil Biol. Biochem. 1996, 28, 25–31. [Google Scholar] [CrossRef]
  46. Jones, D.L.; Willett, V.B. Experimental evaluation of methods to quantify dissolved organic nitrogen (DON) and dissolved organic carbon (DOC) in soil. Soil Biol. Biochem. 2006, 38, 991–999. [Google Scholar] [CrossRef]
  47. Zeglin, L.H.; Stursova, M.; Sinsabaugh, R.L.; Collins, S.L. Microbial responses to nitrogen addition in three contrasting grassland ecosystems. Oecologia 2007, 154, 349–359. [Google Scholar] [CrossRef] [PubMed]
  48. van Gestel, N.C.; Dhungana, N.; Tissue, D.T.; Zak, J.C. Seasonal microbial and nutrient responses during a 5-year reduction in the daily temperature range of soil in a Chihuahuan Desert ecosystem. Oecologia 2016, 180, 265–277. [Google Scholar] [CrossRef] [PubMed]
  49. Schutter, M.E.; Dick, R.P. Comparison of Fatty Acid Methyl Ester (FAME) Methods for Characterizing Microbial Communities. Soil Sci. Soc. Am. J. 2000, 64, 1659–1668. [Google Scholar] [CrossRef]
  50. Li, C.; Cano, A.; Acosta-Martinez, V.; Veum, K.S.; Moore-Kucera, J. A comparison between fatty acid methyl ester profiling methods (PLFA and EL-FAME) as soil health indicators. Soil Sci. Soc. Am. J. 2020, 84, 1153–1169. [Google Scholar] [CrossRef]
  51. Frostegard, A.; Baath, E. The use of phospholipid fatty acid analysis to estimate bacterial and fungal biomass in soil. Biol. Fertil. Soils 1996, 22, 59–65. [Google Scholar] [CrossRef]
  52. Olsson, P.A.; Thingstrup, I.; Jakobsen, I.; Baê Aê Th, E. Estimation of the biomass of arbuscular mycorrhizal fungi in a linseed feld. Soil Biol. Biochem. 1999, 31, 1879–1887. [Google Scholar] [CrossRef]
  53. Zelles, L. Phospholipid fatty acid profiles in selected members of soil microbial communities. Chemosphere 1997, 35, 275–294. [Google Scholar] [CrossRef]
  54. R Core Team. R: A Language and Environment for Statistical Computing. R Foundation for STATISTICAL Computing, Vienna, Austria. 2023. Available online: https://www.R-project.org/ (accessed on 9 October 2024).
  55. Bates, D.; Maechler, M.; Bolker, B.; Walker, S. Fitting Linear Mixed-Effects Models Using lme4. J. Stat. Softw. 2015, 67, 1–48. [Google Scholar] [CrossRef]
  56. Powlson, D.S.; Prookes, P.C.; Christensen, B.T. Measurement of soil microbial biomass provides an early indication of changes in total soil organic matter due to straw incorporation. Soil Biol. Biochem. 1987, 19, 159–164. [Google Scholar] [CrossRef]
  57. Anderson, T.H.; Domsch, K.H. Ratio of microbial biomass carbon to total organic carbon in arable soils. Aust. J. Soil Res. 1989, 30, 195–207. [Google Scholar] [CrossRef]
  58. Calcagno, V. glmulti: Model Selection and Multimodel Inference Made Easy. R Package Version 1.0.8. 2020. Available online: https://CRAN.R-project.org/package=glmulti (accessed on 9 October 2024).
  59. Lenth, R. emmeans: Estimated Marginal Means, aka Least-Squares Means. R Package Version 1.8.9. 2023. Available online: https://CRAN.R-project.org/package=emmeans (accessed on 9 October 2024).
  60. Hothorn, T.; Hornik, K.; Zeileis, A. Unbiased Recursive Partitioning: A Conditional Inference Framework. J. Comput. Graph. Stat. 2006, 15, 651–674. [Google Scholar] [CrossRef]
  61. Oksanen, J.; Simpson, G.; Blanchet, F.; Kindt, R.; Legendre, P.; Minchin, P.; O’Hara, R.; Solymos, P.; Stevens, M.; Szoecs, E.; et al. Vegan: Community Ecology Package. R Package Version 2.6-4. 2022. Available online: https://CRAN.R-project.org/package=vegan (accessed on 9 October 2024).
  62. Wickham, H. ggplot2: Elegant Graphics for Data Analysis; Springer: New York, NY, USA, 2016; Available online: https://ggplot2.tidyverse.org (accessed on 9 October 2024)ISBN 978-3-319-24277-4.
  63. Gibbons, L.V. Regenerative—The New Sustainable? Sustainability 2020, 12, 5483. [Google Scholar] [CrossRef]
  64. Blevins, R.L.; Cook, D.; Phillips, S.H.; Phillips, R.E. Influence of No-tillage on Soil Moisture. Agron. J. 1971, 63, 593–596. [Google Scholar] [CrossRef]
  65. Li, J.; Wang, Y.; Guo, Z.; Li, J.; Tian, C.; Hua, D.; Shi, C.; Wang, H.; Han, J.; Xu, Y. Effects of Conservation Tillage on Soil Physicochemical Properties and Crop Yield in an Arid Loess Plateau, China. Sci. Rep. 2020, 10, 4716. [Google Scholar] [CrossRef]
  66. Aziz, I.; Mahmood, T.; Islam, K.R. Effect of long term no-till and conventional tillage practices on soil quality. Soil Till Res. 2013, 131, 28–35. [Google Scholar] [CrossRef]
  67. Lascano, R.J.; Baumhardt, R.L.; Hicks, S.K.; Heilman, J.L. Soil and Plant Water Evaporation from Strip-Tilled Cotton: Measurement and Simulation. Agron. J. 1994, 86, 987–994. [Google Scholar] [CrossRef]
  68. Alexander, L. Climate science: Extreme heat rooted in dry soils. Nat. Geosci. 2011, 4, 12–13. [Google Scholar] [CrossRef]
  69. Yu, T.; Mahe, L.; Li, Y.; Wei, X.; Deng, X.; Zhang, D. Benefits of Crop Rotation on Climate Resilience and Its Prospects in China. Agronomy 2022, 12, 436. [Google Scholar] [CrossRef]
  70. Zheng, F.; Liu, X.; Ding, W.; Song, X.; Li, S.; Wu, X. Positive effects of crop rotation on soil aggregation and associated organic carbon are mainly controlled by climate and initial soil carbon content: A meta-analysis. Agric. Ecosyst. Environ. 2023, 355, 108600. [Google Scholar] [CrossRef]
  71. Fang, S.; Yan, X.; Liao, H. 3D reconstruction and dynamic modeling of root architecture in situ and its application to crop phosphorus research. Plant J. 2009, 60, 1096–1108. [Google Scholar] [CrossRef]
  72. Picone, L.; Zamuner, E.; Berardo, A.; Marino, M. Phosphorus transformations as affected by sampling date, fertilizer rate, and phosphorus uptake in soil under pasture. Nutr. Cycl. Agroecosyst. 2003, 67, 225–232. [Google Scholar] [CrossRef]
  73. de-Bashan, L.E.; Magallon-Servin, P.; Lopez, B.R.; Nannipieri, P. Biological activities affect the dynamic of P in dryland soils. Biol. Fertil. Soils 2021, 58, 105–119. [Google Scholar] [CrossRef]
  74. Nannipieri, P.; Giagnoni, L.; Landi, L.; Renella, G. Role of phosphatase enzymes in soil. In Phosphorus in Action, Biological Processes in Soil Phosphorus Cycling; Bunemann, E.K., Oberson, A., Frossard, E., Eds.; Springer: Berlin, Germany, 2011; pp. 215–241. [Google Scholar]
  75. Xomphoutheb, T.; Jiao, S.; Guo, X.; Mabagala, F.S.; Sui, B.; Wang, H.; Zhao, L.; Zhao, X. The effect of tillage systems on phosphorus distribution and forms in rhizosphere and non-rhizosphere soil under maize (Zea mays L.) in Northeast China. Sci. Rep. 2020, 10, 6574. [Google Scholar] [CrossRef]
  76. Carpenter-Boggs, L.; Stahl, P.D.; Lindstrom, M.J.; Schumacher, T.E. Soil microbial properties under permanent grass, conventional tillage, and no-till management in South Dakota. Soil Till Res. 2003, 71, 15–23. [Google Scholar] [CrossRef]
  77. Acosta-Martínez, V.; Zobeck, T.M.; Gill, T.E.; Kennedy, A.C. Enzyme activities and microbial community structure in semiarid agricultural soils. Biol. Fertil. Soils 2003, 38, 216–227. [Google Scholar] [CrossRef]
  78. Lu, X.; Liao, Y. Effect of tillage practices on net carbon flux and economic parameters from farmland on the Loess Plateau in China. J. Clean. Prod. 2017, 162, 1617–1624. [Google Scholar] [CrossRef]
  79. Malhi, S.S.; Lemke, R.; Wang, Z.H.; Chhabra, B.S. Tillage, nitrogen and crop residue effects on crop yield, nutrient uptake, soil quality, and greenhouse gas emissions. Soil Till Res. 2006, 90, 171–183. [Google Scholar] [CrossRef]
  80. Wright, A.L.; Hons, F.M.; Matocha, J.E. Tillage impacts on microbial biomass and soil carbon and nitrogen dynamics of corn and cotton rotations. Appl. Soil. Ecol. 2005, 29, 85–92. [Google Scholar] [CrossRef]
  81. Kraut-Cohen, J.; Zolti, A.; Shaltiel-Harpaz, L.; Argaman, E.; Rabinovich, R.; Green, S.J.; Minz, D. Effects of tillage practices on soil microbiome and agricultural parameters. Sci. Total Environ. 2020, 705, 135791. [Google Scholar] [CrossRef]
  82. Mathew, R.P.; Feng, Y.; Githinji, L.; Ankumah, R.; Balkom, K.S. Impact of No-tillage and conventional tillage systems on soil microbial communities. Appl. Environ. Soil Sci. 2012, 2012, 548620. [Google Scholar] [CrossRef]
  83. Stegarescu, G.; Escuer-Gatius, J.; Soosaar, K.; Kauer, K.; Tõnutare, T.; Astover, A.; Reintam, E. Effect of Crop Residue Decomposition on Soil Aggregate Stability. Agriculture 2020, 10, 527. [Google Scholar] [CrossRef]
  84. Núñez, A.; Cotrufo, M.F.; Schipanski, M. Irrigation effects on the formation of soil organic matter from aboveground plant litter inputs in semiarid agricultural systems. Geoderma 2022, 416, 115804. [Google Scholar] [CrossRef]
  85. Calderon, F.J.; Nielsen, D.; Acosta-Mart’inez, V.; Vigil, M.F.; Lyon, D. Cover Crop and Irrigation Effects on Soil Microbial Communities and Enzymes in Semiarid Agroecosystems of the Central Great Plains of North America. Pedosphere 2016, 26, 192–205. [Google Scholar] [CrossRef]
  86. Larkin, R.P.; Honeycutt, C.W.; Griffin, T.S.; Olanya, O.M.; Halloran, J.M.; He, Z. Effects of different potato cropping system approaches and water management on soilborne diseases and soil microbial communities. Phytopathology 2011, 101, 58–67. [Google Scholar] [CrossRef]
  87. Zhou, X.; Guo, Z.; Chen, C.; Jia, Z. Soil microbial community structure and diversity are largely influenced by soil pH and nutrient quality in 78-year-old tree plantations. Biogeosciences 2017, 14, 2101–2111. [Google Scholar] [CrossRef]
  88. Philippot, L.; Chenu, C.; Kappler, A.; Rilling, M.C.; Fierer, N. The interplay between microbial communities and soil properties. Nat. Rev. Microbiol. 2024, 22, 226–239. [Google Scholar] [CrossRef]
  89. Ding, G.; Liu, X.; Herbert, S.; Novak, J.; Amarasiriwardena, D.; Xing, B. Effect of cover crop management on soil organic matter. Geoderma 2006, 130, 229–239. [Google Scholar] [CrossRef]
  90. Strickland, M.S.; Thomason, W.E.; Avera, B.; Franklin, J.; Minick, K.; Yamada, S.; Badgley, B.D. Short-Term Effects of Cover Crops on Soil Microbial Characteristics and Biogeochemical Processes across Actively Managed Farms. Agrosyst. Geosci. Environ. 2019, 2, 1–9. [Google Scholar] [CrossRef]
  91. Naugle, D.E.; Allred, B.W.; Jones, M.O.; Twidwell, D.; Maestas, J.D. Coproducing Science to Inform Working Lands: The Next Frontier in Nature Conservation. Bioscience 2020, 70, 90–96. [Google Scholar] [CrossRef] [PubMed]
  92. Wang, H.; Sheng, Y.; Jiang, W.; Pan, F.; Wang, M.; Chen, X.; Shen, X.; Yin, C.; Mao, Z. The effects of crop rotation combinations on the soil quality of old apple orchard. Hortic. Plant J. 2022, 8, 1–10. [Google Scholar] [CrossRef]
  93. Dold, C.; Büyükcangaz, H.; Rondinelli, W.; Prueger, J.H.; Sauer, T.J.; Hatfield, J.L. Long-term carbon uptake of agro-ecosystems in the Midwest. Agric. For. Meteorol. 2017, 232, 128–140. [Google Scholar] [CrossRef]
  94. Venter, Z.S.; Jacobs, K.; Hawkins, H.J. The impact of crop rotation on soil microbial diversity: A meta-analysis. Pedobiologia 2016, 59, 215–223. [Google Scholar] [CrossRef]
  95. Town, J.R.; Gregorich, E.G.; Drury, C.F.; Lemke, R.L.; Phillips, L.A.; Helgason, B.L. Diverse crop rotations influence the bacterial and fungal communities in root, rhizosphere and soil and impact soil microbial processes. Appl. Soil Ecol. 2022, 169, 104241. [Google Scholar] [CrossRef]
  96. Aylmore, L.A.G.; Quirk, J.P. The micropore size distributions of clay mineral systems. J. Soil Sci. 1967, 18, 1–17. [Google Scholar] [CrossRef]
  97. Lützow, M.V.; Kögel-Knabner, I.; Ekschmitt, K.; Matzner, E.; Guggenberger, G.; Marschner, B.; Flessa, H. Stabilization of organic matter in temperate soils: Mechanisms and their relevance under different soil conditions—A review. Eur. J. Soil Sci. 2006, 57, 426–445. [Google Scholar] [CrossRef]
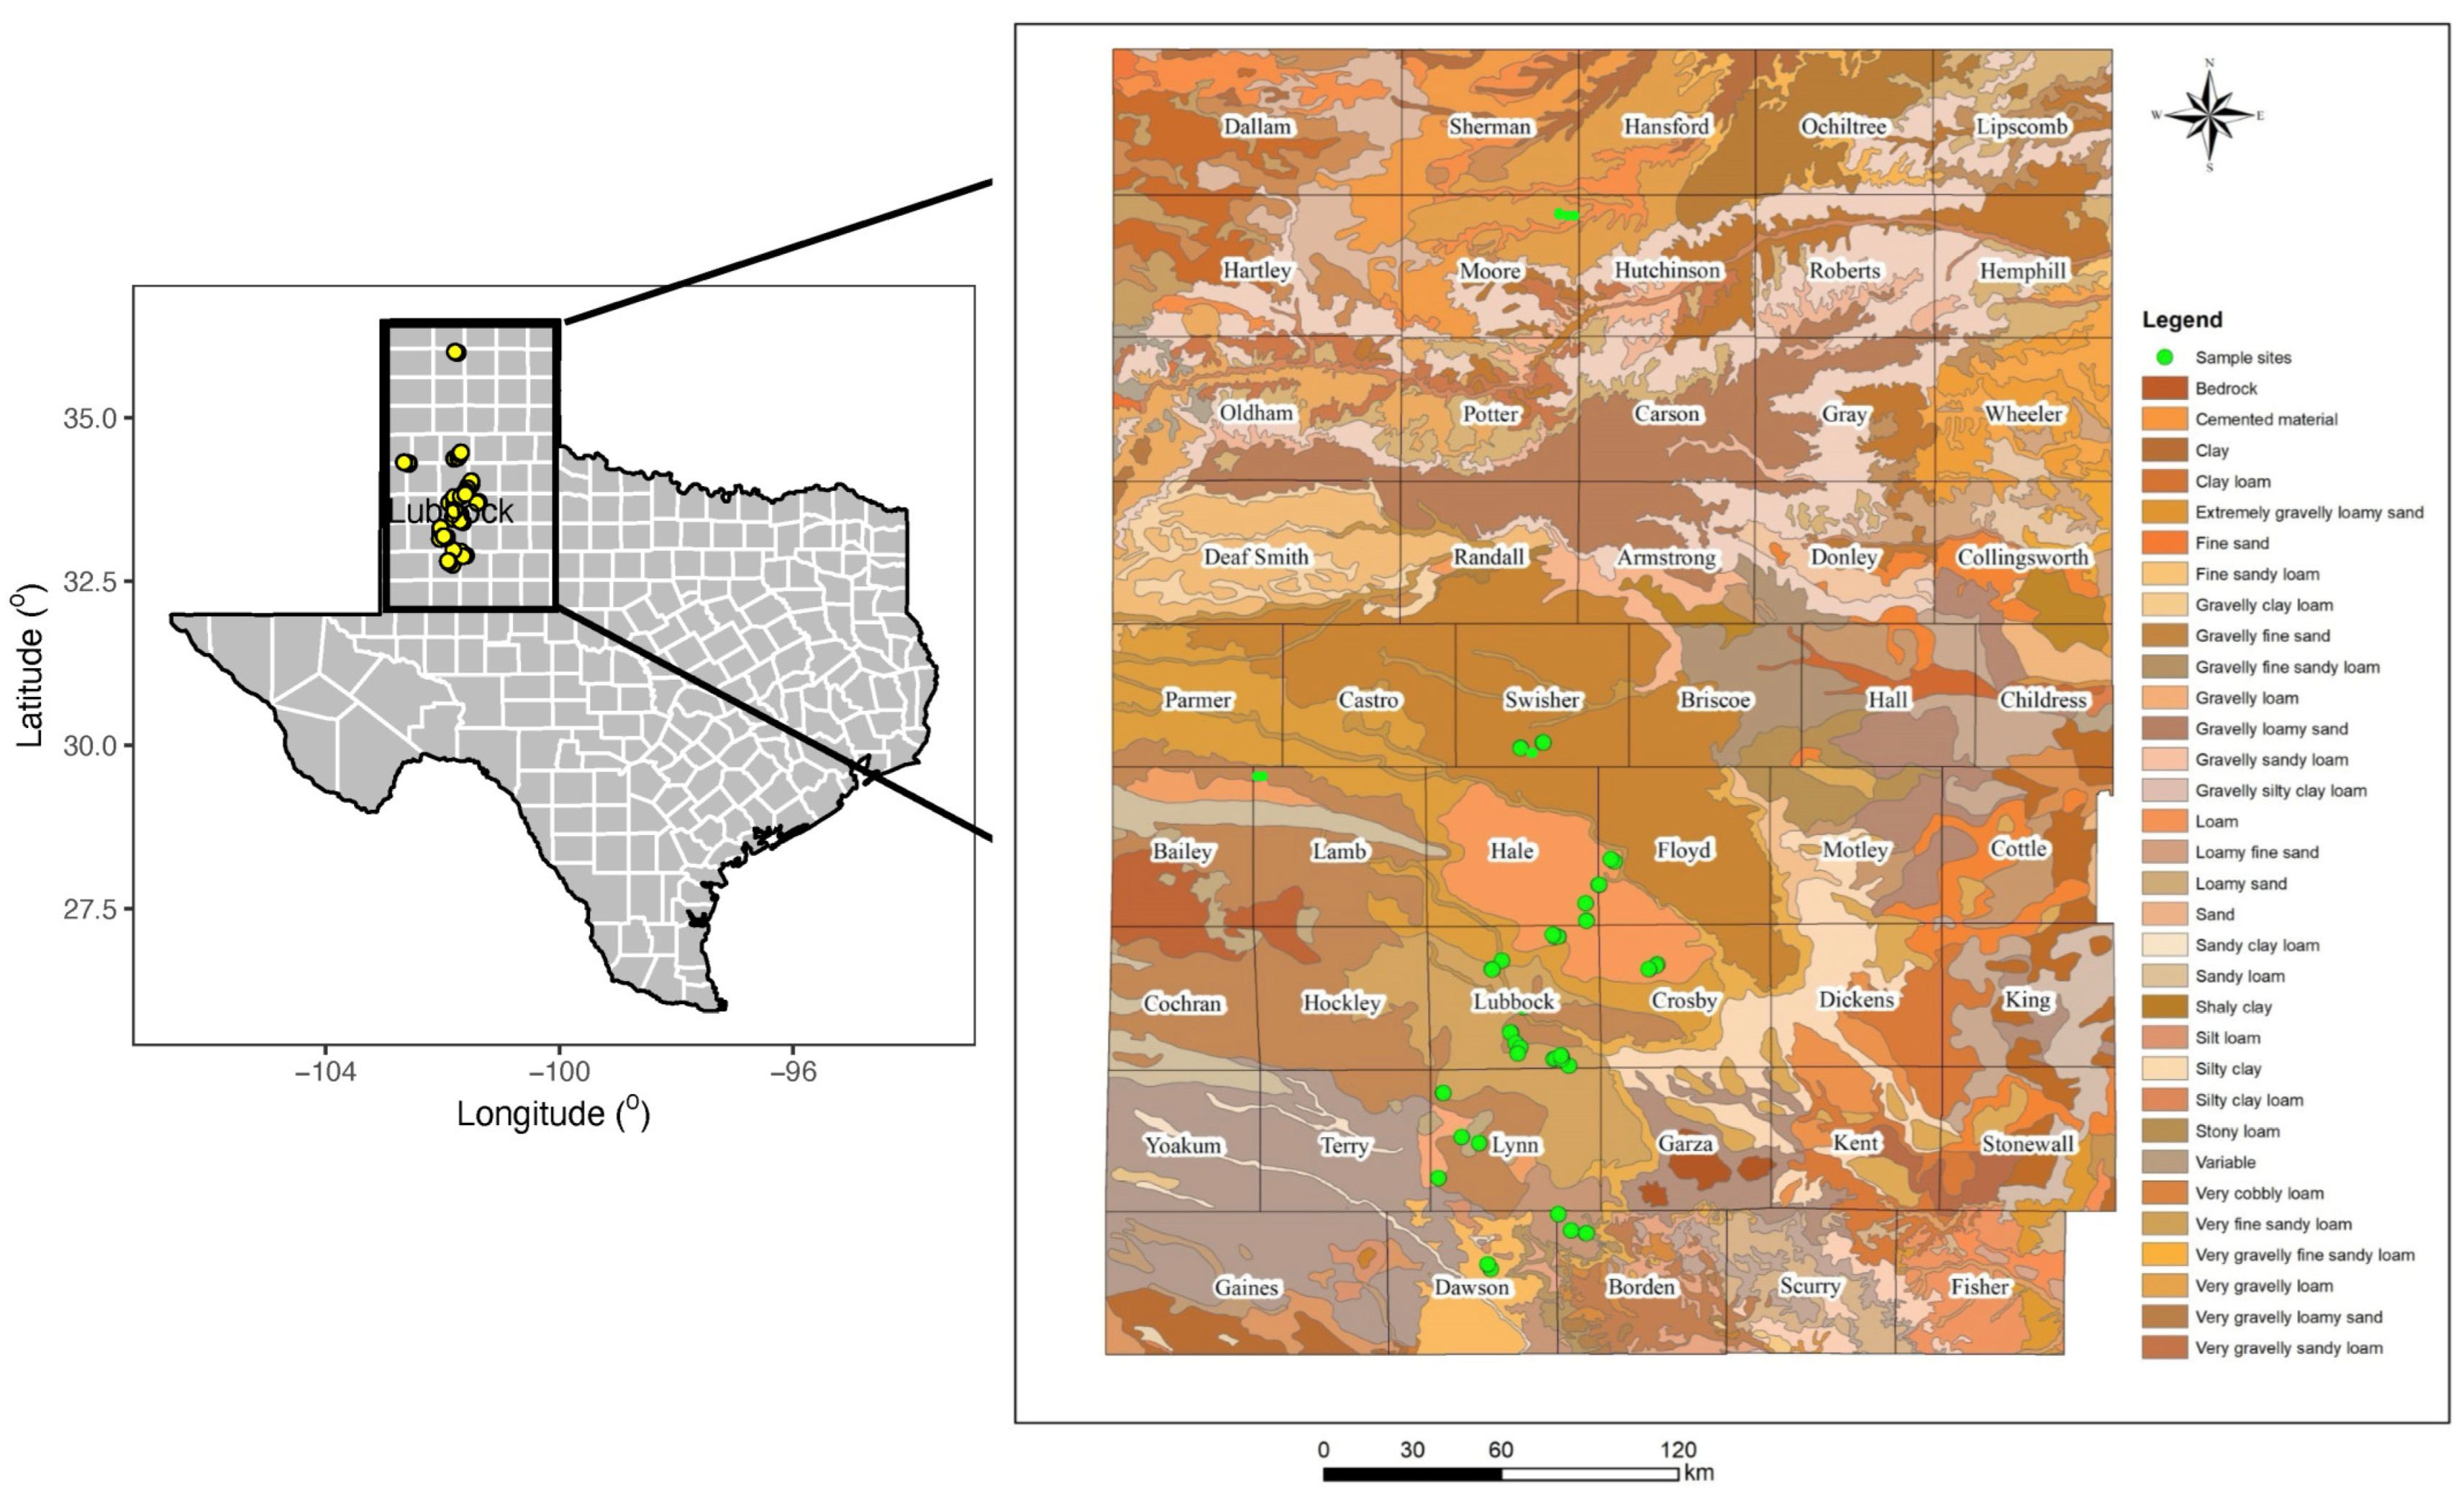
Figure 1. Location and inherent soil properties of the cotton fields used in this on-farm study. The fields belong to 20 different cotton growers within 100 miles of Lubbock County, Texas. In total, 85 fields were included in this project which were operating under different soil management practices.
Soilsystems 08 00108 g001
Figure 2. Management practices across all fields in this study. The value indicates the number of fields within each category. The X and checkmarks are binary ways of indicating whether a specific practice is implemented (i.e., “Not implemented” and “Implemented”, respectively). For example, fields without crop rotation are marked with X.
Soilsystems 08 00108 g002
Figure 3. Mean monthly volumetric water content (VWC) during the growing season in fields differing in (a) tillage, (b) irrigation, and (c) crop rotation. These summarized data were collected from just below the soil surface (0 cm) and 15 cm depths and were based on continuous data collected for June through September over a five-year period. The dots indicate the mean monthly VWC over a 5-year period. The error bars show the standard error of means, based on field-averaged data across years. The number of fields used in the calculations is indicated above the dots For panel (a): no-till is the solid line, minimal till, is the dotted line, and tillage is the long-dash line.
Soilsystems 08 00108 g003
Figure 4. Relationships between gravimetric soil moisture and clay percentage across crop rotation and tillage practices in semi-arid West Texas. The color indicates whether fields underwent crop rotation, and the shape indicates the tillage treatment (no-till, medium till, or conventional tillage). The regression lines were generated from the predicted values of a mixed effect model in which the sampling period and field ID were used as random effects. R2m: marginal R2; R2c: conditional R2. A black color represents fields with continuous cotton (no crop rotation), while an orange color represents fields with crop rotation. The square, circle, and triangle shapes of the dots indicate no till, minimal till, and tillage practices, respectively.
Soilsystems 08 00108 g004
Figure 5. Soil organic matter across different management practices ((a) till management, (b) crop rotation, (c) irrigation, and (d) cover crops) and comparing crop rotation versus cotton monoculture in no-till fields (e) and tilled/minimally tilled fields (data were pooled) (f). The dots show the mean soil organic matter and the error bars show 95% confidence intervals. The 95% confidence intervals are based on the estimated marginal means from the mixed effects model (i.e., non-independence of repeated measurements is accounted for). The numbers indicate the number of observations.
Soilsystems 08 00108 g005
Figure 6. Relationship between (a) soil organic matter and clay content and (b) soil organic matter and moisture content across crop rotation and tillage management practices. The color indicates whether fields underwent crop rotation, and the shape indicates the tillage treatment (no-till, medium till, or conventional tillage). The regression lines were generated from the predicted values of a mixed effect model in which the sampling period and field ID were used as random effects. R2m: marginal R2; R2c: conditional R2. A black color indicates fields with continuous cotton (no crop rotation), while an orange color indicates fields with crop rotation. The square, circle, and triangle shapes of the dots indicate no till, minimal till, and tillage practices, respectively.
Soilsystems 08 00108 g006
Figure 7. Fatty acid methyl ester (FAME) abundances of different microbial groups and the fungal/bacteria (FB ratio) and total abundances of the main microbial groups across different tillage and irrigation management practices. Error bars indicate 95% confidence intervals.
Soilsystems 08 00108 g007
Figure 8. Relationship between (a) total FAME, (b) fungal FAME, (c) AMF and soil moisture, (d) total FAME, (e) fungal FAME and (f) bacterial FAME levels and organic matter. The color indicates whether fields underwent crop rotation, and the shape indicates the tillage treatment (no-till, medium till or conventional tillage). The regression lines were generated from the predicted values of a mixed effect model in which sampling period and field id were used as random effects. R2m: marginal R2; R2c: conditional R2. A black color indicates fields with fields continuous cotton (no crop rotation), while an orange color indicates fields with crop rotation. The square, circle, and triangle shapes of the dots indicate no till, minimal till, and tillage practices, respectively.
Soilsystems 08 00108 g008
Disclaimer/Publisher’s Note: The statements, opinions and data contained in all publications are solely those of the individual author(s) and contributor(s) and not of MDPI and/or the editor(s). MDPI and/or the editor(s) disclaim responsibility for any injury to people or property resulting from any ideas, methods, instructions or products referred to in the content.