Article

Effect of Grape Pomace Varieties and Soil Characteristics on the Leaching Potential of Total Carbon, Nitrogen and Polyphenols

1
Faculty of Natural and Environmental Sciences, Institute for Environmental Sciences (iES Landau), RPTU Kaiserslautern-Landau, 76829 Landau, Germany
2
Faculty of Chemistry, Division Food Chemistry and Toxicology, RPTU Kaiserslautern-Landau, 67655 Kaiserslautern, Germany
*
Author to whom correspondence should be addressed.
Soil Syst. 2023, 7(2), 49; https://doi.org/10.3390/soilsystems7020049
Submission received: 27 March 2023 / Revised: 4 May 2023 / Accepted: 9 May 2023 / Published: 15 May 2023

Abstract

:
Grape pomace (GP) has an added value because of its contribution to carbon (C) and nitrogen (N) in soils when applied as an organic fertilizer. Macronutrients from GP are translocated into the soil after amendment, but little is known about the factors that may influence the mobility of C, N and bioactive molecules, i.e., polyphenols, in the soil column. We investigated the mobility of the macronutrient content of GP, derived from two red (Dornfelder and Pinot noir) and two white grape varieties (Riesling and Pinot blanc). For that, three different soils (loamy sand RefeSol01A, silt loam RefeSol02A and a vineyard soil) were evaluated in a column model using a GP application rate of 30 t ha−1. The three-step lab-scale approach included the analysis of total C, N and polyphenols expressed as total polyphenolic content (TPC) in: (a) the fresh GP, representing the total amount of C, N and TPC; (b) the mobility with rainwater, representing the aqueous extractable fraction and (c) the mobility in the soil column and leaching potential. Our results showed that total C/N ratios were wider in the white GP varieties compared with the red ones. Higher TPC values were measured in Dornfelder and Pinot noir compared with white varieties. Analysis of the water-extractable fraction showed that the C recovery may reach up to 48% in Pinot blanc, which also corresponds to the highest N contribution. Extractable polyphenols were higher in the red compared with the white varieties by a factor of 2.4. C and N were mobilized with rainwater from the GP through the soil column. However, the application rate used in the experiment was not indicative of an accumulation in the soil. Compared with the control (no GP application), C values were significantly higher in the leachates from GP-treated soils, in contrast to N values. Up to 10% of the TPC of the pomace was leached into the soil. The TPC recovery in the soils strongly depended on the combination of soil type and GP variety. Generally, the sandy and more acidic soil showed an even distribution of phenolics with a high recovery rate (up to 92%) compared with more neutral and silty soil. Most of the polyphenol content could accumulate in the upper soil layer (0–10 cm). These results provide the first insights on the mobility of macronutrients in the soil using a column model and point out the need to relate those experiments to soil and GP properties in order to avoid the accumulation of nutrients in soil or mobility to adjacent ecosystems.

1. Introduction

The grapevine (Vitis vinifera) belongs nowadays to Europe’s most cultivated crops, with a harvest yield of about 38.5 million tons of grapes per year [1]. During the process of juice and wine production, approximately 25% of the grapes’ weight ends up as a solid residue [2]. This residue, called grape pomace (GP) or grape marc, is a heterogeneous mixture of pulp, seeds, skins and the stalks of the grapes. As a natural by-product of viticulture, GP represents a nutrient-rich biomass, containing high amounts of available carbon (C) and nitrogen (N) as well as other nutrients such as potassium and phosphorus [3]. Various studies have shown that the application of composted GP positively affects phenological parameters and even increases resistance of the grapevine against drought and diseases [1,4]. For those reasons, the application of GP as an organic fertilizer, via introducing the GP back into the vineyard via landfill after harvests, is a widespread management technique in vineyards. Despite the offered advantages of agricultural use, the application GP has been banned or restricted in some cases [5,6] because of the risk of N-losses. When partially composted and applied to soil, GP may contain enough N to affect grapevine growth and, hence, wine quality [7]. Consequently, the potential for N oversaturation of soils is given [8,9]. This is considered as an ecosystem threat due to both nitrate leaching into streams and groundwater as well as nitrous oxide fluxes into the atmosphere [10].
An additional important macronutrient fraction in fresh GP is its polyphenolic compounds. These bioactive secondary metabolites have resulted in diverse applications of recycled GP, i.e., in the pharmaceutical, cosmetic and food industries due to their antioxidant potential [3,5]. During wine making, the pomace is gently crushed to prevent off-flavors in the end product. A large fraction of phenolic compounds such as procyanidins, flavonoids, phenolic acids and stilbenes remain in the GP. The phenolic composition strongly depends on the grape variety [11] and also seasonality [12]. In general, total polyphenolic content (TPC) is higher in red than in white varieties [13], with a large number of anthocyanins and flavanols being observed within red varieties [14]. The role of polyphenols in the pools and fluxes of inorganic and organic soil nutrients has been so far investigated based on the input from plants from exudation [15]. Polyphenols are regulators of biogeochemical soil processes [15], in particular those related to the C- and N-cycle in plant–plant interactions [16]. For example, the phenolic compound resveratrol hampered the potential nitrification in soils [17], namely the conversion of ammonium (NH4+) into nitrate (NO3). Epigallocatechin gallate restricts soil nitrification by reducing the abundance of microorganisms carrying the related functional genes [18]. In contrast, more simple chemical structures such as phenolic acids do not affect this process [19], suggesting that the effects depend on the chemistry of the phenolic groups. In general, the composition of nutrients depends on the GP variety. This hampers predictions on the mobilization and residual concentrations of nutrients in the soil fractions. Knowledge about rainwater-based extraction and mobilization processes is scarce, since most publications focus on the maximization of the extraction rate via different techniques, such as the use of organic solvents, ultrasonication and temperature [20].
Bustamante et al. [21] observed that C and N mineralization rates depend on the type of GP and on soil characteristics. In this context, the contribution of intrinsic soil properties, such as pH or particle size distribution, may play a significant role in the fate of nutrients from GP. Sandy soils restrict the retention of NO3; meanwhile, higher retention rates were observed for sandy clay loam [22]. Tannins and related polyphenols show a tight sorption to soil. However, this effect depends on the chemistry of each polyphenol and on the silt and sand fraction [23]. This points out the need of mobility studies considering the composition of single GP varieties as well as the soil properties. In Germany, the application of fresh GP is authorized when executed within 5 days after pressing (in-between storage in the vineyard is allowed) and the amount of applied GP is equal to the yield of the respective vineyard area. However, a single application is also allowed to account for N-fertilization of the respective area considering a time window of up to three years in total (equivalent to 16 t GP ha−1).
The aim of the present study is the systematic investigation of the mobility of C, N and polyphenols (expressed as TPC) in fresh GP-treated soils in a soil column model system. Four different GP varieties (Dornfelder, Pinot noir, Riesling and Pinot blanc) were independently considered and applied on three different soils (R01A, R02A and Vineyard). We hypothesize (i) a shift in soil C/N due to the wide C/N of the pomace and the translocation of carbon-rich substances. According to that, we expect (ii) leaching patterns of macronutrients to be based on soil characteristics such as particle sizes and soil pH. Concretely, leaching in sandy soils is prone to stronger leaching compared with silty soils, due to the sorption affinity of mobilized nutrients to clay particles. To test these hypotheses, we used two methods that are based on the OECD guidelines for batch equilibrium [24] and soil leaching experiments [25].

2. Materials and Methods

2.1. Grape Pomace Selection and Characterization

Grape pomace (GP) as fresh material was obtained from the Center of Rural Services Rheinpfalz (Dienstleistungszentrum Ländlicher Raum Rheinpfalz; DLR), Institute for Vitiscience, Neustadt an der Weinstraße, Germany and collected during the harvest season in 2021. Grapes were harvested using a harvester equipped with a sorting unit, decreasing the yield’s stem content to <1%. GP samples of four Vitis subspecies Dornfelder, Pinot noir, Riesling and Pinot blanc were taken directly after pressing in the winemaking process. Red varieties were fermented as a mash, while samples of white varieties were removed before fermentation. Samples were transported to the lab and kept at −20 °C in the dark until analysis. Grapevine varieties were chosen by their market representativity in the Rhineland-Palatinate region in Germany. In the vineyards, pesticides were applied during the growing season (nine conventional applications; first: 20/05/21, last: 10/08/21). Apart from the application of GP from the previous season, no additional fertilizing was applied to vineyard soils.
GP varieties were characterized for total carbon (C), nitrogen (N) and polyphenolic content (TPC). GP samples were prepared by freeze-drying and grinding with a granulator (Pulverisette 15.303, Fritsch, Idar-Oberstein, Germany). The water content (WC) was measured gravimetrically, while C and N of the pomace were determined via complete sample combustion in triplicates on an elemental analyzer (vario MICRO cube, elementar, Langenselbold, Germany) [26]. TPC analysis was conducted according to Fuchs et al. [27]. Briefly, 15 g of freeze-dried and pulverized GP and a mixture of methanol (MeOH) and water (300 mL, 3:2 v/v) were stirred at room temperature under exclusion from light for 1 h. The suspension was filtered, and the remaining solid was extracted again in the same way. The extracts were pooled, and the MeOH was evaporated under removed pressure. The residue was filled up to 400 mL with deionized water and applied to solid phase extraction. The XAD16N resin (Merck, Darmstadt, Germany) was conditioned with methanol (5 BV) and equilibrated with water (10 BV). The aqueous extract was loaded and washed with water (10 BV) before the polyphenolic fraction was eluted with MeOH (7 BV). The organic solvent was removed under reduced pressure and the extract lyophilized. Extracts were stored at −20 °C in the dark until analysis. TPC was determined using the spectrophotometric method of Folin–Ciocalteu [28] with slight modifications. Gallic acid (GA) was used as a phenolic standard. A six-point GA standard calibration curve was prepared (10 µg mL−1–200 µg mL−1, dissolved in dimethyl sulfoxide (DMSO)). Diluted extract (10 µL, 100–200 µg mL−1, dissolved in DMSO) or GA solution and Folin–Ciocalteu (10% in water, 100 µL) reagent were added to a 96-well microplate. After 10 min incubation at room temperature, sodium carbonate (100 g L−1 in water, 80 µL) was added. Absorbance was measured at 760 nm with a microplate reader after shaking for 1.5 h in the dark at room temperature. The TPC was expressed as grams of gallic acid equivalent per 100 g of dry matter (g GAE/100 g DM).

2.2. Soil Samples and Analysis

For this study, three soils were selected corresponding to a loamy sand and a silt loam as agricultural reference soils, as well as a soil sampled from a representative vineyard. The loamy sand RefeSol01A (R01A) and the silt loam RefeSol02A (R02A) were purchased from Frauenhofer IME, Germany. Vineyard soil was sampled from the Dornfelder vineyard (Mußbach-Bischofsweg, Neustadt, Germany) and was classified as a sandy clay loam (Table 1). All three soils were collected down to a depth of 20 cm [25] with a shovel. Soils were sampled by taking three individual samples and combining them into a single composite sample. The soils were air dried and sieved to 2 mm. The properties of the reference soils were given by the manufacturer, while the vineyard soil was characterized according to the following methods. The particle size distribution (PSD) was estimated using the hydrometer method [29] as well as the R package ‘envalysis’ [30]. The PSD served to classify the soils according to their texture. The maximum water holding capacity (WHCmax) of the sampled soil was determined gravimetrically with the funnel method [31] as the weight difference of a wet soil sample (WS) after 24 h of saturation and the respective dry soil (DS) (Equation (1)).
W H C = W S D S D S 100
Microbial activity of the investigated soils, basal and substrate (D-Glucose)-induced respiration was determined via the MicroResp™ method as described by Campbell et al. [32]. In brief, soils samples were preincubated at 40% of their WHCmax in a 96-deepwell plate for seven days. For the main incubation, water and substrate were applied to the plates and the mineralization to CO2 was determined after 6 h. The CO2 production was evaluated using a pH color reaction using cresol as an indicator in the agar gel in 96-well microplates (PS, F-Bottom, clear, Greiner bio-one, Frickenhausen, Germany). Absorbance at 572 nm was used for assessing differences in color change in response to CO2 evolved from respiration under basal conditions (water) and with glucose as substrate. Non-linear calibration data were used from Albert et al. [33] and measurements were performed on the same device. Microbial biomass C (Cmic) was determined according to the chloroform fumigation (CFE) method [34] before the soil was airdried.
Table 1. Characterization of the investigated soils.
R01AR02AVineyard
TextureSandy loam * Silt loam * Sandy clay loam **
Sand/Loam/Clay (DIN)69.8/24.4/5.9 *1.7/82.6/15.6 *61.9/13.4/24.8 **
Sand/Loam/Clay (USDA)70.5/26.1/3.4 *5.7/78.24/16.0 *62.5/12.7/24.8 **
Total C (%)0.95 *1.06 *1.5 ± 0.4 **
Total N (g kg−1)0.08 *0.11 *0.12 ± 0.01 **
WHCmax (g% dry weight)29.3 *47.1 *46.8 ± 1.3 **
pH (CaCl2)5.6 *6.5 *7.3 ± 0.1 **
Basal respiration
(µg CO2-C g−1 soil h−1)
n.d.**0.05 ± 0.01 ** 0.10 ± 0.06 **
Glucose respiration
(µg CO2-C g−1 soil h−1)
0.02 ± 0.02 **0.26 ± 0.06 ** 1.0 ± 0.12 **
Cmic (mg kg−1)174 *794 *449 ± 20 **
* Data provided from Frauenhofer. ** Data generated by authors. n.d. = not detectable respiration based on calibration data in Albert et al. [34].

2.3. Rainwater Extraction: Water Soluble Fraction of C, N and TPC

To investigate the water-soluble fractions of C, N and TPC in the GP, a batch equilibrium experiment was conducted according to OECD guideline 106 [24]. For this, aliquots of 6 g and 3 g of fresh GP were added to 30 mL of artificial rainwater (0.01 M CaCl2 solution, 1:5 and 1:10 ratio) in 50 mL sterile and metal-free centrifuge tubes. MilliQ water was used throughout all experiments (18.2 MΩ cm–1, EASYpure II, Millipore, Bedford, MA, USA). The rainwater was additionally spiked with 0.05% of NaN3 to inhibit microbial degradation of the nutrients. The GP in the mixture with water was shaken for 24 h in the dark using an overhead shaker (10 rpm, Reax 20, Heidolph, Schwabach, Germany). The tubes were gently centrifuged at 200 rpm for 5 min to prevent excessive compression of the GP, the supernatant was transferred into two sterile 15 mL centrifuge tubes and stored at −20 °C until analysis. Water soluble fractions of nutrients were characterized as dry substance equivalents. TPC results additionally served as the basis for a mass balance in the soil leaching experiment (Section 2.4).

2.4. Soil Leaching Experiment

Leaching of the four GP varieties (Dornfelder, Pinot noir, Riesling and Pinot blanc) was evaluated in the three soils (R01A, R02A and Vineyard) in a factorial design according to OECD guideline 312 [25]. The dimensions of the glass leaching columns were 30 cm length and 5cm diameter, with a glass frit at the bottom (Pehl Laborbedarf, Montabaur, Germany). In total, 700, 600 and 650 g of air dry and 2 mm sieved soil, respectively, for R01A, R02A and vineyard soil. The columns were packed with the soils while the column was vibrated with the use of a vortex shaker (Vortex-Genie 2, Scientific Industries, New York, NY, USA) to a height of approximately 30 cm (fixed soil volume). The soil columns were completely saturated to 100% WHCmax with artificial rainwater over night. After saturation, 6 g of fresh GP (Dornfelder, Riesling, Pinot Noir, Pinot Blanc) was applied directly onto the soil surface, equivalent to an application rate of 30 t ha−1. Although the recommended and maximum allowed GP application is 2.6 t ha−1 and 16 t ha−1, respectively, a GP/soil ratio of ~1:100 was selected for a better comparability with other studies [7,9]. Fresh GP was used, since this is the most common legal procedure of GP application in Germany. To ensure an even distribution of the rainfall, the top of the column, including the GP, was covered with glass beads (1.7–2.1 mm, Roth, Karlsruhe, Germany). Then, a rainfall event (200 mm over 48 h) was simulated using an infusion set (Exadrop, B.Braun, Melsungen, Germany), which was set to 8 mL h−1, equivalent to 384 mL of rainwater. Columns containing the three respective soils without GP served as control treatment. After 48 h, the leachate (384 mL) and the whole glass columns were collected and frozen at −20 °C until analysis. The soil was removed from the glass columns by carefully dewing the outer side of the column and removing the soil core from the column. Soil cores were divided into 3 factorial depths (0–10, 10–20 and 20–30 cm). The column experiments were performed in triplicate. Soil samples were freeze dried (Alpha 1–2 LD plus, Christ, Osterode am Harz, Germany) and stored at −20 °C until further analysis.

2.5. pH, Carbon (C) and Nitrogen (N) in Aqueous Samples and in Soil

Rainwater extracted carbon content was analyzed via aqueous elementary analysis (multiNC 2011S, Analytik Jena AG, Jena, Germany) after filtration (0.2 µm, PET, Macherey-Nagel, Düren, Germany). Column leachates were directly measured due to prior filtration by the frit inside the glass columns (Pore size P4 ISO-Norm). Dissolved total nitrogen (TN) was measured with a test kit (Nanocolor total Nitrogen 22 and 220, Macherey-Nagel, Germany) in a portable photometer (400 D, Macherey-Nagel, Düren, Germany). The measurement was based on oxidative digestion (DIN EN ISO 11905-1 H36) on a thermal block (Nanocolor Vario C2, Macherey-Nagel, Düren, Germany) and photometric determination with 2,6-dimethylphenol in a sulfuric acid/phosphoric acid mixture at the wavelength suggested by the provider, i.e., 345/350/365 nm (ISO 7890-1; DIN 38405-D9). Total C and N in soil samples were determined via complete sample combustion using an elemental analyzer (vario MICRO cube, elementar, Langenselbold, Germany). The pH of untreated soils, rainwater extracts as well as of the leachates were measured with a pH electrode (Mettler Toledo LE422 and Consort C863) prior to calibration in buffer solutions (pH 3, 7 and 11, Roth, Karlsruhe, Germany). The pH of the soil samples was measured according to DIN ISO 10,390 at a 1:5 ratio in a 0.01 M CaCl2 solution after 2 h of equilibration.

2.6. Analysis of Total Polyphenolic Content (TPC) in Aqueous Phases and Soil Samples

The rainwater extracts were directly analyzed for total polyphenolic content (TPC) via the Folin–Ciocalteu method in a microplate (96-well, PS, F-Bottom, clear, Greiner bio-one, Frickenhausen, Germany). For that, 20 µL aliquot of sample or standard (GA) was added to 40 µL Folin–Ciocalteu reagent (FCR, Supelco, Merck, Darmstadt, Germany). After 5 min of ultrasonication, 160 µL of 7.5% carbonate solution (Na2CO3 · 10 H2O, Roth, Germany) was added to each well. The plate was shaken gently and incubated in the dark at 21 °C for 2 h. After the incubation, the plates were read for absorbance at 765 nm using a microplate reader (infinite M200, Tecan, Switzerland). The average absorbance of a sample was calculated using the mean of 4 plate replicates. For quantification, a dilution series of GA (Roth, Germany) ranging from 50 to 500 µg mL−1 (R2 = 0.973) was set up in the artificial rainwater solution (0.01 M CaCl2 + 0.05% NaN3 in MilliQ water).
Soil samples were extracted aqueously at a 1:2 ratio by adding 2 mL of MilliQ water to 1 g of soil and assistance by ultra-sonication (45 kHz, VWR) for 15 min. The extraction method was aimed to quantify the water-soluble and bio-available fraction of the TPC in the soil [35], as water-soluble polyphenols remain in solution between soil particles [36]. Due to the lower TPC in the soil of the leaching experiment, the method described above was slightly adjusted. Leachates and soil extracts were measured for TPC via the Folin–Ciocalteu method as described above, but in single-use 4.5 mL cuvettes (PS, Roth, Germany) instead of microplates. Reagent volumes were adjusted accordingly to a total volume of 3 mL. The incubation took place in 5 mL black reaction tubes (PP, Roth, Karlsruhe, Germany). After the incubation, the solution was transferred into a single-use polypropylene cuvette and read at 765 nm using a UV/VIS photometer (Specord 50, Analytik, Jena, Germany). For the calibration, a dilution series of GA (Roth, Karlsruhe, Germany) ranging from 1 to 75 µg mL−1 (R2 = 0.999, Figure S4) was conducted in the artificial rainwater solution (0.01 M CaCl2 in MilliQ water). TPC results are given as gallic acid equivalents (GAE).

2.7. Data Analysis

Raw data were processed and evaluated using R (version 4.0.3) and the package ‘tidyverse’ [37]. For statistical analysis of the rainwater extraction, an analysis of variance (two-way-ANOVA) was performed. The response was set as the explaining variable, and GP type and extraction ratio were set as grouping variables. An outlier check was performed with the ‘identify_outliers’ command from the ‘rstatix’ package [38]. Normal distribution and homogeneity of variances was checked via visual inspection of the qq plot and a Levene’s test. Pairwise comparisons were analyzed with the connection of a Tukey corrected multiple comparisons of means post hoc test with a 95% family-wise confidence level. The same approach was used for the analysis of results from the soil column leaching experiment. However, a three-way-ANOVA was performed with new grouping variables, soil type and soil depth. Soil and leachate C and N contents as well as pH are given as raw data content. Significant differences were tested using a Dunnett test (‘DunnettTest’ function from the package ‘DescTools’) [39], comparing the non-treated soil (control) to the GP-treated soils and leachates, respectively.
TPC data of the soil column were used for the calculation of a mass balance. Therefore, the soil and leachate data were corrected to the values of non-treated soil. Values below the lowest calibration standard were set to one-half of the lowest calibration level (0.5 µg mL−1). Then, TPC was converted to total mass of polyphenols by adjusting the unit to 10 cm (one soil section) of soil dry mass, respectively. The mass balance of polyphenolics was calculated by setting the mean TPC values of the grape pomace to 100% and relating the mean TPC of the rainwater and soil column experiment, respectively. Additionally, the TPC of both experiments (rainwater extraction and column leaching) were also compared with each other to calculate a recovery of TPC in the soils (Figure S1). Soil and leachate contents were additionally added up and displayed as the total amount of TPC. This group was not considered in the following statistical analysis. For the ANOVA, the mass balance was set as the explaining variable, with GP type, soil type and depth as grouping variables. Pairwise comparisons were analyzed with the connection of a Tukey corrected multiple comparisons of means post hoc test, with a 95% family-wise confidence level. The significance level was set to p < 0.05 for all experiments.

3. Results

3.1. C, N and TPC Composition in GP and Rainwater Extract Related to Grape Varieties

In general, total C in GP varied from 43.3 ± 0.2 to 50.2 ± 0.1%, with slightly higher content in red varieties (Table 2). The N content was two times higher in red (2.4% in Dornfelder and Pinot noir) than in white varieties (1.3 and 1.2% in Riesling and Pinot blanc). In this context, wider C/N ratios were observed for the white varieties. TPC values in GP were more than two times higher in red (4.5–4.7%) than in the white varieties (1.7–2.3%). GP samples contained at least 59 ± 1.2% (Pinot noir) and up to 67 ± 0.5% (Pinot blanc) water, based on fresh weight.
Results of the rainwater extraction experiment showed that only a fraction of C, N and TPC was extracted with water (Table 3). Approximately 21–27% and 31–46% of total C was extracted from the red and white varieties, respectively. Water-soluble N-fractions from GP corresponded to a maximum of 29% (Pinot blanc), with no significant differences between and among red and white varieties. Accordingly, C/N was higher in the aqueous samples than in GP (Table 3), ranging from 29 ± 7 (Pinot noir) up to 91 ± 66 (Riesling). No pattern was observed between red and white GP varieties. Aqueous fractions were also richer in polyphenols in the red than in the white varieties: Here, TPC values in the aqueous extracts of the red varieties ranged from 283 to 311 µg L−1. Meanwhile, the range in white varieties was 115–129 µg L−1 (Table 3). Generally, extractions of red varieties revealed a higher TPC and lower C content than the white varieties. The polyphenolic fraction measured in aqueous extract corresponded to 7% for Pinot noir up to 10% for Dornfelder variety of the TPC in the GP. The pH of the aqueous extract was slightly acidic and ranged from 3.9 to 4.0 (Table 3). Extracts from red varieties were slightly more acidic than those from white varieties. Statistically expressed, the GP variety significantly affected extract pH (df = 3, f = 182.6, p < 0.001) as well as total C (df = 3, f = 75.74, p < 0.001), but not TPC (df = 3, f = 6.543, p > 0.05) or TN (df = 3, f = 2.67, p > 0.05). Additionally, the extraction ratio (1:5 vs. 1:10, GP: water) significantly affected TPC (df = 1, f = 5.454, p < 0.05) and C content, with higher extraction rates at the 1:10 ratio. However, the extraction rate of total N did not differ between the ratios. The results of the 1:5 extraction ratio were used for further calculations.

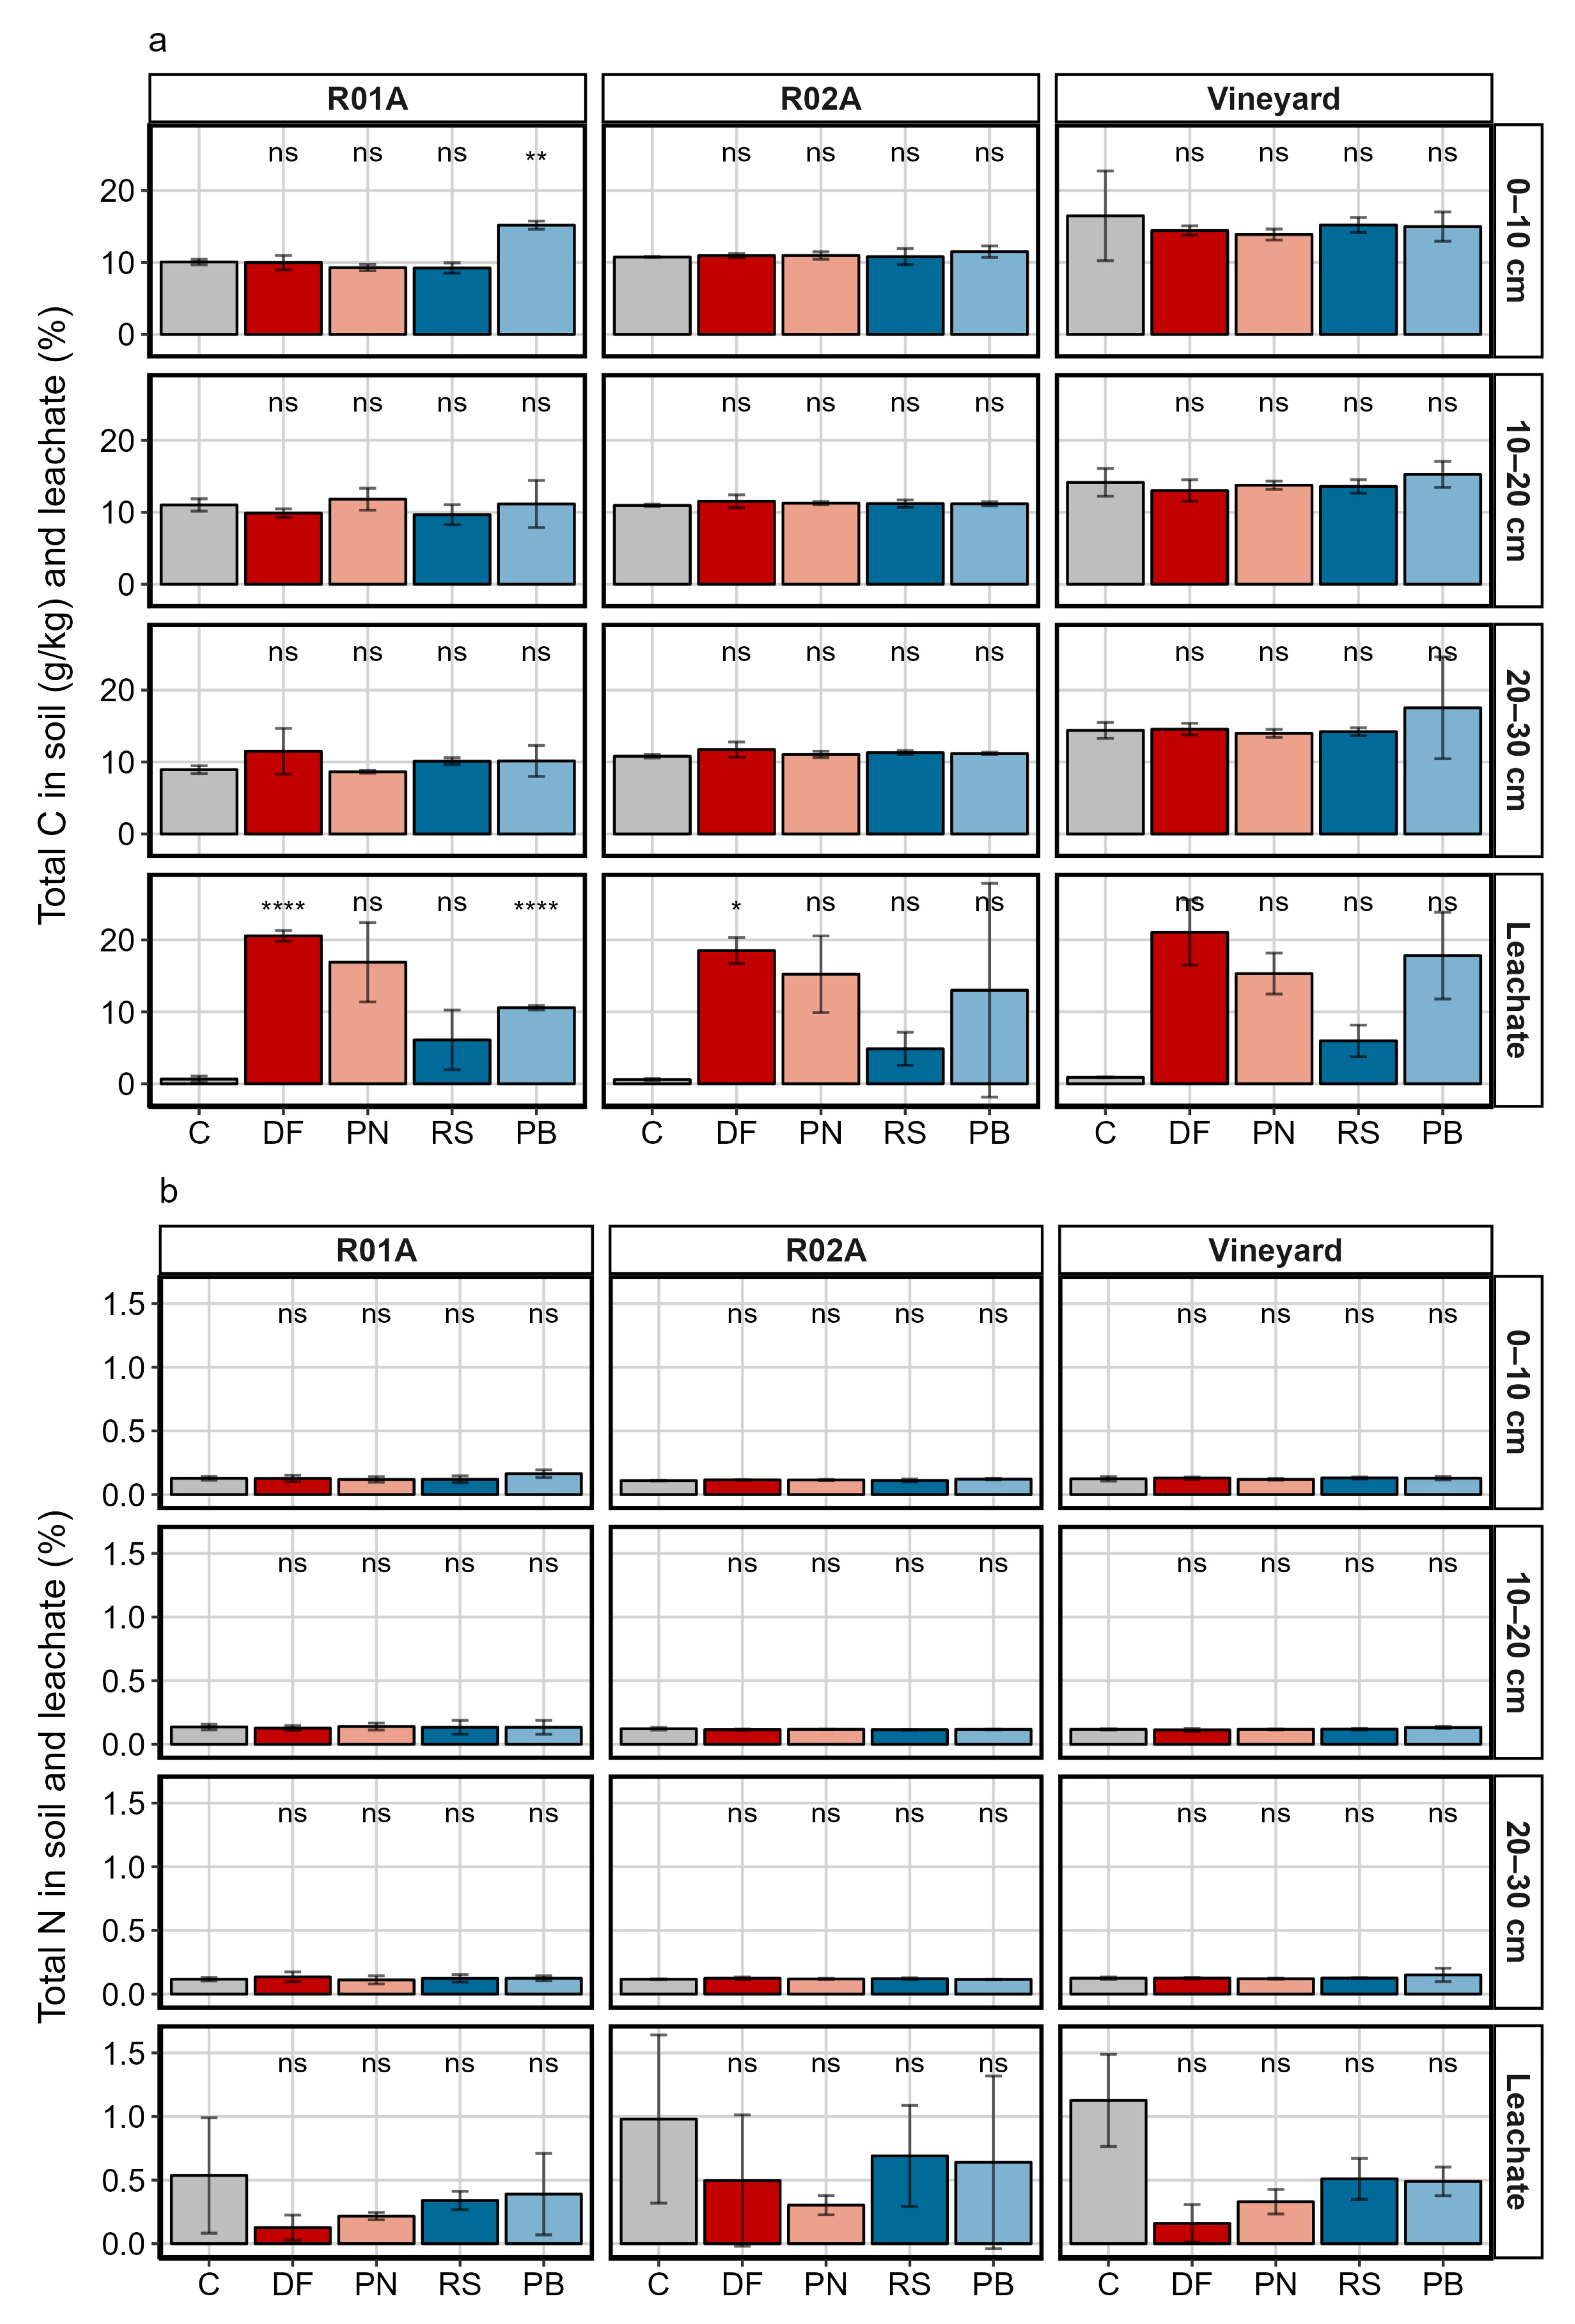
3.2. Nutrient and Polyphenol Leaching Potential in the Soil Column

In general, no significant effect was observed regarding a C contribution from the GP varieties in the investigated soils (Figure 1a). The exception was Pinot blanc in combination with the soil R01A: the upper soil layer showed a 0.5% carbon gain compared with the non-treated soil (df = 4, f = −12.928, padj. < 0.001). In the leachates, the C content was higher in GP-treated samples than in the control soil, with significant differences for Dornfelder and Pinot blanc in R01A and Dornfelder in R02A. Leaching of C was not affected by the soil type (df = 2, f = 0.3279, p > 0.05), but showed significant differences according to the GP varieties (df = 4, f = 25.522, p < 0.001). The C fraction was higher in the leachates of Dornfelder, Pinot noir and Pinot blanc than that for Riesling GP treatments and up to 20 times higher compared with the control, respectively. Total N was generally constant in the soil samples, with marginal differences after GP application (Figure 1b). N-values in the leachates were higher in the control than in the GP treatments. However, this effect was not statistically significant. Among GP varieties, The N-leaching potential of white GP was slightly higher than that for red varieties.
Pinot blanc was the one GP variety that showed the strongest leaching potential of phenolic compounds, with a recovery of 17.5, 6.8 and 24.3% of the rainwater-extractable TPC in the leachates of R01A, R02A and vineyard soil, respectively (Figure 2). In the soil R01A, the strongest leaching potential was observed with an average recovery of 10% in the leachate. Independent from soil type and GP variety, the largest fraction of TPC in soils was recovered from the upper soil layer (0–10 cm; Table S1). The highest TPC observed in soils was 12 ± 9 mg kg−1 for R01A with Pinot Noir GP and 14 ± 12.0 mg kg−1 for R02A with Riesling GP. In the vineyard soil, the content of polyphenols was lower compared with the reference soils. Generally, the leaching potential of GP varieties can be rather differentiated by their classification, red vs. white (df = 3, f = 4.3713, p = 0.01), than by variety (Table S1). The highest recovery of the total aqueous-extractable fraction (Section 3.1) in all depths and leachate was represented by the combination of Riesling GP and R01A (84%) as well as for Riesling GP and R02A (92%). The lowest recovery (7.5%) was observed for Dornfelder GP in the vineyard soil.
The pH values of the soil samples were mainly determined via the soil type (df = 2, f = 265.3551, p < 0.001). Compared with the control, soil pH values remained constant after GP application with a few exceptions, e.g., the Dornfelder GP treatment significantly increased the pH of the vineyard soil in all depths investigated, but not in the leachate (Table 4). The pH values were significantly higher in the leachate than in the soil samples (df = 3, f = 92.7313, p < 0.001), respectively, with one exception, which is the application of Pinot blanc onto the vineyard soil. This combination decreased leachate compared with soil pH. Leachate pH was also not affected after GP application with two exceptions, namely the combinations Riesling GP and 02A (from pH 8.6 to 7.4) and Pinot blanc GP and vineyard soil (from pH 9.0 to 6.4). In general, Pinot blanc GP showed the strongest effect on soil and leachate pH.

4. Discussion

4.1. C, N and Total Polyphenol Content according to the GP Varieties

The composition of C, N and TPC varied among the GP varieties in line with previous studies [2,40]. Accordingly, the two red varieties were richer in C and N content than GP from white grapes, with 10–15% more C and up to 100% more N. TPC in the investigated varieties ranged in average from 1.7 to 4.7%. Spigno et al. [41] reported values of 9 to 12% TPC, while an average of 7.5% TPC was reported by Amendola et al. [42] with the variety Barbera. However, TPC is also strongly dependent on seasonality. As shown by Lorrain et al. [12], the effects of seasonality can account for up to 50% variation in phenolic content. In general, TPC was also higher in the red than in the white GP varieties by a factor of approximately 2.5. Martins et al. [43] also observed higher TPC values in red than in white varieties by a factor of 1.3 within the varieties “Maximo IAC 138-22” grapes, a hybrid grape variety of Syrah (75%) and Seibel (25%) and the white GP Moscato branco. Polyphenolic compounds in GP correspond to the groups of anthocyanins, phenolic acids, anthoxanthins and stilbenes [44], with differences in composition between seeds and pulp; namely, anthocyanins are much higher in pulp than in the seeds, while procyanidins are concentrated in the seeds [45]. The low TPC content measured in the fresh GP samples can be attributed to the clean-up step performed during the extraction of phenolic compounds. Consequently, not all polyphenols were retained in the column leading to lower TPC values compared with previous studies.
Aqueous GP extracts represent the fractions that mobilize in soil and are available for soil biogeochemical processes. Analysis of the rainwater-extractable C, N and TPC fraction showed different results compared with the values observed in the GP: Extractable C was significantly higher for white varieties than for red GP because of the high sugar (glucose/fructose) content [46]. Monosaccharides are highly soluble in water and thus reveal a strong mobility potential. The water-dissolved N was higher in the varieties Pinot noir and Pinot blanc than in Dornfelder and Riesling. This can be attributed to differences in organic and inorganic N such as protein and amino acid content or mineral N [2]. For example, Valiente et al. [47] reported values for total protein in GP of 7.4% DM for the white GP variety Airén. Meanwhile, Goñí et al. [48] reported a value of 13.8% DM for red GP (peels and seeds; Vitis vinifera var. Cencibel). Chikwanha et al. [49] observed that amino acid content in freeze-dried GP was higher in the varieties Pinotage, followed by Shiraz when compared with Sauvignon Blanc, which indicates differences in N species among GP varieties. Rainwater extractions showed wide C/N ratios, ranging from 29 ± 7 (Pinot noir) up to 91 ± 66 (Riesling). The high standard deviations observed of up to 73% (Riesling) can be attributed to the heterogeneity of fresh grape pomace and the chemical composition of the different fractions, i.e., skin, pulp and seeds [50].
The water-soluble TPC in red varieties was higher by approximately a factor of two than in the white varieties, in line with values observed in GP powder. Well-known polyphenolic compounds in GP varieties are present as mono or poly sugar-conjugates, i.e., O-rutinoside, O-glucoside, or O-galactoside [20,51,52], increasing the water solubility of the polyphenolic compounds. Results of the rainwater extraction represent an estimation for aqueous extractable fractions of macronutrients of the GP, which can be translocated into the soil during rain events. In light of the heterogeneity of the fractions in GP, the diversity in GP varieties and different practices for application in the fields, considerations on the water-extractable fractions are advisable to assess the potential rates of nutrients, which can be translocated into soil.

4.2. The Role of the Soil in the Leaching Potential of GP: Consequences for C, N and Soil pH

In general, C and N were not enriched in the soil fractions after leaching under the investigated application rate; therefore, (i) is rejected. However, the exception was the treatment with Pinot blanc GP, which significantly increased the C content in the upper soil layer of R01A. This corresponds to the fact that Pinot blanc is also the variety that provided (a) the highest C content in the aqueous extract and (b) the highest recovery of extractable C. In contrast to the investigated soils, the leachates showed significantly increased C when GP was applied; this was more evident with the red varieties. This indicates a wash-off of C from the soils, which is in line with the study of Ferjani et al. [53], who also observed a nutrient mobilization with water movement in a soil column experiment. Thus, the nutrient mobilization with water from GP seems to be effective for a translocation of C and N through the soil column. Paradelo et al. [9] described a slow release of nitrogen and nutrient enrichment in soil after GP amendment; however, the study did not include a mobilization process with water. In our study, we investigated fresh GP, but it is known that fermentation processes [9] as well the mineralization of N will increase the amount of water-mobile N as a function of time [7] with a risk of oversaturating soils [10]. Therefore, we suggest that GP-derived N is mainly introduced into the environment via mineralization and not during initial leaching (first 48 h). This indicates the importance of taking the soil into perspective as an ecosystem where N fluxes mainly depend on biological soil functioning such as microbial as well as macro- and megafauna activity. Furthermore, N leaching was observed to be suppressed by the GP application. Although these findings were not significant, this phenomenon might be based on the formation of covalent bonds between soil proteins and polyphenolics, leading to an immobilization of N, as described by Northup et al. [54]. However, the results of this study must be interpreted with caution, especially when, in practice, GP varieties are mixed before the application on the field, leading to GP mixtures with different nutrient contents and mobilization patterns in soils. We point out the need for the investigation of N-mobility and metabolism using different set-ups for GP application, i.e., fermentation or mixture application and considering soils types, since the availability and mobility of nutrients may depend not only on the input but also on soil texture [55]. Further, there are still research gaps regarding the role of the environmental conditions, soil properties and soil processes on the metabolism [21] and mobilization of N-species in soil [56]. This knowledge is necessary for better estimations of application rates to avoid excessive inputs.
The pH of the aqueous solutions (rainwater extracts) ranged in average from 3.9 to 4.3. On the other hand, the soil pH values ranged from 5.6 to 7.3. In the leachates, after the soil column experiment, pH values in the soil fractions were similar to values observed in the soils prior to the experiment. This effect was more visible for the vineyard soil. The capacity of soils to compensate pH changes was also observed by Bustamante et al. [21] in an incubation experiment. Similarly, long-term organic amendment with municipal waste improved the buffer capacity of humic acids by affecting their elemental and acidic functional composition [57]. Furthermore, treatments with compost improved the pH and buffering capacity of the soil [58]. This effect can be partly attributed, for example, to the presence of carbonates in GP or in soil [59]. Accordingly, grape residues have a carbonate content of approximately 2.5% [60], which may explain the stronger pH compensation effect in vineyard soil and respective leachate than in the two standards soils.
The present experimental setup provides an indication of the short-term mobility and leaching potential of macronutrients, but lacks the potential to evaluate for soil quality when GP is applied in the field. The buffer capacity of the soil was independent of the GP application. The higher pH in the leachate compared with soil is an interesting phenomenon that underpins the importance of soil and groundwater comparison in such studies. There is a poor correlation between groundwater chemistry and pH or Ca2+ in soil, disrupted mainly by mineral leaching, e.g., silicates, or the accumulation of organic matter in soil [61]. Therefore, incubation experiments that aim to investigate biogeochemical processes in the soil over time are essential [21], and not only covering the spatial distribution as investigated in this study.

4.3. Leaching Potential of Polyphenol Compounds in Soils

In the standard soils, the upper soil layer contained the most polyphenolic compounds, in line with Kurtz et al. [62], who investigated TPC in olive wastewater-treated soils. In their study, TPC fractions were 28 ± 9 mg kg−1 in the upper soil layer and between 14 ± 2 mg kg−1 and 17 ± 3 mg kg−1 in the deeper layers. In the vineyard soil, no accumulation of polyphenolic compounds was observed at the topsoil. Mass balance analysis showed differences in the TPC recovery in function of the soil type and GP variety; the latter one proved to be significant and, therefore, hypothesis (ii) is partly approved. Reduced TPC recovery in the vineyard soil can be attributed to the instability of polyphenolics at pH ≥ 7 and increasing persistency at low pH values. Sang et al. [63] reported that epigallocatechin-3-gallate was unstable in a phosphate buffer at a pH of 7.4, which is the pH range of the investigated vineyard soil, with a half-life of only a few hours, even in the absence of oxygen. On the other hand, Chethan and Malleshi [64] reported that the phenolic contents of millet extract remained constant at highly acidic to near neutral pH (6.5), but decreased gradually as the alkalinity increased to pH 10. Similarly, Zeng et al. [65] observed that tea polyphenols with a pH of 3–6 remained stable. The pH-mediated reactions leading to the instability of polyphenols can be attributed to protonation or deprotonation reactions [66] as well as ring-opening and hydrolysis. Further, chemical masking via iron complexation may occur in the soils [67], leading to reduced TPC recovery values. Vernhet et al. [66] observed that at pH 3.5, polyphenolic compounds derived from grape seeds and from wine may have no charge, which may reduce their mobility in water compared with ionized forms.
The different polyphenol mobility in the investigated soils can be further attributed to their sorption to clay minerals as described, e.g., by Hättenschwiler and Vitousek [15]. Reversible sorption of polyphenols in soil occurs via hydrophobic, hydrogen and ionic bonding [68]. Again, this is in accordance with our results, since R02A contains more silt and the vineyard soil more clay than the soil R01A (Figure S2). However, regarding the biogeochemical relevance of polyphenols in soil, sorption to clay not only demobilizes the substances but also stabilizes and physically deactivates them [69]. Polyphenols and carbohydrate-like compounds preferentially adsorb to mineral soils via the stabilization of functional groups by mineral surfaces [69]. Further, polyphenol–protein complexes may occur in soils [70], reducing polyphenol availability and mobility. Differences in the mobilization of GP constituents in the standard soils compared with the vineyard soil can be attributed to a long-term previous exposure of the soils to the GP-treatment because of an adaptation of the microbial community to the frequent GP inputs, improving degradation of polyphenols via enzymes [71]. Another factor which supports TPC losses can be the higher basal and substrate-induced microbial activity in the vineyard soil than in the two reference soils (Figure S3), in line with Buchmann et al. [72]. In addition, the re-wetting of dry soil leads to an overshoot of activity, also known as the Birch effect [73], which could be observed in this experiment since columns were filled with dry soil.
Studies investigating the introduction of polyphenolic secondary plant metabolites have frequently described their effect on the structure and function of the soil microbiome [74]. For example, the application of two phenolic acids, particularly vanillic acid, had a considerable impact on the microbial community, with a stimulation of microbial biomass at low concentrations and inhibition at high concentrations [75]. Therefore, a microbiological assay that investigates the effect of such a treatment will be essential in the future to better understand the effect on the soil microbiome. Even though this practice is not ideal for a microbiological assay, using dry soil was essential for our column experiment.
The GP variety also had a significant effect on soil TPC recovery. The stability of TPC in soil was not due to a reduction in soil pH, considering that soil pH was almost not affected by the GP treatment. A difference in GP color was especially observed, indicating an effect of grape processing (fermented vs. not fermented) on TPC mobility. This observation suggests the interaction with coexisting compound classes in the GP, e.g., sugars, fats or proteins. Sugars may interact with the polyphenols, as observed in vivo by Scholz [76], and change the physicochemical behavior of the molecules and their intermolecular interactions. This theory is in line with the higher sugar content in white GP varieties, which also lead to higher soil TPC recovery. In contrast, red varieties contain less sugars that are available for such interactions, due to the consumption of sugars in the fermentation process. Additionally, the fraction of sugar-conjugated polyphenols may differ between varieties, again altering the reactivity based on the molecules’ structure [77].
Finally, evaluating the use of GP regarding the mobility of polyphenols, our results showed that despite the application rate (30 t ha−1), only a minor fraction of TPC is actually mobile in the soil, namely a maximum of 5% of the total content after 48 h of a heavy rainfall event. Taking into account that our experiment resembled an extreme scenario with heavy rain fall combined with an over-application of fresh GP, it is questionable if an effective dose of polyphenols may reach the root zone of grapevine varieties (Vitis spp.) in such soils, since most varieties have their roots between 20 and 160 cm of soil depth [78,79]. Therefore, we suggest that the effect of phenolics takes place in the upper soil layer of approximately 10 cm. Here, different mechanisms play important roles that were not investigated in this study, such as the hydrophobicity of the soil surface [73,79], especially after repeated application of fresh GP.

5. Conclusions

The results of this study revealed that the mobility of macronutrients from GP in the soil mainly depends on the GP variety and, to a lesser extent, on soil properties. Higher extraction rates of C in white and N in red GP in extracts did not determine the mobility of the nutrients in the soil column. In general, C and N were not enriched in the soil fractions after leaching under the investigated application rate. But, Dornfelder GP treatment indicated C mobilization simultaneously with N retention, showing the potential of N oversaturation in soils. In general, the distribution of polyphenols in soil was affected by the soil type and GP variety. Recovery of polyphenols in the vineyard soil was less compared with reference soils, revealing a knowledge gap on the stability, fate and effect of these compounds in such soils. In general, polyphenolic fractions from GP were recovered better from the upper soil layer compared with lower soil depths. Since effects on soil microbiology, e.g., the nitrogen cycle, have already been confirmed for polyphenolic compounds from plant exudation, further investigation is needed to clarify the effect of secondary metabolites in the soil ecosystem after GP application. This study provides the first insight of the role of GP varieties and soil properties on the mobility of nutrients in a soil column model experiment. Considering that the applications in the field may be influenced by environmental properties or climatic events, evaluations of the mobility of nutrients after GP application are strongly advised in order to avoid losses and translocation in adjacent ecosystems. Therefore, long-term and field studies are required to monitor the change of macronutrients in the soils over an expanded time-frame.

Supplementary Materials

The following supporting information can be downloaded at: https://www.mdpi.com/article/10.3390/soilsystems7020049/s1, Figure S1: Example of the visualization of polyphenolic mass balance data in soil; Figure S2: Overview of the particle size distributions of the used soils; Figure S3: Activity of used soils based on the microbial CO2 respiration rate; Figure S4: Linear model for the calibration of the Folin–Ciocalteu method for the analysis of TPC in soils; Table S1: Statistical differences in TPC recovery in soil and leachate. Reference [80] is cited in the supplementary materials.

Author Contributions

Conceptualization, S.K., K.M. and C.B.; methodology, S.K. and S.S.; software, S.K.; investigation, S.K, S.S. and C.M.; resources, S.K., S.S. and C.M.; data curation, S.K., S.S. and C.M.; writing—original draft preparation, S.K. and S.S.; writing—review and editing, K.M., C.B. and E.R.; supervision, K.M., C.B. and E.R.; project administration, K.M., C.B. and E.R.; funding acquisition, K.M., C.B. and E.R. All authors have read and agreed to the published version of the manuscript.

Funding

This project was funded by the Carl-Zeiss-Foundation, project number P2021-00-004.

Institutional Review Board Statement

Not applicable.

Informed Consent Statement

Not applicable.

Data Availability Statement

The data presented in this study are available on request from the corresponding author.

Acknowledgments

We would like to thank DLR for the sampling of grape pomace samples, as well as for the help in the collection of the vineyard soil samples, and Ulli Bange from the University of Koblenz for the assistance in the measurement of total carbon and nitrogen in soil and grape pomace.

Conflicts of Interest

The authors declare no conflict of interest.

References

  1. Eleonora, N.; Dobrei, A.; Dobrei, A.; Kiss, E.; Ciolac, V. Grape pomace as fertilizer. J. Hortic. For. Biotechnol. 2014, 18, 141–145. [Google Scholar]
  2. Dwyer, K.; Hosseinian, F.; Rod, M.R. The market potential of grape waste alternatives. J. Food Res. 2014, 3, 91–106. [Google Scholar] [CrossRef]
  3. García-Lomillo, J.; González-SanJosé, M.L. Applications of wine pomace in the food industry: Approaches and functions. Compr. Rev. Food Sci. Food Saf. 2017, 16, 3–22. [Google Scholar] [CrossRef] [PubMed]
  4. Diaz, M.; Madejon, E.; Lopez, F.; Lopez, R.; Cabrera, F. Optimization of the rate vinasse/grape marc for co-composting process. Process Biochem. 2002, 37, 1143–1150. [Google Scholar] [CrossRef]
  5. Beres, C.; Costa, G.N.; Cabezudo, I.; da Silva-James, N.K.; Teles, A.S.; Cruz, A.P.; Mellinger-Silva, C.; Tonon, R.V.; Cabral, L.M.; Freitas, S.P. Towards integral utilization of grape pomace from winemaking process: A review. Waste Manag. 2017, 68, 581–594. [Google Scholar] [CrossRef] [PubMed]
  6. Devesa-Rey, R.; Vecino, X.; Varela-Alende, J.; Barral, M.; Cruz, J.; Moldes, A. Valorization of winery waste vs. the costs of not recycling. Waste Manag. 2011, 31, 2327–2335. [Google Scholar] [CrossRef] [PubMed]
  7. Flavel, T.; Murphy, D.; Lalor, B.; Fillery, I. Gross N mineralization rates after application of composted grape marc to soil. Soil Biol. Biochem. 2005, 37, 1397–1400. [Google Scholar] [CrossRef]
  8. Moldes, A.B.; Vázquez, M.; Domínguez, J.M.; Díaz-Fierros, F.; Barral, M.T. Evaluation of mesophilic biodegraded grape marc as soil fertilizer. Appl. Biochem. Biotechnol. 2007, 141, 27–36. [Google Scholar] [CrossRef] [PubMed]
  9. Paradelo, R.; Moldes, A.B.; Barral, M.T. Carbon and nitrogen mineralization in a vineyard soil amended with grape marc vermicompost. Waste Manag. Res. 2011, 29, 1177–1184. [Google Scholar] [CrossRef]
  10. Aber, J.D.; Nadelhoffer, K.J.; Steudler, P.; Melillo, J.M. Nitrogen saturation in northern forest ecosystems. BioScience 1989, 39, 286–378. [Google Scholar] [CrossRef]
  11. Yu, J.; Ahmedna, M. Functional components of grape pomace: Their composition, biological properties and potential applications. Int. J. Food Sci. Technol. 2013, 48, 221–237. [Google Scholar] [CrossRef]
  12. Lorrain, B.; Chira, K.; Teissedre, P.-L. Phenolic composition of Merlot and Cabernet-Sauvignon grapes from Bordeaux vineyard for the 2009-vintage: Comparison to 2006, 2007 and 2008 vintages. Food Chem. 2011, 126, 1991–1999. [Google Scholar] [CrossRef] [PubMed]
  13. Deng, Q.; Penner, M.H.; Zhao, Y. Chemical composition of dietary fiber and polyphenols of five different varieties of wine grape pomace skins. Food Res. Int. 2011, 44, 2712–2720. [Google Scholar] [CrossRef]
  14. Ruberto, G.; Renda, A.; Daquino, C.; Amico, V.; Spatafora, C.; Tringali, C.; De Tommasi, N. Polyphenol constituents and antioxidant activity of grape pomace extracts from five Sicilian red grape cultivars. Food Chem. 2007, 100, 203–210. [Google Scholar] [CrossRef]
  15. Hättenschwiler, S.; Vitousek, P.M. The role of polyphenols in terrestrial ecosystem nutrient cycling. Trends Ecol. Evol. 2000, 15, 238–243. [Google Scholar] [CrossRef]
  16. Šoln, K.; Horvat, M.; Iskra, J.; Dolenc Koce, J. Inhibitory effects of methanol extracts from Fallopia japonica and F.× bohemica rhizomes and selected phenolic compounds on radish germination and root growth. Chemoecology 2022, 32, 159–170. [Google Scholar] [CrossRef]
  17. Girardi, J.P.; Korz, S.; Muñoz, K.; Jamin, J.; Schmitz, D.; Rösch, V.; Riess, K.; Schützenmeister, K.; Jungkunst, H.F.; Brunn, M. Nitrification inhibition by polyphenols from invasive Fallopia japonica under copper stress. J. Plant Nutr. Soil Sci. 2022, 185, 923–934. [Google Scholar] [CrossRef]
  18. Tang, S.; Ma, Q.; Luo, J.; Xie, Y.; Pan, W.; Zheng, N.; Liu, M.; Wu, L. The inhibition effect of tea polyphenols on soil nitrification is greater than denitrification in tea garden soil. Sci. Total Environ. 2021, 778, 146328. [Google Scholar] [CrossRef]
  19. McCarty, G.; Bremner, J. Effects of phenolic compounds on nitrification in soil. Soil Sci. Soc. Am. J. 1986, 50, 920–923. [Google Scholar] [CrossRef]
  20. Silva, A.; Silva, V.; Igrejas, G.; Aires, A.; Falco, V.; Valentão, P.; Poeta, P. Phenolic compounds classification and their distribution in winemaking by-products. Eur. Food Res. Technol. 2022, 249, 207–239. [Google Scholar] [CrossRef]
  21. Bustamante, M.; Pérez-Murcia, M.; Paredes, C.; Moral, R.; Pérez-Espinosa, A.; Moreno-Caselles, J. Short-term carbon and nitrogen mineralisation in soil amended with winery and distillery organic wastes. Bioresour. Technol. 2007, 98, 3269–3277. [Google Scholar] [CrossRef] [PubMed]
  22. Gaines, T.; Gaines, S. Soil texture effect on nitrate leaching in soil percolates. Commun. Soil Sci. Plant Anal. 1994, 25, 2561–2570. [Google Scholar] [CrossRef]
  23. Schmidt, M.A.; Halvorson, J.J.; Gonzalez, J.M.; Hagerman, A.E. Kinetics and binding capacity of six soils for structurally defined hydrolyzable and condensed tannins and related phenols. J. Soils Sediments 2012, 12, 366–375. [Google Scholar] [CrossRef]
  24. OECD. Test No. 106: Adsorption—Desorption Using a Batch Equilibrium Method, OECD Guidelines for the Testing of Chemicals, Section 1. 2001. Available online: https://www.oecd-ilibrary.org/environment/test-no-106-adsorption-desorption-using-a-batch-equilibrium-method_9789264069602-en (accessed on 27 March 2023).
  25. OECD. Test No. 312: Leaching in Soil Columns, OECD Guidelines for the Testing of Chemicals, Section 3. 2004. Available online: https://www.oecd-ilibrary.org/docserver/9789264070561-en.pdf?expires=1683861245&id=id&accname=guest&checksum=D184AF9B705D71ECB45846F10E30A5F2 (accessed on 27 March 2023).
  26. Muñoz, K.; Schmidt-Heydt, M.; Stoll, D.; Diehl, D.; Ziegler, J.; Geisen, R.; Schaumann, G. Effect of plastic mulching on mycotoxin occurrence and mycobiome abundance in soil samples from asparagus crops. Mycotoxin Res. 2015, 31, 191–201. [Google Scholar] [CrossRef] [PubMed]
  27. Fuchs, C.; Bakuradze, T.; Steinke, R.; Grewal, R.; Eckert, G.P.; Richling, E. Polyphenolic composition of extracts from winery by-products and effects on cellular cytotoxicity and mitochondrial functions in HepG2 cells. J. Funct. Foods 2020, 70, 103988. [Google Scholar] [CrossRef]
  28. Attard, E. A rapid microtitre plate Folin-Ciocalteu method for the assessment of polyphenols. Open Life Sci. 2013, 8, 48–53. [Google Scholar] [CrossRef]
  29. ASTM (American Society for Testing and Materials), D6913 Standard Test Method for Particle-Size Analysis of Soils. 2009. Available online: https://www.astm.org/d6913-04r09e01.html (accessed on 27 March 2023).
  30. Steinmetz, Z.A.J.; Kenngott, K. Envalysis: Miscellaneous Functions for Environmental Analyses; R Package Version 0.5.4. 2022. Available online: https://cran.rstudio.com/web/packages/envalysis/index.html (accessed on 27 March 2023).
  31. Bernard, J.M. Forest floor moisture capacity of the New Jersey pine barrens. Ecology 1963, 44, 574–576. [Google Scholar] [CrossRef]
  32. Campbell, C.D.; Chapman, S.J.; Cameron, C.M.; Davidson, M.S.; Potts, J.M. A Rapid Microtiter Plate Method To Measure Carbon Dioxide Evolved from Carbon Substrate Amendments so as To Determine the Physiological Profiles of Soil Microbial Communities by Using Whole Soil. Appl. Environ. Microbiol. 2003, 69, 3593–3599. [Google Scholar] [CrossRef] [PubMed]
  33. Albert, J.; More, C.; Korz, S.; Muñoz, K. Soil Microbial Responses to Aflatoxin Exposure: Consequences for Biomass, Activity and Catabolic Functionality. Soil Syst. 2023, 7, 23. [Google Scholar] [CrossRef]
  34. Vance, E.D.; Brookes, P.C.; Jenkinson, D.S. Microbial biomass measurements in forest soils: The use of the chloroform fumigation-incubation method in strongly acid soils. Soil Biol. Biochem. 1987, 19, 697–702. [Google Scholar] [CrossRef]
  35. Nishimura, H. Effect of the anthraquinones emodin and physcion on availability of selected soil inorganic ions. Ann. Appl. Biol. 1999, 135, 425–429. [Google Scholar]
  36. Arafat, H.A.; Franz, M.; Pinto, N.G. Effect of salt on the mechanism of adsorption of aromatics on activated carbon. Langmuir 1999, 15, 5997–6003. [Google Scholar] [CrossRef]
  37. Wickham, H.; Averick, M.; Bryan, J.; Chang, W.; McGowan, L.D.A.; François, R.; Grolemund, G.; Hayes, A.; Henry, L.; Hester, J. Welcome to the Tidyverse. J. Open Source Softw. 2019, 4, 1686. [Google Scholar] [CrossRef]
  38. Kassambara, A. Rstatix: Pipe-Friendly Framework for Basic Statistical Tests. R Package Version 0.7. 0. 2021. Available online: https://CRAN.R-project.org/package=rstatix (accessed on 27 March 2023).
  39. Signorell, A.; Aho, K.; Alfons, A.; Anderegg, N.; Aragon, T.; Arppe, A.; Baddeley, A.; Barton, K.; Bolker, B.; Borchers, H.W. DescTools: Tools for descriptive statistics. R Package Version 0.99 2019, 28, 17. [Google Scholar]
  40. Sousa, E.C.; Uchôa-Thomaz, A.M.A.; Carioca, J.O.B.; Morais, S.M.d.; Lima, A.d.; Martins, C.G.; Alexandrino, C.D.; Ferreira, P.A.T.; Rodrigues, A.L.M.; Rodrigues, S.P. Chemical composition and bioactive compounds of grape pomace (Vitis vinifera L.), Benitaka variety, grown in the semiarid region of Northeast Brazil. Food Sci. Technol. 2014, 34, 135–142. [Google Scholar] [CrossRef]
  41. Spigno, G.; Tramelli, L.; De Faveri, D.M. Effects of extraction time, temperature and solvent on concentration and antioxidant activity of grape marc phenolics. J. Food Eng. 2007, 81, 200–208. [Google Scholar] [CrossRef]
  42. Amendola, D.; De Faveri, D.M.; Spigno, G. Grape marc phenolics: Extraction kinetics, quality and stability of extracts. J. Food Eng. 2010, 97, 384–392. [Google Scholar] [CrossRef]
  43. Martins, I.M.; Roberto, B.S.; Blumberg, J.B.; Chen, C.-Y.O.; Macedo, G.A. Enzymatic biotransformation of polyphenolics increases antioxidant activity of red and white grape pomace. Food Res. Int. 2016, 89, 533–539. [Google Scholar] [CrossRef]
  44. Kammerer, D.; Claus, A.; Carle, R.; Schieber, A. Polyphenol screening of pomace from red and white grape varieties (Vitis vinifera L.) by HPLC-DAD-MS/MS. J. Agric. Food Chem. 2004, 52, 4360–4367. [Google Scholar] [CrossRef]
  45. Guerra-Rivas, C.; Gallardo, B.; Mantecón, Á.R.; del Álamo-Sanza, M.; Manso, T. Evaluation of grape pomace from red wine by-product as feed for sheep. J. Sci. Food Agric. 2017, 97, 1885–1893. [Google Scholar] [CrossRef]
  46. Winkler, A.; Weber, F.; Ringseis, R.; Eder, K.; Dusel, G. Determination of polyphenol and crude nutrient content and nutrient digestibility of dried and ensiled white and red grape pomace cultivars. Arch. Anim. Nutr. 2015, 69, 187–200. [Google Scholar] [CrossRef] [PubMed]
  47. Valiente, C.; Arrigoni, E.; Esteban, R.; Amado, R. Grape pomace as a potential food fiber. J. Food Sci. 1995, 60, 818–820. [Google Scholar] [CrossRef]
  48. Goñí, I.; Brenes, A.; Centeno, C.; Viveros, A.; Saura-Calixto, F.; Rebolé, A.; Arija, I.; Estevez, R. Effect of dietary grape pomace and vitamin E on growth performance, nutrient digestibility, and susceptibility to meat lipid oxidation in chickens. Poult. Sci. 2007, 86, 508–516. [Google Scholar] [CrossRef] [PubMed]
  49. Chikwanha, O.C.; Raffrenato, E.; Muchenje, V.; Musarurwa, H.T.; Mapiye, C. Varietal differences in nutrient, amino acid and mineral composition and in vitro rumen digestibility of grape (Vitis vinifera) pomace from the Cape Winelands vineyards in South Africa and impact of preservation techniques. Ind. Crops Prod. 2018, 118, 30–37. [Google Scholar] [CrossRef]
  50. Barriga-Sánchez, M.; Hiparraguirre, H.C.; Rosales-Hartshorn, M. Chemical composition and mineral content of Black Borgoña (Vitis labrusca L.) grapes, pomace and seeds, and effects of conventional and non-conventional extraction methods on their antioxidant properties. Food Sci. Technol. 2022, 42, e120021. [Google Scholar] [CrossRef]
  51. Rodríguez-Morgado, B.; Candiracci, M.; Santa-María, C.; Revilla, E.; Gordillo, B.; Parrado, J.; Castaño, A. Obtaining from grape pomace an enzymatic extract with anti-inflammatory properties. Plant Foods Hum. Nutr. 2015, 70, 42–49. [Google Scholar] [CrossRef]
  52. Fontana, A.R.; Antoniolli, A.; Bottini, R.n. Grape pomace as a sustainable source of bioactive compounds: Extraction, characterization, and biotechnological applications of phenolics. J. Agric. Food Chem. 2013, 61, 8987–9003. [Google Scholar] [CrossRef]
  53. Ferjani, A.I.; Jellali, S.; Akrout, H.; Limousy, L.; Hamdi, H.; Thevenin, N.; Jeguirim, M. Nutrient retention and release from raw exhausted grape marc biochars and an amended agricultural soil: Static and dynamic investigation. Environ. Technol. Innov. 2020, 19, 100885. [Google Scholar] [CrossRef]
  54. Northup, R.R.; Yu, Z.; Dahlgren, R.A.; Vogt, K.A. Polyphenol control of nitrogen release from pine litter. Nature 1995, 377, 227–229. [Google Scholar] [CrossRef]
  55. Matus, F.J.; Lusk, C.H.; Maire, C.R. Effects of soil texture, carbon input rates, and litter quality on free organic matter and nitrogen mineralization in Chilean rain forest and agricultural soils. Commun. Soil Sci. Plant Anal. 2007, 39, 187–201. [Google Scholar] [CrossRef]
  56. Murphy, D.; Macdonald, A.; Stockdale, E.a.; Goulding, K.; Fortune, S.; Gaunt, J.; Poulton, P.; Wakefield, J.; Webster, C.; Wilmer, W. Soluble organic nitrogen in agricultural soils. Biol. Fertil. Soils 2000, 30, 374–387. [Google Scholar] [CrossRef]
  57. Garcıa-Gil, J.; Ceppi, S.; Velasco, M.; Polo, A.; Senesi, N. Long-term effects of amendment with municipal solid waste compost on the elemental and acidic functional group composition and pH-buffer capacity of soil humic acids. Geoderma 2004, 121, 135–142. [Google Scholar] [CrossRef]
  58. Latifah, O.; Ahmed, O.H.; Majid, N.M.A. Soil pH buffering capacity and nitrogen availability following compost application in a tropical acid soil. Compos. Sci. Util. 2018, 26, 1–15. [Google Scholar] [CrossRef]
  59. Naramabuye, F.; Haynes, R.J. Effect of organic amendments on soil pH and Al solubility and use of laboratory indices to predict their liming effect. Soil Sci. 2006, 171, 754–763. [Google Scholar] [CrossRef]
  60. Brahim, M.; Gambier, F.; Brosse, N. Optimization of polyphenols extraction from grape residues in water medium. Ind. Crops Prod. 2014, 52, 18–22. [Google Scholar] [CrossRef]
  61. Hájek, M.; Jiménez-Alfaro, B.; Hájek, O.; Brancaleoni, L.; Cantonati, M.; Carbognani, M.; Dedić, A.; Dítě, D.; Gerdol, R.; Hájková, P. A European map of groundwater pH and calcium. Earth Syst. Sci. Data 2021, 13, 1089–1105. [Google Scholar] [CrossRef]
  62. Kurtz, M.P.; Dag, A.; Zipori, I.; Laor, Y.; Buchmann, C.; Saadi, I.; Medina, S.; Raviv, M.; Zchori-Fein, E.; Schaumann, G.E. Toward Balancing the Pros and Cons of Spreading Olive Mill Wastewater in Irrigated Olive Orchards. Processes 2021, 9, 780. [Google Scholar] [CrossRef]
  63. Sang, S.; Lee, M.-J.; Hou, Z.; Ho, C.-T.; Yang, C.S. Stability of tea polyphenol (−)-epigallocatechin-3-gallate and formation of dimers and epimers under common experimental conditions. J. Agric. Food Chem. 2005, 53, 9478–9484. [Google Scholar] [CrossRef]
  64. Chethan, S.; Malleshi, N. Finger millet polyphenols: Optimization of extraction and the effect of pH on their stability. Food Chem. 2007, 105, 862–870. [Google Scholar] [CrossRef]
  65. Zeng, L.; Ma, M.; Li, C.; Luo, L. Stability of tea polyphenols solution with different pH at different temperatures. Int. J. Food Prop. 2017, 20, 1–18. [Google Scholar] [CrossRef]
  66. Vernhet, A.; Pellerin, P.; Prieur, C.; Osmianski, J.; Moutounet, M. Charge properties of some grape and wine polysaccharide and polyphenolic fractions. Am. J. Enol. Vitic. 1996, 47, 25–30. [Google Scholar] [CrossRef]
  67. Dong, X.; Feng, R.; Yang, X.; Jiang, Y.; Chen, L.; Chen, L.; Jiang, C.; Cai, T. Complexation and reduction of soil iron minerals by natural polyphenols enhance persulfate activation for the remediation of triphenyl phosphate (TPHP)-contaminated soil. Chem. Eng. J. 2022, 435, 134610. [Google Scholar] [CrossRef]
  68. Min, K.; Freeman, C.; Kang, H.; Choi, S.-U. The regulation by phenolic compounds of soil organic matter dynamics under a changing environment. BioMed Res. Int. 2015, 2015, 825098. [Google Scholar] [CrossRef] [PubMed]
  69. Avneri-Katz, S.; Young, R.B.; McKenna, A.M.; Chen, H.; Corilo, Y.E.; Polubesova, T.; Borch, T.; Chefetz, B. Adsorptive fractionation of dissolved organic matter (DOM) by mineral soil: Macroscale approach and molecular insight. Org. Geochem. 2017, 103, 113–124. [Google Scholar] [CrossRef]
  70. Mutabaruka, R.; Hairiah, K.; Cadisch, G. Microbial degradation of hydrolysable and condensed tannin polyphenol–protein complexes in soils from different land-use histories. Soil Biol. Biochem. 2007, 39, 1479–1492. [Google Scholar] [CrossRef]
  71. Sinsabaugh, R.L. Phenol oxidase, peroxidase and organic matter dynamics of soil. Soil Biol. Biochem. 2010, 42, 391–404. [Google Scholar] [CrossRef]
  72. Buchmann, C.; Felten, A.; Peikert, B.; Muñoz, K.; Bandow, N.; Dag, A.; Schaumann, G. Development of phytotoxicity and composition of a soil treated with olive mill wastewater (OMW): An incubation study. Plant Soil 2015, 386, 99–112. [Google Scholar] [CrossRef]
  73. Schroeder, J.; Kammann, L.; Helfrich, M.; Tebbe, C.C.; Poeplau, C. Impact of common sample pre-treatments on key soil microbial properties. Soil Biol. Biochem. 2021, 160, 108321. [Google Scholar] [CrossRef]
  74. Čerevková, A.; Bobuľská, L.; Miklisová, D.; Renčo, M. A case study of soil food web components affected by Fallopia japonica (Polygonaceae) in three natural habitats in Central Europe. J. Nematol. 2019, 51, e2019-42. [Google Scholar] [CrossRef]
  75. Qu, X.; Wang, J. Effect of amendments with different phenolic acids on soil microbial biomass, activity, and community diversity. Appl. Soil Ecol. 2008, 39, 172–179. [Google Scholar] [CrossRef]
  76. Scholz; Williamson. Interactions affecting the bioavailability of dietary polyphenols in vivo. Int. J. Vitam. Nutr. Res. 2007, 77, 224–235. [Google Scholar] [CrossRef] [PubMed]
  77. Halake, K.; Birajdar, M.; Lee, J. Structural implications of polyphenolic antioxidants. J. Ind. Eng. Chem. 2016, 35, 1–7. [Google Scholar] [CrossRef]
  78. Ma, X.; Jacoby, P.W.; Sanguinet, K.A. Improving net photosynthetic rate and rooting depth of grapevines through a novel irrigation strategy in a semi-arid climate. Front. Plant Sci. 2020, 11, 575303. [Google Scholar] [CrossRef]
  79. Tamimi, N.; Schaumann, G.E.; Diehl, D. The fate of organic matter brought into soil by olive mill wastewater application at different seasons. J. Soils Sediments 2017, 17, 901–916. [Google Scholar] [CrossRef]
  80. Hamilton, N.E.; Ferry, M. ggtern: Ternary diagrams using ggplot2. J. Stat. Softw. 2018, 87, 1–17. [Google Scholar] [CrossRef]
Figure 1. Total C (a) and N (b) content in three different soils depths and leachate. R01A represents an agricultural sandy loam, R02A a silt loam reference soil. Error bars indicate the standard deviation of three column replicates. Statistical differences are analyzed with a Dunnett test comparing the values to the untreated reference group via a t-test (C = Control, DF = Dornfelder, RS = Riesling, PN = Pinot noir, PB = Pinot blanc). Significant differences are indicated as ns: p > 0.05, *: p ≤ 0.05, **: p ≤ 0.01, ****: p ≤ 0.0001.
Soilsystems 07 00049 g001
Figure 2. TPC in three different soil depths, leachate and total content. R01A represents an agricultural sandy loam, R02A a silt loam reference soil. Vertical lines indicate the mass balance between leaching and maximum aqueous extractable total polyphenolic content (TPC) of fresh grape pomace (GP; rainwater experiment). Points indicate the recovery (%) between total and soil water-extractable TPC. Mean values of the total content were set to 100%. Numbers indicate the recovery (%) of soil water-extractable content based on maximum aqueous-extractable TPC. Blank treatments were subtracted from GP treatments.
Soilsystems 07 00049 g002
Table 2. Chemical characterization of four grape pomace varieties based on the C, N and total polyphenolic content (TPC) in the GP, expressed as dry weight (dw) equivalents. Pomace water contents (WC) are expressed in % fresh weight (fw). The errors are given as the standard deviation (n = 3).
DornfelderPinot NoirRiesling Pinot Blanc
Total C (% dw)50.2 ± 0.148.4 ± 0.143.9 ± 0.243.3 ± 0.2
Total N (% dw)2.4 ± 0.02.4 ± 0.01.3 ± 0.01.2 ± 0.0
C/N21.120.234.436.0
TPC (% dw)4.5 ± 0.34.7 ± 0.21.7 ± 2.22.3 ± 3.1
WC (% fw)66 ± 0.259 ± 1.266 ± 1.367 ± 0.5
Table 3. Chemical characterization of four grape pomace varieties based on the C, N, total polyphenolic content (TPC) and pH in the rainwater extract fraction at 1:5 ratio (GP/water). Values in parentheses indicate the % of recovery from the respective GP variety based on dry substance of a 1:5 and 1:10 ratio.
DornfelderPinot NoirRiesling Pinot BlancSignificance
Total C (g L−1)9.3 ± 0.1 (27; 30)8.4 ± 0.3 (21; 24)11.2 ± 1.1 (31; 32)12.8 ± 7.6 (46; 48)****
Total N (mg L−1)229 ± 23 (11)354 ± 52 (15)230 ± 105 (17)287 ± 66 (29)n.s.
C/N55 ± 829 ± 791 ± 6659 ± 15n.s.
TPC (µg L−1)311 ± 16 (10; 13)283 ± 97 (7; 11)129 ± 66 (9; 15)115 ± 36 (8; 13)n.s.
pH solution4.0 ± 0.03.9 ± 0.04.1 ± 0.04.3 ± 0.0****
Statistical differences of parameters between varieties are calculated via an analysis of variance (ANOVA) and indicated as: n.s.—p > 0.05, ****—p ≤ 0.0001.
Table 4. pH values of three soil depths and leachate samples. R01A represents an agricultural sandy loam, R02A a silt loam reference soil. The error is given by the standard deviation of three column replicates. Statistical differences are analyzed using a Dunnett test comparing the values to the untreated reference group via a t-test.
GP VarietyR01AR02AVineyard
0–10 cmControl5.69 ± 0.146.90 ± 0.137.05 ± 0.04
Dornfelder5.71 ± 0.046.96 ± 0.067.23 ± 0.02 *
Pinot Noir5.76 ± 0.106.97 ± 0.257.26 ± 0.13
Riesling5.64 ± 0.076.61 ± 0.417.10 ± 0.06
Pinot Blanc5.67 ± 0.036.73 ± 0.156.99 ± 0.05
10–20 cmControl5.60 ± 0.056.97 ± 0.097.13 ± 0.01
Dornfelder5.69 ± 0.077.03 ± 0.077.32 ± 0.04 *
Pinot Noir5.73 ± 0.117.09 ± 0.107.36 ± 0.07
Riesling5.66 ± 0.066.98 ± 0.087.27 ± 0.14
Pinot Blanc5.65 ± 0.036.95 ± 0.107.26 ± 0.10
20–30 cmControl5.69 ± 0.057.03 ± 0.087.19 ± 0.04
Dornfelder5.74 ± 0.097.09 ± 0.077.36 ± 0.04 *
Pinot Noir5.77 ± 0.087.12 ± 0.077.39 ± 0.07
Riesling5.70 ± 0.057.07 ± 0.117.36 ± 0.06
Pinot Blanc5.65 ± 0.127.04 ± 0.087.33 ± 0.07
LeachateControl7.18 ± 0.538.58 ± 0.138.98 ± 0.12
Dornfelder7.50 ± 0.898.30 ± 0.148.88 ± 0.11
Pinot Noir7.09 ± 1.027.73 ± 0.408.86 ± 0.27
Riesling6.47 ± 0.457.41 ± 0.07 **8.24 ± 0.39
Pinot Blanc6.42 ± 0.647.58 ± 0.666.48 ± 0.31 **
Significant differences are indicated as *: p ≤ 0.05, **: p ≤ 0.01. pH of soil samples was measured according to DIN ISO 10,390 at a 1:5 ratio in a 0.01 M CaCl2 solution after 2 h of equilibration.
Disclaimer/Publisher’s Note: The statements, opinions and data contained in all publications are solely those of the individual author(s) and contributor(s) and not of MDPI and/or the editor(s). MDPI and/or the editor(s) disclaim responsibility for any injury to people or property resulting from any ideas, methods, instructions or products referred to in the content.

