Abstract
The conversion from native forest to other land-use systems can decline the soil organic carbon (SOC) in tropical soils. However, conservationist management could mitigate SOC losses, promoting the functioning and stability of agricultural soils. This study aimed to address the influence of conversion from native forest to different land-use systems on SOC fractions in Northeastern Brazil. Topsoil soil samples were collected in areas under pasture (PAS), no-tillage (NT1 and NT2), eucalyptus (EUC), and native forests of Cerrado in Northeastern, Brazil. Total organic C, microbial biomass (MBC), particulate (POC), and mineral-occluded organic C (MOC), as well as fulvic acids (C-FA), humic acids (C-HA), and humin (C-HUM) fractions were accessed. The results showed that land conversion maintained similar levels of humic fractions and total organic carbon (TOC) stocks in the PAS, NT1, NT2, and EUC as compared to native Cerrado. Soils with the input of permanent and diverse fresh organic material, such as NT2, PAS, and EUC, presented high levels of MBC and POC, and the lowest C-FA:TOC and C-HA:TOC ratios. The land conversion to agricultural systems that include cropping rotations associated with pasture species such as Mombasa grass and eucalyptus prevents topsoil losses of active C compartments in the Cerrado of the Brazilian Northeast. It suggests that sustainable and conservationist management should be emphasized to maintain and improve the status of soil organic C.
1. Introduction
The conversion of native forests to agricultural land-use and management systems has promoted changes in soil properties and functions [1,2] mainly leading to a decline in soil organic C (SOC) [3]. This is particularly important to tropical soils since they present naturally low SOC content and significant C losses after the adoption of intensive land use [4]. Indeed, previous studies have shown that the conversion of tropical forests to intensive land use decreased by about 25% to 32% of the SOC content [5,6,7]. On the other hand, conservationist land uses can decrease the C losses and bring positive effects on SOC content [8,9].
SOC is an essential component for the suitable functioning and stability of soils, influencing their chemical, physical, and biological properties [10,11]. This component presents different fractions, being characterized as humic and non-humic, which have different recycling times and forms of protection [12]. The humic fractions (HF) represent the greatest fraction of SOC, which is highly persistent and stable [13], and contains three main compartments known as fulvic acids (C-FA), humic acids (C-HA), and humins (C-HUM) [14]. On the other hand, non-humic fractions (NHF) consist of a wide range of soluble substances and present more sensitivity to changes due to their rapid turnover [15]. Thus, the distinct characteristics presented by these SOC fractions may confer higher or lower stability, mainly against the effects of the conversion of native forests to different land-use and management systems.
Interestingly, it is well-known that land-use change affects the SOC content, especially in the topsoil layers. For example, a meta-analysis performed by Angers et al., and Luo et al. [16,17], demonstrated that the conservationist no-tillage (NT) system increased SOC concentration in the upper topsoil layers and the effects of NT on SOC stocks were particularly significant at a depth of 0.10 m. Similarly, Haddaway et al. [18] found that significant differences in SOC stocks across different soil management systems were noticeable in the upper soil layer and the effects disappeared when considering the full profile up to 150 cm depth. Increased SOC content in the topsoil is a relevant aspect of soil quality, considering that the soil surface is a vital interface associated with mechanisms that affect soil productivity and its environmental quality [19,20]. However, little information is available about the effects of the conversion from native forest to different land-use systems on SOC fractions in the uppermost layer of tropical soils. This is important since each fraction distinctly influences the soil functioning [21]. In addition, the assessment of SOC fractions will provide knowledge about how different land-use or management systems affect the potential losses, accumulation, mineralization, and humification processes of SOC [22,23].
In Northeastern Brazil, different land-use systems are adopted, such as no-tillage, silviculture, and pastures, which can distinctly influence the SOC status. For instance, previous studies in Brazil found that no-tillage practices increased the SOC content as compared to conventional farming [24], while the pasture system increased the SOC content as compared to a native forest [25]. In silvicultural systems, Araujo et al. [26] observed that the cultivation of eucalyptus did not reduce the SOC content as compared to native forests.
Although studies have reported positive or no significant changes in no-tillage, silviculture, and pastures on SOC content [27], little is known about the effects of these systems on SOC fractions and stocks in the topsoil of a Cerrado from the Northeast of Brazil. Here, we hypothesize that SOC and C fractions in the topsoil of areas converted from native Cerrado vegetation in the Brazilian Northeast are differently influenced by distinct agricultural systems. We also hypothesize that topsoil C status in well-managed agricultural systems can be maintained at similar values to those found in native vegetation. Our objective was to study the influence of no-tillage, eucalyptus, and pasture on SOC fractions and stock in soils from Northeastern Brazil.
2. Materials and Methods
2.1. Study Site
This study was carried out at Farm New Zealand, Uruçuí, PI, Brazil (07°33′08″ S and 44°36′45″ W; 378 m above sea level). The climate is Aw (Köppen) and the average temperature and rainfall are 27 °C and 817 mm, respectively [28]. The rainy season extends from November to May and the dry season, from June to October. The soil is classified as Oxisol (Yellow Latosol) [26]. In this study, four management systems were evaluated as follows: pasture (PAS); no-tillage with soybean, under maize straw, in a soybean/maize succession (NT1); no-tillage with maize, under grass straw, in a soybean/maize/Mombasa rotation (NT2); and eucalyptus (EUC) (Figure 1; Table S1). As a reference, we evaluated a native Cerrado forest (NF).
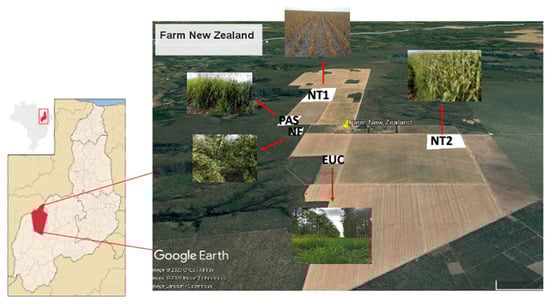
Figure 1.
Map of Farm New Zealand showing the evaluated areas. PAS: Pasture species (Mombasa); NT1 and NT2: No-tillage system; EUC: Eucalyptus; NF: Native Cerrado forest.
The management systems PAS, NT1, and NT2 started in the 2004/2005 cropping season after the conversion of a native Cerrado to agricultural land use. After native forest removal, all areas received the application of lime (6 Mg ha−1), which was incorporated at a depth of 0.22 m, using a 28 in disc plow. The area under EUC was implanted in the 2005/2006 cropping season using clones of Eucalyptus urograndis planted in the spacing of 3 m × 1.5 m (totalizing ~2200 plants per h), with each row spaced 14 m between them. Between the rows, rice followed by cowpea was sown and fertilized with 300 kg ha−1 of NPK 10-30-10. In the 2006/2007 cropping season, soybeans were sown using fertilization of 350 kg ha−1 of NPK 5-20-20. After soybean harvesting, Mombasa grass was sown for grazing. Fertilization during the implantation of the pasture was done using 150 kg ha−1 of NPK 06-21-06, containing 12% Ca, 3% S, and 0.3% Zn (w/w). Topdressing fertilization in the Mombasa grass between EUC rows was performed in March/2006, January/2007, and January/2008, with 200 kg ha−1 of NPK 20-00-20. The Mombasa grass was used for grazing at a stocking rate of 2.4 cow units ha−1 until 2009 and remained fallow from 2010 to 2017.
The NT1 area was cultivated with soybeans for two years following the conversion from native Cerrado. In 2007, maize was sown, followed by soybean (2008), millet (2009), maize, for two years (2009 and 2010), and cotton (2011). From this point, a maize/soybean succession was established until 2017, when soybeans were cultivated. In NT2, after native Cerrado conversion and in the same area, soybeans were sown followed by Mombasa grass used for grazing at a density of 2.4 animal unit ha−1. This was repeated from 2006 to 2009. After 2010, a sequence of soybean/millet, cotton, maize, and soybean was used, and in 2016 Mombasa grass was sown followed by maize. The PAS area followed the same crop sequence as in NT1 until 2015. Mombasa grass was implanted in 2016 in the area for grazing at a density of 2.4 animal units ha−1. In 2017, forage grass was desiccated with glyphosate and maize was cultivated.
The areas NT1, NT2, and PAS were fertilized according to the requirements of each plant species cultivated [29]. In 2011, dolomitic limestone was applied at 2.5 t ha−1. In 2015, gypsum was applied at 1 t ha−1, along with mono-ammonium phosphate at 160 kg ha−1, potassium chloride at 120 kg ha−1, ammonium sulfate at 250 kg ha−1, and urea at 230 kg ha−1.
2.2. Soil Sampling and Chemical Analysis
Soil sampling was performed in May 2017, at the end of the rainy season. The area within each management system was divided into five transects 20 m spaced from each other. In EUC, as a strategy to cover the complete system in a more representative way, each transect included samplings from the eucalyptus rows, the eucalyptus canopy projection outside the rows, and between the eucalyptus rows (Figure S1). Within each transect, five soil subsamples were taken (0–0.10 m depth) at points 20 m spaced apart. The five subsamples collected in each transect were pooled together to form a composite soil sample. In total, five replications (each one representing the composite sample from transects) were considered in each treatment (consisting of a total of 25 soil samples) covering an area of approximately 1 ha. Soil samples were sieved (2 mm) and homogenized for soil analysis. Soil pH was evaluated in a 1:2.5 soil/water extract; Ca2+, Mg2+, and Al3+ were extracted with KCl 1 mol L−1 − Ca2+ and Mg2+ were determined by atomic absorption spectrometry and Al3+ by titration; potential acidity (H+Al) was determined via extraction with 0.5 mol L−1 of calcium acetate and quantified by titration; and K+ and available P were extracted with Mehlich-1 (H2SO4 0.0125 mol L−1 and of HCl 0.050 mol L−1)—the determination of K concentration was made through flame photometry and P was determined by colorimetry [30]. The values of the chemical properties are shown in Table S2.
2.3. Analysis of SOC Fractions
The soil microbial biomass carbon and nitrogen (MBC) were analyzed by the irradiation–extraction method [31,32] and the soil basal respiration was determined by quantifying CO2 released after 7 days of incubation, under aerobic conditions in soil samples, with moisture content adjusted to 60% of field capacity [30]. The metabolic quotient (qCO2) was obtained by the relationship between the soil basal respiration and MBC, according to the methodology described by Alef [33].
Total organic carbon (TOC) contents were determined by the 990.03 combustion method [34], employing an auto-analyzer, Leco CN628 (Leco Corp., St. Joseph. MI, USA). Carbon stock (C-stock) was obtained by the method of soil mass correction, using the soil bulk density (Ds) measured in the areas of each treatment and the native Cerrado forest as a reference [35]. This approach eliminates the influence of different soil bulk densities in over- or under-estimating the total C-stock across soil management systems. C-stock was calculated using the expression: C-stock= (TOC × Ds × ts), where ts represents the thickness of the soil layer considered.
Humic substance fractioning was performed according to the differential solubility technic, using the concepts of humic fractions established by the International Humic Substances Society, developed by [36], by obtaining the values of fulvic acids (C-FA), humic acids (C-HA), and humins (C-HUM). Physical fractioning of soil organic matter was performed according to [37], by obtaining the values of particulate organic carbon (POC) and mineral organic carbon (MOC).
2.4. Statistical Analysis
The soil was very homogenous across the different treatments. The data referring to soil biological attributes, carbon stocks, and chemical and physical fractioning of soil organic matter were checked for normality and homogeneity of variances and submitted for a one-way ANOVA, according to a completely randomized design. When significant, data were compared using the Tukey test (5% of probability). Additionally, a multivariate analysis was performed to compare the structure of SOC fractions among treatments using the principal components analysis (PCA) on log-transformed data. To explore the relationship between soil C fractions and microbial attributes, Spearman’s rank correlation coefficients were applied, and the correction was made using Benjamini–Hochberg false discovery rate (FDR) method. Heatmaps were generated to further check for correlations. Significant (p < 0.05) positive and negative correlations are represented in blue and red, respectively. All statistical analyses were performed using the R software [38].
3. Results
The results showed no significant differences in humic fractions (C-HA, C-FA, and C-HUM) between the evaluated areas (Figure 2). In contrast, the microbial fraction (MBC) varied between sites. The topsoil in pasture and eucalyptus presented higher MBC values (124.7 and 117.3 mg kg−1, respectively) than NT1 (54.6 mg kg−1) and the native forest (69.9 mg kg−1), while NT2 (97.7 mg kg−1) had similar MBC values than the other sites.
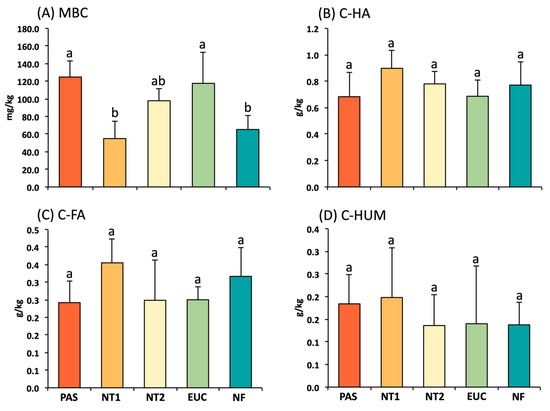
Figure 2.
Microbial biomass carbon (MBC) (A), humic acid (C-HA) (B), fulvic acid (C-FA) (C), and humin (C-HUM) (D) fractions in the 0–0.10 m depth. Vertical lines on the bars indicate standard errors of means (n = 5). Treatments with different letters on the bars are significantly different (p ≤ 0.05) by the Tukey test. PAS: Pasture species (Mombasa); NT1 and NT2: No-tillage system; EUC: Eucalyptus; and NF: Native Cerrado forest.
The values of MOC, TOC, and C-stock in topsoil did not vary between the areas under different management systems and the native forest. However, POC values in the topsoil were higher under native forest (0.047 g kg−1) than under NT1 (0.022 g kg−1) (Figure 3). The POC values under NT2 (0.026 g kg−1), pasture (0.027 g kg−1), and eucalyptus (0.031 g kg−1) did not differ from each other, and native forest and NT1.
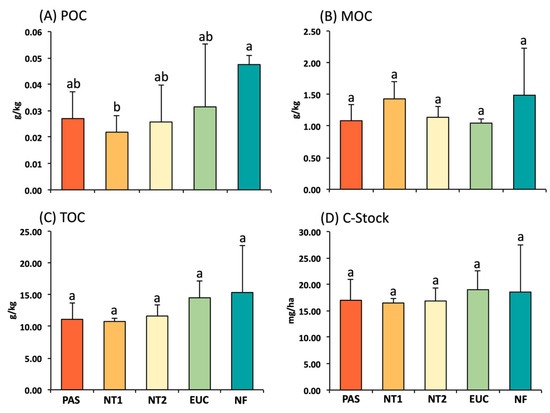
Figure 3.
Particulate organic carbon (POC) (A), mineral organic carbon (MOC) (B), total organic carbon (TOC) (C), and carbon stock (C-Stock) (D) in the 0-0.10 m depth. Vertical lines on the bars indicate standard errors of means (n = 5). Treatments with different letters on the bars are significantly different (p ≤ 0.05) by the Tukey test. PAS: Pasture species (Mombasa); NT1 and NT2: No-tillage system; EUC: Eucalyptus; and NF: Native Cerrado forest.
The ratios between C-fractions and TOC content showed variations between sites, except for the C-HUM:TOC ratio (Figure 4). The topsoil values of MBC:TOC were higher under pasture (1.15), NT2 (0.86), and eucalyptus (1.09) than under NT1 (0.41) and NF (0.48). In contrast, the highest topsoil values of C-HA:TOC and C-FA:TOC were observed under NT1 (8.32 and 3.31, respectively) as compared to pastures (6.13 and 2.16, respectively), and eucalyptus (4.85 and 1.77, respectively). Topsoil C-HA:TOC values in NT1 were also higher than those observed in the native forest (5.57), while C-FA:TOC in NT1 was higher than those observed in NT2 (2.10). The topsoil values regarding C-HUM:TOC did not vary among sites.
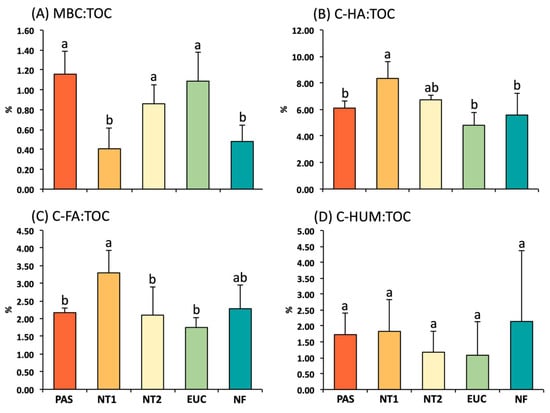
Figure 4.
Microbial biomass carbon to total organic carbon (MBC:TOC) (A), humic acid to total organic carbon, (C-FA:TOC) (B), fulvic acid to total organic carbon (C-HA:TOC) (C), and humin to total organic carbon (C-HUM:TOC) (D) ratios in the 0–0.10 m depth. Vertical lines on the bars indicate standard errors of means (n = 5). Treatments with different letters on the bars are significantly different (p ≤ 0.05) by the Tukey test. PAS: Pasture species (Mombasa); NT1 and NT2: No-tillage system; EUC: Eucalyptus; and NF: Native Cerrado forest.
The PCA analysis explained 99.1% of the total variation in the first two axes of the graph and clustered the samples into two main groups (Figure 5A). Group 1 comprised pasture and eucalyptus that were correlated with MBC and MBC:TOC. Group 2 consisted of NT1 and native forests that were correlated with humic fractions, POC, and MOC. The heatmap showed the correlations among SOC fractions (Figure 5B). MBC correlated positively with MBC:TOC ratio and negatively with C-FA:TOC and C-HA:TOC ratios. The C-FA and C-HA fractions correlated negatively with the MBC:TOC ratio and both fractions correlated positively with MOC. The C-FA:TOC ratio exhibited a positive correlation with C-HA:TOC.
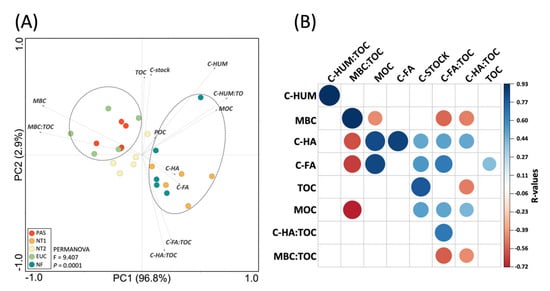
Figure 5.
(A) Principal component analysis biplot comparing the structure of SOC fractions among treatments. The dashed lines in the graph indicate significant clusters (PERMANOVA, p < 0.05). (B) Heatmap showing the Spearman’s rank correlation coefficients and statistical significance between SOC fractions. Blue and red colors indicate significant positive and negative correlations, respectively (p < 0.05).
4. Discussion
In general, land-use changes did not reduce TOC stocks under the conditions of this study, although previous studies have reported changes in TOC stock following land conversion from native forests to croplands in tropical soils [39,40,41,42,43]. Despite these previous studies, TOC stocks and their humic fractions remained at similar levels in PAS, NT1, NT2, and EUC as compared to the native Cerrado. The results showed a high standard deviation which probably occurred due to some variation along the transect [44], which contributed to the increase of the standard deviation. However, the statistical analysis was robust to show significant differences. Although no differences were observed in TOC stocks, MBC and POC fractions showed distinct responses according to the different agricultural systems (p < 0.05). These results are partly in line with the hypothesis that SOC and C fractions are differently influenced by distinct agricultural systems.
Changes in land use, vegetation cover, and soil management practices can increase or decrease TOC status in the soil, which depends on several factors. Plant biomass is the primary C source of the soil and, therefore, its quality and abundance strongly drive the dynamic of soil organic matter (SOM) [45]. Thus, an increase in SOM is observed when the rates of organic C inputs and incorporation are greater than the decomposition [46]. The SOM turnover occurs through the action of microbial-enzyme accessibility to the substrate, and the physical protection of soil C in aggregates plays an important role in controlling this process [40,47,48]. In this study, areas under land-use change presented diversification and abundance of plant biomass. The soil under NT1, NT2, and PAS were cultivated under crop rotation including legume (soybean) and grasses (maize and millet in NT1, while maize, millet, and pasture in NT2). Moreover, Mombasa grass was cultivated in PAS in 2016 and 2017. The management practices used in these areas ensured that a sufficient volume of organic residues in the soil environment was protected against fast decomposition due to the lack of soil disturbance. Particularly, the root system from grasses may have played an important role in TOC accumulation, as root biomass is considered the main source of C in the soil [48,49]. In EUC, the absence of a significant effect on TOC compared to NF could also be explained by the presence of Mombasa between rows and the low decomposition rate of eucalyptus leaves, as reported by Pinheiro et al. [39]. The management systems adopted following land conversion from the native forest in our study were based on sustainable practices such as crop rotation involving legumes and grasses or the adoption of perennial crops such as eucalyptus and Mombasa. The results obtained bring evidence that these management practices ensured the maintenance of soil C status after the land-use conversion, which is an essential condition for agricultural sustainability and terrestrial environmental stability [50], especially in highly weathered tropical soils [51]. Moreover, the land-use types studied, especially PAS, NT2, and EUC are some of the agricultural components of the crop-livestock-forest integrated systems, which is a technology increasingly used in intensive grain production systems in the Brazilian Cerrado. Our results therefore reinforce the agronomic and environmental feasibility of these systems in a climate change scenario.
Higher topsoil values of MBC in PAS and NT2 compared to NT1 and NF were probably a result of the inclusion of Mombasa grass in these systems, which ensured a high input of organic sources to microbes due to the exudation from the roots [52]. Moreover, grass leaves contain a greater portion of labile C fractions, while forest residues contain more recalcitrant fractions [53]. Soil microbes preferentially utilize grass-derived C as food since it is easily decomposed, allowing a further increase in SOC cycling and converting more external C into SOC [54]. The input of highly degradable substrates (plant litter with high proportions of labile fractions) on the soil surface possibly boosted microbial growth, leading to high MBC values (50). The soil under EUC also showed high values of MBC (119 mg/kg), which is possibly related to the high input of plant litter and the favorable environment provided by the trees, specifically reducing soil temperature, and maintaining high soil moisture [55]. Besides, eucalyptus rows were surrounded by Mombasa grass that was kept under fallow for eight years, which contributed with input of fresh organic material into the soil.
Land-use conversion to agricultural systems that involved crop rotation and pasture species such as Mombasa grass (NT2, PAS, and EUC), maintained POC values similar to those found in native forests. Similar trends were observed by de Moraes Sá et al. [41] in areas converted to pasture, where POC stocks did not change over time. Particulate organic carbon is a labile SOM fraction originating from newly decomposed litter biomass, greater root systems, and root exudates [56]. Although representing a small proportion of the TOC, this labile C fraction is an important component of active C pools [57]. Besides, it is considered the most sensitive indicator for land-use change because POC consists of fresh organic materials or materials with early stages of decomposition [55,58,59].
Pasture, NT2, and EUC were more efficient in incorporating organic C in the soil as microbial biomass than NT1 and NF, as indicated by the highest MBC:TOC ratios on these land-use systems. Conversely, amongst land areas converted from native forest, NT1 showed the highest proportions of humic substances in relation to TOC, notably for H-FA and H-HA. The lowest MBC:TOC in NT1 is consistent with the limited availability of permanent labile organic C for microbial activity, as also demonstrated by the lowest POC values in this management system and reinforced by the negative correlation of MBC:TOC with H-FA and H-HA. Soil MBC is a very important component in tropical soils because it represents an active pool of available nutrients for plant uptake [60], and was strongly correlated with MBC:TOC. Thus, changes in MBC:TOC are indicative of the organic matter input to the soil, microbial incorporation efficiency, soil carbon loss, and stabilization of SOC by mineral fractions [61]. Our data suggest that the high and continuous inputs of fresh material, especially by the root system of Mombasa grass (in NT2, PAS, and EUC) and eucalyptus plant residues (in EUC) were responsible for the more pronounced dynamic of C incorporation into microbial biomass. The importance of plant root systems in ensuring high MBC:TOC values is corroborated by [62], who stated that the MBC:TOC ratio is highly dependent on C inputs from the rhizosphere.
While high C inputs to the soil by root systems of pasture species favored an increased MBC:TOC ratio, the high C-FA:TOC and C-HA:TOC values observed in NT1 were conditioned by an opposite pattern, i.e., a lower efficiency in providing continuous input of fresh organic matter, especially from the root systems [63]. Such a pattern resulted in an exhaustion of the labile C fractions (e.g., POC and MBC) in NT1, leading to a more pronounced remaining proportion of humified C fractions compared to TOC. Humic substances represent a significant portion of total SOC and play an important agronomic role significantly influencing the quality and productivity of agricultural soils [21]. Despite that, the data from NT1 suggest that the higher proportion of humic substances in relation to TOC in this area compared to other land-use systems is a result of a lesser capacity to produce fresh material or the production of lower quality plant residues in NT1.
An important remark regarding NT1 is that with a few exceptions, a soybean-maize crop succession prevailed in this system. This sequence of crops is mentioned in the literature as a combination that ensures improved environmental conditions and increased profitability [64]. Nonetheless, our data suggest that for the conditions of extensive production systems in the Cerrado of Brazilian Northeast, the exclusive monocultures of soybean and maize in succession are not effective in ensuring a topsoil pool of active C fractions. This statement is reinforced by the data from Luo et al. [17], who found that increasing cropping frequency is a more efficient strategy to increase C input agroecosystems.
The changes in soil C status found in our study may partly be a consequence of the thin topsoil layer considered. We showed that intensive agricultural systems combining crop rotation and the use of pasture grasses and eucalyptus increases the contents of active C pools (MBC and POC) in the topsoil. A broad set of studies converge with our findings, showing that major changes in SOC status in no-tillage systems occur close to the soil surface, in the 0.5–0.10 m [16,17,65] or the 0.15 m soil layer [18]. The continuous input of fresh organic material in the uppermost soil layers promotes high biological activity [18] leading to more immediate changes in the C status. On the other hand, in deeper soil layers, there is a lower fresh material input and higher recalcitrance of soil C forms compared to topsoil, making C forms unavailable to microbial communities [66]. These limitations at deeper soil layers make changes in C status slower.
On one hand, our results showed that management-dependent changes in topsoil C status might be useful to allow the comprehension of the dynamics of soil C sequestration in the short span. This is because changes in labile C fractions can also promote changes in TOC contents and the uppermost soil layers can contain approximately 47–50% of the total SOC stock found in the 0–100 cm soil layer [67,68]. On the other hand, changes promoted by the management system can also point towards long-term trends in a soil profile deeper than the 0.10–0.15 m soil layer both in tropical [69,70] and temperate regions [65]. Therefore, given the restricted thickness of the soil layer considered in our study, the results cannot be extrapolated to the whole soil profile and cannot be used as a model to estimate C sequestration under the land-use systems evaluated.
Taken together, our findings show the importance of soil quality, the crop rotation with more complex crop arrangements that include forage grasses, and the combination of these forage grasses with eucalyptus trees. Our results also call for the incorporation of these practices in intensive systems in converted areas in the Brazilian Northeast, to ensure more intense topsoil C dynamics, with implications for productive sustainability [19,71]. Despite that, future research efforts should be directed towards a detailed survey of C sequestration and fractions in a soil profile of 1 m or more [70]. This is necessary for a better comprehension of the mid- or long-term effects of intensive land-use systems in the soil C status under the conditions of the Brazilian Northeast and for a complete inventory of C stocks in areas converted from native Cerrado to agricultural use.
5. Conclusions
This study showed that native Cerrado forest to agricultural land uses does not significantly influence the topsoil C-stocks and the fractions of soil humic substances but reduces the topsoil POC fraction, partially confirming our hypotheses. The adoption of agricultural systems that involve complex cropping rotations including pasture species, such as Mombasa grass and eucalyptus, is decisive to ensure a permanent input of diverse plant residues, preventing the loss of topsoil active C compartments in the Cerrado of the Brazilian Northeast. Although this study did not show significant shifts in soil organic C fractions, it suggests that sustainable and conservationist management should be emphasized to maintain and improve the status of soil organic C. In addition, further studies should be done to monitor the pattern of soil organic C fractions in the long term.
Supplementary Materials
The following supporting information can be downloaded at: https://www.mdpi.com/article/10.3390/soilsystems7010011/s1, Figure S1: Sampling design. In NT1, NT2, PAS and NF, five 100-m transects distant approximately 20 m between them were sampled (A); In EUC, five 20-m spaced transects considered the transition from eucalyptus rows and spaces between rows (B). Five samples were taken per transect (red circles) and pooled to form a composite sample; Table S1: Historic of the crop systems applied in each area; Table S2: chemical properties (0-0.10 m depth) of the soils.
Author Contributions
Conceptualization, H.A.d.S., M.L.T. and L.F.C.L.; methodology, H.A.d.S., A.S.F.A. and E.S.; formal analysis, A.V.S.G. and J.R.d.C.; investigation, A.V.S.G. and J.R.d.C.; data curation, L.W.M., A.P.d.A.P. and D.P.d.C.; writing-original draft preparation—H.A.d.S., A.S.F.A., E.S., E.V.d.M. and R.F.V.; writing—review and editing, A.S.F.A., E.S., E.V.d.M. and L.F.C.L. All authors have read and agreed to the published version of the manuscript.
Funding
This research was funded by Empresa Brasileira de Pesquisa Agropecuária (Embrapa), grant number 22.13.11.004.00.03.
Informed Consent Statement
Not applicable.
Data Availability Statement
Not applicable.
Acknowledgments
The authors wish to thank Nova Zelândia Farm for logistical support and information.
Conflicts of Interest
The authors declare no conflict of interest.
References
- Coyle, C.; Creamer, R.E.; Schulte, R.P.O.; O’Sullivan, L.; Jordan, P.A. Functional Land Management conceptual framework under soil drainage and land use scenarios. Environ. Sci. Pol. 2016, 56, 39–48. [Google Scholar] [CrossRef]
- Parsapour, M.K.; Kooch, Y.; Hosseini, S.M.; Alavi, S.J. Litter and topsoil in Alnus subcordata plantation on former degraded natural forest land: A synthesis of age-sequence. Soil Tillage Res. 2018, 179, 1–10. [Google Scholar] [CrossRef]
- Olorunfemi, I.E.; Fasinmirin, J.T.; Olufayo, A.A.; Komolafe, A.A. Total carbon and nitrogen stocks under different land use/land cover types in the Southwestern region of Nigeria. Geoderma Reg. 2020, 22, e00320. [Google Scholar] [CrossRef]
- Guareschi, R.F.; Pereira, M.G.; Perin, A. Densimetric fractionation of organic matter in an agricultural chronosequence in no-till areas in the Cerrado region, Brazil. Semin. Cienc. Agr. 2016, 37, 595–610. [Google Scholar] [CrossRef]
- Sanderman, J.; Hengl, T.; Fiske, G.J. Soil carbon debt of 12,000 years of human land use. Proc. Natl. Acad. Sci. USA 2017, 114, 9575–9580. [Google Scholar] [CrossRef]
- Zalles, V.; Hansen, M.C.; Potapov, P.V.; Stehman, S.V.; Tyukavina, A.; Pickens, A.; Song, X.-P.; Adusei, B.; Okpa, C.; Aguilar, R.; et al. Near doubling of Brazil’s intensive row crop area since 2000. Proc. Natl. Acad. Sci. USA 2019, 8, 428–435. [Google Scholar] [CrossRef]
- Wuaden, C.R.; Nicoloso, R.S.; Barros, E.C.; Grave, R.A. Early adoption of no-till mitigates soil organic carbon and nitrogen losses due to land use change. Soil Tillage Res. 2020, 204, 104728. [Google Scholar] [CrossRef]
- Page, K.L.; Dang, Y.P.; Dalal, R.C. The Ability of Conservation Agriculture to Conserve Soil Organic Carbon and the Subsequent Impact on Soil Physical, Chemical, and Biological Properties and Yield. Front. Sust. Food Syst. 2020, 18, 31. [Google Scholar] [CrossRef]
- Bayer, C.; Martin-Neto, L.; Mielniczuk, J.; Pavinato, A.; Dieckow, J. Carbon sequestration in two Brazilian Cerrado soils under no-till. Soil Tillage Res. 2006, 86, 237–245. [Google Scholar] [CrossRef]
- Bongiorno, G.; Bünemann, E.K.; Oguejiofor, C.U.; Meier, J.; Gort, G.; Comans, R.; Mäder, P.; Brussaard, L.; de Goede, R. Sensitivity of labile carbon fractions to tillage and organic matter management and their potential as comprehensive soil quality indicators across pedoclimatic conditions in Europe. Ecol. Indic. 2019, 99, 38–50. [Google Scholar] [CrossRef]
- Kooch, Y.; Ehsani, S.; Akbarinia, M. Stratification of soil organic matter and biota dynamics in natural and anthropogenic ecosystems. Soil Tillage Res. 2020, 200, 104621. [Google Scholar] [CrossRef]
- Ukalska-Jaruga, A.; Debaene, G.; Smreczak, B. Particle and structure characterization of fulvic acids from agricultural soils. J. Soils Sedim. 2018, 18, 2833–2843. Available online: http://link.springer.com/10.1007/s11368-018-2008-1 (accessed on 1 November 2022). [CrossRef]
- Liu, H. Relationship between organic matter humification and bioavailability of sludge-borne copper and cadmium during long-term sludge amendment to soil. Sci. Total Environ. 2016, 566–567, 8–14. [Google Scholar] [CrossRef] [PubMed]
- Baldock, J.; Nelson, P. Soil organic matter. In Handbook of Soil Science; Taylor and Francis Group: London, UK; New York, NY, USA; CRC Press: Boca Raton, FL, USA, 2000; pp. B25–B84. [Google Scholar]
- Kaiser, K.; Kalbitz, K. Cycling downwards—Dissolved organic matter in soils. Soil Biol. Biochem. 2012, 52, 29–32. [Google Scholar] [CrossRef]
- Angers, D.A.; Eriksen-Hamel, N.S. Full-Inversion Tillage and Organic Carbon Distribution in Soil Profiles: A Meta-Analysis. Soil Sci. Soc. Am. J. 2008, 72, 1370–1374. [Google Scholar] [CrossRef]
- Luo, Z.; Wang, E.; Sun, O.J. Can no-tillage stimulate carbon sequestration in agricultural soils? A meta-analysis of paired experiments. Agric. Ecosyst. Environ. 2010, 139, 224–231. [Google Scholar] [CrossRef]
- Haddaway, N.R.; Hedlund, K.; Jackson, L.E.; Kätterer, T.; Lugato, E.; Thomsen, I.K.; Jørgensen, H.B.; Isberg, P.-E. How does tillage intensity affect soil organic carbon? A systematic review. Environ. Evid. 2017, 18, 30. Available online: https://environmentalevidencejournal.biomedcentral.com/articles/10.1186/s13750-017-0108-9 (accessed on 1 November 2022). [CrossRef]
- Franzluebbers, A. Soil organic matter stratification ratio as an indicator of soil quality. Soil Tillage Res. 2002, 66, 95–106. Available online: https://linkinghub.elsevier.com/retrieve/pii/S0167198702000181 (accessed on 1 November 2022). [CrossRef]
- Babur, E.; Kara, O.; Fathi, R.A.; Susam, Y.E.; Riaz, M.; Arif, M.; Akhtar, K. Wattle fencing improved soil aggregate stability, organic carbon stocks and biochemical quality by restoring highly eroded mountain region soil. J. Environ. Manag. 2021, 288, 112489. [Google Scholar] [CrossRef]
- Ukalska-Jaruga, A.; Klimkowicz-Pawlas, A.; Smreczak, B. Characterization of organic matter fractions in the top layer of soils under different land uses in Central-Eastern Europe. Soil Use Manag. 2019, 35, 595–606. [Google Scholar] [CrossRef]
- Wang, Y.; Fu, B.; Lü, Y.; Chen, L. Effects of vegetation restoration on soil organic carbon sequestration at multiple scales in semi-arid Loess Plateau, China. Catena 2011, 85, 58–66. [Google Scholar] [CrossRef]
- Ozlu, E.; Arriaga, F.J.; Bilen, S.; Gozukara, G.; Babur, E. Carbon Footprint Management by Agricultural Practices. Biology 2022, 11, 1453. [Google Scholar] [CrossRef] [PubMed]
- Leite, L.F.C.; Galvão, S.R.S.; Holanda Neto, M.R.; Araújo, F.S.; Iwata, B.F. Atributos químicos e estoques de carbono em Latossolo sob plantio direto no cerrado do Piauí. Rev. Bras. Eng. Agríc. Amb. 2010, 14, 1273–1280. Available online: http://www.scielo.br/scielo.php?script=sci_arttext&pid=S1415-43662010001200004&lng=pt&tlng=pt (accessed on 1 November 2022). [CrossRef]
- Fujisaki, K.; Perrin, A.-S.; Desjardins, T.; Bernoux, M.; Balbino, L.C.; Brossard, M. From forest to cropland and pasture systems: A critical review of soil organic carbon stocks changes in Amazonia. Glob. Change Biol. 2015, 21, 2773–2786. [Google Scholar] [CrossRef] [PubMed]
- Araújo, A.S.F.; Silva, E.F.L.; Nunes, L.A.P.L.; Carneiro, R.F.V. The effect of converting tropical native savanna to Eucalyptus grandis forest on soil microbial biomass. Land Degrad. Develop. 2010, 21, 540–545. Available online: https://onlinelibrary.wiley.com/doi/10.1002/ldr.993 (accessed on 1 November 2022). [CrossRef]
- Battaglia, M.L.; Thomason, W.E.; Fike, J.H.; Evanylo, G.K.; Stewart, R.D.; Gross, C.D.; Seleiman, M.F.; Babur, E.; Sadeghpour, A.; Harrison, M.T. Corn and wheat residue management effects on greenhouse gas emissions in the mid-Atlantic USA. Land 2022, 11, 846. [Google Scholar] [CrossRef]
- INMET. Instituto Nacional de Meteorologia. 2022. Available online: http://www.inmet.gov.br/portal/ (accessed on 1 November 2022).
- Sousa, D.M.G.; Lobato, E. Cerrado: Correção do Solo e Adubação; Embrapa Cerrados: Planaltina, Brasil, 2004; 416p. [Google Scholar]
- Silva, F.C.; Abreu, M.F.; Pérez, D.V.; Eira, P.A.; Abreu, C.A.; Raij, B.V.; Gianello, C.; Coelho, A.M.; Quaggio, J.A.; Tedesco, M.J.; et al. Métodos de análises químicas para avaliação da fertilidade do solo. In Manual de Análises Químicas de Solos, Plantas e Fertilizantes; Embrapa Informação Tecnológica: Brasilia, Brasil, 2009; pp. 107–190. [Google Scholar]
- Islam, K.R.; Weil, R.R. A rapid microwave digestion method for colorimetric measurement of soil organic carbon. Commun. Soil Sci. Plant Anal. 1998, 29, 2269–2284. [Google Scholar] [CrossRef]
- Ferreira, A.S.; Camargo, F.A.O.; Vidor, C. Utilização de microondas na avaliação da biomassa microbiana do solo. Rev. Bras. Cienc. Solo 1999, 23, 991–996. Available online: http://www.scielo.br/scielo.php?script=sci_arttext&pid=S0100-06831999000400026&lng=pt&tlng=pt (accessed on 1 November 2022). [CrossRef]
- Alef, K. Estimation of the hydrolysis of fluorescein diacetate. In Methods in Applied Soil Microbiology and Biochemistry; Academic Press: London, UK, 1995; pp. 232–238. [Google Scholar]
- Mendonça, E.S.; Matos, E.S. Matéria Orgânica do Solo: Métodos de Análises; UFV: Viçosa, Brasil, 2005. [Google Scholar]
- Ellert, B.H.; Bettany, J.R. Calculation of organic matter and nutrients stored in soils under contrasting management regimes. Can. J. Soil Sci. 1995, 75, 529–538. Available online: http://www.nrcresearchpress.com/doi/10.4141/cjss95-075 (accessed on 1 November 2022). [CrossRef]
- Swift, R.S. Organic matter characterization. In Methods of Soil Analysis; SSSA: Madison, WI, USA, 1996; pp. 1011–1069. [Google Scholar]
- Diekow, J.; Mielniczuk, J.; Knicker, H.; Bayer, C.; Dick, D.P.; Kögel-Knabner, I. Carbon and nitrogen stocks in physical fractions of a subtropical Acrisol as influenced by long-term no-till cropping systems and N fertilisation. Plant Soil 2005, 268, 319–328. [Google Scholar] [CrossRef]
- R Core Team. R Core Team. R: A Language and Environment for Statistical Computing. 2020. Available online: https://www.r-project.org/ (accessed on 1 November 2022).
- Pinheiro, F.M.; Nair, P.K.R.; Nair, V.D.; Tonucci, R.G.; Venturin, R.P. Soil carbon stock and stability under Eucalyptus-based silvopasture and other land-use systems in the Cerrado biodiversity hotspot. J. Environ. Manag. 2021, 299, 113676. [Google Scholar] [CrossRef] [PubMed]
- Gmach, M.-R.; Dias, B.O.; Silva, C.A.; Nóbrega, J.C.A.; Lustosa-Filho, J.F.; Siqueira-Neto, M. Soil organic matter dynamics and land-use change on Oxisols in the Cerrado, Brazil. Geoderma Reg. 2018, 14, e00178. [Google Scholar] [CrossRef]
- Sá, J.C.S.; Gonçalves, D.R.P.; Ferreira, L.A.; Mishra, U.; Inagaki, T.M.; Furlan, F.J.F.; Moro, R.S.; Floriani, N.; Briedis, C.; Ferreira, A.D.O. Soil carbon fractions and biological activity based indices can be used to study the impact of land management and ecological successions. Ecol. Indic. 2018, 84, 96–105. [Google Scholar] [CrossRef]
- Almeida, L.L.S.; Frazão, L.A.; Lessa, T.A.M.; Fernandes, L.A.; Veloso, Á.L.C.; Lana, A.M.Q.; de Souza, I.A.; Pegoraro, R.F.; Ferreira, E.A. Soil carbon and nitrogen stocks and the quality of soil organic matter under silvopastoral systems in the Brazilian Cerrado. Soil Tillage Res. 2021, 205, 104785. [Google Scholar] [CrossRef]
- Monroe, P.H.M.; Berreto-Garcia, P.A.B.; Barros, W.T.; Oliveira, F.G.R.B.; Pereira, M.G. Physical protection of soil organic carbon through aggregates in different land use systems in the semi-arid region of Brazil. J. Arid Environ. 2021, 186, 104427. [Google Scholar] [CrossRef]
- Lark, R.M. Changes in the variance of a soil property along a transect, a comparison of a non-stationary linear mixed model and a wavelet transform. Geoderma 2016, 266, 84–97. [Google Scholar] [CrossRef]
- Dalal, R.C.; Thornton, C.M.; Allen, D.E.; Owens, J.S.; Kopittke, P.M. Long-term land use change in Australia from native forest decreases all fractions of soil organic carbon, including resistant organic carbon, for cropping but not sown pasture. Agric. Ecosyst. Environ. 2021, 311, 107326. [Google Scholar] [CrossRef]
- Torn, M.S.; Swanston, C.W.; Castanha, C.; Trumbore, S.E. Storage and turnover of organic matter in soil. In Biophysico-Chemical Processes Involving Natural Nonliving Organic Matter in Environmental Systems; Wiley: Hoboken, NJ, USA, 2009; pp. 219–272. [Google Scholar]
- Liu, X.; Wu, X.; Liang, G.; Zheng, F.; Zhang, M.; Li, S. A global meta-analysis of the impacts of no-tillage on soil aggregation and aggregate-associated organic carbon. Land Degrad. Develop. 2021, 32, 5292–5305. [Google Scholar] [CrossRef]
- Rasse, D.P.; Rumpel, C.; Dignac, M.-F. Is soil carbon mostly root carbon? Mechanisms for a specific stabilisation. Plant Soil 2005, 269, 341–356. [Google Scholar] [CrossRef]
- Koga, N.; Shimoda, S.; Shirato, Y.; Kusaba, T.; Shima, T.; Niimi, H.; Yamane, T.; Wakabayashi, K.; Niwa, K.; Kohyama, K.; et al. Assessing changes in soil carbon stocks after land use conversion from forest land to agricultural land in Japan. Geoderma 2020, 377, 114487. [Google Scholar] [CrossRef]
- Chenu, C.; Angers, D.A.; Barré, P.; Derrien, D.; Arrouays, D.; Balesdent, J. Increasing organic stocks in agricultural soils: Knowledge gaps and potential innovations. Soil Tillage Res. 2019, 188, 41–52. [Google Scholar] [CrossRef]
- Ramos, F.T.; Dores, E.F.C.; Weber, O.L.S.; Beber, D.C.; Campelo, J.H.; Maia, J.C.S. Soil organic matter doubles the cation exchange capacity of tropical soil under no-till farming in Brazil. J. Sci. Food Agric. 2018, 98, 3595–3602. [Google Scholar] [CrossRef] [PubMed]
- Pausch, J.; Kuzyakov, Y. Carbon input by roots into the soil: Quantification of rhizodeposition from root to ecosystem scale. Glob. Change Biol. 2018, 24, 1–12. [Google Scholar] [CrossRef] [PubMed]
- Bahadori, M.; Chen, C.; Lewis, S.; Boyd, S.; Rashti, M.R.; Esfandbod, M.; Garzon-Garcia, A.; Van Zwieten, L.; Kuzyakov, Y. Soil organic matter formation is controlled by the chemistry and bioavailability of organic carbon inputs across different land uses. Sci. Total Environ. 2021, 770, 145307. [Google Scholar] [CrossRef] [PubMed]
- You, M.; Zhu-Barker, X.; Hao, X.-X.; Li, L.-J. Profile distribution of soil organic carbon and its isotopic value following long term land-use changes. Catena 2021, 207, 105623. [Google Scholar] [CrossRef]
- Thangavel, R.; Kanchikerimath, M.; Sudharsanam, A.; Ayyanadar, A.; Karunanithi, R.; Deshmukh, N.A.; Vanao, N.S. Evaluating organic carbon fractions, temperature sensitivity and artificial neural network modeling of CO2 efflux in soils: Impact of land use change in subtropical India (Meghalaya). Ecol. Indic. 2018, 193, 129–141. [Google Scholar] [CrossRef]
- Cardoso, J.A.F.; Lima, A.M.N.; Cunha, T.J.F.; Rodrigues, M.S.; Hernani, L.C.; Amaral, A.J.; Neto, M.B.D.O. Organic matter fractions in a quartzipsamment under cultivation of irrigated mango in the lower são francisco valley region, Brazil. Rev. Bras. Cienc. Solo 2015, 39, 1068–1078. Available online: http://www.scielo.br/scielo.php?script=sci_arttext&pid=S0100-06832015000401068&lng=en&tlng=en (accessed on 1 November 2022). [CrossRef]
- Guimarães, D.V.; Gonzaga, M.I.S.; Melo Neto, J.O. Manejo da matéria orgânica do solo e estoques de carbono em cultivos de frutas tropicais. Rev. Bras. Eng. Agríc. Amb. 2014, 18, 301–306. Available online: http://www.scielo.br/scielo.php?script=sci_arttext&pid=S1415-43662014000300009&lng=pt&tlng=pt (accessed on 1 November 2022). [CrossRef]
- Iqbal, J.; Hu, R.; Lin, S.; Ahamadou, B.; Feng, M. Carbon dioxide emissions from Ultisol under different land uses in mid–subtropical China. Geoderma 2009, 152, 63–73. [Google Scholar] [CrossRef]
- Iqbal, J.; Ronggui, H.; Lijun, D.; Lan, L.; Shan, L.; Tao, C.; Leilei, R. Differences in soil CO2 flux between different land use types in mid-subtropical China. Soil Biol. Biochem. 2008, 40, 2324–2333. Available online: https://linkinghub.elsevier.com/retrieve/pii/S003807170800165X (accessed on 1 November 2022). [CrossRef]
- Santos, V.B.; Araújo, A.S.; Leite, L.F.; Nunes, L.A.; Melom, W.J. Soil microbial biomass and organic matter fractions during transition from conventional to organic farming systems. Geoderma 2012, 170, 227–231. [Google Scholar] [CrossRef]
- Sparling, G. Ratio of microbial biomass carbon to soil organic carbon as a sensitive indicator of changes in soil organic matter. Soil Res. 1992, 30, 195. Available online: http://www.publish.csiro.au/?paper=SR9920195 (accessed on 1 November 2022). [CrossRef]
- Haynes, R.J. Labile Organic Matter Fractions as Central Components of the Quality of Agricultural Soils: An Overview. Adv. Agron. 2005, 85, 221–268. Available online: https://linkinghub.elsevier.com/retrieve/pii/S0065211304850053 (accessed on 1 November 2022).
- Araújo, A.S.F.; Cesarz, S.; Leite, L.F.C.; Borges, C.D.; Tsai, S.M.; Eisenhauer, N. Soil microbial properties and temporal stability in degraded and restored lands of Northeast Brazil. Soil Biol. Biochem. 2013, 66, 175–181. [Google Scholar] [CrossRef]
- Costantini, M.; Bacenetti, J. Soybean and maize cultivation in South America: Environmental comparison of different cropping systems. Clean. Environ. Syst. 2021, 2, 100017. [Google Scholar] [CrossRef]
- Krauss, M.; Wiesmeier, M.; Don, A.; Cuperus, F.; Gattinger, A.; Gruber, S.; Haagsma, W.; Peigné, J.; Palazzoli, M.C.; Schulz, F.; et al. Reduced tillage in organic farming affects soil organic carbon stocks in temperate Europe. Soil Tillage Res. 2022, 216, 105262. [Google Scholar] [CrossRef]
- Lyu, M.; Noormets, A.; Ukonmaanaho, L.; Li, Y.; Yang, Y.; Xie, J. Stability of soil organic carbon during forest conversion is more sensitive in deep soil than in topsoil in subtropical forests. Pedobiologia 2021, 84, 150706. [Google Scholar] [CrossRef]
- Balesdent, J.; Basile-Doelsch, I.; Chadoeuf, J.; Cornu, S.; Derrien, D.; Fekiacova, Z.; Hatté, C. Atmosphere–soil carbon transfer as a function of soil depth. Nature 2018, 559, 599–602. [Google Scholar] [CrossRef]
- Basile-Doelsch, I.; Balesdent, J.; Pellerin, S. Reviews and syntheses: The mechanisms underlying carbon storage in soil. Biogeosciences 2020, 17, 5223–5242. Available online: https://bg.copernicus.org/articles/17/5223/2020/ (accessed on 1 November 2022). [CrossRef]
- Medeiros, A.S.; Santos, T.C.; Maia, S.M.F. Effect of long-term and soil depth on soil organic carbon stocks after conversion from native vegetation to conventional tillage systems in Brazil. Soil Tillage Res. 2022, 219, 105336. [Google Scholar] [CrossRef]
- Diekow, J.; Mielniczuk, J.; Knicker, H.; Bayer, C.; Dick, D.P.; Kögel-Knabner, I. Soil C and N stocks as affected by cropping systems and nitrogen fertilisation in a southern Brazil Acrisol managed under no-tillage for 17 years. Soil Tillage Res. 2005, 81, 87–95. Available online: https://linkinghub.elsevier.com/retrieve/pii/S0167198704001357 (accessed on 1 November 2022). [CrossRef]
- Anghinoni, G.; Anghinoni, F.B.G.; Tormena, C.A.; Braccini, A.L.; Mendes, I.C.; Zancanaro, L.; Lal, R. Conservation agriculture strengthen sustainability of Brazilian grain production and food security. Land Use Pol. 2021, 108, 105591. Available online: https://linkinghub.elsevier.com/retrieve/pii/S0264837721003148 (accessed on 1 November 2022). [CrossRef]
Disclaimer/Publisher’s Note: The statements, opinions and data contained in all publications are solely those of the individual author(s) and contributor(s) and not of MDPI and/or the editor(s). MDPI and/or the editor(s) disclaim responsibility for any injury to people or property resulting from any ideas, methods, instructions or products referred to in the content. |
© 2023 by the authors. Licensee MDPI, Basel, Switzerland. This article is an open access article distributed under the terms and conditions of the Creative Commons Attribution (CC BY) license (https://creativecommons.org/licenses/by/4.0/).