Article

Impact of Short-Term Cultivation on Some Selected Properties of Sandy Soil in an Arid Environment

by
Salman A. H. Selmy
1,*,
Salah H. Abd Al-Aziz
1,
Ahmed G. Ibrahim
1 and
Raimundo Jiménez-Ballesta
2
1
Department of Soils and Water, Faculty of Agriculture, Assiut University, Assiut 71526, Egypt
2
Department of Geology and Geochemistry, Autonomous University of Madrid, 28019 Madrid, Spain
*
Author to whom correspondence should be addressed.
Soil Syst. 2022, 6(4), 82; https://doi.org/10.3390/soilsystems6040082
Submission received: 2 October 2022 / Revised: 19 October 2022 / Accepted: 26 October 2022 / Published: 30 October 2022

Abstract

:
Soil management is recognized to have an impact on soil quality attributes. Depending on the management approach, this impact can either degrade or improve soil quality. There is a severe shortage of information on the impacts of cultivation on sandy soil properties in arid desert regions. Therefore, the objective of this study was to investigate the short-term cultivation effects (5 years) on the properties’ changes of coarse-textured soil in an arid desert region in western Assiut Governorate, Egypt. The current study was conducted on soils sampled at four depth intervals, namely 0–10, 10–20, 20–30, and 30–40 cm, from both cultivated and uncultivated soils, using a systematic sampling grid (10 × 10 m), to investigate the potential impacts of the cultivation process on six soil attributes. Each land use was represented by an area of 0.5 ha (50 × 100 m). A total of 160 composite soil samples (at all depths) were collected from both soils and analyzed for their physical and chemical properties, employing standard laboratory procedures. The data were statistically and geostatistically analyzed to compare the results and map the spatial distributions of the selected soil properties. The results revealed that cultivation had a considerable positive impact on most of the properties of cultivated soil compared to those of uncultivated soil (virgin land). The findings also showed that the available phosphorus levels in cultivated soil were higher than in virgin soil by 16, 9, 8.5, and 6 folds, with increases in organic matter content of 16.8, 12.4, 11.9, and 7.9 times at depths of 0–10, 10–20, 20–30, and 30–40 cm, respectively. Furthermore, compared to virgin soil, cultivated soil exhibited a salinity reduction of −8.9%, −56.4%, −66.3%, and −71.8%, at depths of 0–10, 10–20, 20–30, and 30–40 cm, respectively. Moreover, some other properties of the cultivated soil improved, particularly in the surface soil layers, such as pH reduction, CaCO3 decline, and CEC increase, while the soil texture grade did not change. Therefore, continuous monitoring of the effects of diverse soil management strategies in the short term assists in the understanding of the ongoing changes in soil physical and chemical characteristics, which is critical for maintaining satisfactory soil quality and sustainable soil productivity in arid lands.

1. Introduction

Sustainable agriculture is a critical global issue for supplying the essential requirements for sustainable production and food security and addressing challenges such as population growth, climate change, and land degradation [1,2,3]. It is especially required in arid desert regions outside of the Nile valley and its delta, where agricultural reclamation has emerged as the most promising solution for agricultural development in Egypt, by converting desert lands to arable lands. The study area is considered one of these arid desert regions in Egypt and is located in the Assiut Governorate. Soils in these arid desert regions are characterized by coarse texture, loose structures, weak biological activities, low organic carbon, and insufficient nutrient levels [4,5].
Agricultural management practices and land-use changes are known to have impacts on soil properties [6]. At different scales, soil properties are controlled by land use [7,8,9,10], soil type [11,12,13,14,15], land management, and vegetation type [8,16,17]. Consequently, they have an impact on soil quality, which in turn affects plant growth and soil productivity [18,19,20].
Land conversion from uncultivated to cultivated land is an ongoing process in arid desert regions, due to population growth and the need for expansion of newly reclaimed soils [21]. Cultivation practices may result in negative or positive changes in soil properties depending on the type of agricultural management applied [22,23,24]. Soil properties change dramatically as a result of land-use changes [25]. Therefore, it appears to be critical to develop a land-use system that meets the needs of a rising population, while also maintaining soil fertility in the long term [18,26]. Hence, appropriate soil management and agricultural practices could result in improvements in soil attributes such as increasing the organic carbon content, recovering the soil structure, and improving the infiltration rate [27,28,29]. As well, they can improve the soil moisture content, bulk density, porosity, nutrient distribution, and soil structure stability [30]. Furthermore, soil management and cropping patterns can modify the organic carbon content, nutrient levels, living conditions of soil organisms, and soil attributes and, thus, influence the majority of biological processes [26,27,31,32,33,34]. Cultivation-induced changes in soil physical and chemical properties successively experienced slow, rapid, and stable modification stages based on cultivation age [27].
Crop productivity in sub-Saharan Africa is less than half of the global average, owing primarily to low fertilizer use and soil nutrient depletion [35]. Integrated soil fertility management (ISFM), which combines the application of mineral and organic fertilizers, as well as the incorporation of legumes into cropping rotations, has increased the short-term crop output in sub-Saharan Africa [16]. Fertilization is considered one of the most significant factors impacting soil properties. Fertilizers influence the biological, chemical, and physical properties of soil, besides improving soil nutrient status [36,37]. The most significant effects of fertilizer application on crop yield and soil quality are observed in sandy soils, which are commonly deficient in nutrients, organic matter, soil aggregates, and water-retention capacity [38,39].
In arid regions such as the study area, high temperatures, reduced rainfall, water scarcity, water salinity, and overextraction of groundwater are all significant contributors to increased soil salinity. Furthermore, in arid and semiarid regions, soil salinity and alkalinity are among the main soil limitations for agricultural uses, and they cause land degradation [40]. However, the main reason for the decrease in soil salinity under irrigated cultivation in arid regions may be attributed to the leaching of soluble salts from the upper soil layers into the subsoil layers by water movement [41]. Moreover, organic matter application and agricultural practices frequently improve soil structure and aggregate stability, which enables leaching of the soluble salts found in high concentrations in soil solution [41]. There is an issue, which is the severe lack of available information on the impact of short-term irrigated cultivation on sandy soil properties in arid desert regions. To address this problem, we conducted this study in an arid desert region of northwestern Assiut Governorate, Egypt, to understand the changes in selected soil physical and chemical properties after 0 and 5 years of cultivation. Therefore, the main objective of the current study is to determine how irrigated cultivation impacts the selected properties of sandy soil during a short-term cultivation period (5 years) in an arid desert environment. To achieve this goal, we compared the cultivation-induced changes in selected soil physical and chemical characteristics of cultivated soil, in response to irrigated cultivation, with the corresponding properties of adjacent virgin soil in the same area.

2. Materials and Methods

2.1. Study Area

The study area lies in the western desert region of Assiut Governorate, Egypt (Figure 1). Assiut Governorate is located in Upper Egypt, 375 km south of Cairo. It occupies an area of approximately 25,926 square kilometers with a length of around 120 km from north to south. Assiut Governorate is located between the latitudes of 27°52′47.53″ and 26°48′15.46″ N and the longitudes of 30°31′42.45″ and 32°34′0.88″ E. The climate in Assiut Governorate is arid and characterized by a dry and hot summer, a cold winter, scarce rainfall, and high evapotranspiration in the summer. The National Oceanic and Atmospheric Administration (NOAA) (U.S. Department of Commerce, An official website of the United States government) was the source of climate data for the study area during the investigation years. Figure 2 shows the average monthly climate data for the five years under investigation. The monthly average maximum temperature ranged from 19 to 39 °C, with the highest averages in the summer season (June, July, and August) and an annual average of 30.5 °C, whereas the monthly average minimum temperature ranged from 6 to 25.2 °C, with the lowest averages in the winter season (December, January, and February) and an annual average of 16.5 °C (Figure 2). According to meteorological data, there was no rainfall in that period, where the average annual precipitation was 0.0 mm (Figure 2). The monthly average relative humidity ranged from 29% to 57%, with an annual average of 42% (Figure 2). The lowest average relative humidity was recorded in the summer months, while the highest averages were occurred in the winter months (Figure 2). The northern winds prevail in Assiut Governorate, which is characterized by relative dryness. According to Soil Survey Staff [42], the study area’s soil temperature regime is “hyperthermic”, and the moisture regime is “torric”.

2.2. Soil Sampling

Soil samples were collected from two fields in the northwestern region of the Assiut Governorate (Figure 3). Each field has a dimension of 50 × 100 m and covers 0.5 hectares. One of the two fields has been cultivated for five years, while the other has never been. The cultivated field is planted with wheat as the main crop, once a year in the winter season. The irrigation system used in the cultivated field is sprinkler irrigation, and the irrigation water source is fresh groundwater. The fertilization rates used in the cultivated field are 300 kg/ha of superphosphate during the preparation of the soil for planting, alternating with the addition of 15 tons/ha of farmyard manure every two years, in addition to 350 kg/ha of urea during the growing season every year. On 15 May 2019, soil samples from the cultivated field were collected after harvesting, at the same time as the samples from the uncultivated field (virgin soil). A systematic sampling grid (10 × 10 m) was employed to identify sampling sites and collect soil samples from both fields (Figure 3). The coordinates of the sampling sites were recorded using a handheld GPS device and plotted on a map (Figure 3). Both fields (cultivated and virgin) were sampled at four depths: 0–10, 10–20, 20–30, and 30–40 cm. After removing the straw and litter from the soil surface, soil samples were collected using a stainless-steel auger. For each tested soil depth in both fields, a sum of 20 composite soil samples was formed from 50 simple soil samples, with each composite soil sample consisting of 6 adjacent mixed simple samples, as well as every 2 adjacent composite samples shared in 2 or 3 simple samples. As a result, 80 composite soil samples were collected from each field at all four depths studied. Thus, the total number of soil samples collected from both fields (virgin and cultivated) was 160 composite samples, made up of 400 simple soil samples. Before analyzing soil parameters, soil samples were air-dried, crushed, and passed through a 2 mm sieve.

2.3. Laboratory Analysis

Soil physical and chemical analyses were performed by following the recommended methods. The available soil phosphorus was extracted using a 0.5 N sodium bicarbonate solution adjusted to pH 8.5 [43]. Collin’s Calcimeter (Carl Hamm, Essen, Germany) was used to determine the soil calcium carbonate (CaCO3) content [44]. According to Jackson [45], soil organic carbon was determined using Walkley and Black method [46]. Soil reaction (pH) was determined in the soil water suspension (1:1) at 25 °C utilizing a Beckman pH meter [47]. The electrical conductivity (EC) of the 1:1 soil to water extract was measured using a Beckman EC meter (Beckman Coulter, California, USA) [47]. The cation exchange capacity (CEC) was measured using the sodium acetate method [48].

2.4. Statistics and Geostatistics Analysis

Data on soil properties were subjected to classical statistics using SPSS v.26 (IBM, New York, NY, USA). For all datasets of soil properties studied, descriptive statistics including mean, minimum, maximum, range, standard deviation, standard error, and coefficient of variation (CV) were estimated. Pearson correlation coefficients were employed to determine correlation relationships between cultivated and uncultivated soil properties. Properties with larger CV values are more variable than those with smaller CV values. Carter and Gregorich [49] described a classification scheme for identifying the extent of variability for soil properties based on their CV values, in which CV values of 0–15%, 16–35%, 36–75%, and 76–150% indicate low (least), moderate, high, and very high variability, respectively.
Using coordinates and values of sampling points, a georeferenced database of soil properties was created. A geostatistical analysis using the ordinary kriging (OK) interpolation method was performed to map the soil properties of virgin and cultivated soils [50]. Eleven semivariogram models were tested, employing cross-validation based on prediction errors for each soil property dataset in order to select the best-fitted model for mapping the spatial pattern of selected soil properties. The geostatistics analyses were carried out by ArcGIS using the geostatistical analyst extension [51]. The semivariogram was estimated using the following equation:
γ ( h ) = 1 2 N ( h ) i = 1 N ( h ) [ Z ( x i ) Z ( x i + h ) ] 2
where γ(h) is the semivariance value for a distance h, N(h) is the number of pairs involved in the semivariance calculation, Z(xi) is the value of the attribute Z in the position xi, and Z(xi + h) is the value of the attribute Z separated by a distance h from the position xi.

3. Results

3.1. Soil Property Descriptive Statistics

Table 1 and Table 2 show the descriptive statistics data for the studied soil properties of virgin land and cultivated soil, respectively. The data revealed that the soil properties of cultivated soil and virgin soil differed considerably.

3.1.1. Available Soil Phosphorus

The findings revealed that the available soil phosphorus (P) in the virgin soil was insufficient, while it was sufficient in the cultivated soil (Table 1 and Table 2). In virgin soil, the available soil P ranged from 1.48 to 2.88 mg kg−1 across all depths studied, with the lowest mean of 2.04 mg kg−1 at the second and third depths (10–20 and 20–30 cm) and the highest mean of 2.25 mg kg−1 at the upper depth (Table 1). The soil P levels in the cultivated soil varied from 9.7 to 47.7 mg kg−1 across all the studied depths, with the lowest mean of 14.9 mg kg−1 at the subsoil (30–40 cm) and the highest mean of 38.52 mg kg−1 at the upper soil (0–10 cm), as shown in Table 2. In virgin soil, the P levels did not change with the soil depth, whereas they changed significantly in cultivated soil. Furthermore, the soil P had low to moderate variability, with the coefficients of variation ranging from 11.2% to 14.2% and from 12.1% to 22.4% across all depths for virgin and cultivated soil, respectively.

3.1.2. Soil pH

The results showed that the studied soils were slightly to moderately alkaline, as are the majority of Egyptian soils. The pH values ranged from 8.05 to 8.29 for virgin soil at all the studied depths, with the lowest mean of 8.14 at two depths (10–20 and 20–30 cm) and the highest mean of 8.17 at the deepest depth (30–40 cm). For the cultivated soil, pH values varied from 7.72 to 8.57 at all depths, with the lowest mean of 7.95 at the surface layers (0–10 and 10–20 cm) and the highest mean of 8.17 at the deepest depth (30–40 cm), as shown in Table 2. The coefficients of variation values indicated very low variability in soil pH, with the CV ranging from 0.4% to 0.8% and from 1.7% to 2.6% at all depths for virgin and cultivated soil, respectively.

3.1.3. Soil Salinity

According to the findings, the virgin soil was saline, whereas the cultivated soil was non-saline (Table 1 and Table 2). The electrical conductivity (EC) values ranged from 0.99 to 10.30 dS m−1 across all depths of virgin soil, with the lowest mean of 2.47 dS m−1 at the surface depth (0–10 cm) and the highest mean of 7.62 dS m−1 at the deepest depth (30–40 cm). In the cultivated soil, the EC values varied from 0.40 to 2.98 dS m−1 at all depths, with similar means, ranging from 2.15 to 2.31 dS m−1 across all depths. The soil salinity increased with depth in virgin soil, but it did not change significantly with depth in cultivated soil (Table 1 and Table 2). The variability of the salinity was low to moderate, with CV ranging from 13.0% to 27.8% and from 22.0% to 26.4% at all depths for virgin and cultivated soil, respectively.

3.1.4. Soil Lime Content

The lime (CaCO3) content of virgin soil ranged from 90.0 to 119.6 mg kg−1, with the same mean value (101 mg kg−1) of lime across all soil depths (Table 1). Concerning the cultivated soil, as shown in Table 2, the lime content varied between 76.1 and 95.1 mg kg−1 across all soil depths, with the lowest mean of 80.5 mg kg−1 at the surface layer (0–10 cm) and the highest mean of 91.4 mg kg−1 at the deepest depth (30–40 cm). The vertical distribution of calcium carbonate content in virgin soil was constant with depth, whereas it increased with depth in cultivated soil (Table 1 and Table 2). The soil lime content had low variability, with coefficients of variation ranging from 2.6% to 7.8% and from 2.0% to 4.3% across all depths for virgin and cultivated soil, respectively (Table 1 and Table 2).

3.1.5. Organic Matter Content (OM)

As shown in Table 1 and Table 2, the organic matter (OM) content of cultivated soil was significantly higher than that of virgin soil. The results showed that the OM varied between 0.11 and 0.66 mg kg−1 at all depths studied of virgin soil, with the lowest mean of 0.15 mg kg−1, except for the surface layer (0–10 cm), which had the highest mean of 0.45 mg kg−1 (Table 1). The cultivated soil had a higher OM content, which ranged from 0.28 to 3.12 mg kg−1, with the lowest mean of 0.36 mg kg−1 at the deepest layer (30–40 cm) and the highest mean of 2.13 mg kg−1 at the surface layer (0–10 cm), as shown in Table 2. The organic matter content of both virgin and cultivated soils gradually decreased as soil depth increased (Table 1 and Table 2). The virgin soil had moderate OM variability, with coefficients of variation ranging from 18.7% to 32.2%, while the cultivated soil exhibited low variability in OM content, except for the surface layer (0–10 cm), which had moderate variability (Table 1 and Table 2).

3.1.6. Cation Exchange Capacity (CEC)

The cation exchange capacity (CEC) was low in both soils, with only a slight increase in the cultivated soil. The virgin soil had a CEC that varied between 2.11 and 4.71 cmol kg−1 across all depths studied, with the lowest mean of 2.74 cmol kg−1 at the deepest layer (30–40 cm) and the highest mean of 3.68 cmol kg−1 at the surface layer (0–10 cm), as shown in Table 1. According to Table 2, the CEC for cultivated soil ranged from 2.28 to 4.89 cmol kg−1 across all the studied depths, with the lowest mean of 2.81 cmol kg−1 at a depth of 30–40 cm and the highest mean of 4.80 cmol kg−1 at a surface depth of 0–10 cm. In both soils, CEC decreased slightly with soil depth. The coefficients of variation values indicated low variability in CEC for virgin soil at all depths, except the deepest layer (30–40 cm), which was moderate (CV = 18.13%). Similarly, the CEC variability was very low across all the studied depths for cultivated soil, except for the deepest layer (30–40 cm), which was moderate (CV = 18.65%).

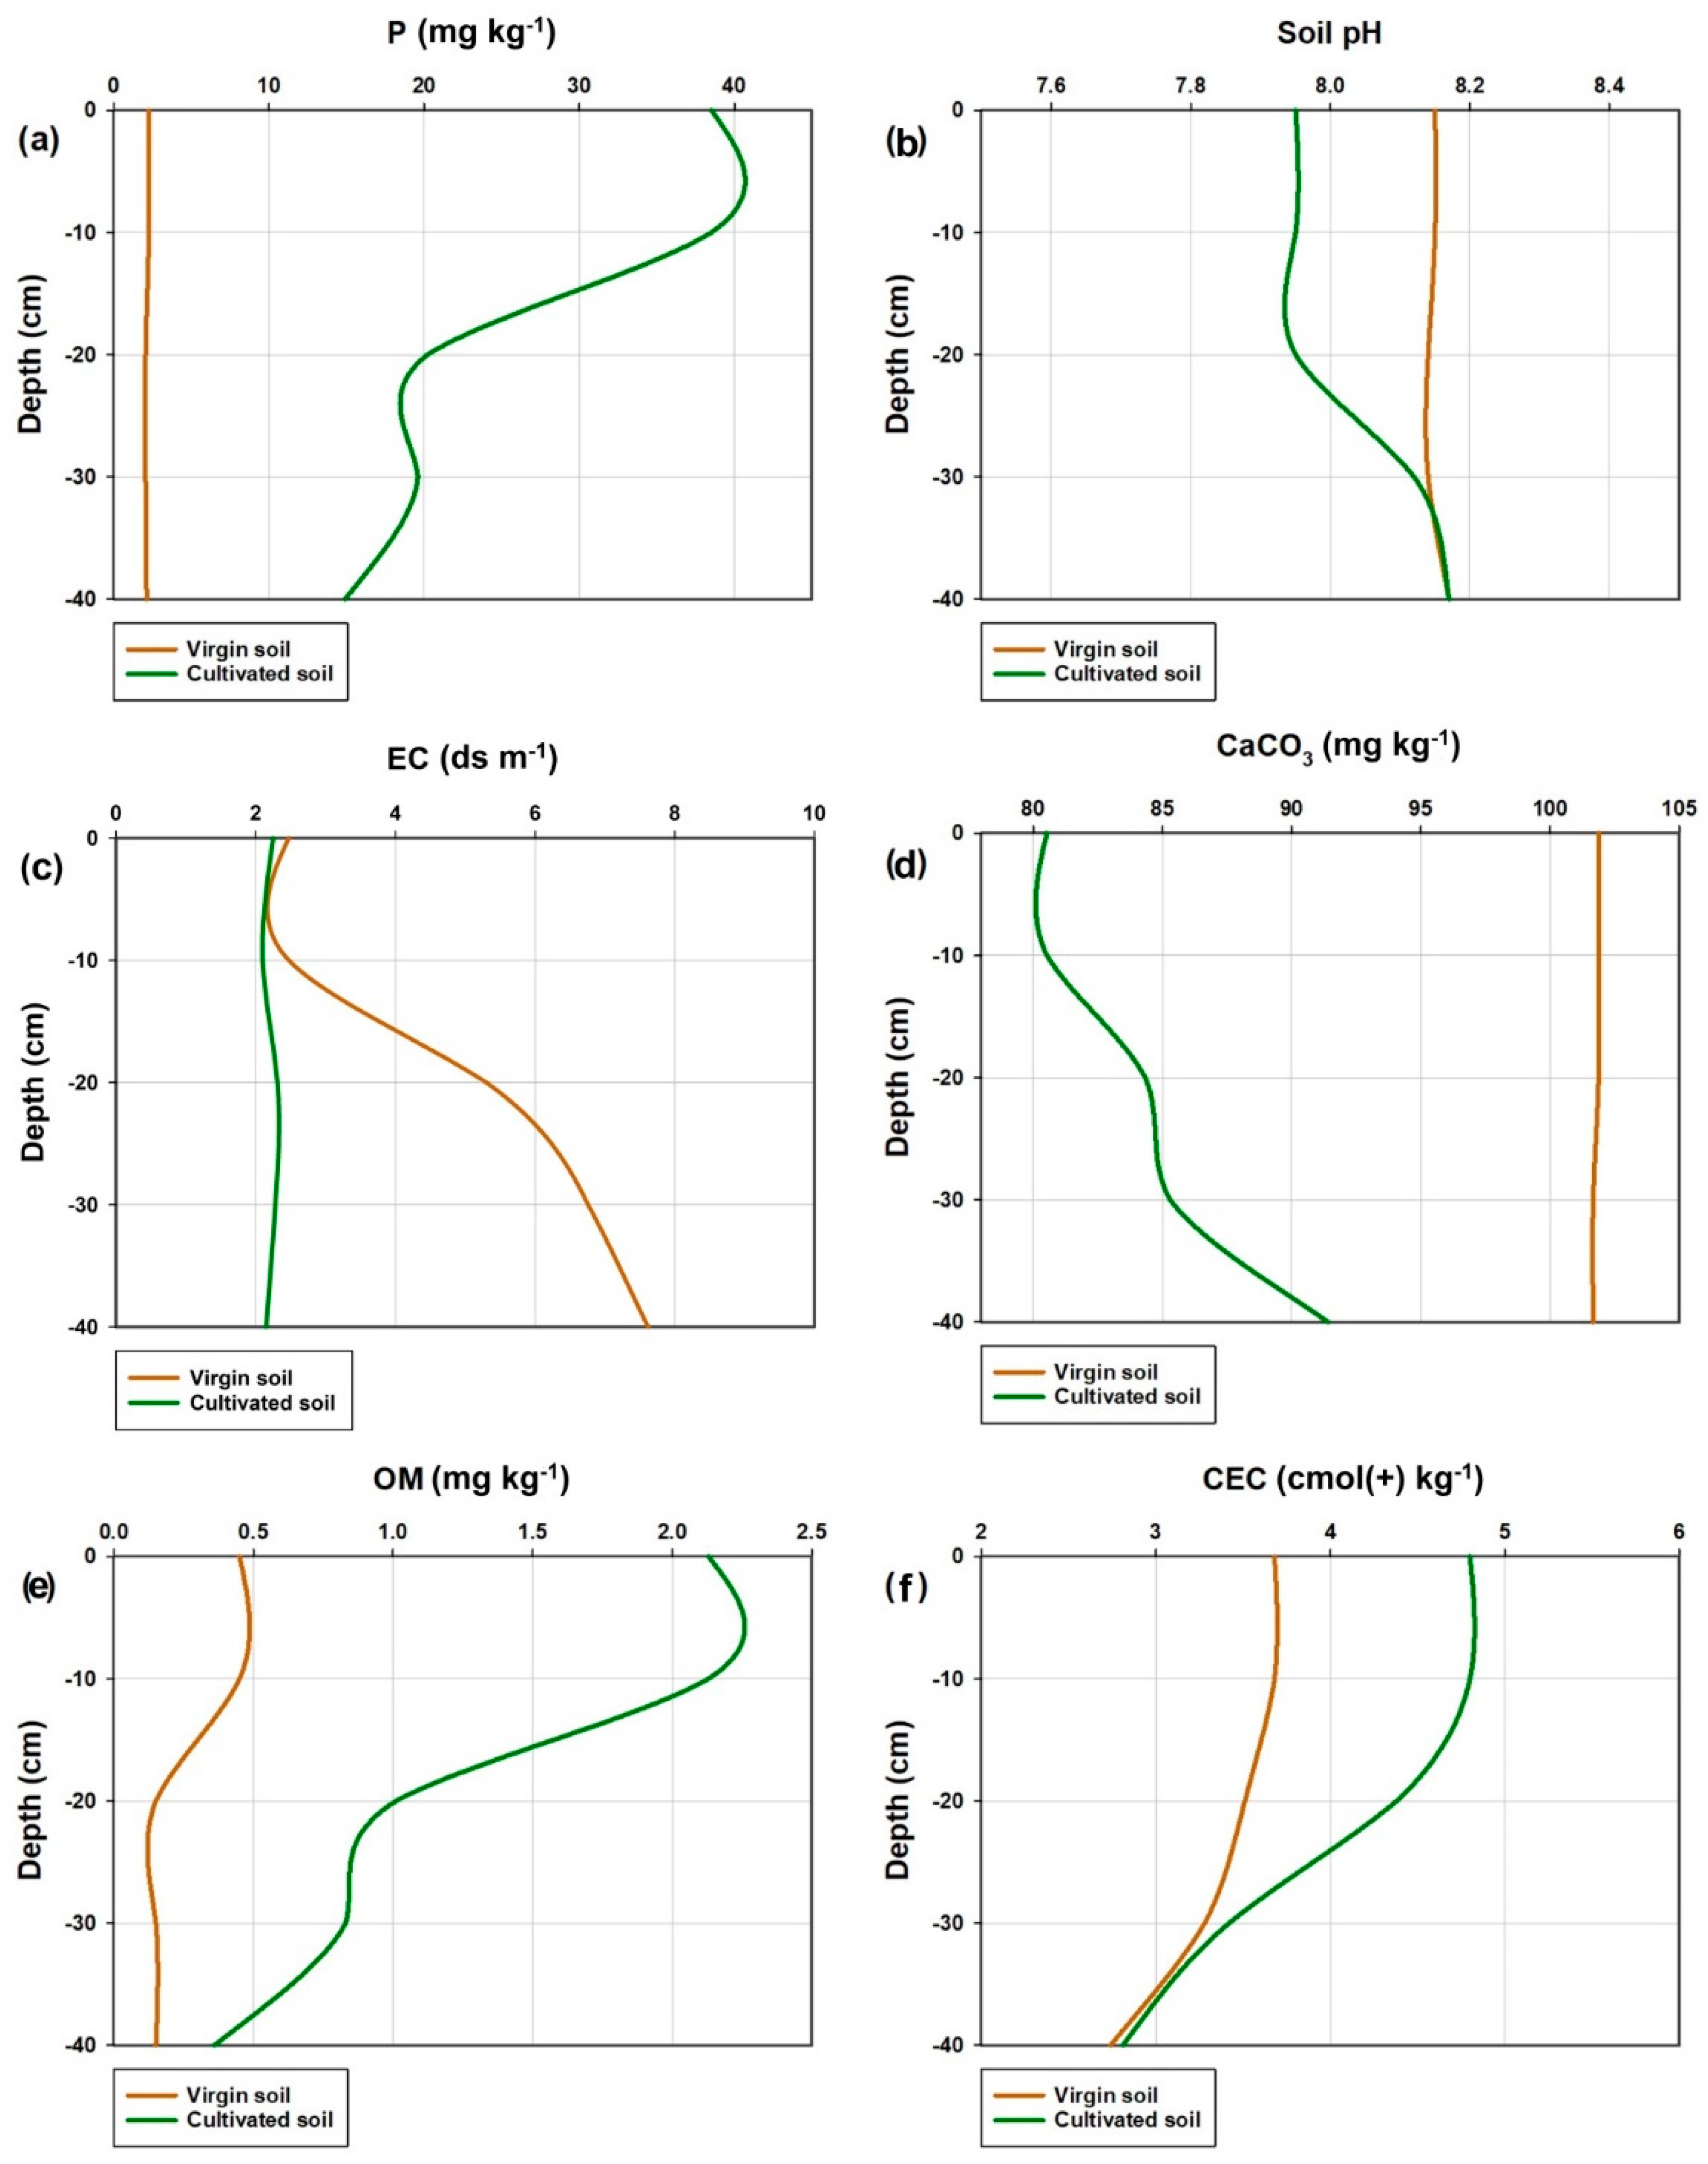
3.2. Cultivation-Induced Changes

3.2.1. Soil Phosphorus

The results indicated that cultivation had a positive impact on the P levels in the cultivated soil compared to those in the uncultivated (virgin) soil. The available P levels in cultivated soil were higher than those in virgin soil, with percentages of 1612.0%, 890.6%, 860.8%, and 606.1% at depths of 0–10, 10–20, 20–30, and 30–40 cm, respectively. These findings indicated that the available soil P in the cultivated soil significantly increased from more than 6 to more than 16 times across the studied depths compared to that of the virgin soil. The increases in P levels in cultivated soil decreased significantly as soil depth increased (Figure 4a). As shown in Figure 4a, the highest increase in the P levels of the cultivated soil was recorded in the surface layer (0–10 cm), while the lowest increase was observed in the deepest layer (30–40 cm). Figure 4a depicts the vertical distribution of the available P in both the cultivated and virgin soils.

3.2.2. Soil pH

Cultivation had a very slight impact on soil pH in the surface layers (0–10 and 10–20 cm), while there was no effect in the subsurface layers (20–30 and 30–40 cm), as shown in Figure 4b. The pH of the cultivated soil decreased slightly in the upper two depths compared to that of the virgin soil, with decreases of 2.5% and 2.3% for depths of 0–10 cm and 10–20 cm, respectively. At depths of 20–30 and 30–40 cm, the pH averages of cultivated and virgin soils were very close or the same, indicating that cultivation did not affect pH at these depths (Figure 4b). The decrease in cultivated soil pH decreased with increasing soil depth, with the deepest depth (30–40 cm) having the same average pH (8.17) as virgin soil (Figure 4b).

3.2.3. Soil Electrical Conductivity (EC)

Cultivation had a significant positive impact on soil salinity, with all the studied soil depths having a low mean electrical conductivity varying from 2.15 to 2.31 dS m−1 (Figure 4c). There were decreases in soil salinity across all the studied depths in the cultivated soil, with reductions of 8.9%, 56.4%, 66.3%, and 71.8% for depths of 0–10, 10–20, 20–30, and 30–40 cm, respectively, in comparison with those of the virgin soil. Figure 4c showed that the salinity of the cultivated soil was consistent across all the studied depths, in contrast to the virgin soil, which had a varying salinity at different soil depths. Furthermore, Figure 4c showed that the greatest reduction (−71.8%) in soil salinity occurred at a depth of 30–40 cm, while the smallest decrease (−8.9%) appeared at a depth of 0–10 cm.

3.2.4. Soil Lime Content

The mean values of the lime (CaCO3) content in the cultivated and virgin soils, with the differences between them across all the studied depths, are shown in Figure 4d. The cultivation process reduced the calcium carbonate content of the cultivated soil compared to that of the virgin soil at all the studied depths (Figure 4d). There were decreases in the lime content of the cultivated soil by 21.0%, 17.1%, 16.3%, and 10.1% at depths of 0–10, 10–20, 20–30, and 30–40 cm, respectively, in comparison to the uncultivated (virgin) soil. The reduction in cultivated soil calcium carbonate content decreased as the soil depth increased, so the greatest decrease (−21.0%) existed at a depth of 0–10 cm, while the smallest (−10.1%) occurred at a depth of 30–40 cm (Figure 4d). Figure 4d illustrates the vertical distribution of calcium carbonate content in both the cultivated and virgin soils.

3.2.5. Soil Organic Matter (OM)

Figure 4e shows the mean values of organic matter content for the virgin and cultivated soils with the differences between them at all the depths studied. This graph demonstrated that cultivation had a considerable impact on soil organic matter content, with great differences between the mean values of the cultivated and virgin soil. There were increases in cultivated soil organic matter content compared to that of virgin soil by 167.9%, 124.2%, 119.3%, and 78.8%, at depths of 0–10, 10–20, 20–30, and 30–40 cm, respectively. As shown in Figure 4e, the increases in soil organic matter decreased with increasing soil depth. The greatest increase in organic matter occurred in the soil surface layer at a depth of 0–10 cm, while the smallest appeared at a depth of 30–40 cm (Figure 4e). The vertical distributions of soil organic matter across all the studied depths for the virgin and cultivated soils are shown in Figure 4e.

3.2.6. Cation Exchange Capacity (CEC)

The mean values of the cation exchange capacity (CEC) for the virgin and cultivated soils, and the changes between them across all the studied depths, are shown in Figure 4f. Figure 4f shows that cultivation had a positive effect on CEC across all depths studied where CEC values increased. There were increases in CEC of cultivated soil compared to virgin soil by 30.4, 24.8, 3.4, and 2.6%, at depths of 0–10, 10–20, 20–30, and 30–40 cm, respectively (Figure 4f). The vertical distributions of the CEC across all the studied depths for the cultivated and uncultivated soils are shown in Figure 4f. As illustrated in Figure 4f, the increases in the CEC reduced as the soil depth increased. The highest increase in the CEC occurred in the topsoil at depths of 0–10 and 10–20 cm, while the lowest increase occurred in the subsoil at depths of 20–30 and 30–40 cm (Figure 4f).

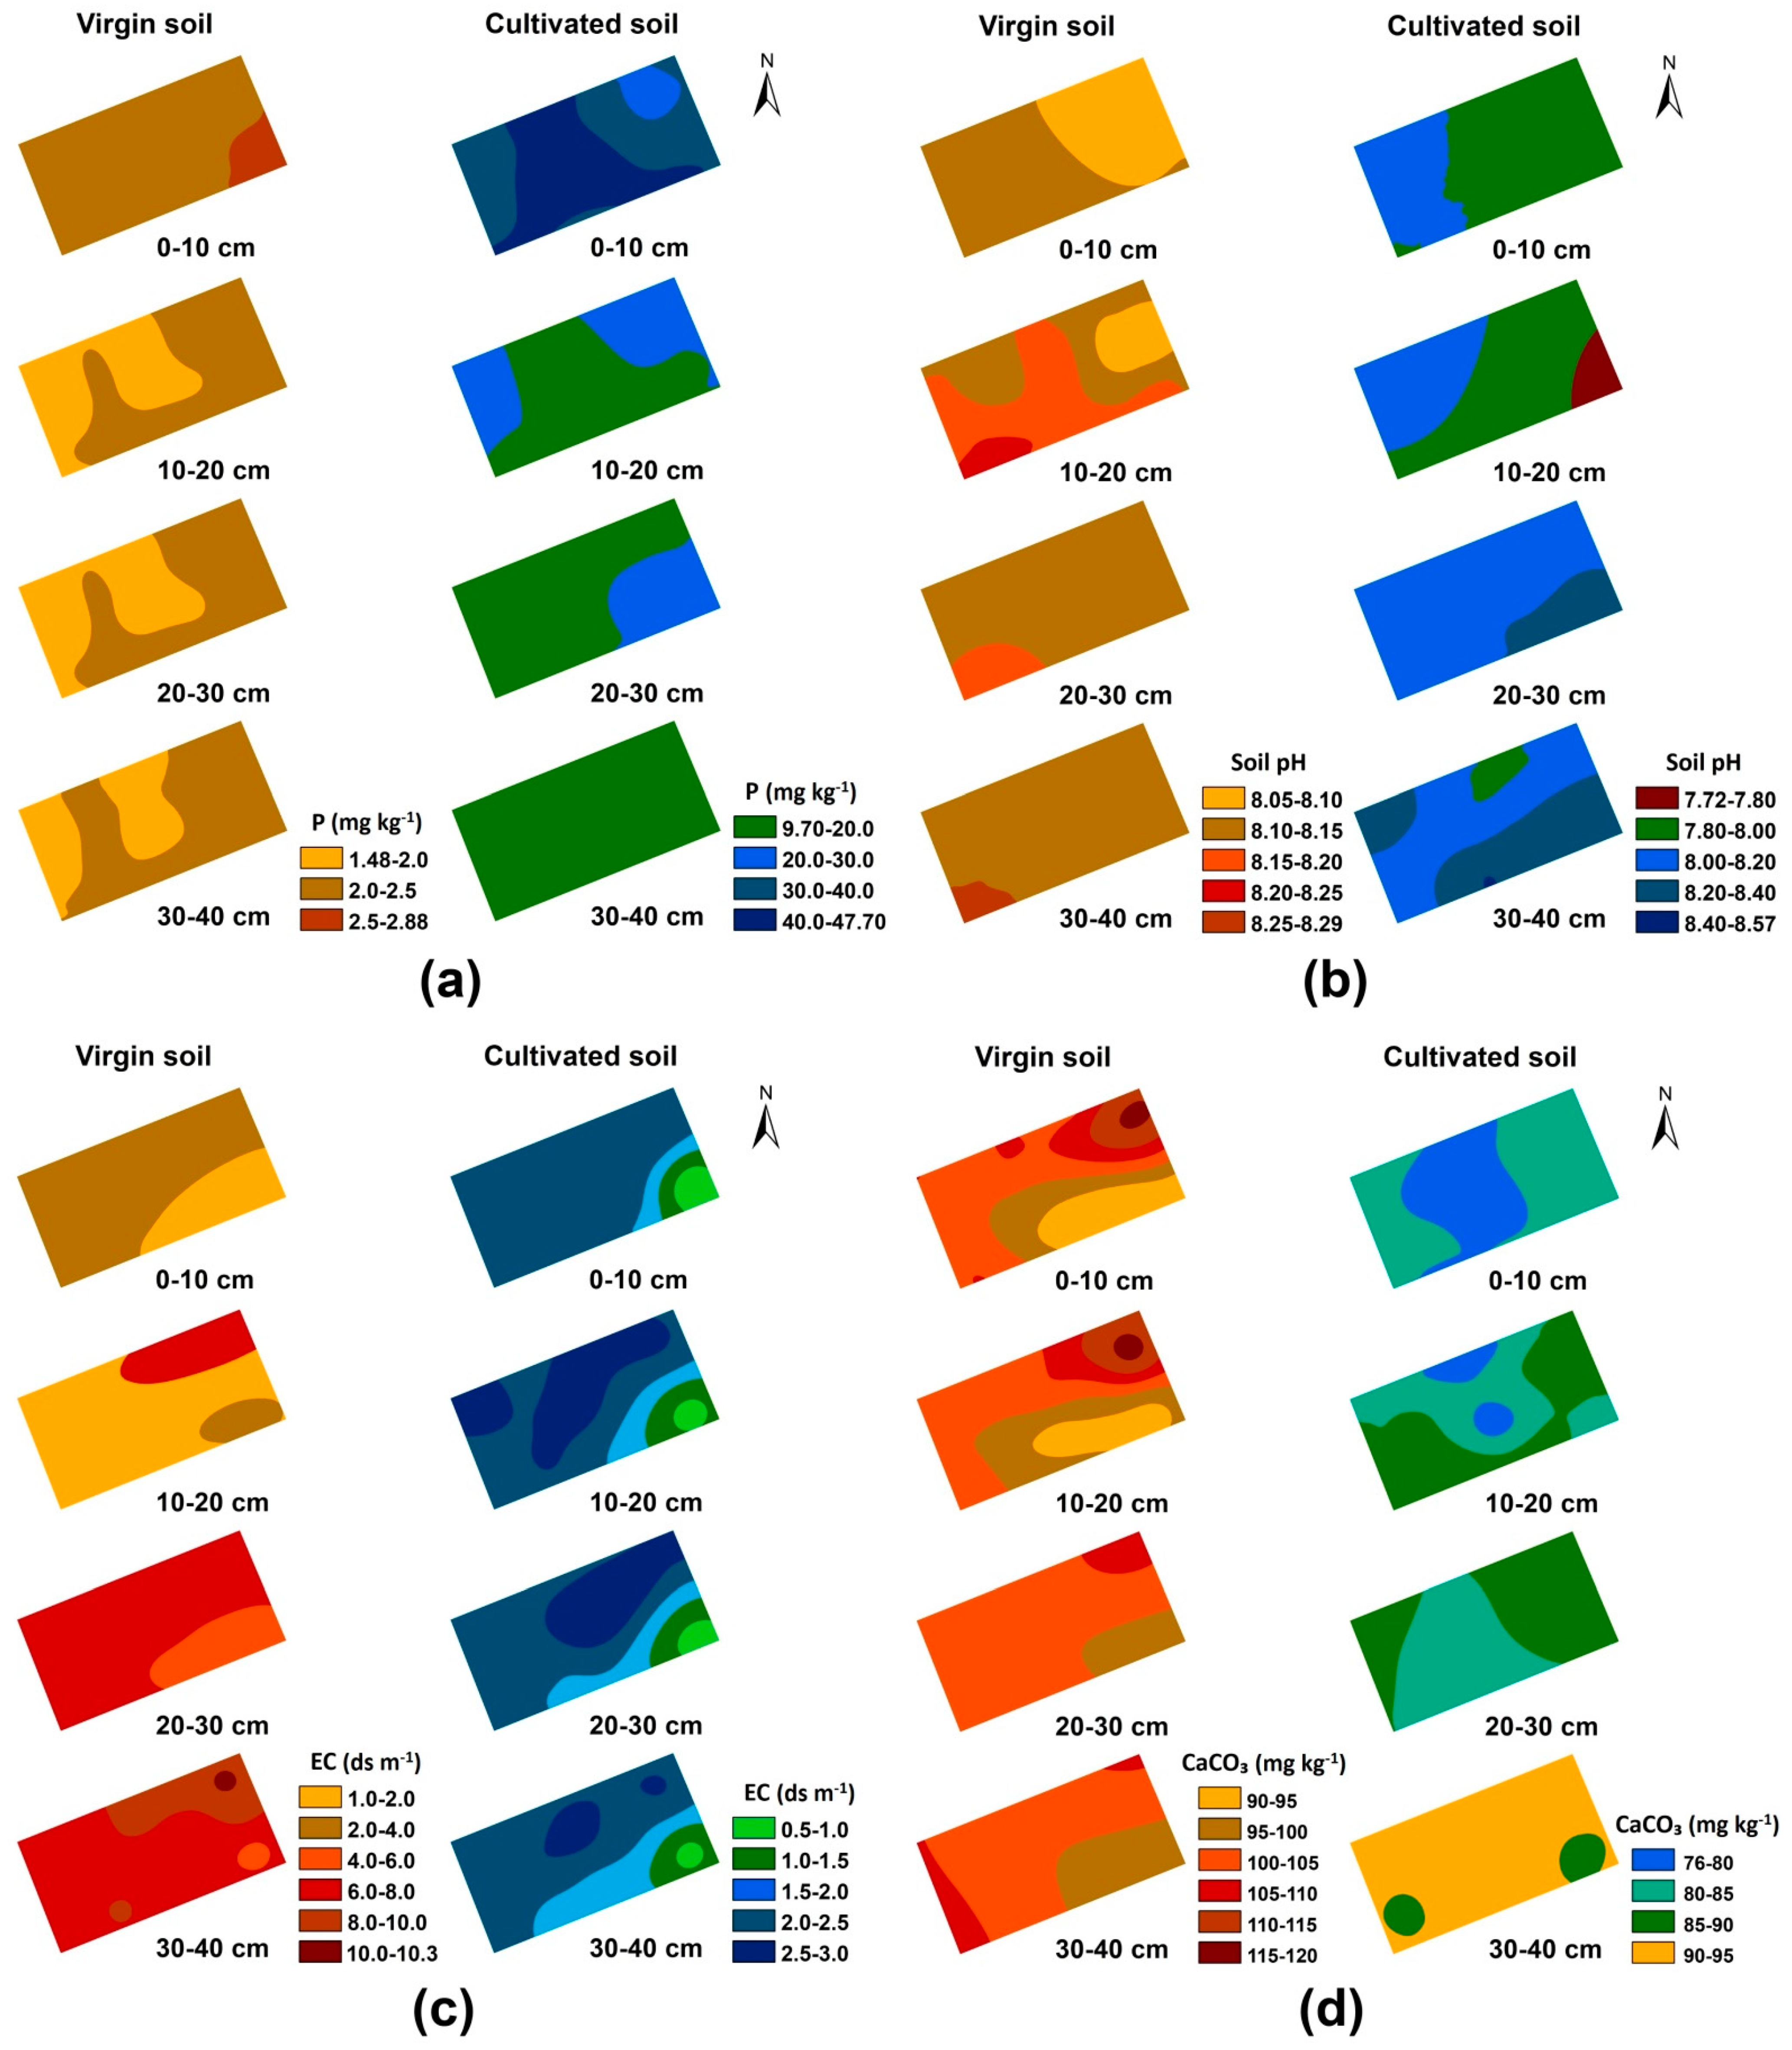
3.3. Geostatistical Analysis and Spatial Distribution of Soil Properties

For maintaining soil and plant sustainability, precision agriculture depends significantly on the information gained from the assessment and mapping of the spatial variation of soil characteristics [52]. In this study, semivariogram models (Circular, Spherical, Tetraspherical, Pentaspherical, Exponential, Gaussian, Rational Quadratic, Hole Effect, K-Bessel, J-Bessel, and Stable) have been experimented with for each soil attribute dataset. The best-fitted semivariogram models for the studied soil properties, as well as their prediction errors, are shown in Table 3. Based on the cross-validation of the performance of the 11 semivariogram models assessed, 8 models were chosen as the best-fitted models for mapping the spatial variability of the selected properties of virgin and cultivated soils at the four depths examined. The best semivariogram models were Pentaspherical, Exponential, Gaussian, Rational Quadratic, Hole Effect, K-Bessel, J-Bessel, and Stable (Table 3).
The number of samples taken, the distance between sampling sites, and the interpolation method used all affect the prediction of soil property spatial distribution [53,54]. In general, the greater the number of samples, the more accurate the maps of the soil attributes become [53,55]. The spatial variability map of the available phosphorus illustrated that the spatial distributions of phosphorus in the virgin soil were highly similar in all depths investigated, except the surface layer (0–10 cm), which has some variation, while the cultivated soil had a considerable spatial variation in the surface layer (0–10 cm), which decreased with increasing depth (Figure 5a). Generally, the spatial variability of the available phosphorus in the cultivated soil was greater than that in the virgin soil.
According to Figure 5b, both soils had low spatial variability in soil pH, although the variation in the cultivated soil was slightly higher than in the virgin soil. Concerning the spatial variability of soil salinity (EC), it increased dramatically in the virgin soil from the surface layer to subsurface layers, whereas it varied slightly and was almost identical throughout all the depths of the cultivated soil (Figure 5c). Furthermore, Figure 5d shows that the two upper depths (0–10 and 10–20 cm) of the virgin soil had the same spatial distribution of calcium carbonates, with high spatial variability in comparison to the deeper depths (20–30 and 30–40 cm), which were similar in their spatial pattern. On the other hand, the cultivated soil demonstrated low spatial variability in the CaCO3 content across all depths tested, with the exception of 10–20 cm (Figure 5d).
There was no spatial variation in the organic matter content of virgin soil throughout all the studied depths, except the surface layer (0–10 cm), where few variations were detected (Figure 5e). On the other hand, concerning the cultivated soil, there was a high organic matter spatial variation in the surface layers (0–10 and 10–20 cm), though this variation disappeared in the subsurface layers (20–30 and 30–40 cm), as shown in Figure 5e. Moreover, Figure 5f displays the spatial distribution patterns of cation exchange capacity (CEC) across all the depths examined in both soils. Both the virgin and cultivated soils had almost identical spatial distribution patterns of the CEC at the deepest depth (30–40 cm), albeit with considerable variability, but they showed less variation at the other depths. In addition, the cultivated soil exhibited a homogeneous spatial distribution at depths of 0–10 and 10–20 cm (Figure 5f).

4. Discussion

Our results indicated considerable changes in soil attributes; we assumed that these changes were caused by the cultivation and management of these soils, considering that they are derived from the same parent material and have the same climate. In this approach, our findings provide good knowledge of the relationships between soil property changes and the cultivation period (short term), which can improve environmental management and solve many agricultural management issues [56]. Furthermore, the results indicated that changes in land use and intensive cultivation influence soil properties [17,57], whether in the short or long term. Land use and management typically alter the properties of different soil types, ranging from sandy soils [58,59,60,61] to clayey soils [61,62] and from lowlands [63] to steepy lands [64].
The results indicated that cultivation had a positive impact on the phosphorus levels in the cultivated soil compared to those of the uncultivated (virgin) soil. This finding is consistent with the reports and observations of previous studies elsewhere, e.g., [20,65,66,67,68,69,70,71,72], which indicated that cultivated soils had the highest value of available P as compared to uncultivated soils and other land uses (e.g., forestlands, grasslands, rangelands, etc.). On the other hand, the low levels of available phosphorus in uncultivated land (virgin soil) could be due to the inherent phosphorus deficiency of this soil, owing to the nature of the parent material and the arid climate [65,67,73,74]. Moreover, the greater available P levels in cultivated soil than those in uncultivated soil can be attributed to the continuous application of P fertilizer, manure, and crop residue provided during cultivation [20,65,67,70,71,75,76,77,78,79]. The surface layers in cultivated soil have higher available phosphorus content than the subsurface layers, which can be attributable to the addition of fertilizers and manures, and this result is in agreement with previous studies, e.g., [65,67,70,72,73,80,81].
Moreover, according to Carrow et al. [82], the P-Olsen in cultivated soil (14.9–38.5 mg kg−1) is considered sufficient compared to that in virgin soil (2.04–2.25 mg kg−1), which had a very low and insufficient level. The increases in the phosphorus levels in cultivated soil decreased significantly as the soil depth increased (Figure 4a). The lower levels of the available P in the subsoil layers might also be due to the restriction of the soil P in the topsoil layers, due to its low mobility [70,80]. Overall, our results are in agreement with the findings reported by other authors, e.g., [65,66,68,72,75,78,83], which show that the available soil P is greatly influenced by land-use types and soil management practices.
Based on the mean values of pH, both of the investigated land uses (cultivated and uncultivated) were determined to be slightly alkaline soils, as shown in Table 1 and Table 2 [84]. Continuous cultivation practices, organic and inorganic fertilizer applications, and land-use types could be factors accountable for the variation in soil pH regarding soil depth [70,83,85,86,87,88,89]. In line with the findings of the current study, cultivation had a slight impact on soil pH in the surface layers (0–10 and 10–20 cm), while there was no effect in the subsurface layers (20–30 and 30–40 cm), as shown in Figure 4b.
The pH of cultivated soil decreased slightly in the upper two depths compared to that of virgin soil. Alemayehu and Sheleme [75] also observed a decrease in soil pH values at two depths (0–15 and 15–30 cm) under cultivation. Deposition of root exudates might be one reason for the reduced soil pH in the surface soil layers of cultivated soil compared to those of virgin soil [70,90]. Furthermore, the exhaustion of basic cations owing to plant uptake and leaching, as well as the generation of organic acids due to microbial oxidation, might explain why cultivated soil (cropland) has a lower pH than uncultivated land [70,91,92]. Fertilization with inorganic fertilizers such as urea and superphosphate, which are applied under the current management practices in cultivated soil, could be considered another important factor responsible for reducing soil pH [65].
At depths of 20–30 and 30–40 cm, the pH averages of the cultivated and virgin soils were very close or the same, indicating that cultivation did not affect pH at such depths (Figure 4b). This finding is in line with that of Bhunia et al. [93], who found that the pH increased with the soil depth under cultivated land. The decrease in cultivated soil pH decreased with increasing soil depth, with the deepest depth (30–40 cm) having the same average pH (8.17) as virgin soil (Figure 4b). This is consistent with the findings of Muche et al. [94], who stated that the pH of cultivated land was more acidic than the pH of the other studied land-use types.
The present study reported that the cultivation process had a significant positive impact on soil salinity at all the studied soil depths, which had a low mean of electrical conductivity (Figure 4c). The mean salinity of the studied cultivated soil down to 40 cm (≤2.3 dS m−1) was considerably lower than that of the virgin land, which may be due to the movement of soluble salts to the subsoil with irrigation water [95]. This finding agrees with Mandal et al. [67], who mentioned that the overall electrical conductivity value of cultivated lands (croplands) down to 90 cm was lower than that of uncultivated lands.
Our results showed that cultivated soil had a considerable percentage reduction in salinity compared to virgin soil. The current study indicated that short-term cultivation did not induce soil salinization. The most plausible causes for having low salinity under the cultivated soil in the current study could be attributed to the acceptable irrigation water quality, appropriate irrigation method, and adequate natural drainage of this sandy soil, which may contribute to the leaching of salts from the root zone.
Furthermore, Figure 4c showed that the greatest reduction in soil salinity occurred at a depth of 30–40 cm, indicating that the current applied soil management is successful in removing soluble salts from all the studied depths (0–40 cm). Overall, soil management plays a pivotal role in maintaining or causing soil salinization [96,97,98,99,100].
According to the mean values, the CaCO3 content of the virgin soil was higher than that of the cultivated soil, as displayed in Table 1 and Table 2. This finding demonstrated that, even in the short term (5 years), the cultivation process affected the calcium carbonate content of the virgin soil in the study area. The cultivation process reduced the calcium carbonate content of the cultivated soil compared to the virgin soil at all the studied depths (Figure 4d). The decreases in the lime content of the cultivated soil were by −21.0%, −17.1%, −16.3%, and −10.1% at depths of 0–10, 10–20, 20–30, and 30–40 cm, respectively, in comparison to the uncultivated (virgin) soil. These results are in agreement with those of Alnaimy et al. [101], who reported that CaCO3 contents were 40.88%, 29.22%, 25.32%, and 12.76% for the uncultivated (virgin) soil, 5, 10, 20, and 50 years after cultivation, respectively.
The reduction in the cultivated soil calcium carbonate content decreased as the soil depth increased. Therefore, the greatest decrease existed at the surface layer (0–10 cm), while the smallest occurred at the subsurface layer (30–40 cm), as illustrated in Figure 4d. This result could be attributed to the effects of organic matter decomposition, the nitrification process, the application of acidic fertilizer, the dissolution of CaCO3, and the movement of the CaCO3 particles downward with water, all of which lead to the decline of CaCO3 in the surface layers of the soil and its increase in the subsurface layers [101,102,103,104,105].
Soil organic matter is a significant contributor to soil function [106,107], and, as one of the dynamic soil characteristics, it varies among land uses and with soil depth within a particular land use type. Although the organic matter (OM) content of both soils ranged from extremely low (virgin land) to low (cultivated soil), as shown in Table 1 and Table 2, the OM content of the cultivated soil was significantly higher than that of the virgin soil. In the current study, both soils have the same textural class, climatic condition, and parent material, suggesting that OM variability is caused by human-induced activities such as cultivation and organic-material application. This finding suggests that increasing OM could enhance the other soil properties under cultivation practice, as numerous previous studies revealed that adequate OM content had improved soil quality and productivity and vice versa, e.g., [108,109,110,111,112,113,114,115,116,117,118,119,120,121,122].
Figure 4e demonstrated that cultivation had a considerable impact on soil OM content, with increases in cultivated soil OM content compared to that of virgin soil at all depths tested. The greater OM content of cultivated soil compared to that of uncultivated soil is attributed to agricultural additions such as farmyard manure, crop residues remaining after harvest, and the farmers in the study area [36,70,121,123].
Soil depth exerted a strong effect on the vertical distribution of OM content. As shown in Figure 4e, the increases in soil OM decreased with increasing soil depth. These results are in agreement with those of previous studies, which reported that the topsoil layers of the cultivated soils had higher soil organic carbon content than the respective subsoil layers and that it decreased with depth [36,70,124,125,126].
Our findings demonstrated that both virgin soil and cultivated soil were characterized by a low cation exchange capacity (CEC), based on the mean values of the CEC, as shown in Table 1 and Table 2. This can be attributed to the nature of these soils, which contain coarse-textured parent material (sandy) with a low number of finer particles (clay fraction) and low organic matter content. Essentially, the CEC of a soil relies on the relative amounts and kind of colloidal particles (humus and clay), since both provide negatively charged surfaces that are vital in the exchange process [75,94,127,128]. The current study results showed that cultivation had a positive effect on CEC across all the studied depths, while the CEC values of the cultivated soil increased (Figure 4f). The CEC of the cultivated soil was higher than that of the virgin soil by 30.4%, 24.8%, 3.4%, and 2.6%, at depths of 0–10, 10–20, 20–30, and 30–40 cm, respectively (Figure 4f). Since both soils have low clay content, the higher CEC values of the cultivated soil than those of the virgin soil may be attributed to the higher organic matter content, which is induced by cultivation activities. In line with this, previous studies, e.g., [59,75,127,128,129,130,131], reported that the decline in organic matter in the cultivated soil resulted in the CEC reduction.
Increases in the CEC declined as the soil depth increased, as demonstrated in Figure 4f, and the highest increases occurred in the topsoil layers (0–10 and 10–20 cm), while the least happened in the subsoil layers (20–30 and 30–40 cm). This might be attributable to the greater amount of soil organic matter in the surface layers, as a result of organic inputs such as manure and crop residues [94,127,128]. According to our findings, organic matter is the predominant source of the cation exchange capacity in the investigated soils; hence, organic application in soil management should be emphasized to improve CEC and fertility.
The RMSSE values were close to one [132], while the MSE was small and close to zero, and the RMSE and ASE were low and close to each other (Table 3). The low ME and MSE values indicate that the predicted soil characteristic values are much closer to the observed values [133]. The results showed that among the 1 ordinary kriging (OK) models evaluated, there was no single model to fit all soil attributes at all depths; however, the chosen model as the best-fit model differed according to the soil property and soil depth [52,134]. Cross-validation of the performance of the 1 semivariogram models evaluated revealed that only 8 models were best-fitted for mapping the spatial variability of the selected characteristics of the virgin and cultivated soils at the four depths investigated. Exponential, Gaussian, Hole Effect, J-Bessel, K-Bessel, Pentaspherical, Rational Quadratic, and Stable semivariogram models were the best models (Table 3). These outcomes revealed that the chosen models are the best-fitted semivariogram models for predicting and mapping the spatial pattern surfaces of the studied soil properties at the different depths investigated. As a consequence, the generated spatial variation maps accurately show the variation in soil properties in the study area, and they may, thus, be utilized for site-specific management [52,135].
The created spatial variability maps revealed variation for soil properties that was consistent with the coefficients of variation (CV) values, and the vertical variation figures confirmed the accuracy of these maps. Therefore, soil parameters with high CV values showed high spatial variability and vice versa. Furthermore, the spatial variability maps of the cultivated soil illustrated that some soil properties, particularly phosphorus and organic matter, had a considerable spatial variation [136,137], especially in the surface layers, due to the cultivation impacts, while others were not influenced, such as silt, clay, sand, and pH [52,134]. Contrary, the soil salinity of the cultivated soil was homogeneous and varied very slightly with the soil depth, which is attributed to leaching salts from the studied depths due to irrigation. Overall, the spatial distribution patterns of the selected soil properties were diverse between the virgin soil and cultivated soil as well as among soil depths. Moreover, the results showed that the spatial distribution of the soil properties can be different even at a small scale (0.5 ha). Hence, continuous monitoring of the effects of diverse soil-management strategies aids in the knowledge of the continuous changes in soil physical and chemical characteristics, which is critical for maintaining satisfactory soil quality and sustainable soil productivity in the study area [138,139].

5. Conclusions

The current study indicated that, even in the short term (5 years), cultivation has an impact on soil characteristics. Compared to virgin land, cultivated land had considerable positive changes in some attributes, such as available phosphorus, soil salinity, and organic matter content. Moreover, some other properties of the cultivated soil improved, particularly in the surface soil layers, such as pH, CaCO3, and CEC. These findings recommend that the reclamation and cultivation of virgin lands in arid regions with the appropriate management will enhance their capabilities to support sustainable agricultural production and prevent soil desertification in these regions due to climate change.
The cross-validation of the created spatial variability maps confirmed the excellent accuracy of these maps. Therefore, decision-makers and farmers could use these maps to gain a better understanding of the variability of soil properties at the farm scale. Furthermore, these maps will be helpful in applying the appropriate management practices.
Since the current study provides information on cultivation-induced changes in the short term, understanding ongoing changes in soil physical and chemical characteristics is required for maintaining satisfactory soil quality and sustainable soil productivity in arid lands. Therefore, continuous monitoring of the effects of various soil-management strategies in the short term is recommended.

Author Contributions

Conceptualization, S.A.H.S., S.H.A. and A.G.I.; methodology, S.A.H.S. and A.G.I.; software, S.A.H.S. and A.G.I.; validation, S.A.H.S., S.H.A. and R.J.-B.; formal analysis, S.A.H.S. and A.G.I.; investigation, S.A.H.S., S.H.A. and A.G.I.; resources, S.A.H.S., S.H.A., R.J.-B. and A.G.I.; data curation, S.A.H.S., S.H.A., R.J.-B. and A.G.I.; writing—original draft preparation, S.A.H.S. and A.G.I.; writing—review and editing, S.A.H.S., S.H.A., R.J.-B. and A.G.I.; visualization, S.A.H.S., S.H.A., R.J.-B. and A.G.I.; supervision, S.A.H.S., S.H.A. and R.J.-B. All authors have read and agreed to the published version of the manuscript.

Funding

This research received no external funding.

Institutional Review Board Statement

Not applicable.

Informed Consent Statement

Not applicable.

Data Availability Statement

The data that support the findings of this study are available from the corresponding author, upon reasonable request.

Conflicts of Interest

The authors declare no conflict of interest.

References

  1. FAO. The Future of Food and Agriculture, Trends and Challenges; FAO: Rome, Italy, 2017; ISBN 9789251095515. [Google Scholar]
  2. Lal, R. Soil degradation as a reason for inadequate human nutrition. Food Secur. 2009, 1, 45–57. [Google Scholar] [CrossRef]
  3. Lal, R. Climate Change and Soil Degradation Mitigation by Sustainable Management of Soils and Other Natural Resources. Agric. Res. 2012, 1, 199–212. [Google Scholar] [CrossRef] [Green Version]
  4. Verheye, W. Soils of arid and semi-arid areas. In Land Use, Land Cover and Soil Sciences-Volume II: Land Evaluation; Verheye, W., Ed.; Encyclopedia of Life Support Systems (EOLSS): Paris, France, 2009; Volume II, pp. 1–29. [Google Scholar]
  5. Maleki, S.; Karimi, A.; Zeraatpisheh, M.; Poozeshi, R.; Feizi, H. Long-term cultivation effects on soil properties variations in different landforms in an arid region of eastern Iran. CATENA 2021, 206, 105465. [Google Scholar] [CrossRef]
  6. Zhang, J.; Song, C.; Yang, W. Effects of cultivation on soil microbiological properties in a freshwater march soil in Northeast China. Soil Tillage Res. 2007, 93, 231–235. [Google Scholar] [CrossRef]
  7. Ajami, M.; Heidari, A.; Khormali, F.; Gorji, M.; Ayoubi, S. Environmental factors controlling soil organic carbon storage in loess soils of a subhumid region, northern Iran. Geoderma 2016, 281, 1–10. [Google Scholar] [CrossRef]
  8. Alidoust, E.; Afyuni, M.; Hajabbasi, M.A.; Mosaddeghi, M.R. Soil carbon sequestration potential as affected by soil physical and climatic factors under different land uses in a semiarid region. CATENA 2018, 171, 62–71. [Google Scholar] [CrossRef]
  9. Song, Q.; Gao, X.; Du, H.; Lei, J.; Li, S.; Li, S. Cultivation impacts on soil texture during oasis expansion in Xinjiang, Northwest China: Wind erosion effects. Aeolian Res. 2021, 50, 100646. [Google Scholar] [CrossRef]
  10. Zeraatpisheh, M.; Bakhshandeh, E.; Hosseini, M.; Alavi, S. Assessing the effects of deforestation and intensive agriculture on the soil quality through digital soil mapping. Geoderma 2020, 363, 114139. [Google Scholar] [CrossRef]
  11. Bahrami, S.; Ghahraman, K. Geomorphological controls on soil fertility of semi-arid alluvial fans: A case study of the Joghatay Mountains, Northeast Iran. CATENA 2019, 176, 145–158. [Google Scholar] [CrossRef]
  12. Delpupo, C.; Schaefer, C.; Roque, M.; Faria, A.; Rosad, K.; Thomazini, A.; de Paula, M. Soil and landform interplay in the dry valley of Edson Hills, Ellsworth Mountains, continental Antarctica. Geomorphology 2017, 295, 134–146. [Google Scholar] [CrossRef]
  13. Fathizad, H.; Hakimzadeh Ardakani, M.A.; Sodaiezadeh, H.; Kerry, R.; Taghizadeh-Mehrjardi, R. Investigation of the spatial and temporal variation of soil salinity using random forests in the central desert of Iran. Geoderma 2020, 365, 114233. [Google Scholar] [CrossRef]
  14. Maleki, S.; Khormali, F.; Bagheri Bodaghabadi, M.; Mohammadi, J.; Hoffmeister, D.; Kehl, M. Role of geomorphic surface on the above-ground biomass and soil organic carbon storage in a semi-arid region of Iranian loess plateau. Quat. Int. 2020, 552, 111–121. [Google Scholar] [CrossRef]
  15. Schlesinger, W.H. An evaluation of abiotic carbon sinks in deserts. Glob. Chang. Biol. 2016, 23, 25–27. [Google Scholar] [CrossRef] [PubMed] [Green Version]
  16. Adams, A.M.; Gillespie, A.W.; Dhillon, G.S.; Kar, G.; Minielly, C.; Koala, S.; Ouattara, B.; Kimaro, A.A.; Bationo, A.; Schoenau, J.J.; et al. Long-term effects of integrated soil fertility management practices on soil chemical properties in the Sahel. Geoderma 2020, 366, 114207. [Google Scholar] [CrossRef]
  17. Chen, L.; Qi, X.; Zhang, X.; Li, Q.; Zhang, Y. Effect of agricultural land use changes on soil nutrient use efficiency in an agricultural area, Beijing, China. Chin. Geogr. Sci. 2011, 21, 392–402. [Google Scholar] [CrossRef]
  18. Dereje, G. Effect of Land use Types on Selected Soil Physical and Chemical Properties at Sire Morose Sub Watershed, Central Highland of Ethiopia. Int. J. Eng. Res. Technol. 2020, 9, 770–779. [Google Scholar] [CrossRef]
  19. Marzaioli, R.; D’Ascoli, R.; De Pascale, R.A.; Rutigliano, F.A. Soil quality in a Mediterranean area of Southern Italy as related to different land use types. Appl. Soil Ecol. 2010, 44, 205–212. [Google Scholar] [CrossRef]
  20. Tellen, V.A.; Yerima, B.P.K. Effects of land use change on soil physicochemical properties in selected areas in the North West region of Cameroon. Environ. Syst. Res. 2018, 7, 3. [Google Scholar] [CrossRef] [Green Version]
  21. Li, X.-G.; Li, F.-M.; Rengel, Z.; Bhupinderpal, S.; Wang, Z.-F. Cultivation effects on temporal changes of organic carbon and aggregate stability in desert soils of Hexi Corridor region in China. Soil Tillage Res. 2006, 91, 22–29. [Google Scholar] [CrossRef]
  22. Bruun, T.B.; Elberling, B.; de Neergaard, A.; Magid, J. Organic Carbon Dynamics in Different Soil Types After Conversion of Forest to Agriculture. Land Degrad. Dev. 2015, 26, 272–283. [Google Scholar] [CrossRef]
  23. Yang, T.; Siddique, H.M.; Liu, K. Cropping systems in agriculture and their impact on soil health—A review. Glob. Ecol. Conserv. 2020, 23, e01118. [Google Scholar] [CrossRef]
  24. Zhang, X.; Davidson, E.A.; Zou, T.; Lassaletta, L.; Quan, Z.; Li, T.; Zhang, W. Quantifying Nutrient Budgets for Sustainable Nutrient Management. Glob. Biogeochem. Cycles 2020, 34, e2018GB00606. [Google Scholar] [CrossRef] [Green Version]
  25. Yakubu, S. Changes in soil physical properties due to different land uses in part of Nigeria Northern Guinea Savanna. Zaria Geogr. 2010, 18, 47–56. [Google Scholar]
  26. García-Orenes, F.; Guerrero, C.; Roldan, A.; Mataix-Solera, J.; Cerdà, A.; Campoy, M.; Zornoza, R.; Bárcenas, G.; Caravaca, F. Soil microbial biomass and activity under different agricultural management systems in a semiarid Mediterranean agroecosystem. Soil Tillage Res. 2010, 109, 110–115. [Google Scholar] [CrossRef]
  27. He, M.; Ji, X.; Bu, D.; Zhi, J. Cultivation effects on soil texture and fertility in an arid desert region of northwestern China. J. Arid Land 2020, 12, 701–715. [Google Scholar] [CrossRef]
  28. Li, Y.Y.; Shao, M.A. Change of soil physical properties under long-term natural vegetation restoration in the Loess Plateau of China. J. Arid Environ. 2006, 64, 77–96. [Google Scholar] [CrossRef]
  29. Raiesi, F. Carbon and N mineralization as affected by soil cultivation and crop residue in a calcareous wetland ecosystem in Central Iran. Agric. Ecosyst. Environ. 2006, 112, 13–20. [Google Scholar] [CrossRef]
  30. Islam, K.R.; Weil, R.R. Land use effects on soil quality in a tropical forest ecosystem of Bangladesh. Agric. Ecosyst. Environ. 2000, 79, 9–16. [Google Scholar] [CrossRef]
  31. Bünemann, E.K.; Bongiorno, G.; Bai, Z.; Creamer, R.E.; De Deyn, G.; de Goede, R.; Fleskens, L.; Geissen, V.; Kuyper, T.W.; Mäder, P.; et al. Soil quality—A critical review. Soil Biol. Biochem. 2018, 120, 105–125. [Google Scholar] [CrossRef]
  32. Fernández, F.G.; Sorensen, B.A.; Villamil, M.B. A Comparison of Soil Properties after Five Years of No-Till and Strip-Till. Agron. J. 2015, 107, 1339–1346. [Google Scholar] [CrossRef]
  33. Jia, Z.; Kuzyakov, Y.; Myrold, D.; Tiedje, J. Soil Organic Carbon in a Changing World. Pedosphere 2017, 27, 789–791. [Google Scholar] [CrossRef]
  34. van Es, H.M.; Karlen, D.L. Reanalysis Validates Soil Health Indicator Sensitivity and Correlation with Long-term Crop Yields. Soil Sci. Soc. Am. J. 2019, 83, 721–732. [Google Scholar] [CrossRef] [Green Version]
  35. FAO. The State of Food Insecurity in the World: Strengthening the Enabling Environment for Food Security and Nutrition; FAO: Rome, Italy, 2014. [Google Scholar]
  36. Deng, L.; Wang, K.; Zhu, G.; Liu, Y.; Chen, L.; Shangguan, Z. Changes of soil carbon in five land use stages following 10 years of vegetation succession on the Loess Plateau, China. CATENA 2018, 171, 185–192. [Google Scholar] [CrossRef]
  37. Liu, Q.; Xu, H.; Yi, H. Impact of Fertilizer on Crop Yield and C:N:P Stoichiometry in Arid and Semi-Arid Soil. Int. J. Environ. Res. Public Health 2021, 18, 4341. [Google Scholar] [CrossRef]
  38. Rutkowska, A.; Pikuła, D. Effect of crop rotation and nitrogen fertilization on the quality and quantity of soil organic matter. In Soil Processes and Current Trends in Quality Assessment; Soriano, M.C.H., Ed.; Intech Open Book: Rijeka, Croatia, 2013; pp. 249–267. [Google Scholar]
  39. Šimanský, V.; Jonczak, J.; Horváthová, J.; Igaz, D.; Aydın, E.; Kováčik, P. Does long-term application of mineral fertilizers improve physical properties and nutrient regime of sandy soils? Soil Tillage Res. 2022, 215, 105224. [Google Scholar] [CrossRef]
  40. Abedi, F.; Amirian-Chakan, A.R.; Faraji, M.; Taghizadeh-Mehrjardi, R.; Kerry, R.; Razmjoue, D.; Scholten, T. Salt dome induced soil salinity in southern Iran: Prediction and mapping with averaging machine learning models. Land Degrad. Dev. 2020, 32, 1540–1554. [Google Scholar] [CrossRef]
  41. Sarwar, G.; Ibrahim, M.; Tahir, M.A.; Iftikhar, Y.; Haider, M.S.; Sabah, N.; Han, K.H.; Ha, S.G.; Zhang, Y.-S. Effect of Compost and Gypsum Application on the Chemical Properties and Fertility Status of Saline-Sodic Soil. Korean J. Soil Sci. Fertil. 2011, 44, 510–516. [Google Scholar] [CrossRef] [Green Version]
  42. Soil Survey Staff. Keys to Soil Taxonomy, 12th ed.; USDA-Natural Resources Conservation Service: Washington, DC, USA, 2014.
  43. Olsen, S.R.; Cole, C.V.; Watanabe, F.S.; Dean, L.A. Estimation of Available Phosphorus in Soils by Extraction with Sodium Bicarbonate; US Department of Agriculture: Washington, DC, USA, 1954; Volume 939, pp. 1–19.
  44. Nelson, R.E. Carbonate and gypsum. In Methods of Soil Analysis. Part 2. Chemical and Microbiological Properties; Page, A.L., Miller, R.H., Keeney, D.R., Eds.; Soil Science Society of America, Inc.: Madison, WI, USA, 1982; pp. 181–196. [Google Scholar]
  45. Jackson, M.L. Soil Chemical Analysis; Prentice-Hall, Inc.: Englewood Cliffs, NJ, USA, 1973. [Google Scholar]
  46. Walkley, A.; Black, C.A. An examination of different methods for determining soil organic matter and the proposed modification by the chromic acid titration method. J. Soil Sci. 1934, 37, 29–38. [Google Scholar] [CrossRef]
  47. McLean, E.O. Soil pH and lime requirement. In Methods of Soil Analysis. Part 2. Chemical and Microbiological Properties; Page, A.L., Miller, R.H., Keeney, D.R., Eds.; Soil Science Society of America, Inc.: Madison, WI, USA, 1982; pp. 199–223. [Google Scholar]
  48. Baruah, T.C.; Barthakur, H.P. A Textbook of Soil Analysis; Vikas Publishing House. Pvt. Ltd.: New Delhi, India, 1997. [Google Scholar]
  49. Carter, M.R.; Gregorich, E.G. Soil Sampling and Methods of Analysis, 2nd ed.; CRC Press: Boca Raton, FL, USA, 2007. [Google Scholar] [CrossRef]
  50. Goovaerts, P. Geostatistical tools for characterizing the spatial variability of microbiological and physico-chemical soil properties. Biol. Fertil. Soils 1998, 27, 315–334. [Google Scholar] [CrossRef] [Green Version]
  51. ESRI. ArcMap Version 10.2.2. User Manual; ESRI: Redlands, CA, USA, 2014. [Google Scholar]
  52. Selmy, S.; Abd El-Aziz, S.; El-Desoky, A.; El-Sayed, M. Characterizing, predicting, and mapping of soil spatial variability in Gharb El-Mawhoub area of Dakhla Oasis using geostatistics and GIS approaches. J. Saudi Soc. Agric. Sci. 2021, 21, 383–396. [Google Scholar] [CrossRef]
  53. Kravchenko, A.N. Influence of Spatial Structure on Accuracy of Interpolation Methods. Soil Sci. Soc. Am. J. 2003, 67, 1564–1571. [Google Scholar] [CrossRef]
  54. Xie, Y.; Chen, T.-B.; Lei, M.; Yang, J.; Guo, Q.-J.; Song, B.; Zhou, X.-Y. Spatial distribution of soil heavy metal pollution estimated by different interpolation methods: Accuracy and uncertainty analysis. Chemosphere 2011, 82, 468–476. [Google Scholar] [CrossRef] [PubMed]
  55. Mueller, G.T.; Pierce, J.F.; Schabenberger, O.; Warncke, D.D. Map Quality for Site-Specific Fertility Management. Soil Sci. Soc. Am. J. 2001, 65, 1547–1558. [Google Scholar] [CrossRef]
  56. Al-Busaidi, W.; Janke, R.; Menezes-Blackburn, D.; Khan, M.M. Impact of long-term agricultural farming on soil and water chemical properties: A case study from Al-Batinah regions (Oman). J. Saudi Soc. Agric. Sci. 2021, 21, 397–403. [Google Scholar] [CrossRef]
  57. Alarima, I.C.; Annan-Afful, E.; Obalum, E.S.; Awotunde, M.J.; Masunaga, T.; Igwe, A.C.; Wakatsuki, T. Comparative assessment of temporal changes in soil degradation under four contrasting land-use options along a tropical toposequence. Land Degrad. Dev. 2020, 31, 439–450. [Google Scholar] [CrossRef]
  58. Vaz, C.M.P.; de Freitas Iossi, M.; de Mendonça Naime, J.; Macedo, A.; Reichert, J.M.; Reinert, D.J.; Cooper, M. Validation of the Arya and Paris Water Retention Model for Brazilian Soils. Soil Sci. Soc. Am. J. 2005, 69, 577–583. [Google Scholar] [CrossRef] [Green Version]
  59. Vogelmann, E.S.; Reichert, J.M.; Reinert, D.J.; Mentges, M.I.; Vieira, D.A.; de Barros, C.A.P.; Fasinmirin, J.T. Water repellency in soils of humid subtropical climate of Rio Grande do Sul, Brazil. Soil Tillage Res. 2010, 110, 126–133. [Google Scholar] [CrossRef]
  60. Fasinmirin, J.T.; Reichert, J.M. Conservation tillage for cassava (Manihot esculenta crantz) production in the tropics. Soil Tillage Res. 2011, 113, 1–10. [Google Scholar] [CrossRef]
  61. Reichert, J.M.; Morales, C.A.S.; Lima, E.M.; de Bastos, F.; Sampietro, J.A.; Cavalli, J.P.; de Araújo, E.F.; Srinivasan, R. Best tillage practices for early-growth of clonal eucalyptus in soils with distinct granulometry, drainage and profile depth. Soil Tillage Res. 2021, 212, 105038. [Google Scholar] [CrossRef]
  62. Holthusen, D.; Brandt, A.A.; Reichert, J.M.; Horn, R.; Fleige, H.; Zink, A. Soil functions and in situ stress distribution in subtropical soils as affected by land use, vehicle type, tire inflation pressure and plant residue removal. Soil Tillage Res. 2018, 184, 78–92. [Google Scholar] [CrossRef]
  63. Goulart, R.Z.; Reichert, J.M.; Rodrigues, M.F.; Chaiben Neto, M.; Ebling, E.D. Comparing tillage methods for growing lowland soybean and corn during wetter-than-normal cropping seasons. Paddy Water Environ. 2021, 19, 401–415. [Google Scholar] [CrossRef]
  64. França, J.S.; Reichert, J.M.; Holthusen, D.; Rodrigues, M.F.; de Araújo, E.F. Subsoiling and mechanical hole-drilling tillage effects on soil physical properties and initial growth of eucalyptus after eucalyptus on steeplands. Soil Tillage Res. 2021, 207, 104860. [Google Scholar] [CrossRef]
  65. Bizuhoraho, T.; Kayiranga, A.; Manirakiza, N.; Mourad, K.A. The Effect of Land Use Systems on Soil Properties; A case study from Rwanda. Sustain. Agric. Res. 2018, 7, 30–40. [Google Scholar] [CrossRef] [Green Version]
  66. Lemenih, M.; Itanna, F. Soil carbon stocks and turnovers in various vegetation types and arable lands along an elevation gradient in southern Ethiopia. Geoderma 2004, 123, 177–188. [Google Scholar] [CrossRef]
  67. Mandal, A.; Toor, A.S.; Dhaliwal, S.S. Assessment of Sequestered Organic Carbon and Its Pools under Different Agricultural Land-Uses in the Semi-Arid Soils of South-Western Punjab, India. J. Soil Sci. Plant Nutr. 2020, 20, 259–273. [Google Scholar] [CrossRef]
  68. O’Flynn, C.J.; Fenton, O.; Wall, D.; Brennan, R.B.; McLaughlin, M.J.; Healy, M.G. Influence of soil phosphorus status, texture, pH and metal content on the efficacy of amendments to pig slurry in reducing phosphorus losses. Soil Use Manag. 2018, 34, 1–8. [Google Scholar] [CrossRef] [Green Version]
  69. Solomon, D.; Lehmann, J.; Mamo, T.; Fritzsche, F.; Zech, W. Phosphorus forms and dynamics as influenced by land use changes in the sub-humid Ethiopian highlands. Geoderma 2002, 105, 21–48. [Google Scholar] [CrossRef]
  70. Tesfaye, W. Status of Selected Physicochemical Properties of Soils under Long Term Sugarcane Cultivation Fields at Wonji-Shoa Sugar Estate. Am. J. Agric. For. 2021, 9, 397–408. [Google Scholar] [CrossRef]
  71. Vandereijk, D.; Janssen, B.H.; Oenema, O. Initial and residual effects of fertilizer phosphorus on soil phosphorus and maize yields on phosphorus fixing soils: A case study in south-west Kenya. Agric. Ecosyst. Environ. 2006, 116, 104–120. [Google Scholar] [CrossRef]
  72. Zhang, W.; An, L.Y.; Chen, P.X. Phosphorus fractionation related to environmental risks resulting from intensive vegetable cropping and fertilization in a subtropical region. Environ. Pollut. 2021, 269, 116098. [Google Scholar] [CrossRef]
  73. Bewket, W.; Stroosnijder, L. Effects of agroecological land use succession on soil properties in Chemoga watershed, Blue Nile basin, Ethiopia. Geoderma 2003, 111, 85–98. [Google Scholar] [CrossRef]
  74. Whitbread, A.M.; Lefroy, R.D.B.; Blair, G.J. A survey of the impact of cropping on soil physical and chemical properties in north-western New South Wales. Soil Res. 1998, 36, 669–682. [Google Scholar] [CrossRef]
  75. Kiflu, A.; Beyene, S. Effects of different land use systems on selected soil properties in South Ethiopia. J. Soil Sci. Environ. Manag. 2013, 4, 100–107. [Google Scholar] [CrossRef]
  76. Cooper, J.; Reed, E.Y.; Hörtenhuber, S.; Lindenthal, T.; Løes, A.-K.; Mäder, P.; Magid, J.; Oberson, A.; Kolbe, H.; Möller, K. Phosphorus availability on many organically managed farms in Europe. Nutr. Cycl. Agroecosys. 2018, 110, 227–239. [Google Scholar] [CrossRef] [Green Version]
  77. Menezes-Blackburn, D.; Giles, C.; Darch, T.; George, T.S.; Blackwell, M.; Stutter, M.; Shand, C.; Lumsdon, D.; Cooper, P.; Wendler, R.; et al. Opportunities for mobilizing recalcitrant phosphorus from agricultural soils: A review. Plant Soil 2018, 427, 5–16. [Google Scholar] [CrossRef] [PubMed] [Green Version]
  78. Solomon, D.; Fritzsche, F.; Tekalign, M.; Lehmann, J.; Zech, W. Soil Organic Matter Composition in the Subhumid Ethiopian Highlands as Influenced by Deforestation and Agricultural Management. Soil Sci. Soc. Am. J. 2002, 66, 68–82. [Google Scholar] [CrossRef] [Green Version]
  79. Zinn, Y.; Lal, R.; Resck, D. Changes in soil organic carbon stocks under agriculture in Brazil. Soil Tillage Res. 2005, 48, 28–40. [Google Scholar] [CrossRef]
  80. Dang, M. Quantitative and qualitative soil quality assessments of tea enterprises in Northern Vietnam. Afr. J. Agric. Res. 2007, 2, 455–462. [Google Scholar] [CrossRef]
  81. Samadi, A.; Gilkes, R.J. Forms of phosphorus in virgin and fertilized calcareous soils of Western Australia. Soil Res. 1998, 36, 585–601. [Google Scholar] [CrossRef]
  82. Carrow, R.N.; Stowell, L.; Gelernter, W.; Davis, S.; Duncan, R.R.; Skorulski, J. Clarifying soil testing: III. SLAN sufficiency ranges and recommendations. Golf. Course Manag. 2004, 72, 194–198. [Google Scholar]
  83. Nega, E.; Heluf, G. Effect of land use changes and soil depth on soil organic matter, total nitrogen and available phosphorus contents of soils in Senbat watershed, western Ethiopia. J. Agric. Biol. Sci. 2013, 8, 206–212. [Google Scholar]
  84. Foth, H.; Ellis, B. Soil Fertility, 2nd ed.; CRC Press: Boca Raton, FL, USA, 1997. [Google Scholar] [CrossRef]
  85. Agoume’, V.; Birang, A.M. Impact of land-use systems on some physical and chemical soil properties of an Oxisol in the humid forest Zone of Southern Cameroon. Tropicultura 2009, 27, 15–20. [Google Scholar]
  86. Fu, B.; Chen, L.; Ma, K.; Zhou, H.; Wang, J. The relationships between land use and soil conditions in the hilly area of the loess plateau in northern Shaanxi, China. CATENA 2000, 39, 69–78. [Google Scholar] [CrossRef]
  87. Gol, C. The effects of land use change on soil properties and organic carbon at Dagdami river catchment in Turkey. J. Environ. Biol. 2009, 30, 825–830. [Google Scholar] [PubMed]
  88. Wasihun, M.; Muktar, M.; Teshome, Y. Evaluation of the effect of land use types on selected soil physico-chemical properties in Itang-kir Area of Gambella Regional, Ethiopia. J. Biol. Agric. Healthc. 2015, 5, 92–102. [Google Scholar]
  89. Zhao, Q.; Zeng, H.D.; Fan, P.Z.; Lee, K.D. Effect of Land Cover Change on Soil Phosphorus Fractions in Southeastern Horqin Sandy Land, Northern China. Pedosphere 2008, 18, 741–748. [Google Scholar] [CrossRef]
  90. Deng, Y.; Xia, D.; Cai, C.; Ding, S. Effects of land uses on soil physic-chemical properties and erodibility in collapsing-gully alluvial fan of Anxi County, China. J. Integr. Agric. 2016, 15, 1863–1873. [Google Scholar] [CrossRef] [Green Version]
  91. Chauhan, R.P.; Pand, K.K.; Thakur, S. Soil Properties Affected by Land Use Systems in Western Chitwan, Nepal. Int. J. Appl. Sci. Biotechnol. 2014, 2, 398–402. [Google Scholar] [CrossRef] [Green Version]
  92. Mengistu, T.; Dereje, T. Impact of land use types and soil depths on selected soil physicochemical properties in Fasha District, Konso Zone, Southern Ethiopia. J. Soil Sci. Environ. Manag. 2021, 12, 10–16. [Google Scholar] [CrossRef]
  93. Bhunia, G.S.; Shit, P.K.; Maiti, R. Spatial variability of soil organic carbon under different land use using radial basis function (RBF). Model. Earth Syst. Environ. 2016, 2, 17. [Google Scholar] [CrossRef]
  94. Muche, M.; Kokeb, A.; Molla, E. Assessing the Physicochemical Properties of Soil under Different Land Use Types. J. Environ. Anal. Toxicol. 2015, 5, 309. [Google Scholar] [CrossRef]
  95. Yu, P.; Han, D.; Liu, S.; Wen, X.; Huang, Y.; Jia, H. Soil quality assessment under different land uses in an alpine grassland. CATENA 2018, 171, 280–287. [Google Scholar] [CrossRef]
  96. Dong, S.; Wan, S.; Kang, Y.; Li, X. Prospects of using drip irrigation for ecological conservation and reclaiming highly saline soils at the edge of Yinchuan Plain. Agric. Water Manag. 2020, 239, 106255. [Google Scholar] [CrossRef]
  97. Gorji, T.; Yıldırım, A.; Hamzehpour, N.; Tanik, A.; Sertel, E. Soil salinity analysis of Urmia Lake Basin using Landsat-8 OLI and Sentinel-2A based spectral indices and electrical conductivity measurements. Ecol. Indic. 2020, 112, 106173. [Google Scholar] [CrossRef]
  98. Huang, Y.J.; Li, Z.; Zhuo, Z.Q.; Xing, A.; Huang, Y.F. Soil water and salt dynamics under different irrigation and drainage management scenarios based on SahysMod model. Trans. Chin. Soc. Agric. Eng. 2020, 36, 129–140. [Google Scholar]
  99. Li, P.; Qian, H.; Wu, J. Conjunctive use of groundwater and surface water to reduce soil salinization in the Yinchuan Plain, North-West China. Int. J. Water Resour. Dev. 2018, 34, 337–353. [Google Scholar] [CrossRef]
  100. Mandal, A.; Toor, A.S.; Dhaliwal, S.S.; Singh, P.; Singh, V.K.; Sharma, V.; Gupta, R.K.; Naresh, R.K.; Kumar, Y.; Pramanick, B.; et al. Long-Term Field and Horticultural Crops Intensification in Semiarid Regions Influence the Soil Physiobiochemical Properties and Nutrients Status. Agronomy 2022, 12, 1010. [Google Scholar] [CrossRef]
  101. Alnaimy, M.; Zelenakova, M.; Vranayova, Z.; Abu-Hashim, M. Effects of Temporal Variation in Long-Term Cultivation on Organic Carbon Sequestration in Calcareous Soils: Nile Delta, Egypt. Sustainability 2020, 12, 4514. [Google Scholar] [CrossRef]
  102. Bughio, M.A.; Wang, P.; Meng, F.; Qing, C.; Kuzyakov, Y.; Wang, X.; Junejo, S.A. Neoformation of pedogenic carbonates by irrigation and fertilization and their contribution to carbon sequestration in soil. Geoderma 2016, 262, 12–19. [Google Scholar] [CrossRef]
  103. Chmiel, S.; Hałas, S.; Głowacki, S.; Sposób, J.; Maciejewska, E.; Trembaczowski, A. Concentration of soil CO2 as an indicator of the decalcification rate after liming treatment. Int. Agrophysics 2016, 30, 143–150. [Google Scholar] [CrossRef] [Green Version]
  104. Mikhailova, E.A.; Post, C.J. Effects of Land Use on Soil Inorganic Carbon Stocks in the Russian Chernozem. J. Environ. Qual. 2006, 35, 1384–1388. [Google Scholar] [CrossRef] [PubMed]
  105. Sanderman, J. Can management induced changes in the carbonate system drive soil carbon sequestration? A review with particular focus on Australia. Agric. Ecosyst. Environ. 2012, 155, 70–77. [Google Scholar] [CrossRef]
  106. Doran, J.W.; Sarrantonio, M.; Liebig, M.A. Soil Health and Sustainability. Adv. Agron. 1996, 56, 1–54. [Google Scholar] [CrossRef]
  107. Lal, R.; Delgado, J.A.; Groffman, P.M.; Millar, N.; Dell, C.; Rotz, A. Management to mitigate and adapt to climate change. J. Soil Water Conserv. 2011, 66, 276–285. [Google Scholar] [CrossRef]
  108. Berns, A.E.; Knicker, H. Soil Organic Matter. eMagRes 2014, 3, 43–54. [Google Scholar] [CrossRef]
  109. Bormann, H.; Klaassen, K. Seasonal and land use dependent variability of soil hydraulic and soil hydrological properties of two Northern German soils. Geoderma 2008, 145, 295–302. [Google Scholar] [CrossRef]
  110. Botta, G.F.; Becerra, A.T.; Tourn, F.B. Effect of the number of tractor passes on soil rut depth and compaction in two tillage regimes. Soil Tillage Res. 2009, 103, 381–386. [Google Scholar] [CrossRef]
  111. Brady, N.C.; Weil, R.R. The Nature and Properties of Soils, 13th ed.; Prentice Hall: Upper Saddle River, NJ, USA, 2002; p. 960. [Google Scholar]
  112. Celik, I. Land-use effects on organic matter and physical properties of soil in a southern Mediterranean highland of Turkey. Soil Tillage Res. 2005, 83, 270–277. [Google Scholar] [CrossRef]
  113. Feller, C.; Beare, M. Physical control of soil organic matter dynamics in the tropics. Geoderma 1997, 79, 69–116. [Google Scholar] [CrossRef]
  114. Gangwar, K.S.; Singh, K.K.; Sharma, S.K.; Tomar, O.K. Alternative tillage and crop residue management in wheat after rice in sandy loam soils of Indo-Gangetic plains. Soil Tillage Res. 2006, 88, 242–252. [Google Scholar] [CrossRef]
  115. Ghorbani-Dashtaki, S.; Homaee, M.; Loiskandl, W. Towards using pedotransfer functions for estimating infiltration parameters. Hydrol. Sci. J. 2016, 61, 1477–1488. [Google Scholar] [CrossRef] [Green Version]
  116. Haghighi, F.; Gorji, M.; Shorafa, M. A study of the effects of land use changes on soil physical properties and organic matter. Land Degrad. Dev. 2010, 21, 496–502. [Google Scholar] [CrossRef]
  117. Karami, A.; Homaee, M.; Afzalinia, S.; Ruhipour, H.; Basirat, S. Organic resource management: Impacts on soil aggregate stability and other soil physico-chemical properties. Agric. Ecosyst. Environ. 2012, 148, 22–28. [Google Scholar] [CrossRef]
  118. Kimetu, J.M.; Lehmann, J.; Ngoze, S.O.; Mugendi, D.N.; Kinyangi, J.M.; Riha, S.; Verchot, L.; Recha, J.; Pell, A.N. Reversibility of Soil Productivity Decline with Organic Matter of Differing Quality Along a Degradation Gradient. Ecosystems 2008, 11, 726–739. [Google Scholar] [CrossRef]
  119. Li, X.-G.; Li, F.-M.; Zed, R.; Zhan, Z.-Y.; Bhupinderpal, S. Soil physical properties and their relations to organic carbon pools as affected by land use in an alpine pastureland. Geoderma 2007, 139, 98–105. [Google Scholar] [CrossRef]
  120. Murphy, B.W. Impact of soil organic matter on soil properties—A review with emphasis on Australian soils. Soil Res. 2015, 53, 605–635. [Google Scholar] [CrossRef]
  121. Tesfaye, W.; Kibebew, K.; Bobe, B.; Melesse, T.; Teklu, E. Effects of long term sugarcane production on soils physicochemical properties at Finchaa sugar Estate. J. Soil Sci. Environ. Manag. 2020, 11, 30–40. [Google Scholar] [CrossRef] [Green Version]
  122. Toohey, R.C.; Boll, J.; Brooks, E.S.; Jones, J.R. Effects of land use on soil properties and hydrological processes at the point, plot, and catchment scale in volcanic soils near Turrialba, Costa Rica. Geoderma 2018, 315, 138–148. [Google Scholar] [CrossRef]
  123. Tolera, E.; Tesfaye, W. The Effect of Application of Vermicompost and NPS Fertilizer on Selected Soil Properties and Yield of Maize (Zea may L.) at Toke Kutaye, Ethiopia. Int. J. Appl. Agric. Sci. 2021, 7, 247–257. [Google Scholar]
  124. Angelova, V.R.; Akova, I.V.; Artinova, S.N.; Ivanov, K. The effect of organic amendments on soil chemical characteristics. Bulg. J. Agric. Sci. 2013, 19, 958–971. [Google Scholar]
  125. Davari, M.; Gholami, L.; Nabiollahi, K.; Homaee, M.; Jafari, J.H. Deforestation and cultivation of sparse forest impacts on soil quality (case study: West Iran, Baneh). Soil Tillage Res. 2020, 198, 104504. [Google Scholar] [CrossRef]
  126. Plante, A.; Conant, R.T. Soil Organic Matter Dynamics, Climate Change Effects. In Global Environmental Change; Freedman, B., Ed.; Springer: Dordrecht, The Netherlands, 2014; Volume 1, pp. 317–323. [Google Scholar] [CrossRef]
  127. Gao, G.; Change, C. Changes in Cation exchange capacity and particle size distribution of soil as associated with long-term annual application of cattle feed lot manure. Soil Sci. 1996, 161, 115–120. [Google Scholar] [CrossRef]
  128. Urioste, A.; Hevia, G.; Hepper, E.; Anton, L.; Bono, A.; Buschiazzo, D. Cultivation effects on the distribution of organic carbon, total nitrogen and phosphorus in soils of the semiarid region of Argentinian Pampas. Geoderma 2006, 136, 621–630. [Google Scholar] [CrossRef]
  129. Fasinmirin, J.T.; Olorunfemi, I.E. Comparison of hydraulic conductivity of soils of the forest vegetative zone of Nigeria. Appl. Trop. Agric. 2012, 17, 64–77. [Google Scholar]
  130. Nega, E.; Heluf, G. Influence of land use changes and soil depth on cation exchange capacity and contents of exchangeable bases in the soils of Senbat Watershed, western Ethiopia. Ethiop. J. Nat. Resour. 2009, 11, 195–206. [Google Scholar]
  131. Rashidi, M.; Seilsepour, M. Modeling of soil cation exchange capacity based on soil organic carbon. ARPN J. Agric. Biol. Sci. 2008, 3, 41–45. [Google Scholar]
  132. Johnston, K.; Ver Hoef, J.M.; Krivoruchko, K.; Lucas, N. Using ArcGIS Geostatistical Analyst; Esri: Redlands, CA, USA, 2001; Volume 380. [Google Scholar]
  133. Reza, S.K.; Dutta, D.; Bandyopadhyay, S.; Singh, S.K. Spatial Variability Analysis of Soil Properties of Tinsukia District, Assam, India. Agric. Res. 2019, 8, 231–238. [Google Scholar] [CrossRef]
  134. Selmy, S.; Abd El-Aziz, S.; Gameh, M.; Abdelsalam, A. Characterization and mapping spatial variability of Entisols derived from shale in Dakhla Oasis, Egypt. Arab. J. Geosci. 2020, 13, 592. [Google Scholar] [CrossRef]
  135. Guan, F.; Tang, X.; Fan, S.; Zhao, J.; Peng, C. Changes in soil carbon and nitrogen stocks followed the conversion from secondary forest to Chinese fir and Moso bamboo plantations. CATENA 2015, 133, 455–460. [Google Scholar] [CrossRef]
  136. Denton, O.A.; Aduramigba-Modupe, V.O.; Ojo, A.O.; Adeoyolanu, O.D.; Are, K.S.; Adelana, A.O.; Oyedele, A.O.; Adetayo, A.O.; Oke, A.O. Assessment of spatial variability and mapping of soil properties for sustainable agricultural production using geographic information system techniques (GIS). Cogent Food Agric. 2017, 3, 1279366. [Google Scholar] [CrossRef]
  137. Zhang, B.; Niu, L.; Jia, T.; Yu, X.; She, D. Spatial variability of soil organic matter and total nitrogen and the influencing factors in Huzhu County of Qinghai Province, China. Acta Agric. Scand. B Soil Plant Sci. 2022, 72, 576–588. [Google Scholar] [CrossRef]
  138. Gajda, A.; Czyż, E.; Furtak, K.; Jończyk, K. Effects of crop production practices on soil characteristics and metabolic diversity of microbial communities under winter wheat. Soil Res. 2019, 57, 124–131. [Google Scholar] [CrossRef]
  139. Ukalska-Jaruga, A.; Klimkowicz-Pawlas, A.; Smreczak, B. Characterization of organic matter fractions in the top layer of soils under different land uses in Central-Eastern Europe. Soil Use Manag. 2019, 35, 595–606. [Google Scholar] [CrossRef]
Figure 1. The location of the study area in relation to the maps of Assiut Governorate (on the right) and Egypt (on the left).
Soilsystems 06 00082 g001
Figure 2. Climograph for the five years under investigation (Assiut Governorate). Tem* = Temperature.
Soilsystems 06 00082 g002
Figure 3. The study sites and soil sampling design.
Soilsystems 06 00082 g003
Figure 4. Vertical distributions of virgin and cultivated soil properties at the investigated depths: (a) available phosphorus (P); (b) soil pH; (c) soil electrical conductivity (EC); (d) CaCO3 content; (e) organic matter (OM); (f) cation exchange capacity (CEC).
Soilsystems 06 00082 g004
Figure 5. Spatial distribution patterns of virgin and cultivated soil properties at the investigated depths: (a) available phosphorus (P); (b) soil pH; (c) soil electrical conductivity (EC); (d) CaCO3 content; (e) organic matter (OM); (f) cation exchange capacity (CEC).
Soilsystems 06 00082 g005aSoilsystems 06 00082 g005b
Table 1. Mean, standard deviation, and coefficient of variation for the selected properties of virgin soil (n = 20).
PropertyDepth (cm)MeanStd. DCV%
P (mg kg−1)0–102.250.2611.2
10–202.040.2411.8
20–302.040.2814.2
30–402.110.3013.8
pH0–108.150.030.4
10–208.140.050.6
20–308.140.050.6
30–408.170.060.8
EC (dS m−1)0–102.470.6827.8
10–205.300.9016.9
20–306.760.9113.5
30–407.620.9913.0
Ca2CO3 (mg kg−1)0–10101.97.927.8
10–20101.92.612.6
20–30101.76.516.4
30–40101.73.593.5
OM (mg kg−1)0–100.450.1532.2
10–20 0.15 0.03 21.2
20–300.150.0318.7
30–40 0.15 0.03 18.7
CEC (cmol(+)kg−1)0–103.680.4311.7
10–203.510.4813.7
20–303.280.278.1
30–402.740.5018.1
Std. D = standard deviation; CV = coefficient of variation; P = phosphorus; EC = electrical conductivity; CEC = cation exchange capacity; OM = organic matter.
Table 2. Mean, standard deviation, and coefficient of variation for the selected properties of cultivated soil (n = 20).
PropertyDepth (cm)MeanStd. DCV%
P (mg kg−1)0–1038.525.7214.9
10–2020.214.1620.6
20–3019.604.3922.4
30–4014.901.8012.1
pH0–107.950.141.8
10–207.950.131.7
20–308.130.182.3
30–408.170.212.6
EC (dS m−1)0–102.250.4922.0
10–202.310.6026.0
20–302.280.6026.4
30–402.150.5625.9
Ca2CO3 (mg kg−1)0–1080.53.434.3
10–2084.32.693.2
20–3085.32.302.7
30–4091.41.832.0
OM (mg kg−1)0–102.130.4320.0
10–201.010.076.7
20–300.830.055.7
30–400.360.0411.5
CEC (cmol(+) kg−1)0–104.800.051.0
10–204.380.020.5
20–303.420.092.5
30–402.810.5218.6
Std. D = standard deviation; CV = coefficient of variation; P = phosphorus; EC = electrical conductivity; CEC = cation exchange capacity; OM = organic matter.
Table 3. The best-fitted models and their prediction errors for the selected soil properties.
PropertyDepth (cm)SoilBest-Fitted ModelPrediction Errors
MERMSEASEMSERMSSE
P0–10VGaussian0.000.130.110.071.09
CRational Quadratic *0.032.332.330.041.06
10–20VGaussian0.010.100.100.091.01
CGaussian0.013.143.360.011.00
20–30VGaussian *0.010.180.190.001.02
CJ-Bessel *0.074.234.220.021.00
30–40VK-Bessel0.000.160.160.021.06
CJ-Bessel0.101.351.300.051.01
pH0–10VGaussian *0.000.030.030.001.00
CSpherical0.000.100.090.001.06
10–20VGaussian0.000.030.03−0.070.93
CGaussian0.000.090.090.001.01
20–30VRational Quadratic0.000.060.050.001.10
CGaussian *0.000.180.190.020.97
30–40VGaussian0.000.070.060.001.08
CRational Quadratic *0.000.160.140.011.13
EC0–10VGaussian0.040.240.600.100.47
CHole Effect0.020.280.300.070.86
10–20VRational Quadratic0.010.620.820.010.72
CRational Quadratic0.020.450.440.021.00
20–30VRational Quadratic0.000.590.690.000.81
CHole Effect0.040.370.420.060.85
30–40VRational Quadratic−0.010.770.73−0.011.00
CRational Quadratic0.020.430.430.030.97
CaCO30–10VHole Effect−0.135.065.87−0.020.84
CRational Quadratic−0.121.142.20−0.040.55
10–20VHole Effect−0.042.162.00−0.011.00
CGaussian−0.041.481.59−0.021.04
20–30VRational Quadratic−0.042.604.14−0.010.63
CRational Quadratic0.000.580.62−0.011.04
30–40VGaussian−0.063.112.65−0.021.09
CPentaspherical0.051.651.650.031.02
OM0–10VHole Effect−0.010.140.14−0.041.00
CHole Effect0.010.400.390.031.02
10–20VHole Effect0.000.040.040.051.01
CJ-Bessel0.000.070.070.001.07
20–30VRational Quadratic−0.010.100.10−0.041.01
CGaussian0.000.050.050.020.97
30–40VStable0.000.010.010.011.00
CHole Effect0.000.080.070.031.03
CEC0–10VRational Quadratic−0.010.270.27−0.011.00
CStable0.000.020.02−0.021.02
10–20VHole Effect−0.010.290.29−0.011.02
CJ-Bessel0.000.010.010.011.04
20–30VJ-Bessel0.010.090.100.041.01
CGaussian0.000.070.08−0.010.92
30–40VGaussian0.000.180.170.001.02
CGaussian0.000.200.23−0.011.01
P = phosphors; EC = electrical conductivity; OM = organic matter; CEC = cation exchange capacity; V = virgin; C = cultivated; * = using logarithm to normalize data; ME = mean error; RMSE = root-mean-square error; MSE = mean standardized error; ASE = average standard error; RMSSE = root-mean-square standardized error.
Publisher’s Note: MDPI stays neutral with regard to jurisdictional claims in published maps and institutional affiliations.

