
Soil Properties of a Tef-Acacia decurrens-Charcoal Production Rotation System in Northwestern Ethiopia


Abstract
:1. Introduction
2. Materials and Methods
2.1. Soil Sampling and Laboratory Analysis
2.2. Data Analysis
3. Results
3.1. Variation in the Soil Properties with the TACP and TM Systems and Soil Depth
3.1.1. Soil Organic Carbon, Total Nitrogen, C:N Ratio and Bulk Density
3.1.2. Soil pH, Pav, Kav, Naav and Mgav
3.1.3. Available Ammonium, Nitrate, Phosphate and Sulfate
3.1.4. Total Contents of Soil Na, K, P, Mg, Ca, Al, Fe and Mn
3.2. Variation of Soil Properties between Areas inside and outside Charcoal Production Spots
3.2.1. Soil Organic Carbon and Bulk Density, Total Nitrogen and C:N Ratio
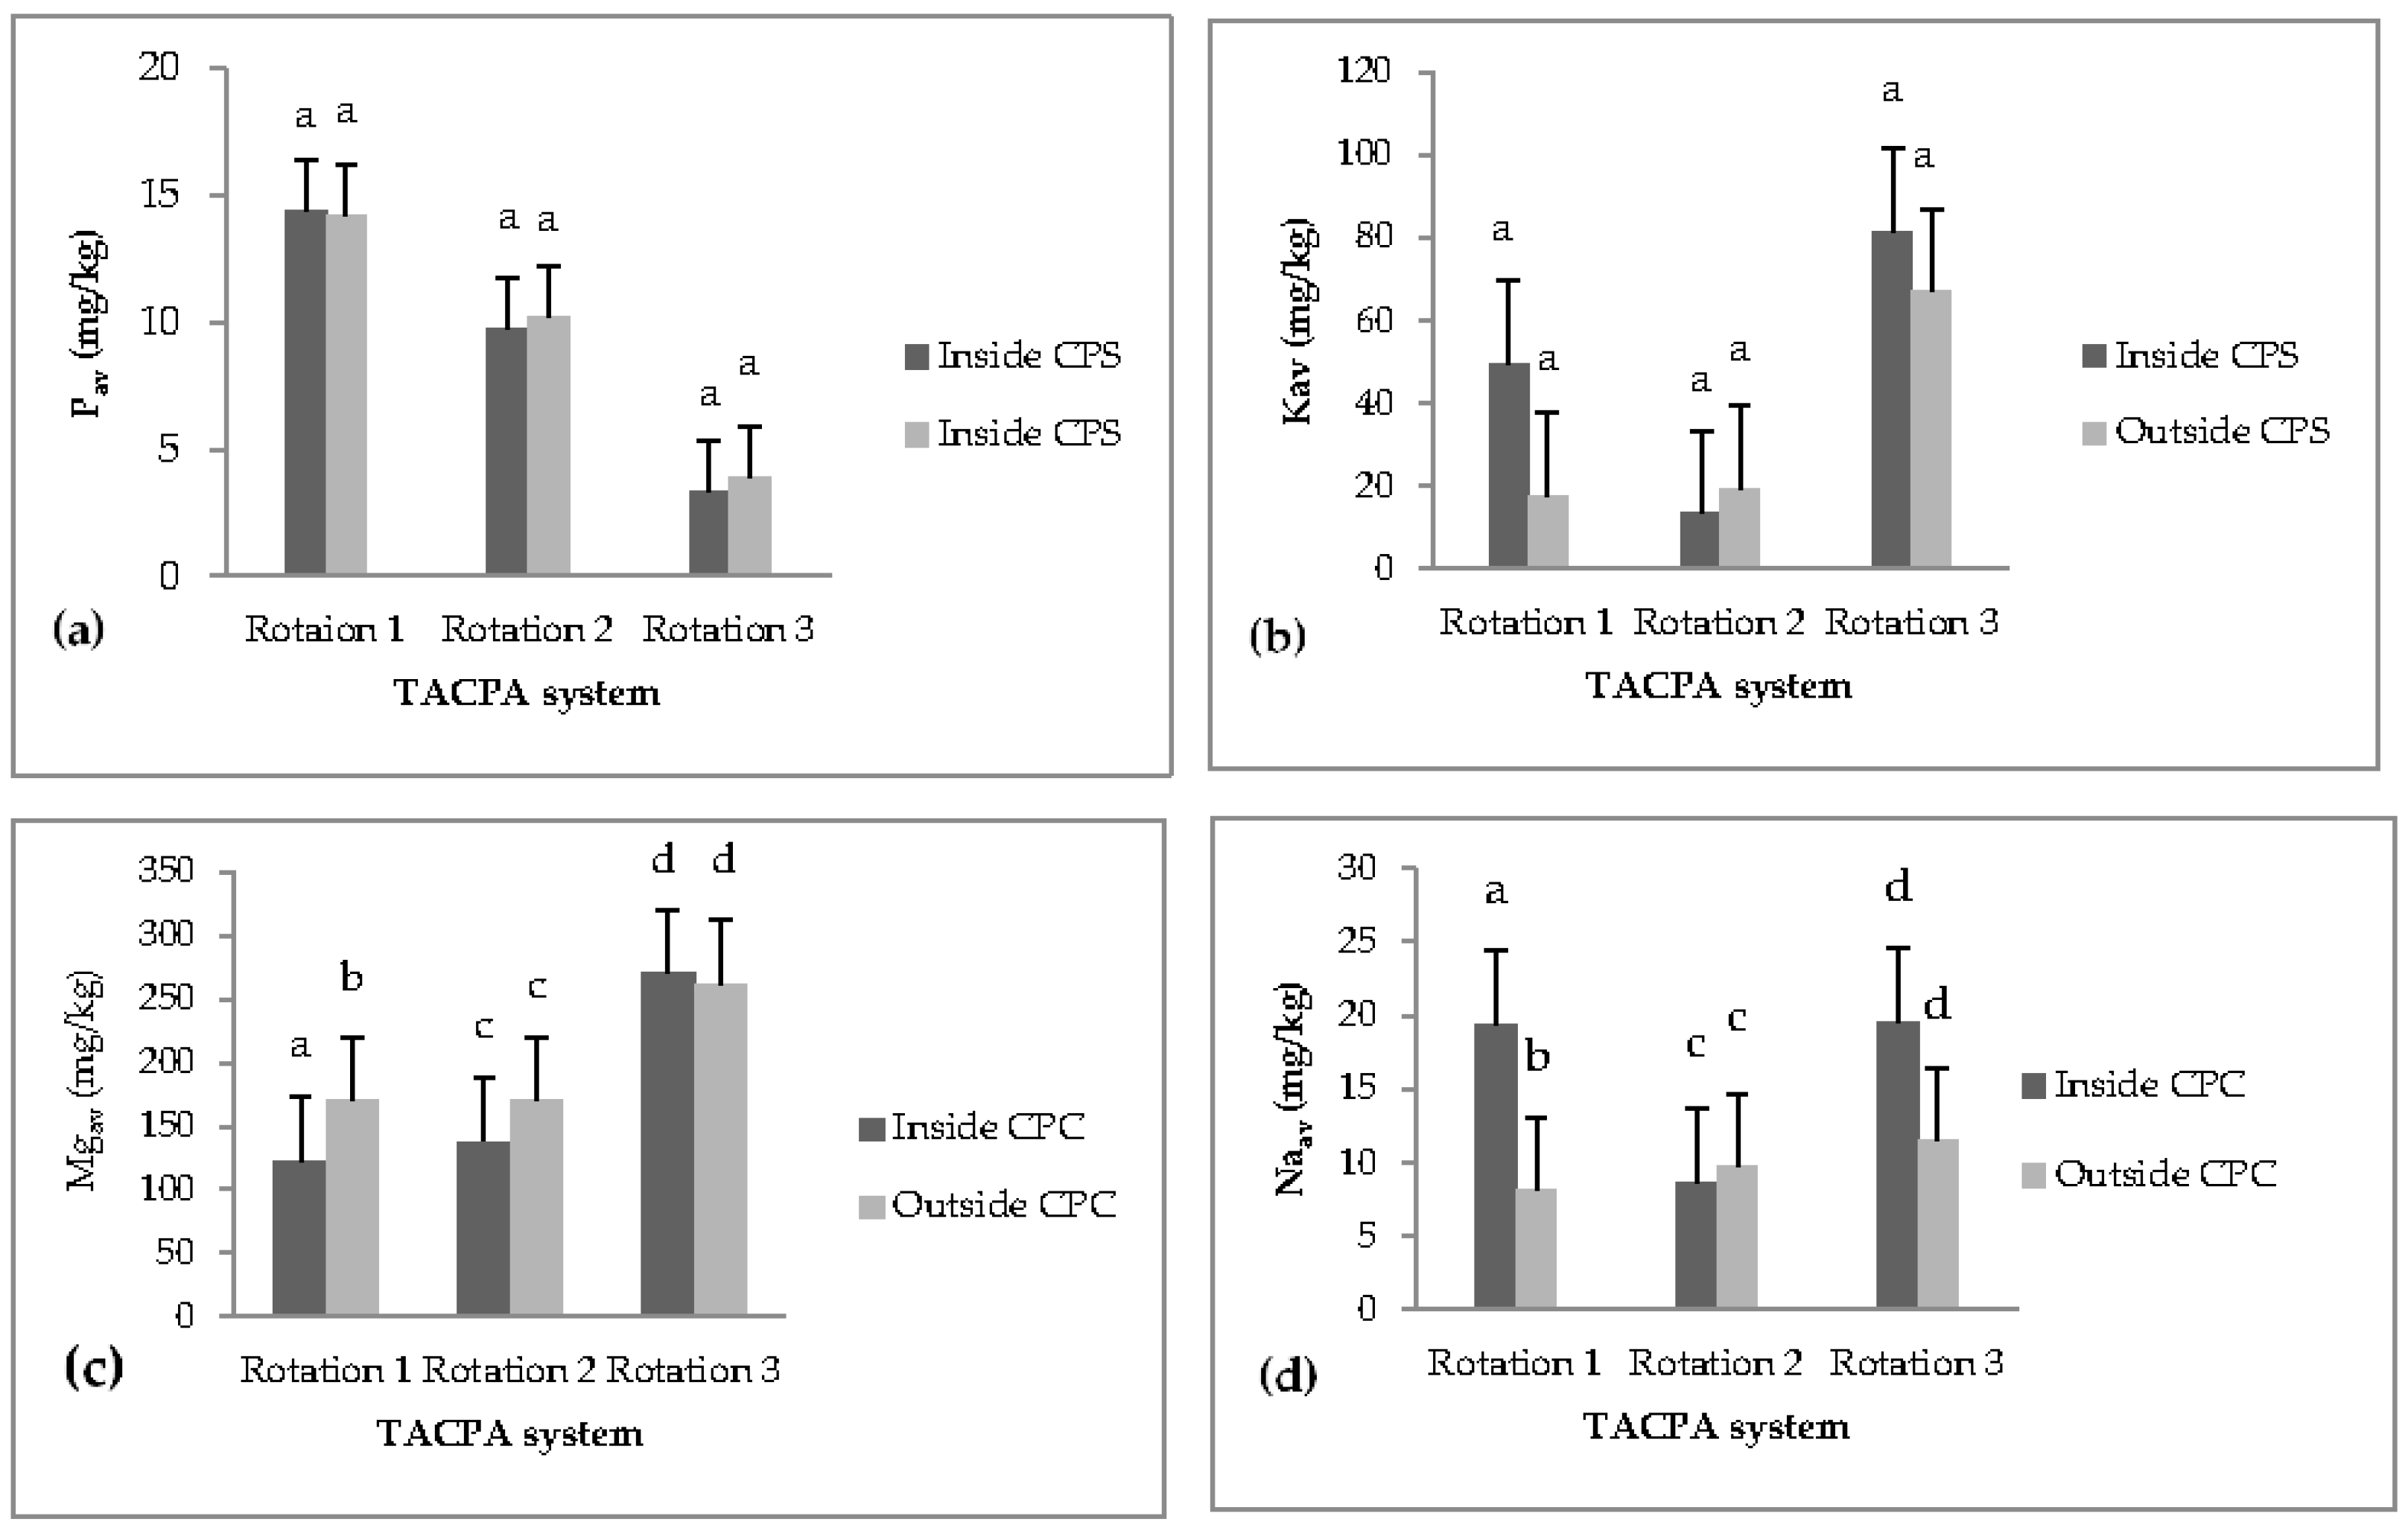
3.2.2. Soil pH, and Available Phosphorus, Potassium, Magnesium and Sodium
3.2.3. Available Ammonium, Sulfate, Nitrate and Phosphate
3.2.4. Total Soil Element Contents
4. Discussion
4.1. Variation in the Soil Properties between the TACP and TM Systems and with Soil Depth
4.2. Comparison of Soil Properties between Areas inside and outside the Charcoal Production Spots
5. Conclusions
Author Contributions
Funding
Informed Consent Statement
Data Availability Statement
Acknowledgments
Conflicts of Interest
References
- Sanchez, P.A.; Shepherd, K.D.; Soule, M.J.; Place, F.M.; Buresh, R.J.; Izac, A.-M.N.; Uzo Mokwunye, A.; Kwesiga, F.R.; Ndiritu, C.G.; Woomer, P.L. Soil Fertility Replenishment in Africa: An Investment in Natural Resource Capital. In SSSA Special Publications; Buresh, R.J., Sanchez, P.A., Calhoun, F., Eds.; Soil Science Society of America American Society of Agronomy: Madison, WI, USA, 2015; pp. 1–46. ISBN 978-0-89118-946-6. [Google Scholar]
- Vlek, P.L.G.; Khamzina, A.; Tamene, L. Land Degradation and the Sustainable Development Goals: Threats and Potential Remedies.; International Center for Tropical Agriculture (CIAT): Nairobi, Kenya, 2017. [Google Scholar]
- Dagnachew, M.; Kebede, A.; Moges, A.; Abebe, A. Land Use Land Cover Changes and Its Drivers in Gojeb River Catchment, Omo Gibe Basin, Ethiopia. J. Agric. Environ. Int. Dev. (JAEID) 2020, 114, 33–56. [Google Scholar]
- Ejigu, W.; Selassie, Y.G.; Elias, E.; Damte, M. Integrated Fertilizer Application Improves Soil Properties and Maize (Zea mays L.) Yield on Nitisols in Northwestern Ethiopia. Heliyon 2021, 7, e06074. [Google Scholar] [CrossRef] [PubMed]
- Matondi, P.B.; Havnevik, K.; Beyene, A. Biofuels, Land Grabbing and Food Security in Africa; Zed Books: London, UK, 2011. [Google Scholar]
- Palombi, L.; Sessa, R. Climate-Smart Agriculture: Sourcebook; Food and Agriculture Organization of the United Nations: Rome, Italy, 2013. [Google Scholar]
- Barber, R. United Nations. Economic Commission for Africa (1984-03). An Assessment of the Dominant Soil Degration Processes in the Ethiopian Highlands—Their Impacts and Hazards. Addis Ababa; EHRS Working; FAO: Addis Ababa, Ethiopia, 1984. [Google Scholar]
- Josephson, A.L.; Ricker-Gilbert, J.; Florax, R.J.G.M. How Does Population Density Influence Agricultural Intensification and Productivity? Evidence from Ethiopia. Food Policy 2014, 48, 142–152. [Google Scholar] [CrossRef] [Green Version]
- Amede, T.; Takele, B.; Endris, G. Reversing the Degradation of Arable Land in the Ethiopian Highlands; Managing Africa’s Soils No. 23; Areka Research Centre: Areka, Ethiopia, 2001. [Google Scholar]
- FAO. Assistance to Land Use Planning Ethiopia Geomorphology and Soils; FAO: Addis Ababa, Ethiopia, 1984. [Google Scholar]
- Malik, R.N.; Husain, S.Z.; Nazir, I. Heavy Metal Contamination and Accumulation in Soil and Wild Plant Species from Industrial Area of Islamabad, Pakistan. Pak. J. Bot. 2010, 42, 291–301. [Google Scholar]
- Headey, D.D.; Jayne, T.S. Adaptation to Land Constraints: Is Africa Different? Food Policy 2014, 48, 18–33. [Google Scholar] [CrossRef] [Green Version]
- Droppelmann, K.J.; Snapp, S.S.; Waddington, S.R. Sustainable Intensification Options for Smallholder Maize-Based Farming Systems in Sub-Saharan Africa. Food Sec. 2017, 9, 133–150. [Google Scholar] [CrossRef]
- Gebrehiwot, T.; Teklewold, H. Determinants of Farmland Expansion in the Forest Margins of Ethiopia; IIED; Sentinel: London, UK, 2022. [Google Scholar]
- Kim, D.-G.; Kirschbaum, M.U.F.; Beedy, T.L. Carbon Sequestration and Net Emissions of CH4 and N2O under Agroforestry: Synthesizing Available Data and Suggestions for Future Studies. Agric. Ecosyst. Environ. 2016, 226, 65–78. [Google Scholar] [CrossRef]
- Elbasiouny, H.; El-Ramady, H.; Elbehiry, F.; Rajput, V.D.; Minkina, T.; Mandzhieva, S. Plant Nutrition under Climate Change and Soil Carbon Sequestration. Sustainability 2022, 14, 914. [Google Scholar] [CrossRef]
- Lipper, L.; Thornton, P.; Campbell, B.M.; Baedeker, T.; Braimoh, A.; Bwalya, M.; Caron, P.; Cattaneo, A.; Garrity, D.; Henry, K.; et al. Climate-Smart Agriculture for Food Security. Nat. Clim Change 2014, 4, 1068–1072. [Google Scholar] [CrossRef]
- Schaller, M.; Barth, E.; Blies, D.; Schümmelfeder, M.; Felicitas, R. Climate Smart Agriculture (CSA): Farmyard Compost; International Center for Tropical Agriculture (CIAT): Cali, Colombia; The Centre for Rural Development (SLE): Berlin, Germany, 2017. [Google Scholar]
- FAO. Land and Environmental Degradation and Desertification in Africa: Issues and Options for Sustainable Economic Development with Transformation; FAO: Addis Ababa, Ethiopia, 1995. [Google Scholar]
- Kahsay, G.A.; Hansen, L.G. The Effect of Climate Change and Adaptation Policy on Agricultural Production in Eastern Africa. Ecol. Econ. 2016, 121, 54–64. [Google Scholar] [CrossRef] [Green Version]
- Teklewold, H.; Mekonnen, A.; Kohlin, G.; Di Falco, S. Does adoption of multiple climate-smart practices improve farmers’ climate resilience? Empirical evidence from the nile basin of ethiopia. Clim. Change Econ. 2017, 8, 1750001. [Google Scholar] [CrossRef]
- Blaser, W.J.; Oppong, J.; Hart, S.P.; Landolt, J.; Yeboah, E.; Six, J. Climate-Smart Sustainable Agriculture in Low-to-Intermediate Shade Agroforests. Nat. Sustain. 2018, 1, 234–239. [Google Scholar] [CrossRef]
- Nyagumbo, I.; Mutenje, M.; Setimela, P.; Chipindu, L.; Chisaka, A.; Simwaka, P.; Mwale, B.; Ngwira, A.; Mupangwa, W. Evaluating the Merits of Climate Smart Technologies under Smallholder Agriculture in Malawi. Soil Use Manag. 2022, 38, 890–906. [Google Scholar] [CrossRef]
- Schroeder, P. Carbon Storage Benefits of Agroforestry Systems. Agrofor. Syst 1994, 27, 89–97. [Google Scholar] [CrossRef]
- Young, A. Agroforestry for Soil Management; CAB International: Wallingford, UK, 1997. [Google Scholar]
- Baah-acheamfour, M.; Chang, S.X.; Bork, E.; Carlyle, C. The Potential of Agroforestry to Reduce Atmospheric Greenhouse Gases in Canada: Insight from Pairwise Comparisons with Traditional Agriculture, Data Gaps and Future Research. For. Chron. 2017, 93, 180–189. [Google Scholar] [CrossRef] [Green Version]
- Eddy, W.C.; Yang, W.H. Improvements in Soil Health and Soil Carbon Sequestration by an Agroforestry for Food Production System. Agric. Ecosyst. Environ. 2022, 333, 107945. [Google Scholar] [CrossRef]
- Hanson, P.J.; Edwards, N.T.; Garten, C.T.; Andrews, J.A. Separating Root and Soil Microbial Contributions to Soil Respiration: A Review of Methods and Observations. Biogeochemistry 2000, 48, 115–146. [Google Scholar] [CrossRef]
- Wang, W.J.; Dalal, R.C.; Moody, P.W.; Smith, C.J. Relationships of Soil Respiration to Microbial Biomass, Substrate Availability and Clay Content. Soil Biol. Biochem. 2003, 35, 273–284. [Google Scholar] [CrossRef]
- Akinnifesi, F.K.; Ajayi, O.C.; Sileshi, G.; Chirwa, P.W.; Chianu, J. Fertiliser Trees for Sustainable Food Security in the Maize-Based Production Systems of East and Southern Africa. A Review. Agron. Sustain. Dev. 2010, 30, 615–629. [Google Scholar] [CrossRef]
- Corbeels, M.; Cardinael, R.; Naudin, K.; Guibert, H.; Torquebiau, E. The 4 per 1000 Goal and Soil Carbon Storage under Agroforestry and Conservation Agriculture Systems in Sub-Saharan Africa. Soil Tillage Res. 2019, 188, 16–26. [Google Scholar] [CrossRef] [Green Version]
- Muche, M.; Eyasu, M. Assessing the Physicochemical Properties of Soil under Different Land Use Types. J. Env. Anal. Toxicol. 2015, 5, 309. [Google Scholar]
- Gómez-Luna, B.E.; Rivera-Mosqueda, M.C.; Dendooven, L.; Vázquez-Marrufo, G.; Olalde-Portugal, V. Charcoal Production at Kiln Sites Affects C and N Dynamics and Associated Soil Microorganisms in Quercus Spp. Temperate Forests of Central Mexico. Appl. Soil Ecol. 2009, 41, 50–58. [Google Scholar] [CrossRef]
- Glaser, B.; Lehmann, J.; Zech, W. Ameliorating Physical and Chemical Properties of Highly Weathered Soils in the Tropics with Charcoal—A Review. Biol. Fertil. Soils 2002, 35, 219–230. [Google Scholar] [CrossRef]
- Lehmann, J.; Gaunt, J.; Rondon, M. Bio-char sequestration in terrestrial ecosystems—A review. Mitig. Adapt. Strateg. Glob. Change 2006, 11, 403–427. [Google Scholar] [CrossRef]
- Vaccari, F.P.; Baronti, S.; Lugato, E.; Genesio, L.; Castaldi, S.; Fornasier, F.; Miglietta, F. Biochar as a Strategy to Sequester Carbon and Increase Yield in Durum Wheat. Eur. J. Agron. 2011, 34, 231–238. [Google Scholar] [CrossRef]
- Liang, Y.; Cao, X.; Zhao, L.; Xu, X.; Harris, W. Phosphorus Release from Dairy Manure, the Manure-Derived Biochar, and Their Amended Soil: Effects of Phosphorus Nature and Soil Property. J. Environ. Qual. 2014, 43, 1504–1509. [Google Scholar] [CrossRef]
- Schmidt, H.; Kammann, C.; Hagemann, N.; Leifeld, J.; Bucheli, T.D.; Sánchez Monedero, M.A.; Cayuela, M.L. Biochar in Agriculture—A Systematic Review of 26 Global Meta-analyses. GCB Bioenergy 2021, 13, 1708–1730. [Google Scholar] [CrossRef]
- Tan, K.; Qin, Y.; Wang, J. Evaluation of the Properties and Carbon Sequestration Potential of Biochar-Modified Pervious Concrete. Constr. Build. Mater. 2022, 314, 125648. [Google Scholar] [CrossRef]
- Atkinson, C.J.; Fitzgerald, J.D.; Hipps, N.A. Potential Mechanisms for Achieving Agricultural Benefits from Biochar Application to Temperate Soils: A Review. Plant Soil 2010, 337, 1–18. [Google Scholar] [CrossRef]
- Abel, S.; Peters, A.; Trinks, S.; Schonsky, H.; Facklam, M.; Wessolek, G. Impact of Biochar and Hydrochar Addition on Water Retention and Water Repellency of Sandy Soil. Geoderma 2013, 202–203, 183–191. [Google Scholar] [CrossRef]
- Liang, B.; Lehmann, J.; Sohi, S.P.; Thies, J.E.; O’Neill, B.; Trujillo, L.; Gaunt, J.; Solomon, D.; Grossman, J.; Neves, E.G.; et al. Black Carbon Affects the Cycling of Non-Black Carbon in Soil. Org. Geochem. 2010, 41, 206–213. [Google Scholar] [CrossRef]
- Lal, R. Encyclopedia of Soil Science, 3rd ed.; Taylor and Francis: Columbus, OH, USA, 2016. [Google Scholar]
- Chidumayo, E.N. Effects of Wood Carbonization on Soil and Initial Development of Seedlings in Miombo Woodland, Zambia. For. Ecol. Manag. 1994, 70, 353–357. [Google Scholar] [CrossRef]
- Giller, K.E. Nitrogen Fixation in Tropical Cropping Systems, 2nd ed.; CABI Pub: Wallingford, UK; New York, NY, USA, 2001; ISBN 978-0-85199-417-8. [Google Scholar]
- Oguntunde, P.G.; Fosu, M.; Ajayi, A.E.; van de Giesen, N. Effects of Charcoal Production on Maize Yield, Chemical Properties and Texture of Soil. Biol. Fertil. Soils 2004, 39, 295–299. [Google Scholar] [CrossRef]
- Oguntunde, P.G.; Abiodun, B.J.; Ajayi, A.E.; van de Giesen, N. Effects of Charcoal Production on Soil Physical Properties in Ghana. Z. Pflanzenernähr. Bodenk. 2008, 171, 591–596. [Google Scholar] [CrossRef]
- Bashir, S.; Hussain, Q.; Akmal, M.; Riaz, M.; Hu, H.; Ijaz, S.S.; Iqbal, M.; Abro, S.; Mehmood, S.; Ahmad, M. Sugarcane Bagasse-Derived Biochar Reduces the Cadmium and Chromium Bioavailability to Mash Bean and Enhances the Microbial Activity in Contaminated Soil. J. Soils Sediments 2018, 18, 874–886. [Google Scholar] [CrossRef]
- Shaaban, M.; Wu, Y.; Peng, Q.; Wu, L.; Van Zwieten, L.; Khalid, M.S.; Younas, A.; Lin, S.; Zhao, J.; Bashir, S.; et al. The Interactive Effects of Dolomite Application and Straw Incorporation on Soil N2O Emissions: Nitrous Oxide Emissions from an Acidic Soil. Eur. J. Soil Sci. 2018, 69, 502–511. [Google Scholar] [CrossRef]
- Patel, A.K.; Singhania, R.R.; Pal, A.; Chen, C.-W.; Pandey, A.; Dong, C.-D. Advances on Tailored Biochar for Bioremediation of Antibiotics, Pesticides and Polycyclic Aromatic Hydrocarbon Pollutants from Aqueous and Solid Phases. Sci. Total Environ. 2022, 817, 153054. [Google Scholar] [CrossRef]
- Daniel, H.; Agena, A.; Abdu, A. Evaluation of the Effect of Ficus Thonningii (Blume) on Soil Physicochemical Properties in Ahferom District of Tigray, Ethiopia. J. Soil Sci. Environ. Manage. 2013, 4, 35–45. [Google Scholar]
- Poschen, P. An Evaluation of the Acacia Albida-Based Agroforestry Practices in the Hararghe Highlands of Eastern Ethiopia. Agrofor. Syst. 1986, 4, 129–143. [Google Scholar] [CrossRef]
- Haque, I. Use of Legume Biological Nitrogen Fixation in Crop/Livestock Production Systems; Chichester: Nigeria, Africa, 1992. [Google Scholar]
- Smit, G.N. An Approach to Tree Thinning to Structure Southern African Savannas for Long-Term Restoration from Bush Encroachment. J. Environ. Manag. 2004, 71, 179–191. [Google Scholar] [CrossRef]
- Hadgu, K.M.; Kooistra, L.; Rossing, W.A.H.; van Bruggen, A.H.C. Assessing the Effect of Faidherbia Albida Based Land Use Systems on Barley Yield at Field and Regional Scale in the Highlands of Tigray, Northern Ethiopia. Food Sec. 2009, 1, 337–350. [Google Scholar] [CrossRef] [Green Version]
- Manjur, B.; Abebe, T.; Abdulkadir, A. Effects of Scattered, F. Albida (Del) and C. Macrostachyus (Lam) Tree Species on Key Soil Physicochemical Properties and Grain Yield of Maize (Zea mays): A Case Study at Umbulo Wacho Watershed, Southern Ethiopia. Wudpecker J. Agric. Res. 2014, 3, 63–73. [Google Scholar]
- Deans, J.D.; Diagne, O.; Nizinski, J.; Lindley, D.K.; Seck, M.; Ingleby, K.; Munro, R.C. Comparative Growth, Biomass Production, Nutrient Use and Soil Amelioration by Nitrogen-Fixing Tree Species in Semi-Arid Senegal. For. Ecol. Manag. 2003, 176, 253–264. [Google Scholar] [CrossRef]
- Abule, E.; Smit, G.N.; Snyman, H.A. The Influence of Woody Plants and Livestock Grazing on Grass Species Composition, Yield and Soil Nutrients in the Middle Awash Valley of Ethiopia. J. Arid Environ. 2005, 60, 343–358. [Google Scholar] [CrossRef]
- Burke, D.J.; Kretzer, A.M.; Rygiewicz, P.T.; Topa, M.A. Soil Bacterial Diversity in a Loblolly Pine Plantation: Influence of Ectomycorrhizas and Fertilization: Soil Bacterial Diversity in a Loblolly Pine Plantation. FEMS Microbiol. Ecol. 2006, 57, 409–419. [Google Scholar] [CrossRef] [Green Version]
- Worku, T.; Mekonnen, M.; Yitaferu, B.; Cerdà, A. Conversion of Crop Land Use to Plantation Land Use, Northwest Ethiopia. Trees For. People 2021, 3, 100044. [Google Scholar] [CrossRef]
- NWEMA. Northwest Ethiopia Meteorological Agency; NWEMA: Bahir Dar, Ethiopia, 2017. [Google Scholar]
- Yihenew, G. Selected Physical and Chemical Characteristics of Soils of Adet Research Center and Its Testing Sites in Northwestern Ethiopia. Ethiop. J. Nat. Resour. 2002, 4, 199–215. [Google Scholar]
- Nigussie, Z.; Tsunekawa, A.; Haregeweyn, N.; Adgo, E.; Nohmi, M.; Tsubo, M.; Aklog, D.; Meshesha, D.T.; Abele, S. Factors Affecting Small-Scale Farmers’ Land Allocation and Tree Density Decisions in an Acacia Decurrens-Based Taungya System in Fagita Lekoma. Small-Scale For. 2016, 16, 219–233. [Google Scholar] [CrossRef]
- EYASU, E. Farmers’ Perceptions of Soil Fertility Changes and Managment; Institute for Sustainable Development: Addis Ababa, Ethiopia, 2002. [Google Scholar]
- Tegegn, Z.; Abebe, A.; Agide, Z. Understanding Catchments’ Hydrologic Response Similarity of Upper Blue Nile (Abay) Basin through Catchment Classification. Model. Earth Syst. Environ. 2021, 1–19. [Google Scholar] [CrossRef]
- Black, C.A.; Evans, D.D.; Esingoger, L.E.; White, J.L.; Clark, F.E. Physical Properties. In Methods of Soil Analysis, Part I and II; American Society of Agronomy: Madison, WI, USA, 1965. [Google Scholar]
- Schnitzer, M.; Schulten, H.R. The Analysis of Soil Organic Matter by Pyrolysis-Field Ionization Mass Spectrometry. Soil Sci. Soc. Am. J. 1992, 56, 1811–1817. [Google Scholar] [CrossRef]
- Bremner, J.M.; Mulvaney, C.S. Methods of Soil Analysis, Part 2 Chemical and Microbiological Properties; Soil Science Society of America: Madison, WI, USA, 1982. [Google Scholar]
- Schüller, H. Die CAL-Methode, Eine Neue Methode Zur Bestimming Des Pflanzenverfugbaren Phosphates Im Boden. Z. Planzenernaehr. Bodenkd. 1969, 123, 48–63. [Google Scholar] [CrossRef]
- Chen, M.; Lena, Q. Compasrsion of Three Aqua Regia Digestin Methods for Twenty Florida Soils. Soil Sci. Soc. Am. 2001, 65, 491–499. [Google Scholar] [CrossRef] [Green Version]
- Coakes, S.J. SPSS 20.0 for Windows: Analysis without Anguish; Wiley: Milton, Australia, 2013; ISBN 978-1-118-33776-9. [Google Scholar]
- Agena, A. Component Interactions and Their Influence on the Production of Apple Based Agroforestry System in Wet Temperate Zone of Himachal Himalayas; University of Horticulture and Forestry: Solan, India, 2009. [Google Scholar]
- Berg, B.; McClaughert, C. Plant Litter: Decomposition, Humus Formation, Carbon Sequestration; Springer: Berlin, Germany, 2003; 286p, ISBN 3-540-44329-0. [Google Scholar]
- Gao, S.; DeLuca, T.H.; Cleveland, C.C. Biochar Additions Alter Phosphorus and Nitrogen Availability in Agricultural Ecosystems: A Meta-Analysis. Sci. Total Environ. 2019, 654, 463–472. [Google Scholar] [CrossRef] [PubMed]
- Tadesse, H.; Negash, L.; Olsson, M. Millettia Ferruginea from Southern Ethiopia: Impacts on Soil Fertility and Growth of Maize. Agrofor. Syst. 2000, 48, 9–24. [Google Scholar]
- Loumeto, F.; Bernhard-Reversat, J. The Litter System in African Forest-Tree Plantations, Chapter 2. In Management of Tropical Plantation-Forests and Their Soil-Litter Systems; Science Publishers: Enfield, NH, USA, 2002. [Google Scholar]
- Hailemariam, K.; Kindeya, G.; Yamoah, C. Balanites Aegyptiaca, a Potential Tree for Parkland Agroforestry Systems with Sorghum in Northern Ethiopia. Soil Sci. Environ. Manag. 2010, 1, 107–114. [Google Scholar]
- Jiregn, G.; Rozanov, A.; Negash, L. Trees on Farms and Their Contribution to Soil Fertility Parameters in Badessa, Eastern Ethiopia. Biol. Fertil. Soils 2005, 42, 66–71. [Google Scholar]
- Enideg, D.T. Importance OfFicus Thonningii Blume in Soil Fertility Improvement and Animal Nutrition in Gondar Zuria, Ethiopia. Master’s Thesis, University of Natural Resources and Applied Life Science, Vienna, Austria, 2008. [Google Scholar]
- Sohi, S.P.; Krull, E.; Lopez-Capel, E.; Bol, R. A Review of Biochar and Its Use and Function in Soil. In Advances in Agronomy; Elsevier: Amsterdam, The Netherlands, 2010; Volume 105, pp. 47–82. ISBN 978-0-12-381023-6. [Google Scholar]
- Wang, C.; Liu, J.; Shen, J.; Chen, D.; Li, Y.; Jiang, B.; Wu, J. Effects of Biochar Amendment on Net Greenhouse Gas Emissions and Soil Fertility in a Double Rice Cropping System: A 4-Year Field Experiment. Agric. Ecosyst. Environ. 2018, 262, 83–96. [Google Scholar] [CrossRef]
- Zhang, A.; Cheng, G.; Hussain, Q.; Zhang, M.; Feng, H.; Dyck, M.; Sun, B.; Zhao, Y.; Chen, H.; Chen, J.; et al. Contrasting Effects of Straw and Straw–Derived Biochar Application on Net Global Warming Potential in the Loess Plateau of China. Field Crops Res. 2017, 205, 45–54. [Google Scholar] [CrossRef]
- Joseph, S.; Pow, D.; Dawson, K.; Rust, J.; Munroe, P.; Taherymoosavi, S.; Mitchell, D.R.G.; Robb, S.; Solaiman, Z.M. Biochar Increases Soil Organic Carbon, Avocado Yields and Economic Return over 4 Years of Cultivation. Sci. Total Environ. 2020, 724, 138153. [Google Scholar] [CrossRef]
- Chan, K.Y.; Van Zwieten, L.; Meszaros, I.; Downie, A.; Joseph, S. Using Poultry Litter Biochars as Soil Amendments. Soil Res. 2008, 46, 437. [Google Scholar] [CrossRef]
- Jones, D.L.; Rousk, J.; Edwards-Jones, G.; DeLuca, T.H.; Murphy, D.V. Biochar-Mediated Changes in Soil Quality and Plant Growth in a Three Year Field Trial. Soil Biol. Biochem. 2012, 45, 113–124. [Google Scholar] [CrossRef]
- Xifré-Salvadó, M.À.; Prat-Guitart, N.; Francos, M.; Úbeda, X.; Castellnou, M. Effects of Fire on the Organic and Chemical Properties of Soil in a Pinus Halepensis Mill. Forest in Rocallaura, NE Spain. Sustainability 2021, 13, 5178. [Google Scholar] [CrossRef]
- Lehmann, J.; Joseph, S. Biochar for Environmental Management: Science and Technology; Taylor and Francis: London, UK, 2012; ISBN 978-1-84977-055-2. [Google Scholar]
- Blanco-Canqui, H. Biochar and Phisycial Soil Properties. Soil Sci. Soc. Am. J. 2017, 81, 687–711. [Google Scholar] [CrossRef] [Green Version]
- Prober, S.M.; Stol, J.; Melissa, P. Enhanicng Soil Biophysical Condition for Climate-Resileicne Restoraiton in Mesic Woodlands. Ecol. Eng. 2014, 71, 246–255. [Google Scholar] [CrossRef]
- Hilscher, A.; Heister, K.; Siewert, C.; Knicker, H. Mineralisation and Structural Changes during the Initial Phase of Microbial Degradation of Pyrogenic Plant Residues in Soil. Org. Geochem. 2009, 40, 332–342. [Google Scholar] [CrossRef]
- Singh, N.; Abiven, S.; Maestrini, B.; Bird, J.A.; Torn, M.S.; Schmidt, M.W.I. Transformation and Stabilization of Pyrogenic Organic Matter in a Temperate Forest Field Experiment. Glob. Change Biol. 2014, 20, 1629–1642. [Google Scholar] [CrossRef]
- Rhoades, C.C. Single-Tree Influences on Soil Properties in Agroforestry: Lessons from Natural Forest and Savanna Ecosystems. Agrofor. Syst 1996, 35, 71–94. [Google Scholar] [CrossRef]
- Major, J.; Lehmann, J.; Rondon, M.; Goodale, C. Fate of Soil-Applied Black Carbon: Downward Migration, Leaching and Soil Respiration. Glob. Change Biol. 2010, 16, 1366–1379. [Google Scholar] [CrossRef]
- Van Zwieten, L.; Kimber, S.; Morris, S.; Chan, K.Y.; Downie, A.; Rust, J.; Joseph, S.; Cowie, A. Effects of Biochar from Slow Pyrolysis of Papermill Waste on Agronomic Performance and Soil Fertility. Plant Soil 2010, 327, 235–246. [Google Scholar] [CrossRef]
- Tegenu, A.; Habitabmu, T.; Collick, A.S. Soil Fertility Status Dynamics of Northwestern Ethiopia as Influcned by Land Use Changes; Cornnel University: Ithaca, NY, USA, 2008. [Google Scholar]
- DeLuca, T.H.; MacKenzie, M.D.; Gundale, M.J. Biochar Effects on Soil Nutrient Transformations. In Biochar for Environmental Management: Science, Technology and Implementation; Lehmann, J., Joseph, S., Eds.; Earthscan: London, UK, 2009; pp. 251–270. ISBN 978-0-415-70415-1. [Google Scholar]
- Bambrick, A.D.; Whalen, J.K.; Bradley, R.L.; Cogliastro, A.; Gordon, A.M.; Olivier, A.; Thevathasan, N.V. Spatial Heterogeneity of Soil Organic Carbon in Tree-Based Intercropping Systems in Quebec and Ontario, Canada. Agrofor. Syst. 2010, 79, 343–353. [Google Scholar] [CrossRef]
- Follain, S.; Walter, C.; Legout, A.; Lemercier, B.; Dutin, G. Induced Effects of Hedgerow Networks on Soil Organic Carbon Storage within an Agricultural Landscape. Geoderma 2007, 142, 80–95. [Google Scholar] [CrossRef]
- Steiner, C.; Teixeira, W.G.; Lehmann, J.; Nehls, T.; de Macêdo, J.L.V.; Blum, W.E.H.; Zech, W. Long Term Effects of Manure, Charcoal and Mineral Fertilization on Crop Production and Fertility on a Highly Weathered Central Amazonian Upland Soil. Plant Soil 2007, 291, 275–290. [Google Scholar] [CrossRef] [Green Version]
- Ketterings, Q.M.; Bigham, J.M. Soil Color as an Indicator of Slash-and-Burn Fire Severity and Soil Fertility in Sumatra, Indonesia. Soil Sci. Soc. Am. J. 2000, 64, 1826–1833. [Google Scholar] [CrossRef]
- Laird, D.; Fleming, P.; Wang, B.; Horton, R.; Karlen, D. Biochar Impact on Nutrient Leaching from a Midwestern Agricultural Soil. Geoderma 2010, 158, 436–442. [Google Scholar] [CrossRef] [Green Version]
- Gautam, D.K.; Bajracharya, R.M.; Sitaula, B.K. Effects of Biochar and Farm Yard Manure on Soil Properties and Crop Growth in an Agroforestry System in the Himalaya. SAR 2017, 6, 74. [Google Scholar] [CrossRef] [Green Version]
- Deng, B.; Tammeorg, P.; Luukkanen, O.; Helenius, J.; Starr, M. Effects of Acacia Seyal and Biochar on Soil Properties and Sorghum Yield in Agroforestry Systems in South Sudan. Agrofor. Syst. 2017, 91, 137–148. [Google Scholar] [CrossRef] [Green Version]
- Shrestha, B.; Chang, S.; Bork, E.; Carlyle, C. Enrichment Planting and Soil Amendments Enhance Carbon Sequestration and Reduce Greenhouse Gas Emissions in Agroforestry Systems: A Review. Forests 2018, 9, 369. [Google Scholar] [CrossRef] [Green Version]
- Smider, B.; Singh, B. Agronomic Performance of a High Ash Biochar in Two Contrasting Soils. Agric. Ecosyst. Environ. 2014, 191, 99–107. [Google Scholar] [CrossRef]
- Tripathi, N.; Singh, R.S.; Singh, J.S. Impact of Post-Mining Subsidence on Nitrogen Transformation in Southern Tropical Dry Deciduous Forest, India. Environ. Res. 2009, 109, 258–266. [Google Scholar] [CrossRef]
- Gonzalez-Perez, J.A.; Gonzalez, V. The Effect of Fire on Organic Matter-a Review. Enviro. Int. 2004, 30, 855–870. [Google Scholar] [CrossRef]
- Lorenz, K.; Lal, R. Biochar Application to Soil for Climate Change Mitigation by Soil Organic Carbon Sequestration. J. Plant Nutr. Soil Sci. 2014, 177, 651–670. [Google Scholar] [CrossRef] [Green Version]
- Abebe, N.; Endalkachew, K. Effect of Charcoal Production on Soil Properties in Southwestern Ethiopia. Middle-East J. Sci. Res. 2011, 9, 807–813. [Google Scholar]
- Terefe, T.; Mariscal-Sancho, I.; Peregrina, F.; Espejo, R. Influence of Heating on Various Properties of Six Mediterranean Soils. A Laboratory Study. Geoderma 2008, 143, 273–280. [Google Scholar] [CrossRef]
- Caldwell, B.A. Enzyme Activiteis as a Component of Soil Biodiversity—A Reivew. Pedobiologia 2005, 49, 637–644. [Google Scholar] [CrossRef]
- Ulery, A.L.; Graham, R.C. Forest Fire Effects on Soil Color and Texture. Soil Sci. Soc. Am. J. 1993, 57, 135–140. [Google Scholar] [CrossRef]
- Cox, D.; Bezdicek, D.; Fauci, M. Effects of Compost, Coal Ash, and Straw Amendments on Restoring the Quality of Eroded Palouse Soil. Biol. Fertil. Soils 2001, 33, 365–372. [Google Scholar] [CrossRef]
- Singh, R. Changes in Soil Nutrients Following Burning Burning of Dry Tropical Savanna. Int. J. Wildland Fire 1994, 4, 187. [Google Scholar] [CrossRef]
- Moritsuka, N.; Yanai, J.; Kosaki, T. Effect of Soil Heating on the Dynamics of Soil Available Nutrients in the Rhizosphere. Soil Sci. Plant Nutr. 2001, 47, 323–331. [Google Scholar] [CrossRef] [Green Version]
- Ayodele, A.; Oguntunde, P.; Joseph, A.; de Souza Dias, M., Jr. Numerical Analysis of the Impact of Charcoal Production on Soil Hydrological Behavior, Runoff Response and Erosion Susceptibility. Rev. Bras. Ciênc. Solo 2009, 33, 137–146. [Google Scholar] [CrossRef] [Green Version]
- Fontodji, J.; Mawussi, G.; Nuto, Y.; Kokou, K. Effects of Charcoal Production on Soil Biodiversity and Soil Physical and Chemical Properties in Togo, West Africa. Int. J. Biol. Chem. Sci. 2010, 3, 51051. [Google Scholar] [CrossRef]
- Kuo, Y.-L.; Lee, C.-H.; Jien, S.-H. Reduction of Nutrient Leaching Potienal in Coarse-Textured Soil by Using Biochar. Water 2020, 12, 2012. [Google Scholar] [CrossRef]
- Baigorri, R.; San Francisco, S.; Urrutia, Ó.; García-Mina, J.M. Biochar-Ca and Biochar-Al/-Fe-Mediated Phosphate Exchange Capacity Are Main Drivers of the Different Biochar Effects on Plants in Acidic and Alkaline Soils. Agronomy 2020, 10, 968. [Google Scholar] [CrossRef]

| Variables | Depth (m) | Land Use Types | |||
|---|---|---|---|---|---|
| TM System | TACP System | ||||
| Rotation 1 | Rotation 2 | Rotation 3 | |||
| Sand | 0–0.2 | 29.75 ± 0.50 | 28.63 ± 0.37 | 29.25 ± 0.75 | 26.75 ± 0.40 |
| 0.2–0.4 | 30.50 ± 0.50 | 26.22 ± 0.33 | 30.00 ± 0.00 | 30.75 ± 0.36 | |
| 0.4–0.6 | 19.50 ± 0.30 | 19.50 ± 0.33 | 19.87 ± 0.40 | 19.25 ± 0.41 | |
| 0.6–1.0 | 15.25 ± 0.25 | 15.36 ± 0.26 | 15.75 ± 0.59 | 15.50 ± 0.42 | |
| Mean | 23.75 ± 1.70 | 23.25 ± 1.09 | 23.71 ± 1.12 | 23.15 ± 1.14 | |
| Silt | 0–0.2 | 29.50 ± 0.29 | 28.62 ± 0.48 | 29.25 ± 0.75 | 30.37 ± 0.10 |
| 0.2–0.4 | 17.50 ± 0.29 | 29.50 ± 0.19 | 30.00 ± 0.18 | 17.12 ± 0.12 | |
| 0.4–0.6 | 17.75 ± 0.25 | 19.50 ± 0.37 | 19.87 ± 0.46 | 19.43 ± 0.58 | |
| 0.6–1.0 | 19.87 ± 0.25 | 15.37 ± 0.23 | 15.75 ± 0.32 | 16.62 ± 0.23 | |
| Mean | 20.37 ± 1.37 | 20.53 ± 0.99 | 20.53 ± 1.04 | 20.81 ± 0.53 | |
| Clay | 0–0.2 | 41.00 ± 0.41 | 41.00 ± 0.33 | 41.20 ± 0.12 | 42.87 ± 0.83 |
| 0.2–0.4 | 52.00 ± 0.41 | 52.60 ± 0.27 | 52.50 ± 0.18 | 52.12 ± 0.35 | |
| 0.4–0.6 | 62.75 ± 0.25 | 62.00 ± 0.35 | 61.83 ± 0.35 | 61.62 ± 0.26 | |
| 0.6–1.0 | 68.00 ± 0.41 | 68.40 ± 0.27 | 67.60 ± 0.42 | 68.50 ± 0.71 | |
| Mean | 55.94 ± 2.68 | 56.22 ± 1.82 | 55.81 ± 1.81 | 56.28 ± 1.76 | |
| Variables | Depth (m) | Land Use Types | |||
|---|---|---|---|---|---|
| TM System | TACP System | ||||
| Rotation 1 | Rotation 2 | Rotation 3 | |||
| Bd | 0–0.2 | 0.76 ± 0.06 Aa | 0.90 ± 0.04 Aa | 0.87 ± 0.04 Aa | 0.81 ± 0.05 Aa |
| 0.2–0.4 | 0.84 ± 0.08 Aa | 0.99 ± 0.04 BAa | 0.98 ± 0.04 BCa | 0.89 ± 0.03 Aa | |
| 0.4–0.6 | 0.94 ± 0.08 Aa | 1.05 ± 0.03 BCa | 1.06 ±0.03 Ca | 0.98 ± 0.03 BAa | |
| 0.6–1.0 | 1.03 ± 0.04 Aa | 1.13 ± 0.02 Ca | 1.00 ± 0.03 Ca | 1.07 ± 0.04 CBa | |
| Mean | 0.89 ± 0.04 a | 1.02 ± 0.02 b | 1.01 ± 0.02 b | 0.94 ± 0.03 a | |
| SOC | 0–0.2 | 2.34 ± 0.36 Aa | 4.19 ± 0.26 Ab | 4.10 ± 0.26 Ab | 1.87 ± 0.26 Aa |
| 0.2–0.4 | 0.77 ± 0.36 Ba | 2.00 ± 0.27 Ba | 0.59 ± 0.28 Ba | 0.48 ± 0.27 Ba | |
| 0.4–0.6 | 0.63 ± 0.36 Ba | 2.72 ± 0.30 BAb | 0.50 ± 0.28 Ba | 0.36 ± 0.28 Ba | |
| 0.6–1.0 | 0.37 ± 0.36 Ba | 2.09 ± 0.30 Bb | 0.57 ± 0.26 Ba | 0.41 ± 0.27 Ba | |
| Mean | 1.03 ± 0.32 a | 2.83 ± 0.25 b | 1.50 ± 0.24 a | 0.82 ± 0.24 a | |
| TN | 0–0.2 | 0.20 ± 0.03 Aa | 0.35 ± 0.02 Ab | 0.32 ± 0.02 Ab | 0.19 ± 0.02 Aa |
| 0.2–0.4 | 0.10 ± 0.03 Ba | 0.16 ± 0.02 Ba | 0.09 ± 0.02 Ba | 0.10 ± 0.02 Ba | |
| 0.4–0.6 | 0.09 ± 0.03 Ba | 0.22 ± 0.03 BAb | 0.09 ± 0.02 Bb | 0.08 ± 0.02 Bb | |
| 0.6–1.0 | 0.08 ± 0.03 Ba | 0.16 ± 0.03 Bb | 0.10 ± 0.02 Ba | 0.09 ± 0.02 Ba | |
| Mean | 0.12 ± 0.02 a | 0.23 ± 0.02 b | 0.156 ± 0.02 a | 0.12 ± 0.02 a | |
| C/N ratio | 0–0.2 | 11.49 ± 0.97 Aab | 12.08 ± 0.69 Ab | 12.72 ± 0.69 Ab | 9.86 ± 0.69 Aa |
| 0.2–0.4 | 7.82 ± 0.97 Ca | 8.09 ± 0.79 Aa | 6.25 ± 0.79 Ba | 5.00 ± 0.79 Ba | |
| 0.4–0.6 | 6.94 ± 0.97 Ca | 12.39 ± 0.87 Ab | 5.45 ± 0.79 Bb | 4.40 ± 0.79 Bc | |
| 0.6–1.0 | 4.86 ± 0.97 Ba | 12.81 ± 0.79 Ab | 5.67 ± 0.69 Ba | 4.65 ± 0.73 Ba | |
| Mean | 7.78 ± 0.79 a | 11.36 ± 0.63 b | 7.76 ± 0.59 a | 6.22 ± 0.60 a | |
| pH | 0–0.2 | 5.06 ± 0.09 Aa | 4.48 ± 0.06 Ab | 4.65 ± 0.06 Ab | 5.02 ± 0.06 Aa |
| 0.2–0.4 | 4.93 ± -0.09 Ba | 4.47 ± 0.06 Ab | 4.49 ± 0.06 Ab | 5.03 ± 0.06 Aa | |
| 0.4–0.6 | 5.26 ± -0.09 Aa | 4.49 ± 0.06 Ab | 4.62 ± 0.06 Ab | 5.07 ± 0.06 Aa | |
| 0.6–1.0 | 5.45 ± 0.09 Ca | 4.52 ± 0.06 Abc | 4.74 ± 0.06 Abc | 4.90 ± 0.06 Aac | |
| Mean | 5.18 ± 0.05 a | 4.49 ± 0.03 b | 4.63 ± 0.03 c | 5.00 ± 0.03 d | |
| Variables | Depth (m) | Land Use Types | |||
|---|---|---|---|---|---|
| TM System | TACP System | ||||
| Rotation 1 | Rotation 2 | Rotation 3 | |||
| Pav | 0–0.2 | 7.33 ± 1.87 Aa | 22.63 ± 1.42 Ab | 21.56 ± 1.33 Ab | 3.75 ± 1.33 Aa |
| 0.2–0.4 | 6.42 ± 1.88 Aa | 10.22 ± 1.53 Ba | 5.21 ± 1.32 Ba | 3.00 ± 1.53 Aa | |
| 0.4–0.6 | 4.47 ± 1.88 Aab | 13.52 ± 1.53 Bb | 5.7 ± 1.53 Ba | 3.65 ± 1.53 Aa | |
| 0.6–1.0 | 3.30 ± 1.88 Aac | 9.53 ± 1.53 Bb | 5.55 ± 1.33 Bbc | 3.70 ± 0.19 Ac | |
| Mean | 5.38 ± 0.94 a | 13.94 ± 0.75 b | 9.51 ± 0.70 c | 3.52 ± 0.73 a | |
| Kav | 0–0.2 | 321.00 ± 17.30 Aa | 65.63 ± 13.08 Ab | 32.49 ± 12.23 Ab | 151.27 ± 12.23 Ab |
| 0.2–0.4 | 145.00 ± 17.30 Ba | 8.23 ± 17.30 Ab | 10.53 ± 14.12 Bb | 29.93 ± 14.12 Bb | |
| 0.4–0.6 | 117.50 ± 17.31 Ba | 42.80 ± 15.48 Aba | 8.78 ± 14.12 Bab | 58.67 ± 14.12 Bb | |
| 0.6–1.0 | 2.25 ± 17.30 Ba | 6.00 ± 14.12 Ab | 9.27 ± 12.23 Bb | 40.45 ± 13.08 Ba | |
| Mean | 161.44 ± 8.30 a | 30.67 ± 7.54 b | 15.27 ± 6.61 b | 70.08 ± 6.71 c | |
| Naav | 0–0.2 | 4.37 ± 3.35 Aa | 13.44 ± 2.37 Aab | 8.81 ± 2.37 Aab | 18.38 ± 1.32 Ab |
| 0.2–0.4 | 5.00 ± 3.35 Aa | 14.14 ± 2.37 Aa | 8.66 ± 2.37 Aa | 15.11 ± 1.32 Aa | |
| 0.4–0.6 | 4.68 ± 3.35 Aa | 13.56 ± 2.37 Aab | 9.95 ± 2.37 Aaa | 14.93 ± 1.32 Ab | |
| 0.6–1.0 | 7.88 ± 3.35 Ba | 13.82 ± 2.37 Aa | 9.46 ± 2.37 Aa | 13.62 ± 1.32 Aa | |
| Mean | 5.45 ± 1.67 a | 13.74 ± 1.18 b | 9.22 ± 1.18 a | 15.51 ± 1.18 c | |
| Mgav | 0–0.2 | 246.25 ± 29.53 Aa | 91.70 ± 28.89 Aab | 149.97 ± 20.89 Aab | 245.75 ± 20.89 Ab |
| 0.2–0.4 | 206.25 ± 29.53 Aa | 94.01 ± 28.89 Aa | 141.27 ± 20.89 Aa | 269.50 ± 20.89 Aa | |
| 0.4–0.6 | 242.75 ± 29.53 Aa | 88.58 ± 20.89 Ab | 148.19 ± 20.89 Ab | 297.32 ± 20.89 Aa | |
| 0.6–1.0 | 405.75 ± 29.53 Ba | 99.72 ± 20.89 A | 176.29 ± 20.89 Aa | 252.62 ± 20.89 Aa | |
| Mean | 275.25 ± 14.76 a | 93.50 ± 10.4 b | 153.93 ± 10.44 c | 266.30 ± 10.44 a | |
| Ammonium | 0–0.2 | 0.001 ± 0.000 Aa | 0.001 ± 0.000 Aba | 0.001 ± 0.000 Abc | 0.001 ± 0.000 Ac |
| 0.2–0.4 | 0.001 ± 0.000 Ba | 0.001 ± 0.000 Aa | 0.001 ± 0.000 Aa | 0.001 ± 0.000 Aa | |
| 0.4–0.6 | 0.001 ± 0.000 Ba | 0.001 ± 0.000 Aab | 0.001 ± 0.000 Aab | 0.001 ± 0.000 Ab | |
| 0.6–1.0 | 0.001 ± 0.000 Ca | 0.001 ± 0.000 Ab | 0.001 ± 0.000 Aa | 0.001 ± 0.000 Aa | |
| Mean | 0.001 ± 0.000 a | 0.001 ± 0.000 b | 0.001 ± 0.000 c | 0.0010 ± 0.000 a | |
| Nitrate | 0–0.2 | 0.0010 ± 0.001 Aa | 0.004 ± 0.002 Aa | 0.001 ± 0.001 Aa | 0.005 ± 0.001 Aa |
| 0.2–0.4 | 0.001 ± 0.001 Aa | 0.005 ± 0.002 Aa | 0. 002 ± 0.001 Aa | 0.003 ± 0.001 Aa | |
| 0.4–0.6 | 0.001 ± 0.001 Aa | 0.005 ± 0.002 Aa | 0.001 ± 0.001 Aa | 0.004 ± 0.001 Aa | |
| 0.6–1.0 | 0.001 ± 0.001 Aa | 0.003 ± 0.002 Aa | 0.001 ± 0.001 Aa | 0.003 ± 0.001 Aa | |
| Mean | 0.001 ± 0.001 a | 0.004 ± 0.001 b | 0.001 ± 0.001 a | 0.004 ± 0.001 b | |
| Sulfate | 0–0.2 | 0.001 ± 0.000 Aa | 0.001 ± 0.000 Aa | 0.000 ± 0.000 Aa | 0.000 ± 0.000 Aa |
| 0.2–0.4 | 0.001 ± 0.000 Aa | 0.001 ± 0.000 Aa | 0.001 ± 0.000 Ba | 0.001 ± 0.000 Aa | |
| 0.4–0.6 | 0.002 ± 0.000 Aa | 0.001 ± 0.000 Aa | 0.000 ± 0.000 Ca | 0.001 ± 0.000 Aa | |
| 0.6–1.0 | 0.001 ± 0.000 Aa | 0.001 ± 0.000 Aa | 0.000 ± 0.000 Ca | 0.000 ± 0.000 Aa | |
| Mean | 0.001 ± 0.001 a | 0.001 ± 0.001 a | 0.000 ± 0.001 b | 0.000 ± 0.001 b | |
| Variables * | Depth (m) | Land Use Types | |||
|---|---|---|---|---|---|
| TM System | TACP System | ||||
| Rotation 1 | Rotation 2 | Rotation 3 | |||
| Na | 0–0.2 | 0.005 ± 0.92 Aa | 0.009 ± 0.69 Aab | 1.135 ± 0.65 Ab | 0.011 ± 0.65 Ab |
| 0.2–0.4 | 0.006 ± 0.92 Aa | 0.007 ± 0.92 Aa | 0.017 ± 0.75 Aa | 0.012 ± 0.75 Aa | |
| 0.4–0.6 | 0.006 ± 0.92 Aa | 0.008 ± 0.82 Aa | 1.508 ± 0.75 Aa | 0.010 ± 0.75 Aa | |
| 0.6–1.0 | 0.008 ± 0.92 Aa | 0.009 ± 0.74 Aa | 2.259 ± 0.65 Aa | 0.009 ± 0.70 Aa | |
| Mean | 0.006 ± 0.46 a | 0.008 ± 0.40 a | 1.229 ± 0.35 a | 0.011 ± 0.36 a | |
| K | 0–0.2 | 0.512 ± 0.04 Aa | 0.453 ± 0.03 Aa | 0.440 ± 0.03 Aa | 0.466 ± 0.03 Aa |
| 0.2–0.4 | 0.547 ± 0.04 Aa | 0.529 ± 0.04 Aba | 0.396 ± 0.03 Aba | 0.389 ± 0.03 Ac | |
| 0.4–0.6 | 0.571 ± 0.04 Aa | 0.422 ± 0.03 Ab | 0.378 ± 0.03 Ab | 0.280 ± 0.03 Bc | |
| 0.6–1.0 | 0.595 ± 0.04 Aa | 0.418 ± 0.03 Ab | 0.452 ± 0.03 Ab | 0.265 ± 0.03 Bc | |
| Mean | 0.556 ± 0.02 a | 0.455 ± 0.02 b | 0.417 ± 0.01 b | 0.350 ± 0.01 c | |
| P | 0–0.2 | 0.182 ± 0.01 Aa | 0.190 ± 0.01 Aa | 0.166 ± 0.01 Ab | 0.183 ± 0.01 ABa |
| 0.2–0.4 | 0.166 ± 0.01 Aa | 0.210 ± 0.01 Ab | 0.160 ± 0.01 Aa | 0.158 ± 0.01 Ba | |
| 0.4–0.6 | 0.178 ± 0.01 Aa | 0.190 ± 0.01 Aa | 0.182 ± 0.01 Aa | 0.196 ± 0.01 Ba | |
| 0.6–1.0 | 0.179 ± 0.01 Aa | 0.207 ± 0.01 Aa | 0.177 ± 0.01 Aa | 0.207 ± 0.01 Ba | |
| Mean | 0.176 ± 0.01 a | 0.199 ± 0.01 b | 0.171 ± 0.01 a | 0.186 ± 0.01 a | |
| Mg | 0–0.2 | 0.743 ± 0.05 Aa | 0.682 ± 0.03 Aa | 0.790 ± 0.03 Aa | 0.479 ± 0.03 Ab |
| 0.2–0.4 | 0.726 ± 0.05 Aa | 0.843 ± 0.05 Aa | 0.806 ± 0.04 Aa | 0.455 ± 0.04 Ab | |
| 0.4–0.6 | 0.655 ± 0.05 Ca | 0.709 ± 0.04 Aa | 0.668 ± 0.04 Aa | 0.368 ± 0.04 Ab | |
| 0.6–1.0 | 0.548 ± 0.05 Ca | 0.680 ± 0.04 Aa | 0.661 ± 0.03 Aa | 0.452 ± 0.04 Aab | |
| Mean | 0.668 ± 0.02 a | 0.728 ± 0.02 a | 0.731 ± 0.02 a | 0.438 ± 0.02 b | |
| Ca | 0–0.2 | 0.216 ± 0.01 Aa | 0.151 ± 0.01 Ab | 0.169 ± 0.01 Ab | 0.174 ± 0.01 Ab |
| 0.2–0.4 | 0.149 ± 0.01 Ba | 0.176 ± 0.01 Aa | 0.157 ± 0.01 Aa | 0.191 ± 0.01 Aa | |
| 0.4–0.6 | 0.158 ± 0.01 Bab | 0.154 ± 0.01 Aab | 0.139 ± 0.01 Aa | 0.191 ± 0.01 Ab | |
| 0.6–1.0 | 0.188 ± 0.01 Aa | 0.145 ± 0.01 Ab | 0.147 ± 0.01 Ab | 0.165 ± 0.01 Aba | |
| Mean | 0.178 ± 0.006 b | 0.156 ± 0.006 a | 0.153 ± 0.005 a | 0.180 ± 0.005 b | |
| Al | 0–0.2 | 7.578 ± 0.62 ABa | 7.401 ± 0.468 Aa | 6.326 ± 0.44 Ab | 9.402 ± 0.44 Ac |
| 0.2–0.4 | 6.998 ± 0.62 Aa | 9.405 ± 0.619 Bab | 5.377 ± 0.51 Aa | 9.533 ± 0.51 Aab | |
| 0.4–0.6 | 7.445 ± 0.62 Aa | 8.022 ± 0.554 ABa | 5.545 ± 0.51 Ab | 11.387 ± 0.51 Ac | |
| 0.6–1.0 | 8.873 ± 0.62 Ba | 8.952 ± 0.506 ABa | 6.349 ± 0.44 Ab | 10.934 ± 0.47 Aa | |
| Mean | 7.723 ± 0.31 a | 8.445 ± 0.27 a | 5.899 ± 0.24 b | 10.314 ± 0.24 c | |
| Fe | 0–0.2 | 9.639 ± 0.46 Aa | 7.744 ± 0.35 Ab | 7.426 ± 0.32 Ab | 9.813 ± 0.32 Aa |
| 0.2–0.4 | 9.273 ± 0.46 Aa | 9.613 ± 0.46 Ba | 7.857 ± 0.37 Aa | 9.060 ± 0.37 Aa | |
| 0.4–0.6 | 9.418 ± 0.46 Aa | 8.376 ± 0.41 CAa | 8.540 ± 0.37 Aba | 10.335 ± 0.37 Ac | |
| 0.6–1.0 | 9.748 ± 0.46 Aab | 8.872 ± 0.37 CBb | 8.686 ± 0.32 Ab | 10.413 ± 0.35 Aa | |
| Mean | 9.519 ± 0.23 a | 8.651 ± 0.20 a | 8.127 ± 0.17 a | 9.905 ± 0.18 b | |
| Mn | 0–0.2 | 0.247 ± 0.02 Aa | 0.245 ± 0.02 Aa | 0.204 ± 0.02 Aa | 0.318 ± 0.02 Ab |
| 0.2–0.4 | 0.240 ± 0.02 Aab | 0.300 ± 0.02 Ab | 0.225 ± 0.02 Aa | 0.220 ± 0.02 Ba | |
| 0.4–0.6 | 0.269 ± 0.02 ABab | 0.2130 ± 0.02 Aa | 0.292 ± 0.012 Bb | 0.210 ± 0.02 Ba | |
| 0.6–1.0 | 0.313 ± 0.02 Bab | 0.225 ± 0.02 Ab | 0.277 ± 0.02 CAb | 0.205 ± 0.02 Bab | |
| Mean | 0.27 ± 0.011 a | 0.246 ± 0.01 a | 0.249 ± 0.01 a | 0.238 ± 0.01 a | |
| TACP System | ||||||
|---|---|---|---|---|---|---|
| Variables * | Rotation 1 | Rotation 2 | Rotation 3 | |||
| Inside CPS | Outside CPS | Inside CPS | Outside CPS | Inside CPS | Outside CPS | |
| Bd | 1.06 a | 0.97 a | 1.03 b | 0.99 b | 0.96 c | 0.92 c |
| SOC, % | 2.88 a | 2.78 a | 1.41 b | 1.59 b | 0.82 c | 0.81 c |
| TN, % | 0.23 a | 0.23 a | 0.16 b | 0.15 b | 0.11 c | 0.12 c |
| CN ratio | 11.74 a | 11.01 ab | 7.29 b | 8.39 bc | 6.36 c | 6.04 c |
| pH | 4.51 a | 4.47 a | 4.66 b | 4.60 b | 4.99 c | 5.02 c |
| Available nutrient contents: | ||||||
| NO3− | 0.01 a | 0.00 b | 0.00 a | 0.00 a | 0.00 a | 0.00 b |
| SO42− | 0.00 a | 0.00 b | 0.00 a | 0.00 a | 0.00 a | 0.00 a |
| NH4+ | 0.00 a | 0.00 a | 0.00 a | 0.00 a | 0.00 a | 0.00 a |
| Total element contents: | ||||||
| Na | 0.00 a | 0.01 a | 0.01 b | 0.01 b | 0.01 c | 0.01 c |
| K | 0.48 a | 0.41 a | 0.45 b | 0.38 b | 0.31 c | 0.41 c |
| P | 0.19 a | 0.20 a | 0.17 b | 0.17 b | 0.20 c | 0.17 d |
| Mg | 0.73 a | 0.70 a | 0.75 b | 0.70 b | 0.41 c | 0.48 c |
| Ca | 0.17 a | 0.14 a | 0.17 b | 0.14 b | 0.18 c | 0.17 c |
| Al | 8.11 a | 8.55 a | 6.14 b | 5.73 c | 11.27 c | 9.01 d |
| Fe | 8.35 a | 8.72 a | 8.47 b | 7.64 c | 10.49 d | 9.20 e |
| Mn | 0.24 a | 0.25 a | 0.25 b | 0.25 b | 0.22 c | 0.27 c |
Publisher’s Note: MDPI stays neutral with regard to jurisdictional claims in published maps and institutional affiliations. |
© 2022 by the authors. Licensee MDPI, Basel, Switzerland. This article is an open access article distributed under the terms and conditions of the Creative Commons Attribution (CC BY) license (https://creativecommons.org/licenses/by/4.0/).
Share and Cite
Beshir, M.; Yimer, F.; Brüggemann, N.; Tadesse, M. Soil Properties of a Tef-Acacia decurrens-Charcoal Production Rotation System in Northwestern Ethiopia. Soil Syst. 2022, 6, 44. https://doi.org/10.3390/soilsystems6020044
Beshir M, Yimer F, Brüggemann N, Tadesse M. Soil Properties of a Tef-Acacia decurrens-Charcoal Production Rotation System in Northwestern Ethiopia. Soil Systems. 2022; 6(2):44. https://doi.org/10.3390/soilsystems6020044
Chicago/Turabian StyleBeshir, Miftha, Fantaw Yimer, Nicolas Brüggemann, and Menfese Tadesse. 2022. "Soil Properties of a Tef-Acacia decurrens-Charcoal Production Rotation System in Northwestern Ethiopia" Soil Systems 6, no. 2: 44. https://doi.org/10.3390/soilsystems6020044
APA StyleBeshir, M., Yimer, F., Brüggemann, N., & Tadesse, M. (2022). Soil Properties of a Tef-Acacia decurrens-Charcoal Production Rotation System in Northwestern Ethiopia. Soil Systems, 6(2), 44. https://doi.org/10.3390/soilsystems6020044