Abstract
Paddy soils in some areas of southern China are contaminated by arsenic (As) and cadmium (Cd), threatening human health via the consumption of As- and/or Cd-tainted rice. To date, a quantitative understanding of how soil characteristics control As and Cd accumulation in rice grains under field conditions is still deficient. Based on 31 paired soil-grain samples collected in southern China, we statistically explored which soil parameter or parameter combination from various soil analyses best estimates As and Cd in rice. We found that CaCl2 extraction of field-moist soil collected at rice harvest provided the best estimation (R2adj = 0.47–0.60) for grain Cd followed by dry soil CaCl2 extraction (R2adj = 0.38–0.49), where CaCl2 extractable Cd from moist or dry soil was the dominant soil parameter. Compared to soil totals, parameters from neither dry soil ascorbate-citrate extraction nor anoxic soil incubation improved model performance for grain As (R2adj ≤ 0.44), despite their closer relevance to soil redox conditions during plant As uptake. A key role of soil-available sulfur in controlling grain As was suggested by our models. Our approach and results may help develop potential soil amendment strategies for decreasing As and/or Cd accumulation from soils.
1. Introduction
Rice as a staple food feeds more than half of the world population [1]. However, when grown on soils with elevated levels of toxic metal(loid)s, e.g., arsenic (As) and cadmium (Cd), rice can substantially contribute to the human exposure to As and Cd through long-term ingestion of contaminated rice [2,3,4]. This has threatened the health of residents on a regional scale [2,3,5].
During China’s rapid industrialization and urbanization in the past three decades, large amounts of toxic metal(loid)s were released into soils [6]. According to the national soil contamination survey [7], Cd and As were ranked as first and third in terms of percentage exceedance of environmental quality standards in agricultural soils [7]. The large spatial overlaps between ore-rich regions and major rice producing regions [8] and the high risk of soil contamination by mining- or smelting-related industries [6] has raised concerns over rice contamination by As and Cd in the southern provinces of China. When introduced to soils, As is strongly adsorbed by poorly crystalline Fe (oxy)hydroxide minerals under oxic conditions. In contrast, Cd is mainly weakly adsorbed to negatively charged surfaces as labile fraction in oxic and acidic soils [9]. Following soil flooding, As can be mobilized after the reductive dissolution of As-bearing Fe minerals [10,11,12], while Cd can be immobilized by pH increase (for acidic soils) and Cd sulfides formation [9,13,14]. The mobile or labile fraction of As or Cd in soils can be potentially taken up by rice plants with additional influences by rhizosphere processes (e.g., formation of root iron-plaque [15,16,17,18]). Therefore, flooded conditions during rice cultivation greatly increase As phytoavailability, while the acidic soils greatly increase the Cd phytoavailability in southern China [19]. Furthermore, rice plants inherently accumulate As and Cd in the grain more efficiently compared to other cereals, possibly because of higher expression of genes encoding transporters involved in arsenite (OsLsi1, OsLsi2) and Cd (OsNramp5) uptake [20,21].
Soil amendment has been shown to be an important strategy to mitigate As and Cd accumulation in rice [22], in addition to strategies of breeding rice cultivars with low As and/or Cd accumulation traits [22,23]. However, the complex interactions among amendment materials, soil components, and water management can decrease the actual performance of promising amendment materials under field conditions [24,25]. An alternative approach for identifying potential amendment materials for decreasing rice As and Cd levels may be based on empirical models using field data. Provided an unbiased selection mechanism of model variable(s) according to the model performance [10], the generated best subset empirical regression models after exploring a pool of promising soil parameters may provide a statistically based indication that soil parameters (i.e., the selected variable subset) are key to grain As and Cd accumulation under field conditions. This knowledge will be useful for designing soil amendment strategies that target the respective key soil parameters accordingly.
Only limited multivariate regression models exist linking soil parameters to the concentrations of As (R2 = 0.12–0.37) and Cd in rice grain (R2 = 0.31–0.71) [26,27,28], based on surveys covering part of southern China. However, the selection of soil parameters, either directly as model variables or as a variable pool, would strongly affect the performance and implications of the models. Soil parameters from different soil analyses may have different relevance to the phytoavailability of As or Cd in soils. It is known that dry soil extractions targeting specific soil fractions can predict phytoavailable As or Cd better than total concentrations in soils [29,30]. Ascorbate-citrate (AscCit) extraction was shown to selectively dissolve poorly crystalline Fe oxides and release elements associated with those Fe minerals [31], thus it is a promising soil extraction method for estimating soil As availability to rice. CaCl2 extraction can dissolve soluble Cd and exchange non-specifically (or electrostatically) adsorbed Cd in soils. Close correlations between soil CaCl2 extractable Cd and rice Cd were reported [32,33]. However, little is known about how meaningful those dry soil extractions are for As and/or Cd uptake by plants grown under changing soil redox conditions.
In paddy soils, the large variations in redox conditions caused by soil flooding and drainage may interfere with the relationship between dry soil parameters and the phytoavailability of As and Cd. For As, microbial processes (e.g., arsenite oxidation by nitrate reducers [34,35]) and mineral transformation (e.g., As-adsorbing mackinawite [36]) after soil flooding will further alter As availability to rice but will not be accounted for by dry soil extractions (e.g., AscCit extraction). Soil parameters reflecting soil redox dynamics during rice cultivation are expected to provide better prediction of rice As uptake after finding parameters from three dry soil extractions as poor predictors in one study [37]. For Cd, further soil oxidation during transport and soil drying could deviate soil Cd extractability from that of the field-moist soil [38]. Thus, CaCl2 extraction on field-moist soils was suggested to provide soil parameters more relevant to rice grain Cd accumulation compared to dry soil CaCl2 extractions [38]. However, several regression models have also been shown to successfully estimate grain Cd from dry soil parameters only [27,32,39]. Thus, it remains unclear how soil parameters collected at soil redox conditions representative of the critical periods of As and Cd uptake by rice [40], respectively, could improve the estimation of As and Cd accumulation in rice grain.
The objective of this study is to identify key soil parameters that are statistically relevant to As and Cd accumulation in rice grain under field conditions in southern China by developing multivariate regression models between grain As and Cd concentrations and soil parameters in an explorative way. The soil-parameter pools used for exploration were obtained from different analyses, including soil total elemental analysis and extractions using dried soils and field-moist soils, as well as water-saturated, anoxically incubated soils, based on a field sampling in southern China. We expect that soil parameters that are obtained at soil redox conditions relevant to plant As/Cd uptake would provide better estimations of rice As/Cd. The identified key soil parameters from this study may assist the development of soil amendment strategies to control As and Cd accumulation in rice grain.
2. Materials and Methods
2.1. Field Sampling
Thirty-one rice fields (Figure 1) located in five provinces (Guangdong, Guangxi, Hunan, Hubei, and Jiangxi) in southern China were sampled at rice harvest during October and November of 2017. The selected sites were either reported to be contaminated by metal(loid)s or were located close to mining areas, thus strongly varying and elevated soil As and Cd concentrations were expected. Paired soil-grain samples within a 1 m × 1 m grid (Figure 1) were collected from each site. Topsoil (0–20 cm depth) samples were collected with an auger at five spots within the selected 1 m × 1 m grid (Figure 1) and homogenized to obtain one composite sample for analysis. Rice grain samples in each of the 16 sub-grids were taken by cutting panicles using scissors and combined to one composite sample. All rice samples collected were long-grained rice belonging to the indica subspecies, but genetic identification of cultivars is not available.
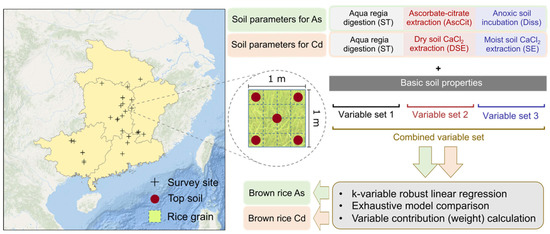
Figure 1.
Schematics of sampling locations, sample analyses, and regression strategy. Paired soil-grain samples were taken in five provinces in southern China at rice harvest during October and November in 2017. At each of the 31 sampling sites, topsoil samples (0–20 cm) and rice grain samples were collected in a 1 m × 1 m grid.
2.2. Rice Grain Analyses
Rice panicles were oven-dried at 40 °C for 24 h before threshing and dehusking. The resulting brown rice grains were milled without polishing using a zirconium oxide ball mill (MM 200, Retsch; Haan, Germany) for 4 min at 24 Hz. Triplicates of all 31 rice samples were digested using 0.1 g milled rice grains with 2.4 mL 67% HNO3 and 0.6 mL 35% H2O2 in Teflon tubes using a microwave digester (TurboWave, MLS, Leutkirch, Germany). Rice total elemental concentration (suffix: _RT) in brown rice was analyzed with ICP-MS using the rice digests after filtration (0.45 µm, nylon) and dilution. Blank and quality control (QC) samples (NIST 1568b rice flour) were included in every digestion batch. Detection limits and QC recovery can be found in Table S1.
For As speciation analysis, triplicates of 1.5 g milled rice grains and 15 mL 0.28 M HNO3 were mixed in 50 mL polypropylene tubes and heated to 90 °C in heating blocks (DigiPREP MS, SCP Science; Baie-d′Urfé, QC, Canada) for 1.5 h. After centrifugation at 3300× g for 10 min, the supernatants were filtered (0.45 µm, PTFE) and stored at 4 °C in the dark prior to analysis. Arsenite, dimethylarsenate, monomethylarsenate, and arsenate were determined with HPLC-ICP-MS (HPLC 1200 series, ICPMS 8800, Agilent) using an anion exchange column (Hamilton PRP-X100) and malonic acid (buffered pH 5.2, adjusted with NH3·H2O) as the mobile phase. The concentrations of arsenite and arsenate were summed up to calculate inorganic arsenic (iAs). Due to limited amounts of grain samples from five sites, As speciation in rice grain was carried out for 26 out of 31 sampling sites only.
2.3. Soil Analyses
2.3.1. Analyses of Basic Soil Properties and Elemental Composition
Soils except for field-moist soil extraction were oven dried at 40 °C and passed through a 2 mm nylon sieve. A representative sub-sample for each soil was milled using a tungsten carbide disc swing mill (RS1, Retsch; Haan, Germany). Dry soil pH (pH_d) was measured by glass electrode (Mettler Toledo; Greifensee, Switzerland) and a portable pH meter (Metrohm; Herisau, Switzerland) in soil suspension (10 g dried soil, 25 mL 0.01 M CaCl2 solution) after end-over-end shaking for 30 min. Total organic carbon (TOC), texture, and total elemental concentrations (suffix: _ST) of soil were also analyzed (see Supplementary Material (SM); Table 1 and Table 2).

Table 1.
Physiochemical characterization of soils in this study.
Table 2.
Concentration and percentage fraction compared to soil totals of As, Cd, Fe, Mn, S, Si, and Zn from rice and soil analyses.
2.3.2. Dry Soil Ascorbate-Citrate (AscCit) Extraction for As
A freshly prepared solution containing 0.1 M ascorbate, 0.2 M citrate, and 0.6 M bicarbonate at pH 7.5 (adjusted by 0.1 M NaOH solution) was used to extract As and other elements associated with poorly crystalline iron oxides in soil [31,41]. Triplicates of 1 g sieved (<2 mm, same below) dry soil and 40 mL extractant were mixed and shaken end-over-end at 23 °C in the dark for 2 h. The supernatant was filtered (nylon, 0.22 µm, BGB) after centrifuging at 3300× g for 15 min. Samples were diluted with 2% HNO3 and analyzed with ICP-MS for AscCit extractable elemental concentrations in soil (suffix: _AscCit).
2.3.3. Dry Soil CaCl2 Extraction for Cd
Triplicates of 4 g of sieved dry soil and 40 mL 0.01 M CaCl2 solution were mixed and shaken end-over-end for 2 h at 23 °C [29,42,43]. The supernatants were filtered (nylon, 0.45 µm, BGB), diluted with 2% HNO3, and analyzed with ICP-MS (8800 Agilent Technologies; Santa Clara, CA, USA) for dry soil exchangeable elemental concentrations (suffix: _DSE).
2.3.4. Anoxic Soil Incubation for As
To mimic and investigate the phytoavailability of As and other related elements during soil flooding, an anoxic soil incubation was performed [10]. Duplicates of 10 g of sieved dry soil were mixed with 15 mL of Milli-Q water in 50 mL polypropylene centrifuge tubes. The tubes were transferred into a N2-filled glovebox (pO2 < 1.3 ppm, MBraun 200B; Garching, Germany) to exchange the headspace before being sealed into gas-tight double-layer aluminum bags to prevent oxygen diffusion during the 20-day incubation outside the glovebox. During this period, microcosms were shaken end-over-end for 15 min every 8 h at 30 °C. Then, the microcosms were transferred back into the glovebox to measure pH and Eh (Eh = ORP + 197 mV; ORP electrode InLab Redox Micro, Mettler Toledo; Greifensee, Switzerland) directly in the slurry. After centrifugation at 3300× g for 10 min (Mistral 6000), solutions of microcosm experiments were retrieved by filtering (nylon, 0.22 μm, BGB Analytik AG; Boeckten, Switzerland) the supernatants into 15 mL polypropylene tubes. A 0.6 mL aliquot of each filtrate was transferred immediately into a glass vial containing 2.4 mL water and 20 µL 1 M HCl (purged with N2 for 2 h before transferring to glovebox) for dilution and acidification to a pH of about 3. The remaining filtrate in each plastic tube was then acidified by adding 1 mL 1 M HCl. All glass vials and plastic tubes were taken out of the glovebox and stored at 4 °C until analysis. Samples in the glass vials were analyzed for their dissolved organic carbon (OC_Diss) and nitrogen (N_Diss) content (DIMATOC 2000 and DIMA-N, DIMATEC). Samples in the plastic tubes were further diluted with 2% HNO3 and analyzed with ICP-MS for dissolved element concentrations (suffix: _Diss).
2.3.5. Field-Moist Soil CaCl2 Extraction for Cd
Immediately after soil homogenization at each sampling site, 6 g moist soil was weighed on a portable balance (Radtke Messtechnik, precision: 0.05 g) and mixed with 45 mL 0.01 M CaCl2 solution in 50 mL polypropylene tubes for extraction by manually shaking for 15 min and then sitting the suspension for 15 min [24]. Afterwards, the supernatants were filtered (nylon, 0.45 μm, BGB Analytik AG; Boeckten, Switzerland) and acidified using one drop of concentrated HNO3. Total element concentrations in the field moist soil CaCl2-extracts were determined with ICP-MS. Water contents of field-moist soil samples were determined gravimetrically after oven-drying 20 g aliquots of moist soil at 105 °C until constant weight and used to calculate moist soil exchangeable concentrations (suffix _SE) based on dry soil mass [38]. Another 10 g moist soil and 25 mL 0.01 M CaCl2 solution were mixed and manually shaken for 30 s to measure moist soil pH (pH_m).
2.4. Explorative Linear Regression
Explorative linear regressions between grain Cd or As and selected soil parameters were carried out with the program R Studio (Version 1.4.1106). R scripts and functions used are provided in the SM. Three sets of input soil parameters with different expected relevance to rice grain As or Cd accumulation as well as one combined parameter set comprising all parameters of the three sets were compiled and used for regression analyses of grain As and Cd, respectively (Table 3, Figure 1).
Table 3.
Input soil parameters for building regression models to estimate grain As and grain Cd.
All parameters except pH_d and pH_m were log10 transformed (denoted as lg) before modelling. Models using all possible combinations of up to three variables (k-variable models; k = 1, 2, 3) within each set of parameters were constructed to determine the best regression models. After a first model ranking based on the adjusted r-squared value of robust regression (R2adj) and cross-validated root mean squared error (CV-RMSE) (see SM), models without the target element (i.e., As or Cd) in any of their explanatory variable(s) were ranked after those with the target element in their explanatory variable(s). The relative contribution of each component variable to the explained variation (R2adj) by each multivariate model was calculated as the corresponding variable’s weight [10,44].
3. Results
3.1. Basic Soil Properties and Total Elemental Concentrations in Brown Rice and Soil
Large variations of physicochemical properties were found among sampled soils with soil pH (pH_d) ranging from 3.86–7.71, TOC ranging from 1.1–6.1%, and clay content ranging from 4.9–47%. Total elemental concentrations in soils also covered very wide ranges (Table 2). Specifically, soil As ranged from 5.04–235 mg/kg (As_STmedian = 19 mg/kg), and soil Cd ranged from 0.15–21 mg/kg (Cd_STmedian = 1.4 mg/kg). According to a recently released standard for agricultural soil in China [45], 35% of the sampled soils exceeded the risk screening values for As (20–30 mg/kg depending on soil pH; Figure S1), while in 87% of soils Cd concentrations were above the risk screening values (0.3–0.8 mg/kg depending on soil pH; Figure S1). Further details on soil properties and soil total elemental concentrations can be found in Table 1.
In brown rice, total As concentrations ranged from 45 to 320 µg/kg (As_RTmedian = 190 µg/kg). Inorganic As concentrations in the 26-sample subset accounted for 71–95% of the corresponding total As concentrations in brown rice, 27% of which exceeded the 200 µg/kg threshold value for inorganic As in rice in China (Figure S1). Total Cd concentrations in brown rice ranged from 12 to 3500 µg/kg (Cd_RTmedian = 420 µg/kg), indicating a strong exceedance of the Chinese threshold value (200 µg Cd/kg) in terms of both percentage of samples (74%) and concentration (>17 times the threshold value for the highest concentration; Figure S1).
3.2. Dry Soil AscCit Extraction
Compared to total concentrations in soils, 0.7–46% of As, 0.5–17% of Fe, 3–50% of Mn, and 8–59% of S were extracted by AscCit (Table 2). Strong positive correlations (Figure S2) were found between As_AscCit and As_ST (r = 0.70), Mn_AscCit and Mn_ST (r = 0.83), and S_AscCit and S_ST (r = 0.80), but not between Fe_AscCit and Fe_ST (r = 0.04). Among elements extracted by AscCit, positive correlations were found among As_AscCit, Fe_AscCit, and S_AscCit (r = 0.40–0.42), while their correlations with Mn_AscCit were much weaker (r = 0.10–0.23).
3.3. Anoxic Soil Incubation
After anoxic soil incubation, 0.02–5% of As, 0.005–0.6% of Fe, 0.2–5% of Mn, and 0.4–22% of S in soil were dissolved, which corresponded to 1–17% of As, 0.2–17% of Fe, 2–23% of Mn, and 1–54% of S in AscCit extractable fraction, respectively. A very poor correlation was found between As_Diss and Fe_Diss (r = −0.06) despite good correlations between AscCit extractable and incubation dissolved concentrations for As (r = 0.75, Figure S2) and Fe (r = 0.54, Figure S2). There was a strong negative correlation between Fe_Diss and soil pH (r = −0.77 for pH_d), while As_Diss was weakly correlated with pH_d (r = 0.25). Dissolved Cd from soil incubation was low (<0.13% soil total Cd) for all soils. Large ranges (two orders of magnitude) in dissolved concentrations were found for Mn, S, and Zn (Table 2). DOC concentrations after incubation varied from 23 to 277 mg/L, while dissolved Si only ranged from 3.3 to 17 mg/kg.
3.4. Dry Soil CaCl2 Extraction
The CaCl2 extractable, i.e., exchangeable fractions of Cd, Mn, Zn, and S of the dry soils, were 0.1–44%, 0.06–17%, <0.01–13%, and 4–37%, respectively, of total soil concentrations (Table 2). There were close positive correlations among Cd_DSE, Mn_DSE, and Zn_DSE (r = 0.73–0.78), as well as strong negative correlations between them and soil pH (r = −0.57 to −0.76 for pH_d, Figure S3). In contrast to AscCit extraction and anoxic soil incubation, less than 0.4% As and 0.06% Fe in soils was extracted by CaCl2, whereas in nine of the 31 soils, extractable Fe was not detected.
3.5. Field-Moist Soil CaCl2 Extraction
At field-moist conditions (gravimetric water content: 19–84%), 0.02–36% Cd, 0.05–26% Mn, 0.03–12% Zn, and 1–28% S in the soils were extracted by CaCl2, thus being exchangeable (Table 2), while less than 0.7% As and 0.6% Fe were exchangeable. Compared to field-moist soil CaCl2 extractions, air drying of soils prior to CaCl2 extraction increased the exchangeability of Cd and S in almost all soils while having only minor effects on Mn, Zn, and As exchangeability. In contrast, soil drying further decreased the already low exchangeability of Fe. Within the moist soil extracts, weaker correlations were found among Cd_SE, Mn_SE, and Zn_SE (r = 0.29–0.56) compared to their counterparts in dry soil extracts. However, Fe_SE was found to correlate with Mn_SE (r = 0.52) and Zn_SE (r = 0.39).
3.6. Regression for Grain As
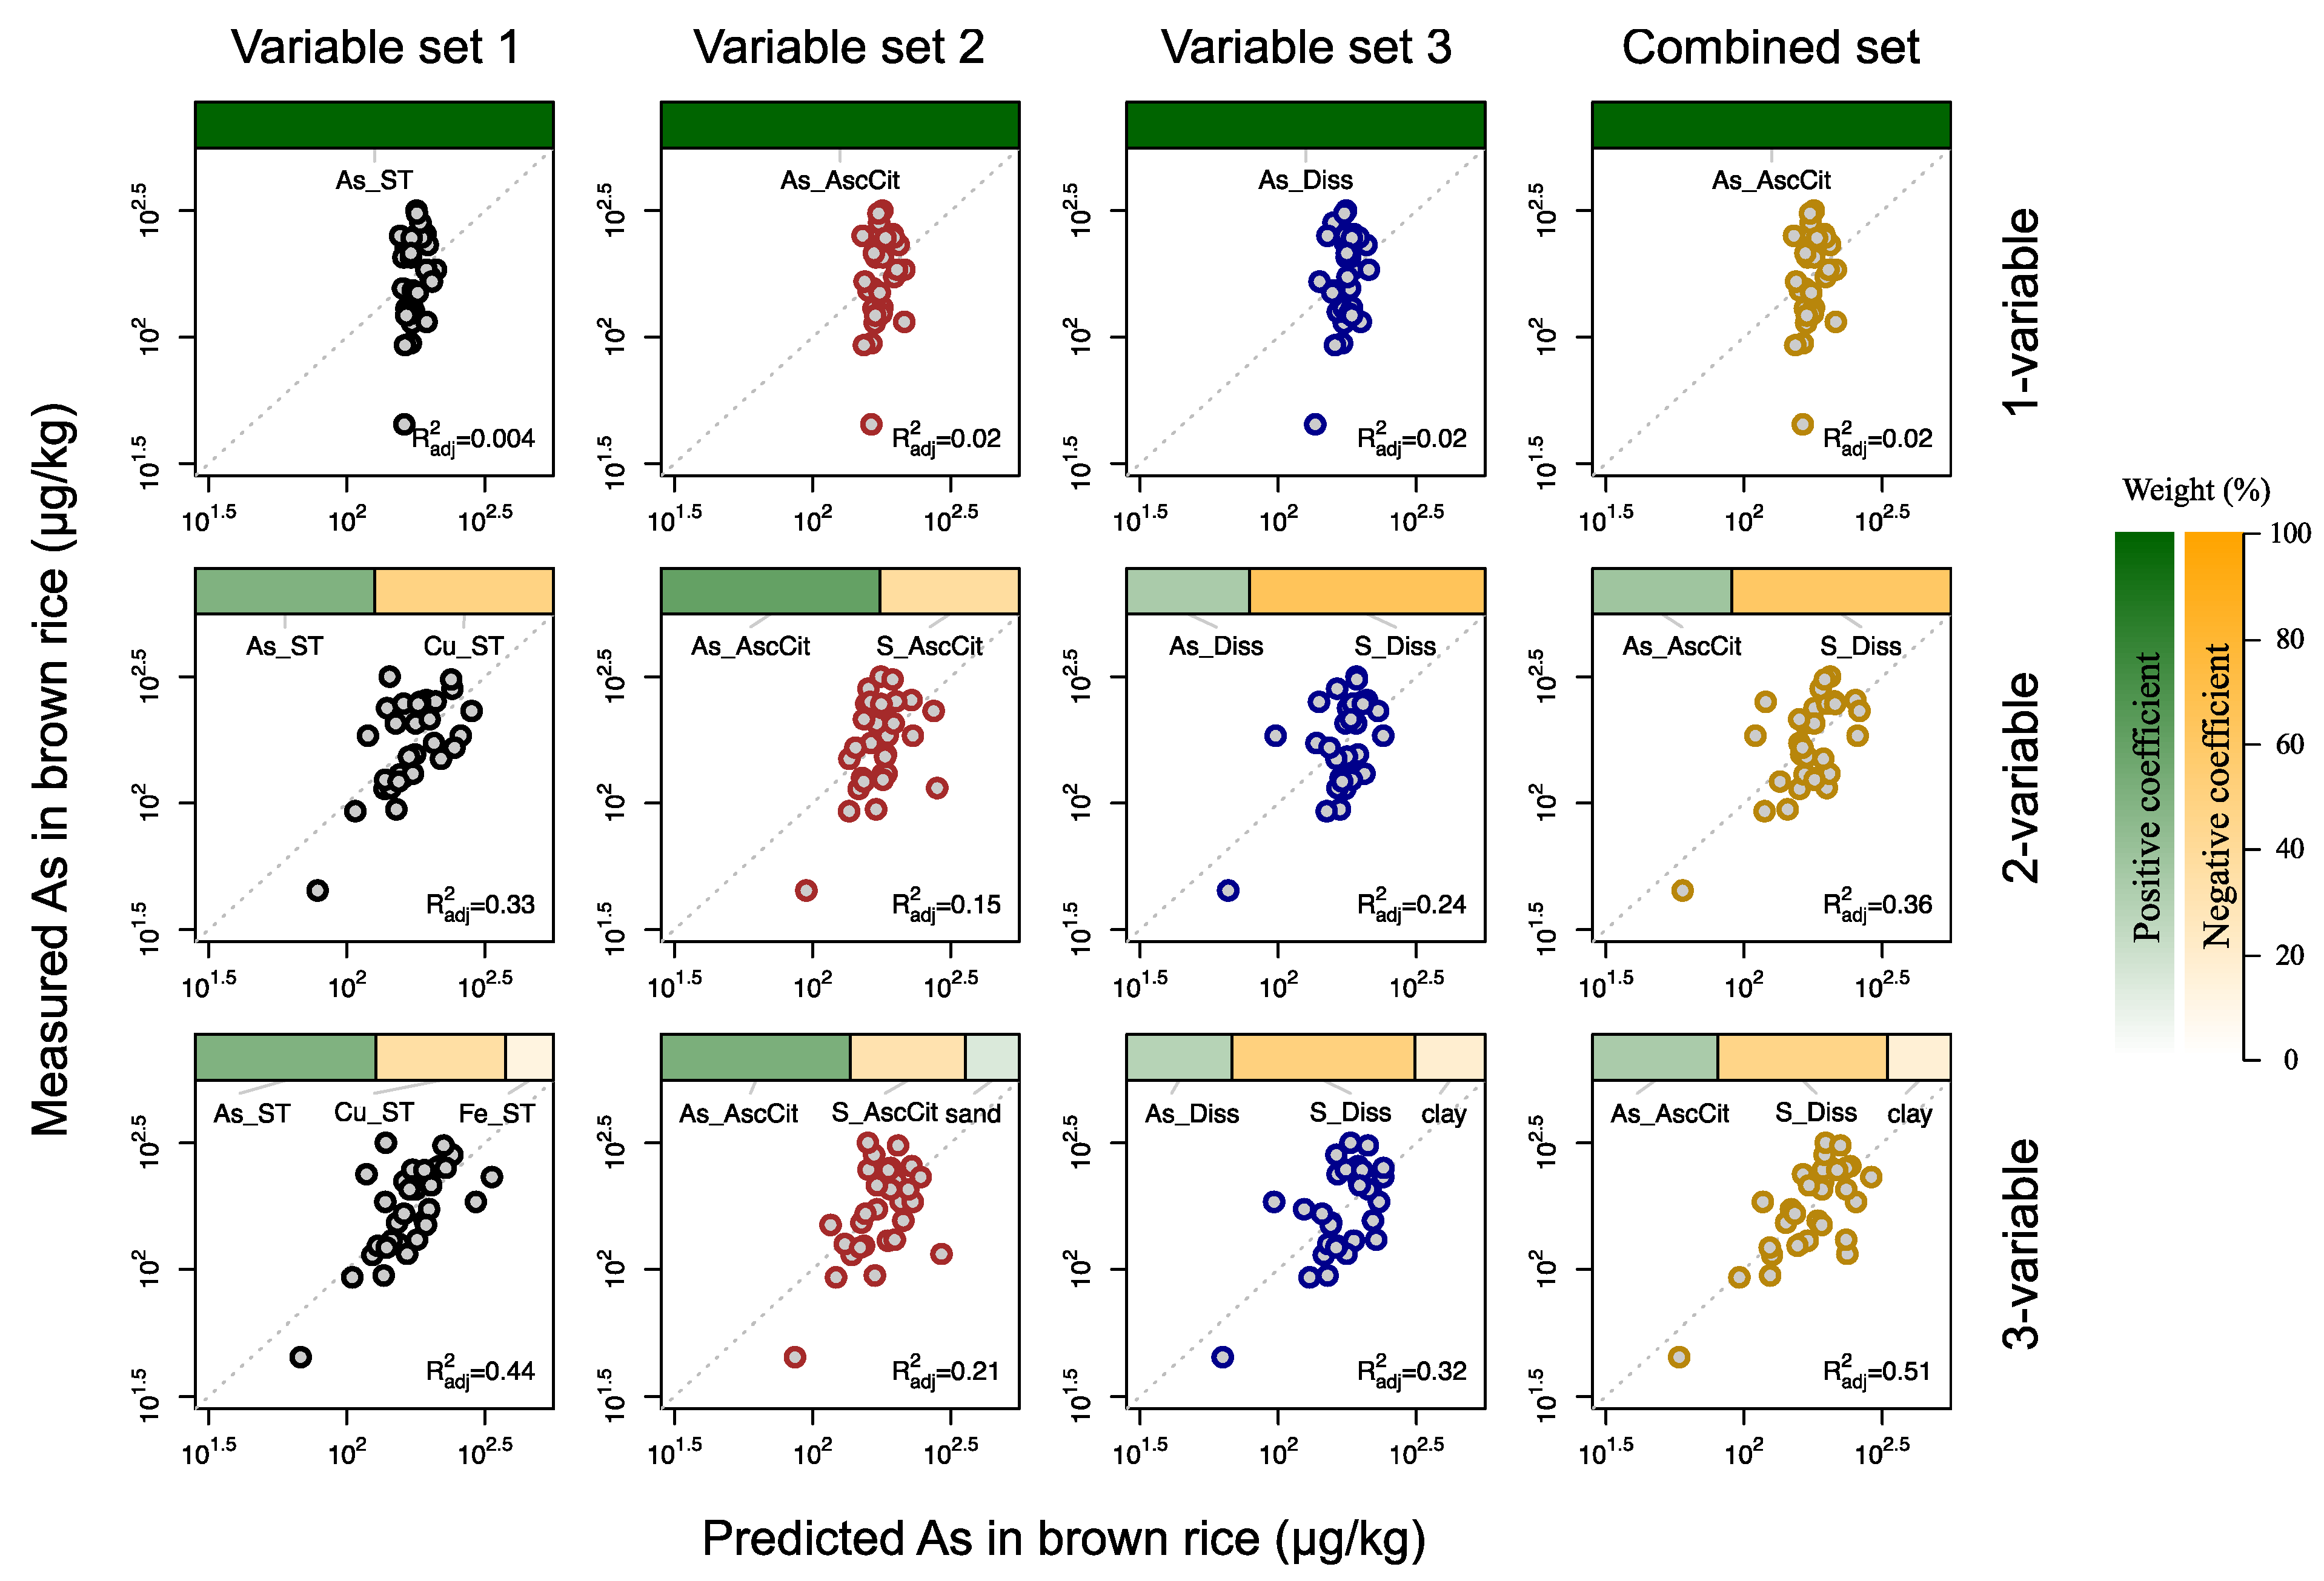
The best k-variable (k = 1, 2, 3) linear regression models for grain As generated from all sets of soil parameters are shown in Figure 2. With increasing number of variables, model performance (R2adj) increased under all sets of input soil parameters. However, models did not improve when replacing soil total elemental concentrations (set 1) with dry soil AscCit extraction (set 2) or anoxic soil incubation (set 3) parameters, although the latter two were supposed to be more relevant for predicting grain As accumulation. Specifically, none of the 1-variable models were satisfactory (p > 0.1), whereby variable set 2 and set 3 produced slightly better models than set 1. After adding a second variable, all three best 2-variable models had largely improved R2adj with 50%, 39%, and 66% contribution by weight from Cu_ST, S_AscCit, and S_Diss for three sets, respectively. All model parameters in the best 2-variable models, including As_ST, As_AscCit, and As_Diss, showed low p-values (0.001–0.063, Tables S2–S5), while they had p = 0.211–0.290 in 1-variable models alone. Interestingly, all three second variables in the 2-variable models had negative coefficients, meaning they negatively contributed to the estimated grain As concentrations. When combining parameters from all As-targeted analyses for variable searching and model construction, coupling of As_AscCit and S_Diss yielded the best estimation to rice grain As concentration in both 2-variable and 3-variable cases with R2adj being 0.36 and 0.51, respectively. Independent of the variable set, the importance of adding the third variable to the models decreased in terms of increased R2adj from 2-variable models to 3-variable models and weight contribution.
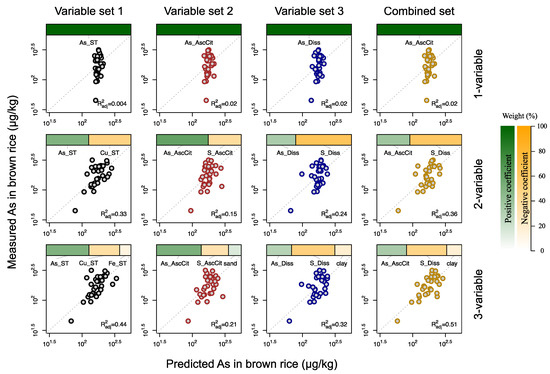
Figure 2.
Best k-variable (k = 1, 2, 3) linear regression models for grain As based on three sets of soil parameter variables and combined soil parameters. The green and orange colors represent the positive and negative correlation of the model variables on total As in rice, respectively. Both the width of the colored horizontal bars and their color saturation (green or orange) correspond to the weight of the respective model variable (relative predictive power). Equations of the best five k-variable (k = 1, 2, 3) As models from each set can be found in Tables S2–S5.
3.7. Regression for Grain Cd
The best k-variable (k = 1, 2, 3) linear regression models for grain Cd generated from all sets of soil parameters are shown in Figure 3. Similar to the grain As models, adding model variables increased R2adj for all sets of soil parameters. However, improved model performance was also observed from variable set 1 to set 2 and from set 2 to set 3. This is in line with the expectation that the relevance to predict phytoavailable soil Cd increases from soil total elemental concentration to dry soil extraction to field-moist soil extraction. Among the 1-variable models (Table S9), moist soil exchangeable Cd (Cd_SE; p < 0.001, R2adj = 0.47) was found to be the best predictor for grain Cd (Cd_RT) followed by dry soil exchangeable Cd (Cd_DSE; p < 0.001, R2adj = 0.38), while soil total Cd (Cd_ST) alone was a much weaker predictor (p = 0.622). In the best 2-variable and 3-variable models, Cd_SE or Cd_DSE was selected as the dominating variable for Cd_RT (weight: 54–87%, Tables S7 and S8). When a combined parameter set was used, a moist soil (SE) parameter was always needed in all the top-five multivariate models though Cd_DSE appeared instead of Cd_SE in some models (Table S9), suggesting the importance of studying fresh soil at harvest to grain Cd estimation. For the complementary model parameters, dry soil pH (pH_d) showed up with >78% weight coupling Cd_ST in set 1, greatly increasing model R2adj from −0.03 to 0.25 and 0.28 in 2- and 3-variable models, respectively. In variable set 2, Zn_DSE was found to be the second parameter (p < 0.05) in the best 2- and 3-variable models after Cd_DSE and contributed about 15% of the explained variation in grain Cd with a negative coefficient. In set 3 and the combined set, moist soil exchangeable Fe (Fe_SE) prevailed as the second parameter (p < 0.01) in the best 2- and 3-variable models with a small (weighing 13–18%) but negative contribution. All of the third-model parameters in the best 3-variable Cd models had relatively high p-values (0.01–0.25, Tables S6–S9).
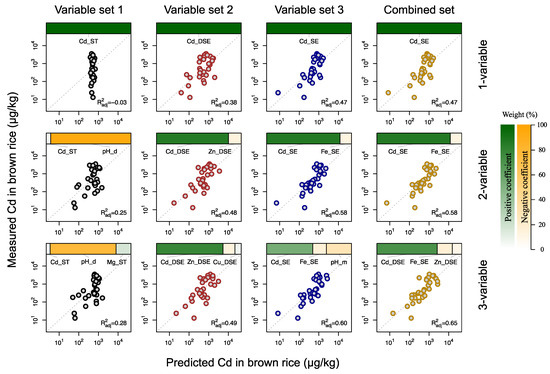
Figure 3.
Best k-variable (k = 1, 2, 3) linear regression models for grain Cd based on three sets of soil parameter variables and combined soil parameters. The green and orange colors represent the positive and negative correlation of the model variables on total As in rice, respectively. Both the width of the colored horizontal bars and their color saturation (green or orange) correspond to the weight of the respective model variable (relative predictive power). Equations of the best five k-variable (k = 1, 2, 3) Cd models from each set can be found in Tables S6–S9.
4. Discussion
4.1. Importance of Soil Parameters Reflecting Redox Conditions during As/Cd Uptake
Paddy soil in southern China undergoes pronounced redox changes during a typical rice season, including soil flooding before transplanting until late tillering, mid-season drainage (MSD), alternate flooding-drainage until rice maturation, and a final drainage before harvest [46]. From the late tillering stage on, vegetatively developed rice plants evaporate a large amount of water via transpiration, which can quickly dry out flooded fields within days under weather conditions of high temperature and low precipitation. When soils become dry and hard enough, fields are reflooded to a certain water level until the next cycle. Consequently, the duration of each flooding period after MSD will be dependent on the weather condition, causing randomness in both extent and period of the alternating reducing and oxidizing soil conditions. Since phytoavailability of soil As and Cd changes greatly under different soil redox conditions, it would be crucial that soil parameters used for estimating grain As or Cd should target redox conditions representative to those when a major uptake of As or Cd by rice took place [40].
Although soil parameters from anoxic soil incubation contributed to the best grain As models using the combined parameter set, it hardly improved the model performances alone (set 3) as compared to soil totals (set 1) and dry soil AscCit extraction (set 2) (Figure 2). Considering that the soil total elemental analysis and dry soil AscCit extraction require less time and simpler equipment than the anoxic soil incubation applied here, using soil parameters from our soil incubation seems not to be advantageous for estimating grain As. This finding seems to be in conflict with the idea that As mobilized by reductive dissolution of Fe (oxy)hydroxides in paddy soil may represent the main source of As accumulated in rice grain [11,12,47]. In addition, all the best As models in set 2 and set 3 explained considerably less variation of As in grain (R2adj = 0.02–0.32) compared to corresponding best Cd models (R2adj = 0.38–0.60). However, this may indicate that other variables unaccounted by our models may have influenced grain As accumulation apart from As mobilization after prolonged flooding, two of which could be water management (see Section 4.4) and plant physiology.
In contrast to grain As models, soil parameters obtained from moist soil extraction by 0.01 M CaCl2 were shown to be necessary and sufficient for developing the best estimation models for grain Cd accumulation in this study. This was revealed by the highest R2adj from variable set 3 among sets 1, 2, and 3 regardless of the number of model variables, which were nearly identical to the R2adj values from the combined set. Our results show that moist-soil extraction by 0.01 M CaCl2 at harvest better estimated Cd concentrations in rice grain compared to the same extraction on dry soils. This agrees with an earlier study and extends the knowledge for soils with greatly varied physicochemical properties (Table 1 and Table 2, Figure S4) on a regional scale [38]. However, considering the practical difficulties in extracting moist-soil on site or preserving field-moist soils, estimation from dry soil extraction (set 2) may already be clearly superior (R2adj = 0.38–0.49) to estimates based on pH and total soil Cd contents (set 1, R2adj = 0.25). Especially in the cases where soil samples were already dried for storage, dry soil CaCl2 extraction might be the best feasible option. The acceptable model performance from the dry soil extraction variable set is reasonable because most of the sampled soils were already drained and oxidized at harvest, thus rendering the extractability of metals (e.g., Cd, Mn, and Zn) in the field-moist soils highly correlated to those in the corresponding dry soils (Figure S3).
4.2. Key Soil Parameters for Grain As Estimation
By analyzing selected model parameters, key soil parameters for estimating grain As were extracted from generated best models. There were no dominant parameters in all 2- and 3-variable models regardless of the variable sets used. Instead, there were always two main variables with comparable weights in each 2- and 3-variable model, where one variable always represented an As-containing variable (As_ST, As_AscCit, As_Diss; weighing 29–61%) with a positive coefficient and the other one always represented a non-As variable (Cu_ST, S_AscCit, S_Diss; weighing 32–66%) with a negative coefficient. For the As-containing variables, correlations were strong between As_Diss and As_AscCit (r = 0.75, Figure S2), as well as As_AscCit, and As_ST (r = 0.70), but much weaker between As_ST and As_Diss (r = 0.30). This suggests that As_AscCit could be the intermediate fraction from As_ST to As_Diss, which agrees with that poorly crystalline Fe (oxy)hydroxide associated As being the As pool for reductive dissolution [11,12]. For the non-As variables, the close correlation of Cu_ST to both S_AscCit (r = 0.60) and S_Diss (r = 0.68) (Figure S2) suggested Cu_ST in the best As models in set 1 might just be a proxy to a S-related parameter. Thus, the non-As variable in each 2- and 3-variable As models can be summarized as a S-containing variable with a negative coefficient and nearly 50% variable weight. Sulfur in soil has been shown to potentially decrease As accumulation in rice grain by either forming As-adsorbing iron sulfide minerals in soil under sulfate reduction [36,48], or enhancing thiol synthesis within rice plant for complexing As thus decreasing As translocation to grain [49], or promoting iron plaque formation on rice root thus restricting As uptake by rice plant [50]. Our regression results suggested that there may be an important role of soil available S in controlling rice grain As concentrations.
In literature, it was shown that dissolved Si can act as competitor for As uptake into rice because of shared transporters [51,52]. Therefore, we expected that increased amounts of dissolved Si (Si_Diss) after soil reduction might coincide with decreased grain As accumulation. However, our analysis indicated that grain As (As_RT) was not directly related to Si_Diss (−0.01 < r < 0.01, Figure S2) and Si_Diss was not found to be an important influential variable for As_RT in the best 2- and 3-variable As models. This may be due to Si immobilization after mid-season drainage as shown in field trials [24]. Correspondingly, Si_Diss exhibited only a small range in concentrations (3.3–17 mg/kg) and was thus not selected by the As models as an explanatory variable for the much larger variations in grain As.
4.3. Key Soil Parameters for Grain Cd Estimation
Similar to grain As models, key soil parameters in estimating grain Cd were identified. In variable set 1 models, the large weight and negative coefficient of pH_d agreed well with pH being a dominant soil parameter in controlling rice grain Cd accumulation [53,54]. After parameters from dry or moist soil extractions were included in the variable pool, Cd_DSE or Cd_SE dominated the variable weight with positive coefficients in the corresponding best 2- or 3-variable models (Tables S7–S9). Furthermore, the close correlation of both Cd_DSE and Cd_SE to pH_d (r = −0.67 to −0.68, Figure S3) also suggested that the importance of pH_d in set 1 models was likely a reflection of the role of Cd_DSE or Cd_SE. Together, our results confirm that soil CaCl2-extractable Cd can well represent soil Cd availability for rice accumulation (high R2adj of best models containing Cd_DSE or Cd_SE) [33].
Negative effects of Zn_DSE (Tables S7 and S9, p = 0.010–0.014, weight: 11–15%) and Fe_SE (Tables S8 and S9, p = 0.001–0.005, weight: 13–18%) on grain Cd concentration were also identified from the best 2- or 3-variable models, though with minor variable weights. Competition by Zn and Fe on grain Cd accumulation seems to be the explanation at first glance. However, existing studies showed that Cd in rice shoot was rather increased under Zn supply and inconsistent under Fe supply [55,56,57,58,59]. Therefore, Zn_DSE may be a proxy to Mn_DSE (Figure S3), where competition by soil Mn on grain Cd accumulation was clearly evidenced [24]. The presence of Fe_SE in best models of set 3 and combined set could be explained by Fe_SE being an indicator of the soil redox condition at soil sampling. Higher Fe_SE may imply later drainage, meaning larger overestimation to the actual soil Cd phytoavailability during earlier grain-filling by Cd_SE at soil sampling.
4.4. Role of Water Management
As an often neglected aspect when estimating As or Cd accumulation in rice grain from soil parameters, variations in water management practices seem to have different impacts for As and Cd models. Theoretically, As or Cd accumulated in rice grain originates from the integration of phytoavailable As or Cd in the medium along the rice growing season. In practice in southern China, on the one hand, paddy fields are likely not over-drained until the grain-filling stage to avoid severe water stress and ensure high yield; on the other hand, fields need to be drained before harvest. Consequently, the late grain-filling stage is often the major Cd accumulation period relatively independent of detailed water management practices [2,40]. Thus, soil redox conditions at harvest are often highly representative of the conditions where major Cd accumulation occurred.
However, this is not the case for As. Since the extent of reductive mobilization of As in paddy soil is determined by the duration of flooding [10], the temporal evolution of phytoavailable As in paddy soil will depend strongly on the detailed water management, which itself will be adjusted according to local weather conditions. Literature also shows that As uptake at different growth stages contributed to As accumulation in rice grain [40]. Consequently, even though bringing soils back to anoxic condition (mimicking soil flooding) would provide more accurate information on the mobile As in soil for rice uptake compared to soil totals and dry soil extraction parameters, missing information on the detailed water management in our sampling sites limited the value of a single-time-point soil incubation in estimating grain As accumulation. This was also reflected by the weaker performance of As models (R2adj = 0.02–0.51) than Cd models (R2adj = 0.47–0.65) using the combined set of soil parameters. From this point of view, prediction of grain As based only on soil parameters would be deficient, especially in the context of increasingly practiced intermittent water regimes for rice cultivation [8,46].
5. Conclusions
By exploring a large pool of soil parameters from extensive analyses of 31 paired soil-grain samples collected in southern China, we constructed and compared a series of regression models in estimating As and Cd concentrations in rice grain using soil parameters from different soil parameter sets in a search for key soil parameters relevant to rice As and Cd accumulation under field conditions. Considering the trade-off between sample size and the level of sample characterization at a given budget, our dataset (though with limited sample size) provides valuable information upon which soil parameters or parameter combinations could better estimate grain As or Cd concentration. Although part of the variations of grain As and Cd remained unexplained (likely because of missing information on water management and rice cultivars), our statistical analyses identified significant contributions from soil parameters. Coupled with larger soil and rice databases or libraries, our approach and results can help develop potential soil amendment strategies for producing safer rice from As/Cd-affected paddies.
Comparing soil analyses, we found that soil parameters collected at redox conditions relevant to plant As/Cd uptake provided the best estimation for grain Cd (by moist soil CaCl2 extraction) but showed no improvement for grain As (by anoxic soil incubation) compared to dry soil extraction and soil total elemental analysis. The acceptable performance and easier sample handling and/or analysis make the dry soil CaCl2 extraction a practical alternative for estimating grain Cd. Moist or dry soil CaCl2 extractable (exchangeable or labile) Cd at rice harvest, which was strongly influenced by the corresponding soil pH, was found as the dominant model variable representing key soil parameters relevant to grain Cd accumulation. Negative contributions from other metals (e.g., Zn and Mn) that could compete with rice Cd uptake was also evidenced in models, though with minor weights similar to a previous report [24]. Therefore, our models suggested that decreasing soil labile Cd, e.g., by increasing soil pH via soil liming [54], would be the most effective way to decrease grain Cd accumulation for the region we sampled from, while not affecting As uptake in a detrimental way. Concerning As, parameters reflecting soil S availability (i.e., incubation dissolved and AscCit extractable S) were identified by our models as key soil parameters relevant to As accumulation in rice grain. The negative contributions from S-related soil parameters to grain As models suggest that increasing soil available S, e.g., by soil S amendment, might be a strategy to control As accumulation in rice grain worth to be further investigated [60,61], in addition to strategies aiming at decreasing soil As availability to rice plants.
Supplementary Materials
The following supporting information can be downloaded at https://www.mdpi.com/article/10.3390/soilsystems6020036/s1: Figure S1. Inorganic As (n = 26) and total Cd (n = 31) in brown rice from rice paddies grouped into different soil contamination levels. Figure S2. Correlation matrix of selected soil parameters in the variable pool for estimating grain As. Figure S3. Correlation matrix of selected soil parameters in the variable pool for estimating grain Cd. Figure S4. Classification for the 31 soils collected from this field survey. Table S1. Detection limits and quality controls (recoveries for certified rice and soil samples). Table S2. Top five k-variable models for grain As built from soil parameter set 1. Table S3. Top five k-variable models for grain As built from soil parameter set 2. Table S4. Top five k-variable models for grain As built from soil parameter set 3. Table S5. Top five k-variable models for grain As built from combined soil parameter set. Table S6. Top five k-variable models for grain Cd built from soil parameter set 1. Table S7. Top five k-variable models for grain Cd built from soil parameter set 2. Table S8. Top five k-variable models for grain Cd built from soil parameter set 3. Table S9. Top five k-variable models for grain Cd built from combined soil parameter set.
Author Contributions
Methodology and investigation: X.F., A.M., P.S. and P.W.; validation, formal analysis, and data curation: X.F., A.M. and P.S.; software, visualization, and writing—original draft: X.F.; writing—review & editing: X.F., A.M., P.S., I.C., F.-J.Z. and R.K.; conceptualization and supervision: I.C., F.-J.Z. and R.K.; project administration and funding acquisition: F.-J.Z. and R.K. All authors have read and agreed to the published version of the manuscript.
Funding
This research was funded by the Swiss National Science Foundation (grant No. IZLCZ2_170120) and the National Natural Science Foundation of China (grant No. 21661132001) in the Sino-Swiss Science and Technology Cooperation (SSSTC) Project.
Data Availability Statement
Data supporting reported results and R-scripts used for explorative linear regression and visualization can be found in the Supplementary Materials.
Acknowledgments
We thank Jun Zhang, Zhong Tang, Ming Wang, Bing-Kun Lu, Chuan Chen, and Jing Wang from Nanjing Agricultural University for their help, either in the field or in the lab, to make this field sampling possible. We thank Zhao-Feng Yuan and Williamson Gustave from Xi’an Jiaotong-Liverpool University for their assistance in the field with their portable XRF instrument. Acknowledgement also goes to Kurt Barmettler and Christoph Hoefer for their support in the lab, and to Michael Simmler for the valuable discussion on R codes and statistics at ETH Zurich.
Conflicts of Interest
The authors declare no conflict of interest. The funders had no role in the design of the study, in the collection, analyses, or interpretation of data, in the writing of the manuscript, or in the decision to publish the results.
References
- Fageria, N.K. Yield physiology of rice. J. Plant Nutr. 2007, 30, 843–879. [Google Scholar] [CrossRef]
- Wang, P.; Chen, H.; Kopittke, P.M.; Zhao, F.J. Cadmium contamination in agricultural soils of China and the impact on food safety. Environ. Pollut. 2019, 249, 1038–1048. [Google Scholar] [CrossRef]
- Zhu, Y.G.; Williams, P.N.; Meharg, A.A. Exposure to inorganic arsenic from rice: A global health issue? Environ. Pollut. 2008, 154, 169–171. [Google Scholar] [CrossRef]
- Li, G.; Sun, G.X.; Williams, P.N.; Nunes, L.; Zhu, Y.G. Inorganic arsenic in Chinese food and its cancer risk. Environ. Int. 2011, 37, 1219–1225. [Google Scholar] [CrossRef] [Green Version]
- Chen, H.; Yang, X.; Wang, P.; Wang, Z.; Li, M.; Zhao, F. Dietary cadmium intake from rice and vegetables and potential health risk: A case study in Xiangtan, southern China. Sci. Total. Environ. 2018, 639, 271–277. [Google Scholar] [CrossRef]
- Zhao, F.J.; Ma, Y.; Zhu, Y.G.; Tang, Z.; McGrath, S.P. Soil Contamination in China: Current status and mitigation strategies. Environ. Sci. Technol. 2015, 49, 750–759. [Google Scholar] [CrossRef]
- Ministry of Environmental Protection (MEP); Ministry of Land and Resources (MLR). Report on the National Soil Contamination Survey. Available online: http://english.mee.gov.cn/News_service/news_release/201404/t20140428_271088.shtml (accessed on 17 February 2022).
- Hu, Y.; Cheng, H.; Tao, S. The challenges and solutions for cadmium-contaminated rice in China: A Critical Review. Environ. Int. 2016, 92, 515–532. [Google Scholar] [CrossRef]
- Loganathan, P.; Vigneswaran, S.; Jaya, K.; Naidu, R. Cadmium sorption and desorption in soils: A review. Crit. Rev. Environ. Sci. Technol. 2012, 42, 489–533. [Google Scholar] [CrossRef]
- Simmler, M.; Bommer, J.; Frischknecht, S.; Christl, I.; Kotsev, T.; Kretzschmar, R. Reductive solubilization of arsenic in a mining-impacted river floodplain: Influence of soil properties and temperature. Environ. Pollut. 2017, 231, 722–731. [Google Scholar] [CrossRef]
- Weber, F.A.; Hofacker, A.F.; Voegelin, A.; Kretzschmar, R. Temperature dependence and coupling of iron and arsenic reduction and release during flooding of a contaminated soil. Environ. Sci. Technol. 2010, 44, 116–122. [Google Scholar] [CrossRef]
- Bowell, R.J. Sorption of arsenic by iron oxides and oxyhydroxides in soils. Appl. Geochem. 1994, 9, 279–286. [Google Scholar] [CrossRef]
- Fulda, B.; Voegelin, A.; Kretzschmar, R. Redox-controlled changes in cadmium solubility and solid-phase speciation in a paddy soil as affected by reducible sulfate and copper. Environ. Sci. Technol. 2013, 47, 12775–12783. [Google Scholar] [CrossRef]
- Kögel-Knabner, I.; Amelung, W.; Cao, Z.; Fiedler, S.; Frenzel, P.; Jahn, R.; Kalbitz, K.; Kölbl, A.; Schloter, M. Biogeochemistry of paddy soils. Geoderma 2010, 157, 1–14. [Google Scholar] [CrossRef]
- Maisch, M.; Lueder, U.; Kappler, A.; Schmidt, C. Iron Lung: How rice roots induce iron redox changes in the rhizosphere and create niches for microaerophilic Fe(II)-oxidizing bacteria. Environ. Sci. Technol. Lett. 2019, 6, 600–605. [Google Scholar] [CrossRef] [Green Version]
- Maisch, M.; Lueder, U.; Kappler, A.; Schmidt, C. From plant to paddy—How rice root iron plaque can affect the paddy field iron cycling. Soil Syst. 2020, 4, 28. [Google Scholar] [CrossRef]
- Yamaguchi, N.; Ohkura, T.; Takahashi, Y.; Maejima, Y.; Arao, T. Arsenic distribution and speciation near rice roots influenced by iron plaques and redox conditions of the soil matrix. Environ. Sci. Technol. 2014, 48, 1549–1556. [Google Scholar] [CrossRef]
- Seyfferth, A.L.; Limmer, M.; Wu, W. Si and water management drives changes in Fe and Mn pools that affect ss cycling and uptake in rice. Soil Syst. 2019, 3, 58. [Google Scholar] [CrossRef] [Green Version]
- Zhu, H.; Chen, C.; Xu, C.; Zhu, Q.; Huang, D. Effects of soil acidification and liming on the phytoavailability of cadmium in paddy soils of central subtropical China. Environ. Pollut. 2016, 219, 99–106. [Google Scholar] [CrossRef]
- Sui, F.Q.; Chang, J.D.; Tang, Z.; Liu, W.J.; Huang, X.Y.; Zhao, F.J. Nramp5 expression and functionality likely explain higher cadmium uptake in rice than in wheat and maize. Plant Soil 2018, 433, 377–389. [Google Scholar] [CrossRef]
- Su, Y.H.; McGrath, S.P.; Zhao, F.J. Rice is more efficient in arsenite uptake and translocation than wheat and barley. Plant Soil 2010, 328, 27–34. [Google Scholar] [CrossRef]
- Zhao, F.J.; Wang, P. Arsenic and cadmium accumulation in rice and mitigation strategies. Plant Soil 2020, 446, 1–21. [Google Scholar] [CrossRef]
- Ishikawa, S. Mechanisms of cadmium accumulation in rice grains and molecular breeding for its reduction. Soil Sci. Plant Nutr. 2020, 66, 28–33. [Google Scholar] [CrossRef]
- Fang, X.; Wang, J.; Chen, H.; Christl, I.; Wang, P.; Kretzschmar, R.; Zhao, F.J. Two-year and multi-site field trials to evaluate soil amendments for controlling cadmium accumulation in rice grain. Environ. Pollut. 2021, 289, 117918. [Google Scholar] [CrossRef] [PubMed]
- Yang, Y.; Li, Y.; Wang, M.; Chen, W.; Dai, Y. Limestone dosage response of cadmium phytoavailability minimization in rice: A trade-off relationship between soil pH and amorphous manganese content. J. Hazard. Mater. 2021, 1403, 123664. [Google Scholar] [CrossRef]
- Mu, T.; Wu, T.; Zhou, T.; Li, Z.; Ouyang, Y.; Jiang, J.; Zhu, D.; Hou, J.; Wang, Z.; Luo, Y.; et al. Geographical variation in arsenic, cadmium, and lead of soils and rice in the major rice producing regions of China. Sci. Total. Environ. 2019, 677, 373–381. [Google Scholar] [CrossRef]
- Zhang, H.; Luo, Y.; Song, J.; Zhang, H.; Xia, J.; Zhao, Q. Predicting As, Cd and Pb uptake by rice and vegetables using field data from China. J. Environ. Sci. 2011, 23, 70–78. [Google Scholar] [CrossRef]
- Wu, J.; Song, Q.; Zhou, J.; Wu, Y.; Liu, X.; Liu, J.; Zhou, L.; Wu, Z.; Wu, W. Cadmium threshold for acidic and multi-metal contaminated soil according to Oryza sativa L. cadmium accumulation: Influential factors and prediction model. Ecotoxicol. Environ. Saf. 2021, 208, 111420. [Google Scholar] [CrossRef]
- Menzies, N.W.; Donn, M.J.; Kopittke, P.M. Evaluation of extractants for estimation of the phytoavailable trace metals in soils. Environ. Pollut. 2007, 145, 121–130. [Google Scholar] [CrossRef] [Green Version]
- Niazi, N.K.; Singh, B.; Shah, P. Arsenic speciation and phytoavailability in contaminated soils using a sequential extraction procedure and XANES spectroscopy. Environ. Sci. Technol. 2011, 45, 7135–7142. [Google Scholar] [CrossRef]
- Reyes, I.; Torrent, J. Citrate-ascorbate as a highly selective extractant for poorly crystalline iron oxides. Soil Sci. Soc. Am. J. 1997, 61, 1647. [Google Scholar] [CrossRef]
- Römkens, P.F.A.M.; Guo, H.Y.; Chu, C.L.; Liu, T.S.; Chiang, C.F.; Koopmans, G.F. Prediction of cadmium uptake by brown rice and derivation of soil-plant transfer models to improve soil protection guidelines. Environ. Pollut. 2009, 157, 2435–2444. [Google Scholar] [CrossRef] [PubMed]
- Zhang, M.K.; Liu, Z.Y.; Wang, H. Use of single extraction methods to predict bioavailability of heavy metals in polluted soils to rice. Commun. Soil Sci. Plant Anal. 2010, 41, 820–831. [Google Scholar] [CrossRef]
- Zhang, J.; Zhao, S.; Xu, Y.; Zhou, W.; Huang, K.; Tang, Z.; Zhao, F.J. Nitrate stimulates anaerobic microbial arsenite oxidation in paddy soils. Environ. Sci. Technol. 2017, 51, 4377–4386. [Google Scholar] [CrossRef] [PubMed]
- Wu, Y.-F.; Chai, C.-W.; Li, Y.-N.; Chen, J.; Yuan, Y.; Hu, G.; Rosen, B.P.; Zhang, J. Anaerobic As(III) oxidation coupled with nitrate reduction and attenuation of dissolved arsenic by Noviherbaspirillum species. ACS Earth Sp. Chem. 2021, 5, 2115–2123. [Google Scholar] [CrossRef]
- Burton, E.D.; Johnston, S.G.; Kocar, B.D. Arsenic mobility during flooding of contaminated soil: The effect of microbial sulfate reduction. Environ. Sci. Technol. 2014, 48, 13660–13667. [Google Scholar] [CrossRef]
- Seyfferth, A.L.; McCurdy, S.; Schaefer, M.V.; Fendorf, S. Arsenic concentrations in paddy soil and rice and health implications for major rice-growing regions of Cambodia. Environ. Sci. Technol. 2014, 48, 4699–4706. [Google Scholar] [CrossRef]
- Simmons, R.W.; Noble, A.D.; Pongsakul, P.; Sukreeyapongse, O.; Chinabut, N. Analysis of field-moist Cd contaminated paddy soils during rice grain fill allows reliable prediction of grain Cd levels. Plant Soil 2008, 302, 125–137. [Google Scholar] [CrossRef]
- Ye, X.; Li, H.; Ma, Y.; Wu, L.; Sun, B. The bioaccumulation of Cd in rice grains in paddy soils as affected and predicted by soil properties. J. Soils Sediments 2014, 14, 1407–1416. [Google Scholar] [CrossRef]
- Huang, B.-Y.; Zhao, F.J.; Wang, P. The relative contributions of root uptake and remobilization to the loading of Cd and As into rice grains: Implications in simultaneously controlling grain Cd and As accumulation using a segmented water management strategy. Environ. Pollut. 2021, 293, 118497. [Google Scholar] [CrossRef]
- Simmler, M.; Suess, E.; Christl, I.; Kotsev, T.; Kretzschmar, R. Soil-to-plant transfer of arsenic and phosphorus along a contamination gradient in the mining-impacted Ogosta River floodplain. Sci. Total. Environ. 2016, 572, 742–754. [Google Scholar] [CrossRef] [Green Version]
- Novozamsky, I.; Lexmond, T.M.; Houba, V.J.G. A single extraction procedure of soil for evaluation of uptake of some heavy metals by plants. Int. J. Environ. Anal. Chem. 1993, 51, 47–58. [Google Scholar] [CrossRef]
- Houba, V.J.G.; Temminghoff, E.J.M.; Gaikhorst, G.A.; Van Vark, W. Soil analysis procedures using 0.01 M calcium chloride as extraction reagent. Commun. Soil Sci. Plant Anal. 2000, 31, 1299–1396. [Google Scholar] [CrossRef]
- Israeli, O. A Shapley-based decomposition of the R-square of a linear regression. J. Econ. Inequal. 2007, 5, 199–212. [Google Scholar] [CrossRef]
- Ministry of Ecology and Environment (MEE); State Administration for Market Regulation (SAMR). Soil Environmental Quality Risk Control Standard for Soil Contamination of Agricultural Land (for Trial Implementation). Available online: https://www.mee.gov.cn/ywgz/fgbz/bz/bzwb/trhj/201807/t20180703_446029.shtml (accessed on 17 February 2022).
- Hu, P.; Huang, J.; Ouyang, Y.; Wu, L.; Song, J.; Wang, S.; Li, Z.; Han, C.; Zhou, L.; Huang, Y.; et al. Water management affects arsenic and cadmium accumulation in different rice cultivars. Environ. Geochem. Health 2013, 35, 767–778. [Google Scholar] [CrossRef] [PubMed]
- Arao, T.; Kawasaki, A.; Baba, K.; Mori, S.; Matsumoto, S. Effects of water management on cadmium and arsenic accumulation and dimethylarsinic acid concentrations in Japanese rice. Environ. Sci. Technol. 2009, 43, 9361–9367. [Google Scholar] [CrossRef] [PubMed]
- Xu, X.; Wang, P.; Zhang, J.; Chen, C.; Wang, Z.; Kopittke, P.M.; Kretzschmar, R.; Zhao, F.J. Microbial sulfate reduction decreases arsenic mobilization in flooded paddy soils with high potential for microbial Fe reduction. Environ. Pollut. 2019, 251, 952–960. [Google Scholar] [CrossRef]
- Dixit, G.; Singh, A.P.; Kumar, A.; Mishra, S.; Dwivedi, S.; Kumar, S.; Trivedi, P.K.; Pandey, V.; Tripathi, R.D. Reduced arsenic accumulation in rice (Oryza sativa L.) shoot involves sulfur mediated improved thiol metabolism, antioxidant system and altered arsenic transporters. Plant Physiol. Biochem. 2016, 99, 86–96. [Google Scholar] [CrossRef]
- Hu, Z.Y.; Zhu, Y.G.; Li, M.; Zhang, L.G.; Cao, Z.H.; Smith, F.A. Sulfur (S)-induced enhancement of iron plaque formation in the rhizosphere reduces arsenic accumulation in rice (Oryza sativa L.) seedlings. Environ. Pollut. 2007, 147, 387–393. [Google Scholar] [CrossRef]
- Ma, J.F.; Yamaji, N.; Mitani, N.; Xu, X.Y.; Su, Y.H.; McGrath, S.P.; Zhao, F.J. Transporters of arsenite in rice and their role in arsenic accumulation in rice grain. Proc. Natl. Acad. Sci. USA 2008, 105, 9931–9935. [Google Scholar] [CrossRef] [Green Version]
- Li, R.Y.; Ago, Y.; Liu, W.J.; Mitani, N.; Feldmann, J.; McGrath, S.P.; Ma, J.F.; Zhao, F.J. The rice aquaporin Lsi1 mediates uptake of methylated arsenic species. Plant Physiol. 2009, 150, 2071–2080. [Google Scholar] [CrossRef] [Green Version]
- Chen, H.; Tang, Z.; Wang, P.; Zhao, F. Geographical variations of cadmium and arsenic concentrations and arsenic speciation in Chinese rice. Environ. Pollut. 2018, 238, 482–490. [Google Scholar] [CrossRef] [PubMed]
- Chen, H.; Zhang, W.; Yang, X.; Wang, P.; McGrath, S.P.; Zhao, F.J. Effective methods to reduce cadmium accumulation in rice grain. Chemosphere 2018, 207, 699–707. [Google Scholar] [CrossRef] [PubMed]
- Cai, Y.; Xu, W.; Wang, M.; Chen, W.; Li, X.; Li, Y.; Cai, Y. Mechanisms and uncertainties of Zn supply on regulating rice Cd uptake. Environ. Pollut. 2019, 253, 959–965. [Google Scholar] [CrossRef] [PubMed]
- Green, C.E.; Chaney, R.L.; Bouwkamp, J. Increased zinc supply does not inhibit cadmium accumulation by rice (Oryza sativa L.). J. Plant Nutr. 2017, 40, 869–877. [Google Scholar] [CrossRef]
- Hassan, M.J.; Zhang, G.; Wu, F.; Wei, K.; Chen, Z. Zinc alleviates growth inhibition and oxidative stress caused by cadmium in rice. J. Plant Nutr. Soil Sci. 2005, 168, 255–261. [Google Scholar] [CrossRef]
- Nakanishi, H.; Ogawa, I.; Ishimaru, Y.; Mori, S.; Nishizawa, N.K. Iron deficiency enhances cadmium uptake and translocation mediated by the Fe2+ transporters OsIRT1 and OsIRT2 in rice. Soil Sci. Plant Nutr. 2006, 52, 464–469. [Google Scholar] [CrossRef]
- Shao, G.; Chen, M.; Wang, W.; Mou, R.; Zhang, G. Iron nutrition affects cadmium accumulation and toxicity in rice plants. Plant Growth Regul. 2007, 53, 33–42. [Google Scholar] [CrossRef]
- Wisawapipat, W.; Chooaiem, N.; Aramrak, S.; Chittamart, N.; Nookabkaew, S.; Rangkadilok, N.; Satayavivad, J.; Christl, I. Sulfur amendments to soil decrease inorganic arsenic accumulation in rice grain under flooded and nonflooded conditions: Insights from temporal dynamics of porewater chemistry and solid-phase arsenic solubility. Sci. Total. Environ. 2021, 779, 146352. [Google Scholar] [CrossRef]
- Liu, Z.; Zhuang, Z.; Yu, Y.; Wang, Q.; Wan, Y.; Li, H. Arsenic transfer and accumulation in the soil-rice system with sulfur application and different water managements. Chemosphere 2021, 269, 128772. [Google Scholar] [CrossRef]


Publisher’s Note: MDPI stays neutral with regard to jurisdictional claims in published maps and institutional affiliations. |
© 2022 by the authors. Licensee MDPI, Basel, Switzerland. This article is an open access article distributed under the terms and conditions of the Creative Commons Attribution (CC BY) license (https://creativecommons.org/licenses/by/4.0/).