Article

A Nematode Community-Based Integrated Productivity Efficiency (IPE) Model That Identifies Sustainable Soil Health Outcomes: A Case of Compost Application in Carrot Production

by
Alemayehu Habteweld
1,†,
Alexandra N. Kravchenko
2,
Parwinder S. Grewal
3,‡ and
Haddish Melakeberhan
1,*
1
Agricultural Nematology Laboratory, Department of Horticulture, Michigan State University (MSU), East Lansing, MI 48824, USA
2
Department of Plant, Soil and Microbial Sciences, Michigan State University (MSU), East Lansing, MI 48824, USA
3
Ohio Agricultural Research and Development Center (OARDC), The Ohio State University, Wooster, OH 44691, USA
*
Author to whom correspondence should be addressed.
Current Address: Department of Entomology and Nematology, University of Florida, Gainesville, FL 32608, USA.
Current Address: College of Sciences, University of Texas Rio Grande Valley, Edinburg, TX 78539, USA.
Soil Syst. 2022, 6(2), 35; https://doi.org/10.3390/soilsystems6020035
Submission received: 15 February 2022 / Revised: 24 March 2022 / Accepted: 7 April 2022 / Published: 11 April 2022
(This article belongs to the Special Issue Soil Metabolism and Biogenic Emissions of CO2 and N2O)

Abstract

:
Percent soil organic matter (SOM), pH and crop yield are among the biophysicochemical process-driven soil health indicators (SHIs). However, identifying sustainable soil health conditions using these SHIs is limited due to the lack of Integrated Productivity Efficiency (IPE) models. We define IPE as a concept that identifies best-to-worst-case soil health outcomes by assessing the effect of agronomic practices on weighted abundance of functional guilds (WAFG) of beneficial soil organisms and SHIs simultaneously. Expressing WAFG of all beneficial nematodes (x-axis) and SHIs (y-axis) as a percent of untreated control and regression of x and y reveals four quadrants describing worst-to-best-case outcomes for soil health and sustainability. We tested the effects of composted cow manure (AC) and plant litter (PC) applied at 135 (1×), 203 (1.5×), and 270 (2×) kg N/ha on WAFG, SOM, pH, and yield in a sandy clay loam field of a processing carrot cultivar over three growing seasons. Untreated control and urea at 1× served as experimental controls. Data that varied by time and were difficult to make sense of were separated into sustainable, unsustainable, or requiring specific modification to be sustainable categories by the IPE model. Within the sustainable category, all AC treatments and 2× rate of PC treatments had the best integrated efficiency outcomes across the SHIs. The IPE model provides a platform where other biophysicochemical process-driven SHIs could be integrated.

1. Introduction

1.1. Achieving Steady-State and Sustainable Soil Health Using Agricultural Practices (APs)

The application of soil nutrient amendments are among the agricultural practices (APs) used to achieve healthy soil in crop production systems [1,2,3,4,5,6]. Soil health, defined as capacity of a soil to function, has biological, physicochemical, nutritional, structural and water holding integrity components that need to be kept in balance in order to generate the desired ecosystem services [7,8,9]. Percent soil organic matter (SOM), pH, and crop yield are among the broad indicators of biophysicochemical process-driven soil health outcomes. Despite a substantial basic and applied science knowledge on the components of soil health and the biophysicochemical processes generating the desirable ecosystem services, developing sustainable soil health conditions remains a goal [10,11,12,13,14,15].
A sustainable soil health is defined as one that (i) has ideal conditions that deliver the desirable ecosystem services and meets (ii) environmental and (iii) economic expectations simultaneously [9]. There are two major factors that limit identifying and developing sustainable soil health. The first factor is the lack of an integrated understanding of how the APs influence the different components of soil health, the biophysicochemical process that generate the desired ecosystem services, and an indicator that connects the outcomes. Nematodes, most abundant metazoan on the planet and central players in the soil food web (SFW) and nutrient cycling, are a key indicator of belowground biophysicochemical and ecological changes [16,17,18,19,20,21,22,23,24,25,26]. The Ferris et al. [17] SFW model that identifies best-to-worst case scenarios for nutrient cycling potential and agroecosystem suitability by measuring changes in beneficial nematode population dynamics relative to reproduction and food source (enrichment trajectory) and to disturbance (structure trajectory) is an example. The SFW model’s application has been expanded to identify soil health conditions [9,27]. The second limiting factor is the lack of integration platforms that identify if the outcomes meet the definition of sustainable soil health [7,9]. Integration platform is defined as a foundation where desired ecosystem services can be aligned collectively or on a step-by-step basis. This requires integrated efficiency assessment that considers multiple ecosystem services simultaneously and identifies if the outcomes meet agrobiological, environmental and economic expectations.

1.2. The Concept of Integrated Efficiency and the Role of Nematodes

The concept of integrated efficiency has been reviewed recently [9]. Briefly, the common way of determining if an AP works or not is to assess production efficiency and sustainability of the ecosystem services in the soil. In the current context, we define production efficiency as the difference between the values of inputs (e.g., soil amendment or fertilizer) and outcomes (e.g., increases in organic matter or yield). For example, yield increases on a per-unit-nutrient and/or amount-of-fertilizer-applied basis would be considered efficient by current soil fertility management standards [20,28,29,30,31]. However, efficiency analysis based on increase of yield alone does not always lead to determining system sustainability. i.e., if a soil nutrient amendment increases crop yield, but adversely affects the soil environment [32] or beneficial organisms, it may not be sustainable [14,15]. Sustainability requires integration of the different components of soil health and multiple biophysicochemical process-driven ecosystem services simultaneously.
The modified nematode community analysis-based Fertilizer Use Efficiency (FUE) model (Figure 1, [33]) demonstrates how multiple ecosystem services can simultaneously be considered to identify sustainable soil health conditions. The FUE model separates nutrient deficiency and toxicity from effect on beneficial nematodes, desired ecosystem service (agronomic or soil parameter), and environmental outcomes and promotes identification of APs that lead to sustainable soil health conditions. The FUE model measures changes in abundance of beneficial nematodes quantified at trophic group levels (e.g., bacterivore, fungivore, predator or omnivore [20]) as an indicator [33]. It uses a quadrant format to relate production efficiency in terms of soil nutrients in relation to the abundances of beneficial nematodes as a percentage of those of the untreated control. Plotting production efficiency as crop yield or soil nutrient parameters (y-axis) against beneficial nematode trophic group abundance (x-axis) provides four categories of graphical indicators of the condition of the production system (Figure 1).
An optimal and potentially sustainable outcome is that a set of APs result in an increase of the biophysicochemical process-driven desired ecosystem services (soil parameter or yield) and abundance of beneficial nematodes (Quadrant F). A decrease in desired ecosystem service and beneficial nematodes (Quadrant G) indicates an unfavorable soil health outcome. If the outcome is an increase in desired ecosystem service and a decrease in beneficial nematodes (Quadrant E), the AP has conflicting consequences. A similarly conflicting consequence occurs when there is a decrease in ecosystem service with an increase in beneficial nematodes (Quadrant H).
The FUE model identifies best-to-worst case outcomes for sustainability by treating beneficial nematodes quantified at the trophic level (bacterivore, fungivore, predator and omnivore [16,17]) as a group and without accounting for their functions [33]. By feeding on microbes and being food for others, beneficial nematodes are contributing to the biophysicochemical processes of the SFW. In order to integrate the biophysicochemical process-based changes that nematodes contribute to and influence soil health, their functional guilds from colonizer-persister (c-p) to trophic levels need to be considered. This requires a new concept of Integrated Production Efficiency (IPE) analysis.

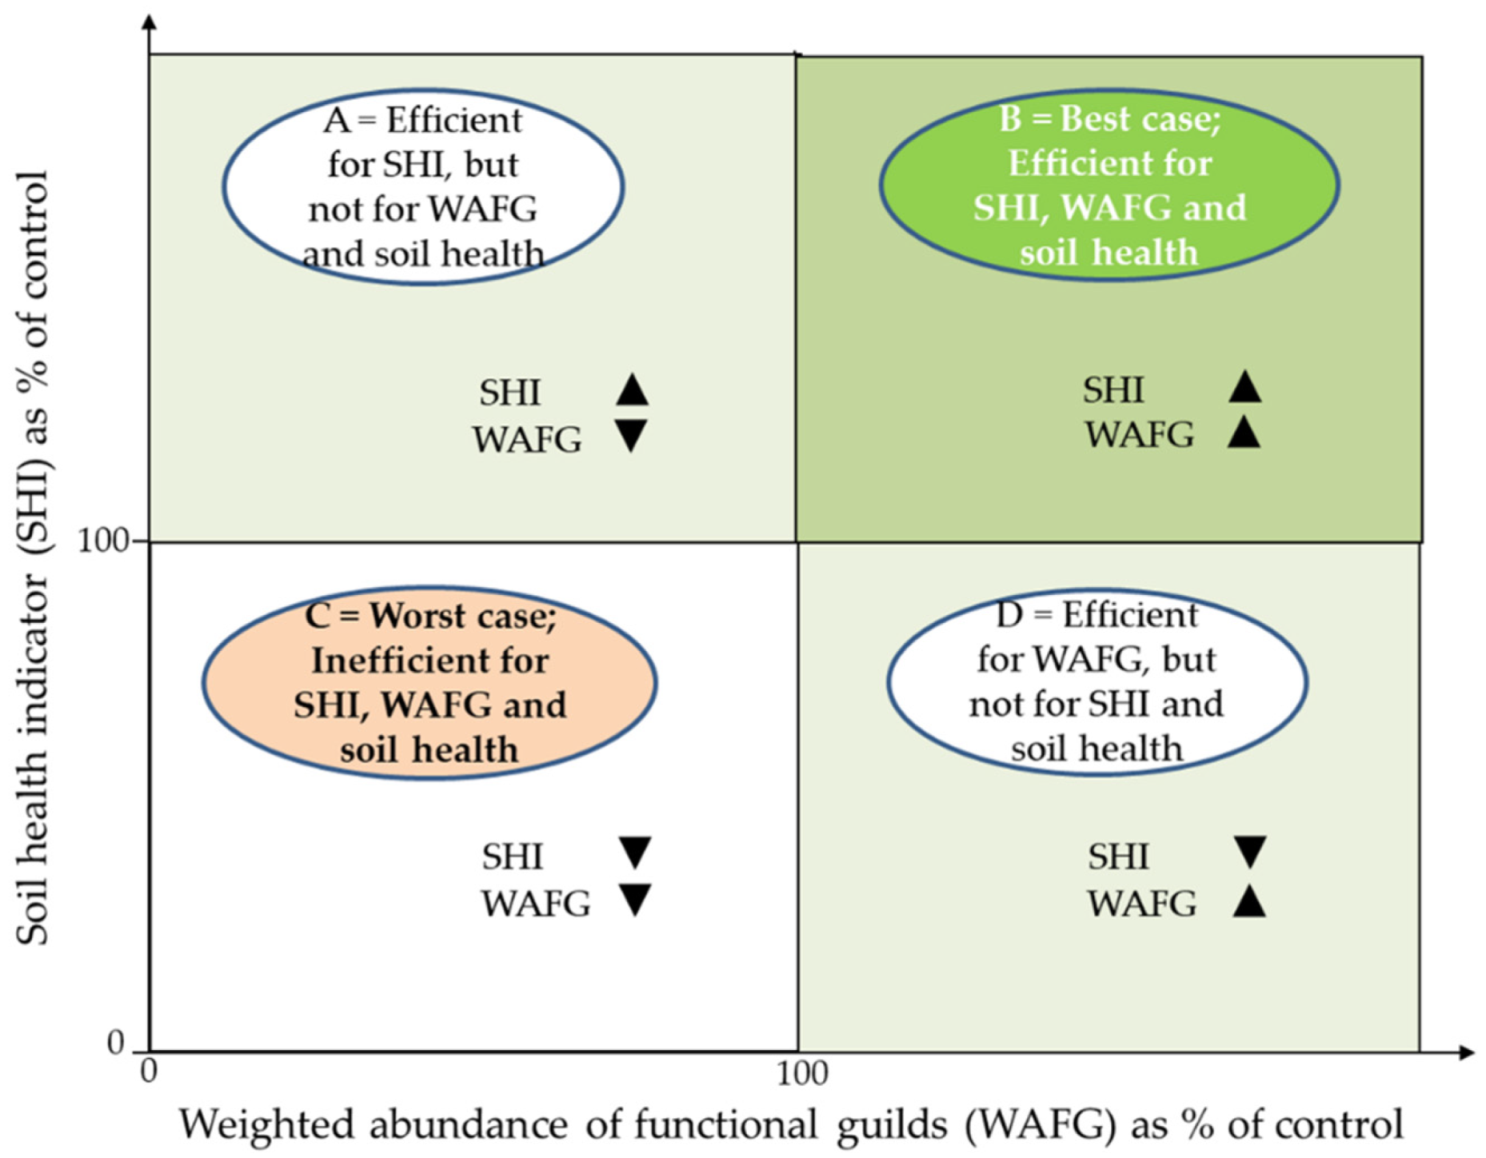
1.3. The Concept of IPE

We propose an IPE model that simultaneously considers soil biophysicochemical process-driven changes, environmental consequences, yield, and economics associated with the APs. We define IPE as a measure of the sustainability of production management practices and the outcomes in their totality. The IPE model uses new weighted abundances of functional guilds (WAFG) of beneficial nematodes quantified at the trophic [20] and c-p levels [16,17] as an indicator of biological changes to identify best-to-worst outcomes for sustainability and sustainable soil health conditions. What makes the IPE model unique is that it combines numbers and functions of bacterivore, fungivore, predator and omnivore nematode trophic groups [16,17] and compares changes of SHIs relative to one-another and identifies if the outcome is sustainable, unsustainable, and what specific actions will be required to get the desired outcome. By accounting for the numerical and functional aspects of nematodes, the IPE model (a) provides a broader assessment of biophysicochemical changes in the soil ecosystem that the APs drive, and (b) creates a platform where outcomes of different soil health components could be integrated.

1.4. Goals and Objectives

Our long-term goal is to develop IPE footprints that will lead to identifying sustainable soil health management in cropping systems from a single core of soil. The objectives of the study were three-fold: First, to introduce a new WAFG into the IPE model to recognize nematode community structures and their functions. This is important because there are no specific soil health values associated with either nematode trophic and/or c-p group abundance. Under these circumstances, it is necessary to consider changes in total nematode abundance that account for AP disturbance-driven c-p to trophic level dynamics and integrate WAFG of all nematodes into the IPE model. The WAFG will provide a measure of the total changes that could be attributed to nematodes. Second, to test the IPE model using the effects of plant (PC) and animal (AC) based compost amendments on soil pH, SOM and yield of carrot. We will do this by relating the changes in WAFG (x-axis) as an indicator of belowground changes and soil pH, SOM and yield (y-axis) as ecosystem services to identify best-to-worst outcomes for sustainable soil health. Third, compare conclusions drawn from the same data sets analyzed by standard means separation techniques and by the IPE model. The use of the IPE model does not imply that comparing treatment means are not needed, but mean separation by itself cannot tell if the outcome is sustainable or not.

2. Materials and Methods

2.1. Experimental Site and Design and Compost Application

Detailed methods of the work reported in Section 2.1, Section 2.2, Section 2.3, Section 2.4 herein are published in Habteweld et al. [34,35]. Briefly, this study was conducted in a field located within the Michigan State University (MSU) Horticulture Teaching and Research Center in Holt township, Michigan (N 43°24.040′, W 085°56.559′, 854 m elevation). The field has a Colwood-Brookston sandy clay loam (fine-loamy, mixed, mesic Type, Haplaquolls-Argiaquolls, [36]) soil with 54% sand, 25% silt and 21% clay. The study investigated the effects of PC and AC based compost on nematode community structure, SOM, pH, and yield and quality of a processing carrot cv. ‘Cupar’ during 2012, 2013 and 2014 growing seasons. The AC was commercial composted cow manure with carbon (C) to nitrogen (N) ratio of 11:3 (Morgan Composting, Inc., Sears, MI, USA) and the PC was more than ten years decomposed leaf litter from MSU Student Organic Farm, Holt, MI, USA [34]. The carbon (C) to nitrogen (N) ratio of the compost was 11:3 and 13:3 for AC and PC, respectively.
The treatments consisted of AC and PC compost adjusted to supply 135 (1×, standard for the soil type), 203 (1.5×) and 270 (2×) kg N/ha. The average amount of compost corresponding to the 1×, 1.5× and 2× rates of PC were 12.0 megagram (Mg) ha−1, 18.0 Mg ha−1 and 24.0 Mg ha−1, respectively; whereas, those of AC were 9.6 Mg ha−1, 14.4 Mg ha−1 and 19.2 Mg ha−1. Untreated (0) and urea applied at 1× served as controls. Each treatment was replicated four times. Treatments were arranged in a randomized complete block design. The respective treatments were applied uniformly by hand on a four-row 3.72-m square plot and mixed to a depth of 30 cm using an RTR2548 rototiller (Land Pride, Assaria, KS, USA) just before planting.

2.2. Planting, Plot Maintenance, and Harvesting

The carrot was seeded at a rate of 640,000 seeds/ha using MasterMacc planter (Market Farm Implement, Friedens, PA, USA). Weed control was a combination of hand-weeding as needed and standard herbicides recommended for carrots [35]. Plots were irrigated with sprinkler irrigation system set for one hour every day until the carrots emerged and for 4 h as required after carrot emergence.
Experiments were completed at 132 days after planting (DAP) in 2012 and 133 DAP in 2013 and 2014 growing seasons. Carrots were harvested from the center two rows using spading fork (True Temper, AMES companies, Inc., Camp Hill, PA, USA), washed with a garden hose, counted, and graded as marketable and unmarketable categories following USDA standards [37].

2.3. Soil Sampling and Analyses

In 2012, 2013 and 2014, six soil cores per plot were collected at 0–25 cm soil depth in the center two rows using a 5-cm diameter sampling core (AMES companies, Inc., Camp Hill, PA, USA) at planting (May) and at harvest (October). The soil from the six cores was thoroughly mixed to form a composite of approximately 1 L, transported to the laboratory and stored in a cold room at 5 °C [35]. In the laboratory, each composite sample was thoroughly mixed by hand and pieces of rocks removed. Using a glass beaker, two separate 100 mL sub-samples were taken for soil analysis and nematode extraction. Soil pH and SOM were determined from 2012 and 2013 samples by the MSU Soil and Plant Nutrient Laboratory using standard procedures [38,39]. The SOM was determined following the Destjareft method [38] and soil pH was measured by the water method [39].

2.4. Nematode Extraction, Identification and Enumeration

Nematodes were extracted from 100 mL of soil using a semiautomatic elutriator [40] and fixed in double TAF solution (14 mL 40% formalin: 4 mL tri-ethanolamine: 91 mL distilled water) and enumerated as described in Melakeberhan et al. [41]. Nematodes were identified under inverted microscope (Accu-scope Inc., Commack, NY, USA) at 400X magnification at genus level following diagnostic keys by Bongers [42] and the University of Nebraska Lincoln nematode identification website (http://nematode.unl.edu/konzlistbutt.htm, accessed on 1 June 2012). Each nematode was assigned to a c-p scale according to Bongers and Bongers [16].

2.5. Integrating WAFG to the IPE Model

It is well established that: (a) optimal soil health conditions should contain diverse organisms, (b) nematodes are a key indicator of belowground biophysicochemical changes, and c) APs have direct and/or indirect disturbance effect on the organisms in that environment [5,16,17,25,26]. In order to improve the use of nematodes as an indicator of soil health, their abundance and functions need to be considered simultaneously. Unfortunately, there are no specific and quantitative soil health values associated with (a) either nematode trophic and/or c-p group abundance or (b) function, and (c) the only weighted functions available are those proposed by Ferris et al. for c-p 2 to c-p 5 [17]. There is no weighted value for c-p 1. Our WAFG overcomes these challenges by introducing a new value for c-p 1 and accounting for all of the c-p and trophic group abundance of bacterivore, fungivore, omnivore and predator nematodes. This generates a value for all of the nematodes present in a given treatment.
Most of the current agroecosystems are disturbed and it is known that fast reproducing organisms such as c-p 1 nematodes can thrive in disturbed ecosystems better than higher c-p groups. This makes c-p 1 group of nematodes an important part of achieving sustainable soil health because they are an indicator of the extreme ends of disturbed as well as enriched ecosystems. Against this background, we adopted the Ferris et al. 2001 functional weighting values for c-p 2 to c-p 5 and propose a new weighting for c-p 1 in this study. Briefly, the Ferris et al. [17] weighting system recognizes disturbance and it is based on the concept that the trophic links (l) increase as a constant fraction of square of the number of species (s) and is calculated as:
Trophic links (l) = αs2
where α is constant and s is the number of species. Based on the available data, the formula for weighted of c-p values is:
c-p value weight = 0.8 × (0.5 × (n + 1))2
where α is 0.8, n is the c-p value and “0.5” is a fraction of increase in food web complexity with each increment in c-p class [17]. The values of n for c-p 2, c-p 3, c-p 4 and c-p 5 are 1, 2, 3, and 4, respectively [17]. Based on Equation (2), the weights for c-p 2, c-p 3, c-p 4, and c-p 5 are 0.8, 1.8, 3.2 and 5, respectively. We used these weighted values for c-p 2 to c-p 5 of all of the non-herbivore trophic groups present in a sample. To integrate WAFG for each treatment, the total numbers (TN) of each c-p group was calculated as follows:
WAFG = (0.8 × TN c-p 2) + (1.8 × TN c-p 3) + (3.2 × TN c-p 4) + (5 × TN c-p 5)
For c-p 1 nematodes, a group that is highly adaptable to disturbance, we introduce a new value following the trajectory established for c-p 2 to c-p 5 as described in Equation (2). i.e., the c-p value, n, is what changes within the equation to get the values for the different c-p groups. In our current knowledge base, there is no lower c-p values than 1. In order to keep the trajectory within the established n values of 1, 2, 3, and 4, for c-p 2, c-p 3, c-p 4 and c-p 5, respectively [17], we assigned an n value of ‘0′ for c-p 1, leading to the following equation:
c-p 1 weight = 0.8 × (0.5 × (0 + 1))2 = 0.2
Thus, we have calculated the WAFG for each treatment as follows:
WAFG = (0.2 × TN c-p 1) + (0.8 × TN c-p 2) + (1.8 × TN c-p 3) +(3.2 × TN c-p 4) + (5 × TN c-p 5)
The weight of 0.2 for c-p 1 nematodes is within the established trajectory and consistent with the assumption that the food web in healthy soils will contain all the nematode functional guilds [16,17].

2.6. Testing WAFG to Assess Integrated Efficiency Using the IPE Model

The IPE model identifies best-to-worst-case scenarios for sustainability by comparing outcomes on the same relative scale. This requires expressing the data of measured variables as a percent of untreated control basis. In this case, the data for WAFG and SHIs (SOM, pH or yield in this study) are expressed as a percent of control as follows [33]:
WAFG = 100 × (average WAFG of each treatment/average WAFG of control)
SHI (SOM, pH or yield) = 100 × (average SOM, pH or yield in each treatment/average SOM, pH or yield for control)
Plotting the SHI (yield or soil physiochemistry, y-axis) against WAFG (x-axis) reveals IPE outcomes in four quadrants from best-to-worst-case scenarios for WAFG, SHI and soil health management (Figure 2). In this example, we interpret change in WAFG as change in soil health and how these changes relate to SHIs leads to identifying sustainability of total outcome. The 100% data point on the y- and x-axis represents controls for SHI and WAFG, respectively. A best-case scenario and a sustainable soil health outcome is where data for WAFG and SHI are in Quadrant B. A worst-case scenario and an unsustainable soil health outcome is to see WAFG and SHI data in Quadrant C. Data points falling in Quadrant A would indicate an increase in SHI and the need to improve WAFG in order to get to a sustainable soil health outcome. Data points falling in Quadrant D would indicate an increase in WAFG and the need to improve SHI in order to achieve sustainable soil health.

2.7. Statistical Analysis

Data were analyzed by standard mean separation to show differences among treatments as well as differences within a quadrant when fitted to the IPE model. Trophic group level abundance only, and soil pH and carrot yield data and SOM were published in Habteweld et al. [35]. In this study, total abundance of nematode trophic- and c-p-groups of all nematodes in a sample were processed as described in Equation (5) (WAFG) and converted on a percent control basis as described in Equation (6). The data were then subjected to analysis of variance (ANOVA) and standard mean separation as described in SAS OnlineDoc 9.3 [43]. Similarly, the soil pH, soil SOM, and carrot yield parameters were expressed on percent control basis as described in Equation (7) and subjected to mean separation analysis.
The use of the IPE model does not imply that comparing treatment means are not needed, but mean separation by itself cannot tell if the outcome is sustainable or not. Visualizing the data in the IPE model (Figure 2) indicates sustainability of the outcomes. In order to determine treatment differences within a quadrant, statistical differences among treatments from the control (100%) on the x-axis and y-axis in the IPE model were tested using non-parametric one-tail t-test at α = 0.05. The means of the treatments with statistical difference from 100% are noted by asterisks (*).

3. Results

3.1. Data Organization

The WAFG expressed as a percent of untreated control and subjected to standard ANOVA and mean separation is presented in Table 1 and those of SOM, soil pH, and carrot growth and quality are presented in Tables S1–S4. The relationships between SOM, soil pH, or carrot yield and quality (y-axis) against the WAFG (x-axis) fitted to the IPE model are presented in Figure 3, Figure 4, Figure 5 and Figure 6. Because the WAFG is the x-axis against the SHI outcomes (y-axis), changes in WAFG values relative to the IPE model are described within each parameter.

3.2. Effect of the Compost Treatments on WAFG Prior to Expressing as Percent of Control

The WAFG was significantly higher at 0 DAP in PC at 135 kg N/ha compared with other treatments in 2012 (Table 1). In 2013, PC at 135 kg N/ha significantly increased WAFG at 132 DAP compared with 0 DAP. In 2012, PC at 203 kg N/ha significantly increased WAFG in all of the sampling times compared with 0 DAP. In 2013 and 2014, PC at 270 kg N/ha significantly increased WAFG at 133 DAP compared with 0 DAP. In 2013 and 2014, all AC treatments significantly increased WAFG at 133 DAP compared with 0 DAP. Urea did not affect WAFG in all of the sampling times. In 2012, AC at 270 kg N/ha significantly increased WAFG compared with urea at 132 DAP. In 2013, AC at 135 and 270 kg N/ha significantly increased WAFG at 133 DAP compared with urea. In 2014, PC at 203, and AC at 135 and 270 kg N/ha significantly increased WAFG compared with PC at 270 kg N/ha and urea at 133 DAP.

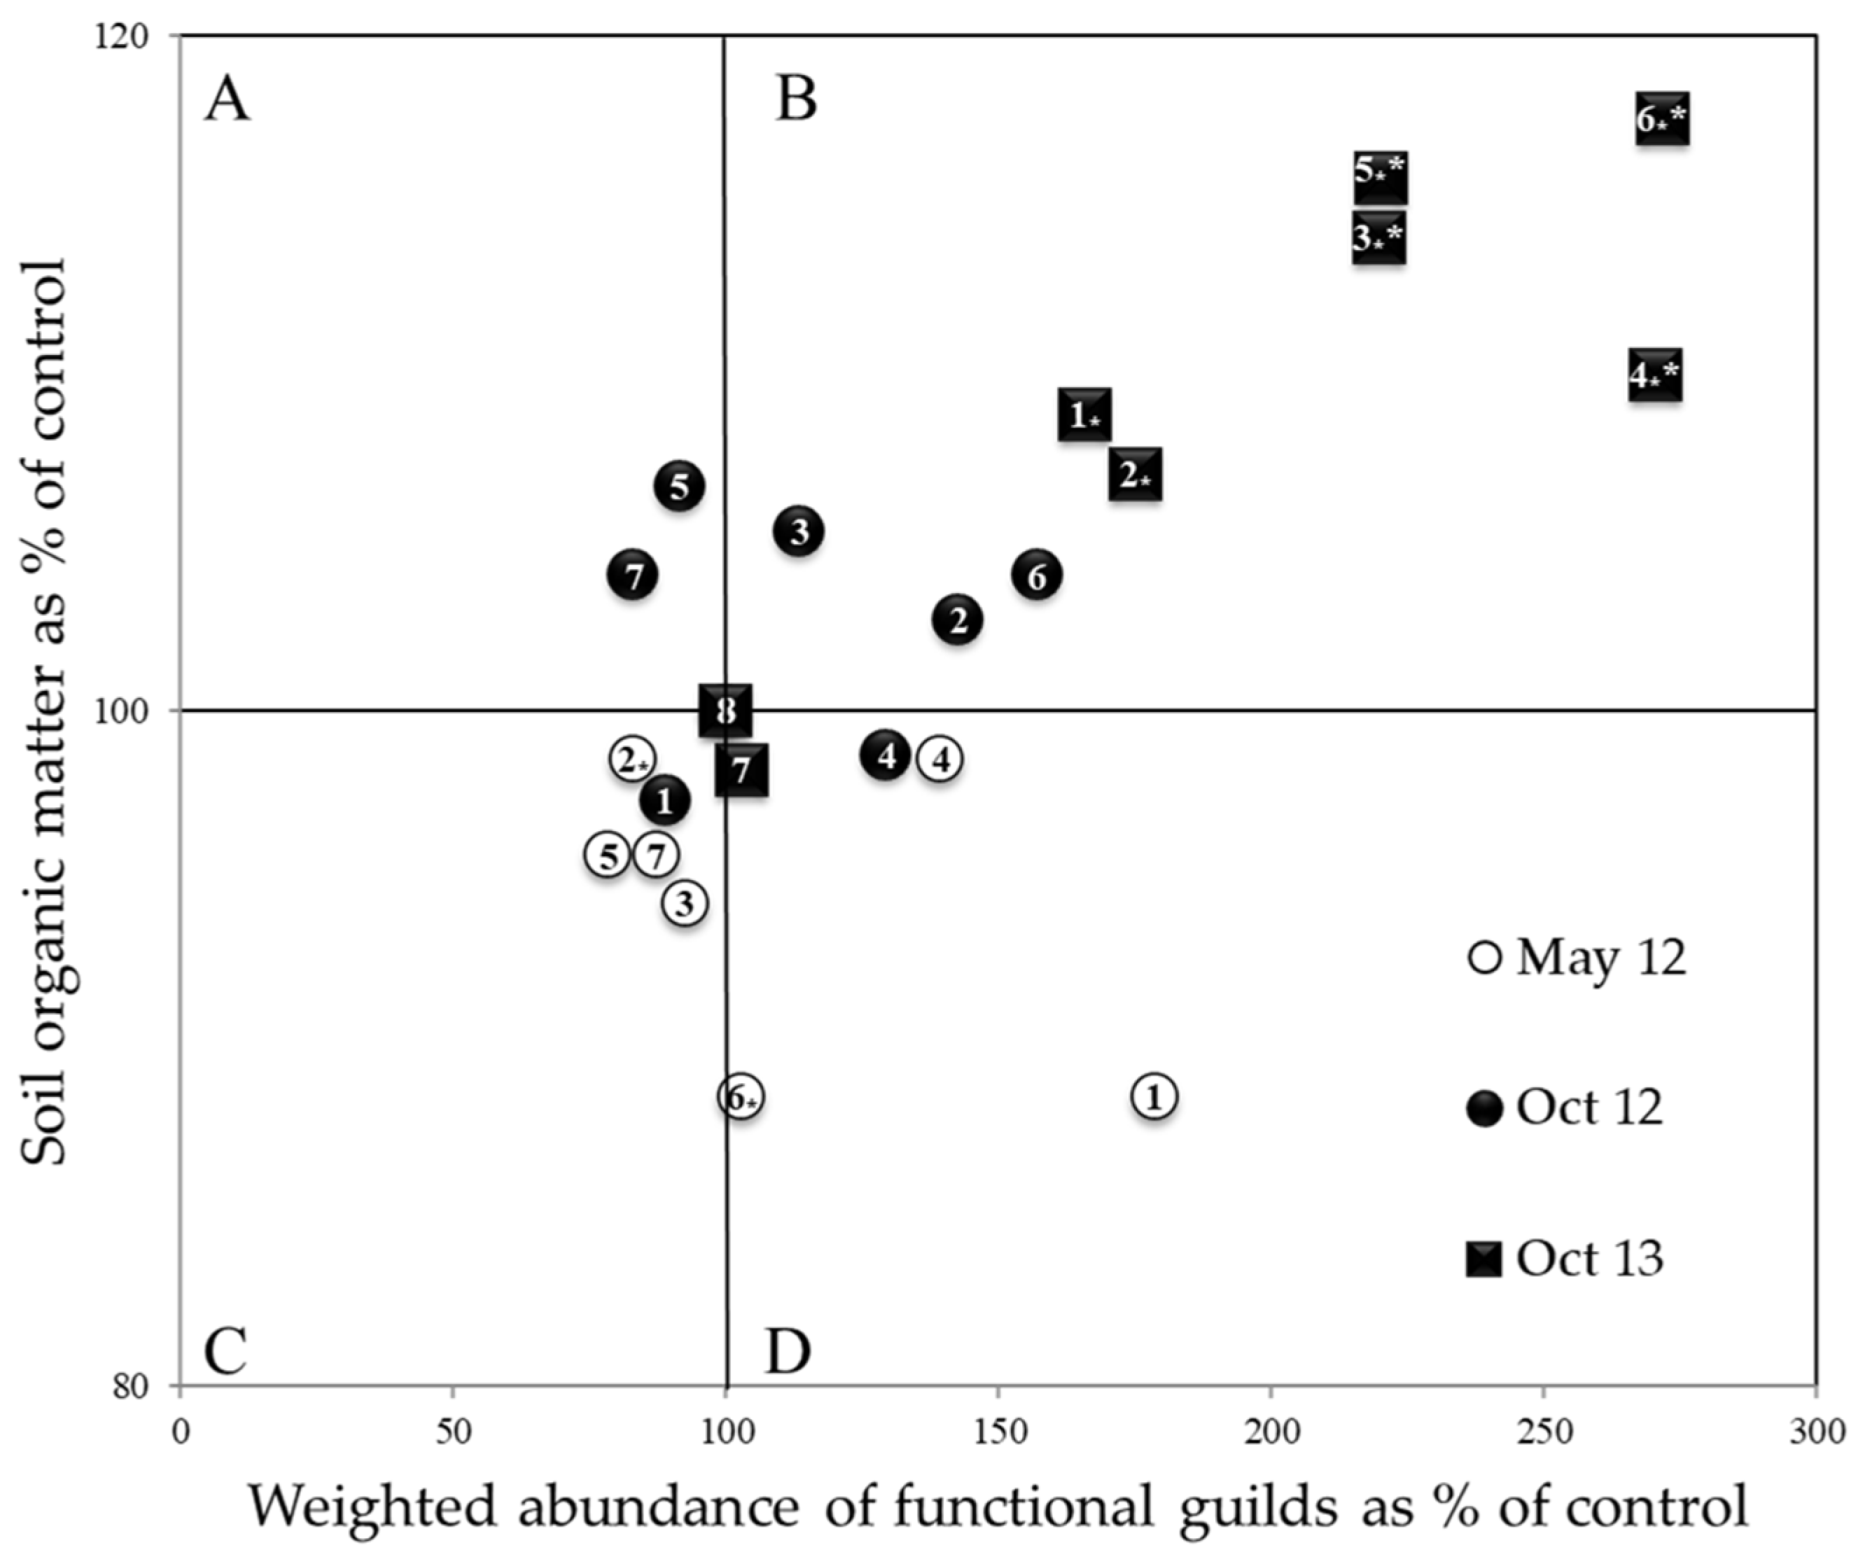
3.3. Effect of Compost Treatments on SOM Expressed as a Percent of Control

All compost treatments significantly increased SOM over time (Table S1). In 2013, PC at 270 kg N/ha and all of the AC treatments significantly increased SOM compared to urea at 133 DAP. The same data fitted into the IPE model showed that compost treatment increased both nematodes and SOM over time, with data points falling in Quadrant B and significantly different from the controls (Figure 3). Data points for urea and the control remained at or below the control (100%) level (Figure 3).

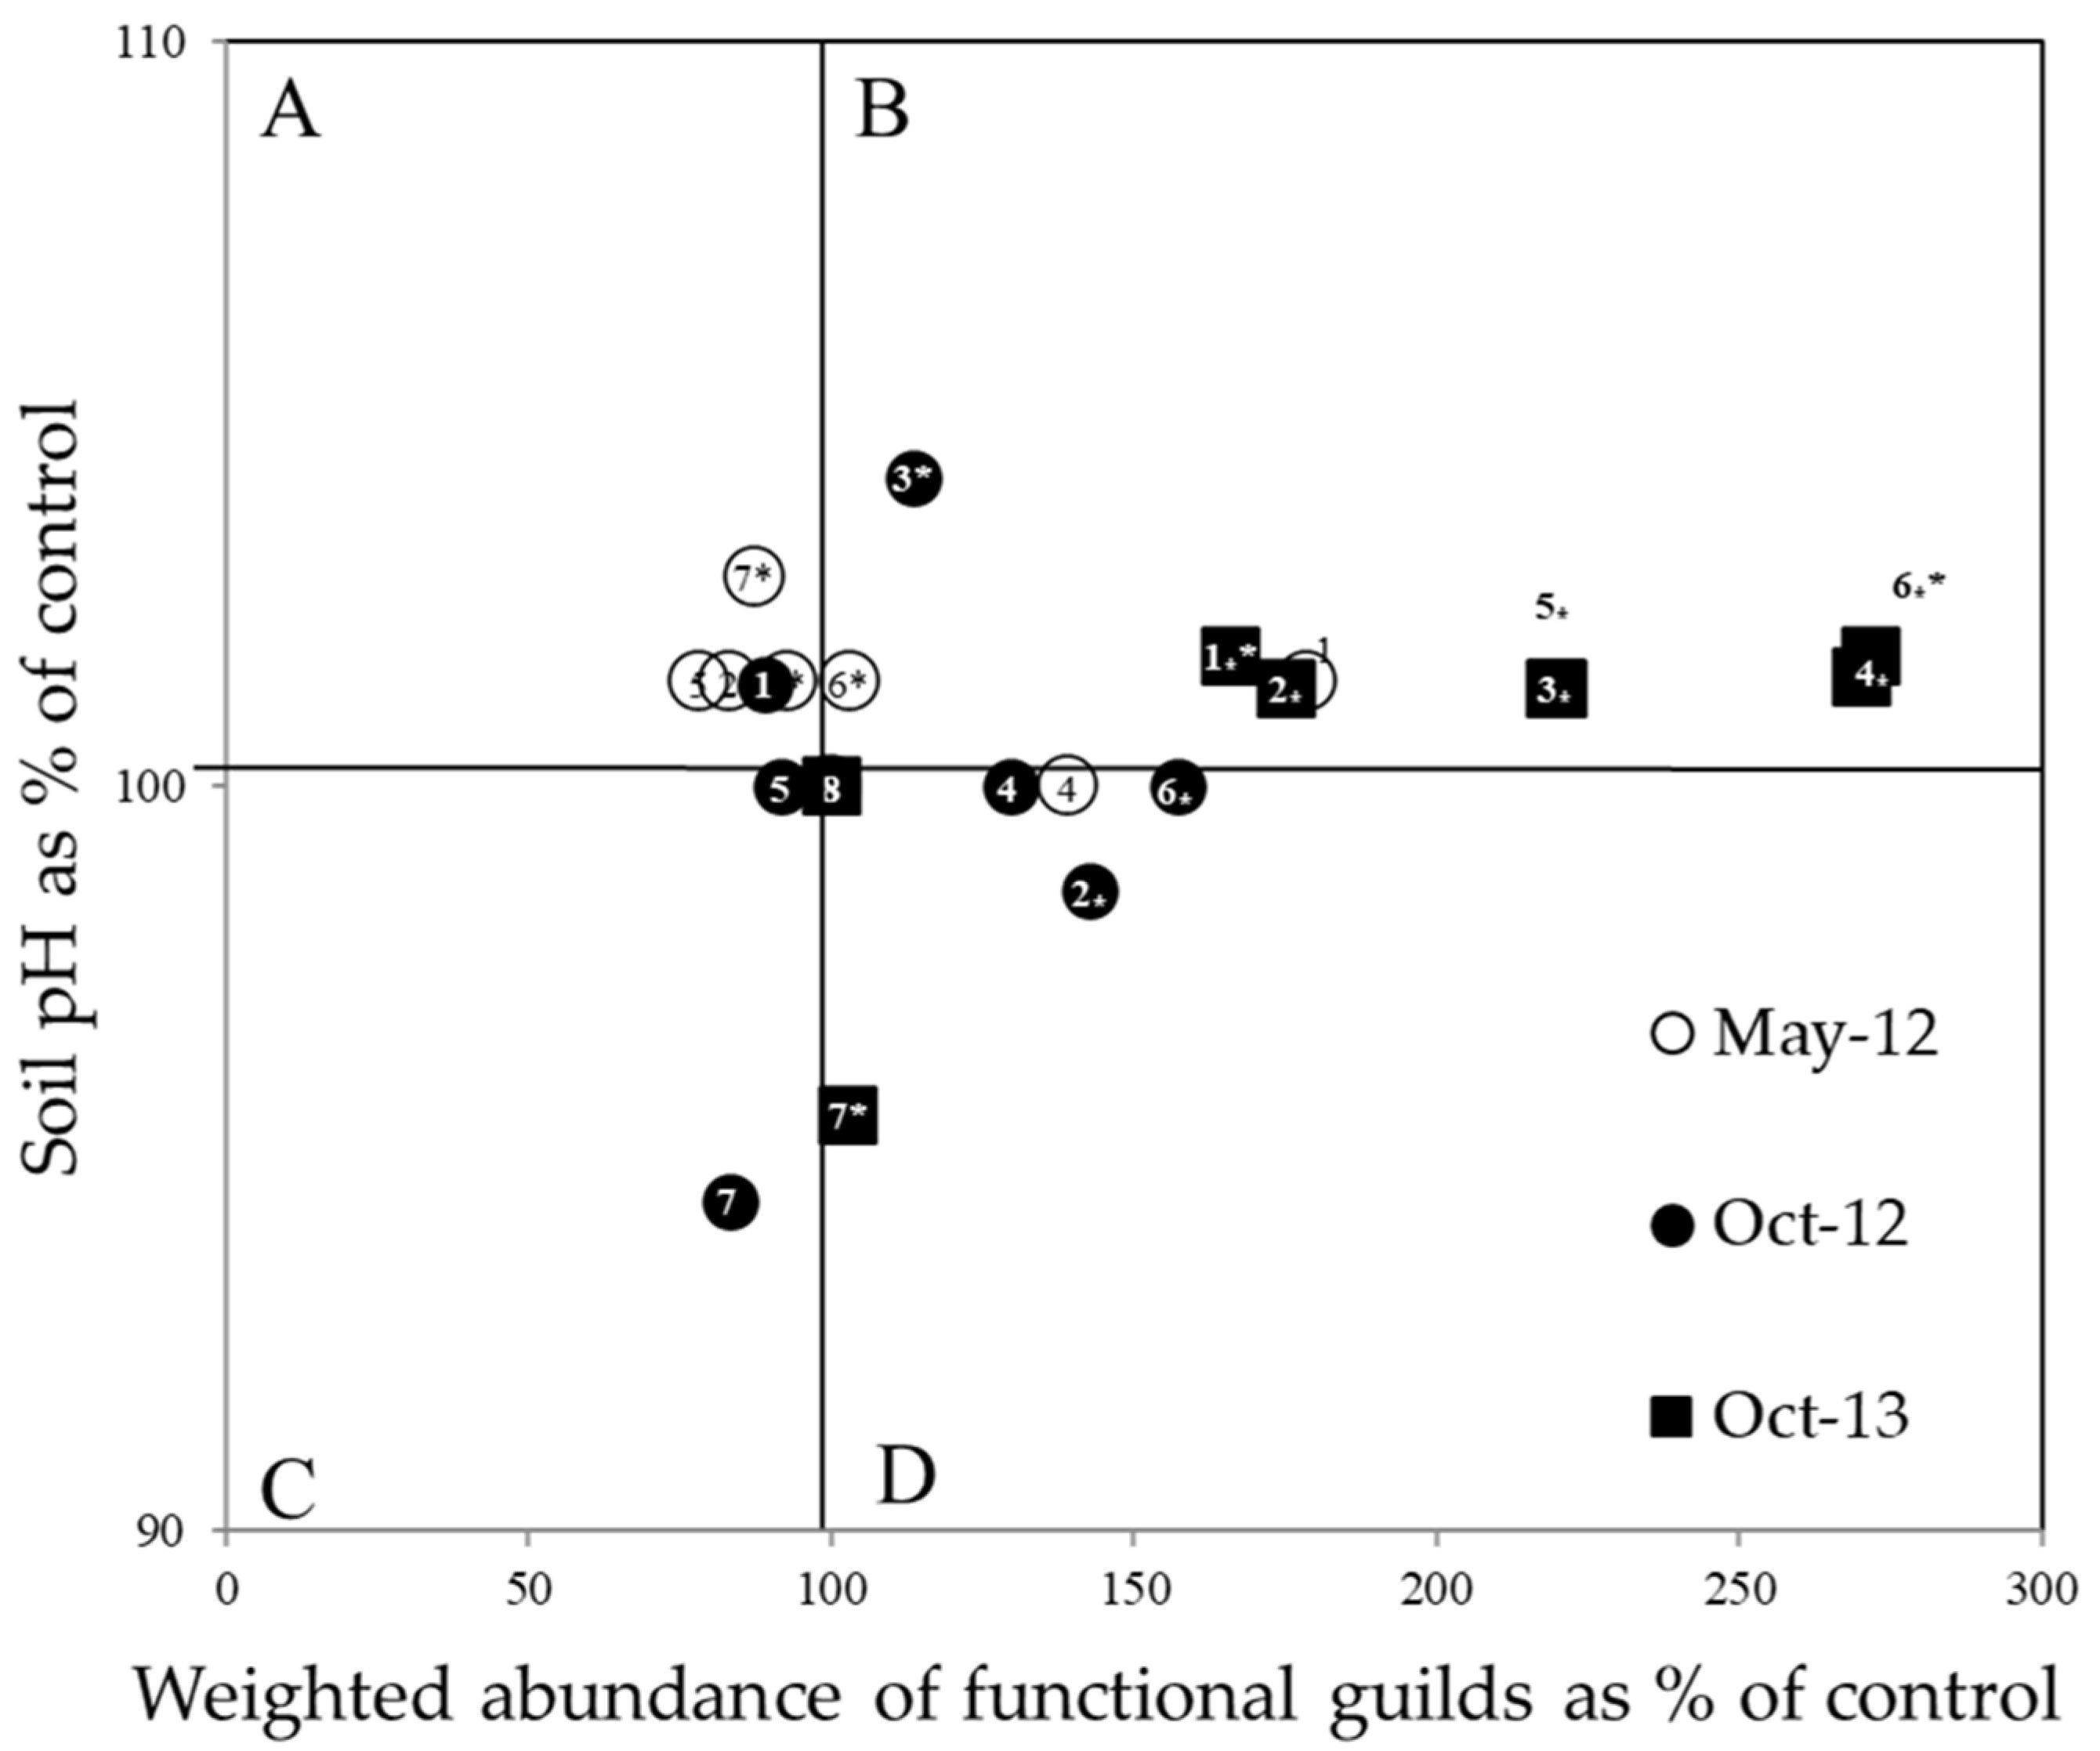
3.4. Effect of Compost Treatments on Soil pH Expressed as a Percent of Control

Urea significantly decreased soil pH compared to all of the compost treatments at 132 and 133 DAP in 2012 and 2013, respectively (Table S2). When fitted to the IPE model, data points for almost all of the compost treatments significantly increased soil pH while urea treatment significantly decreased it at harvest in 2013 compared with the control (Figure 4). The data points moved from Quadrant A to Quadrant B for the compost treatments with time; whereas, those of urea decreased soil pH and WAFG.

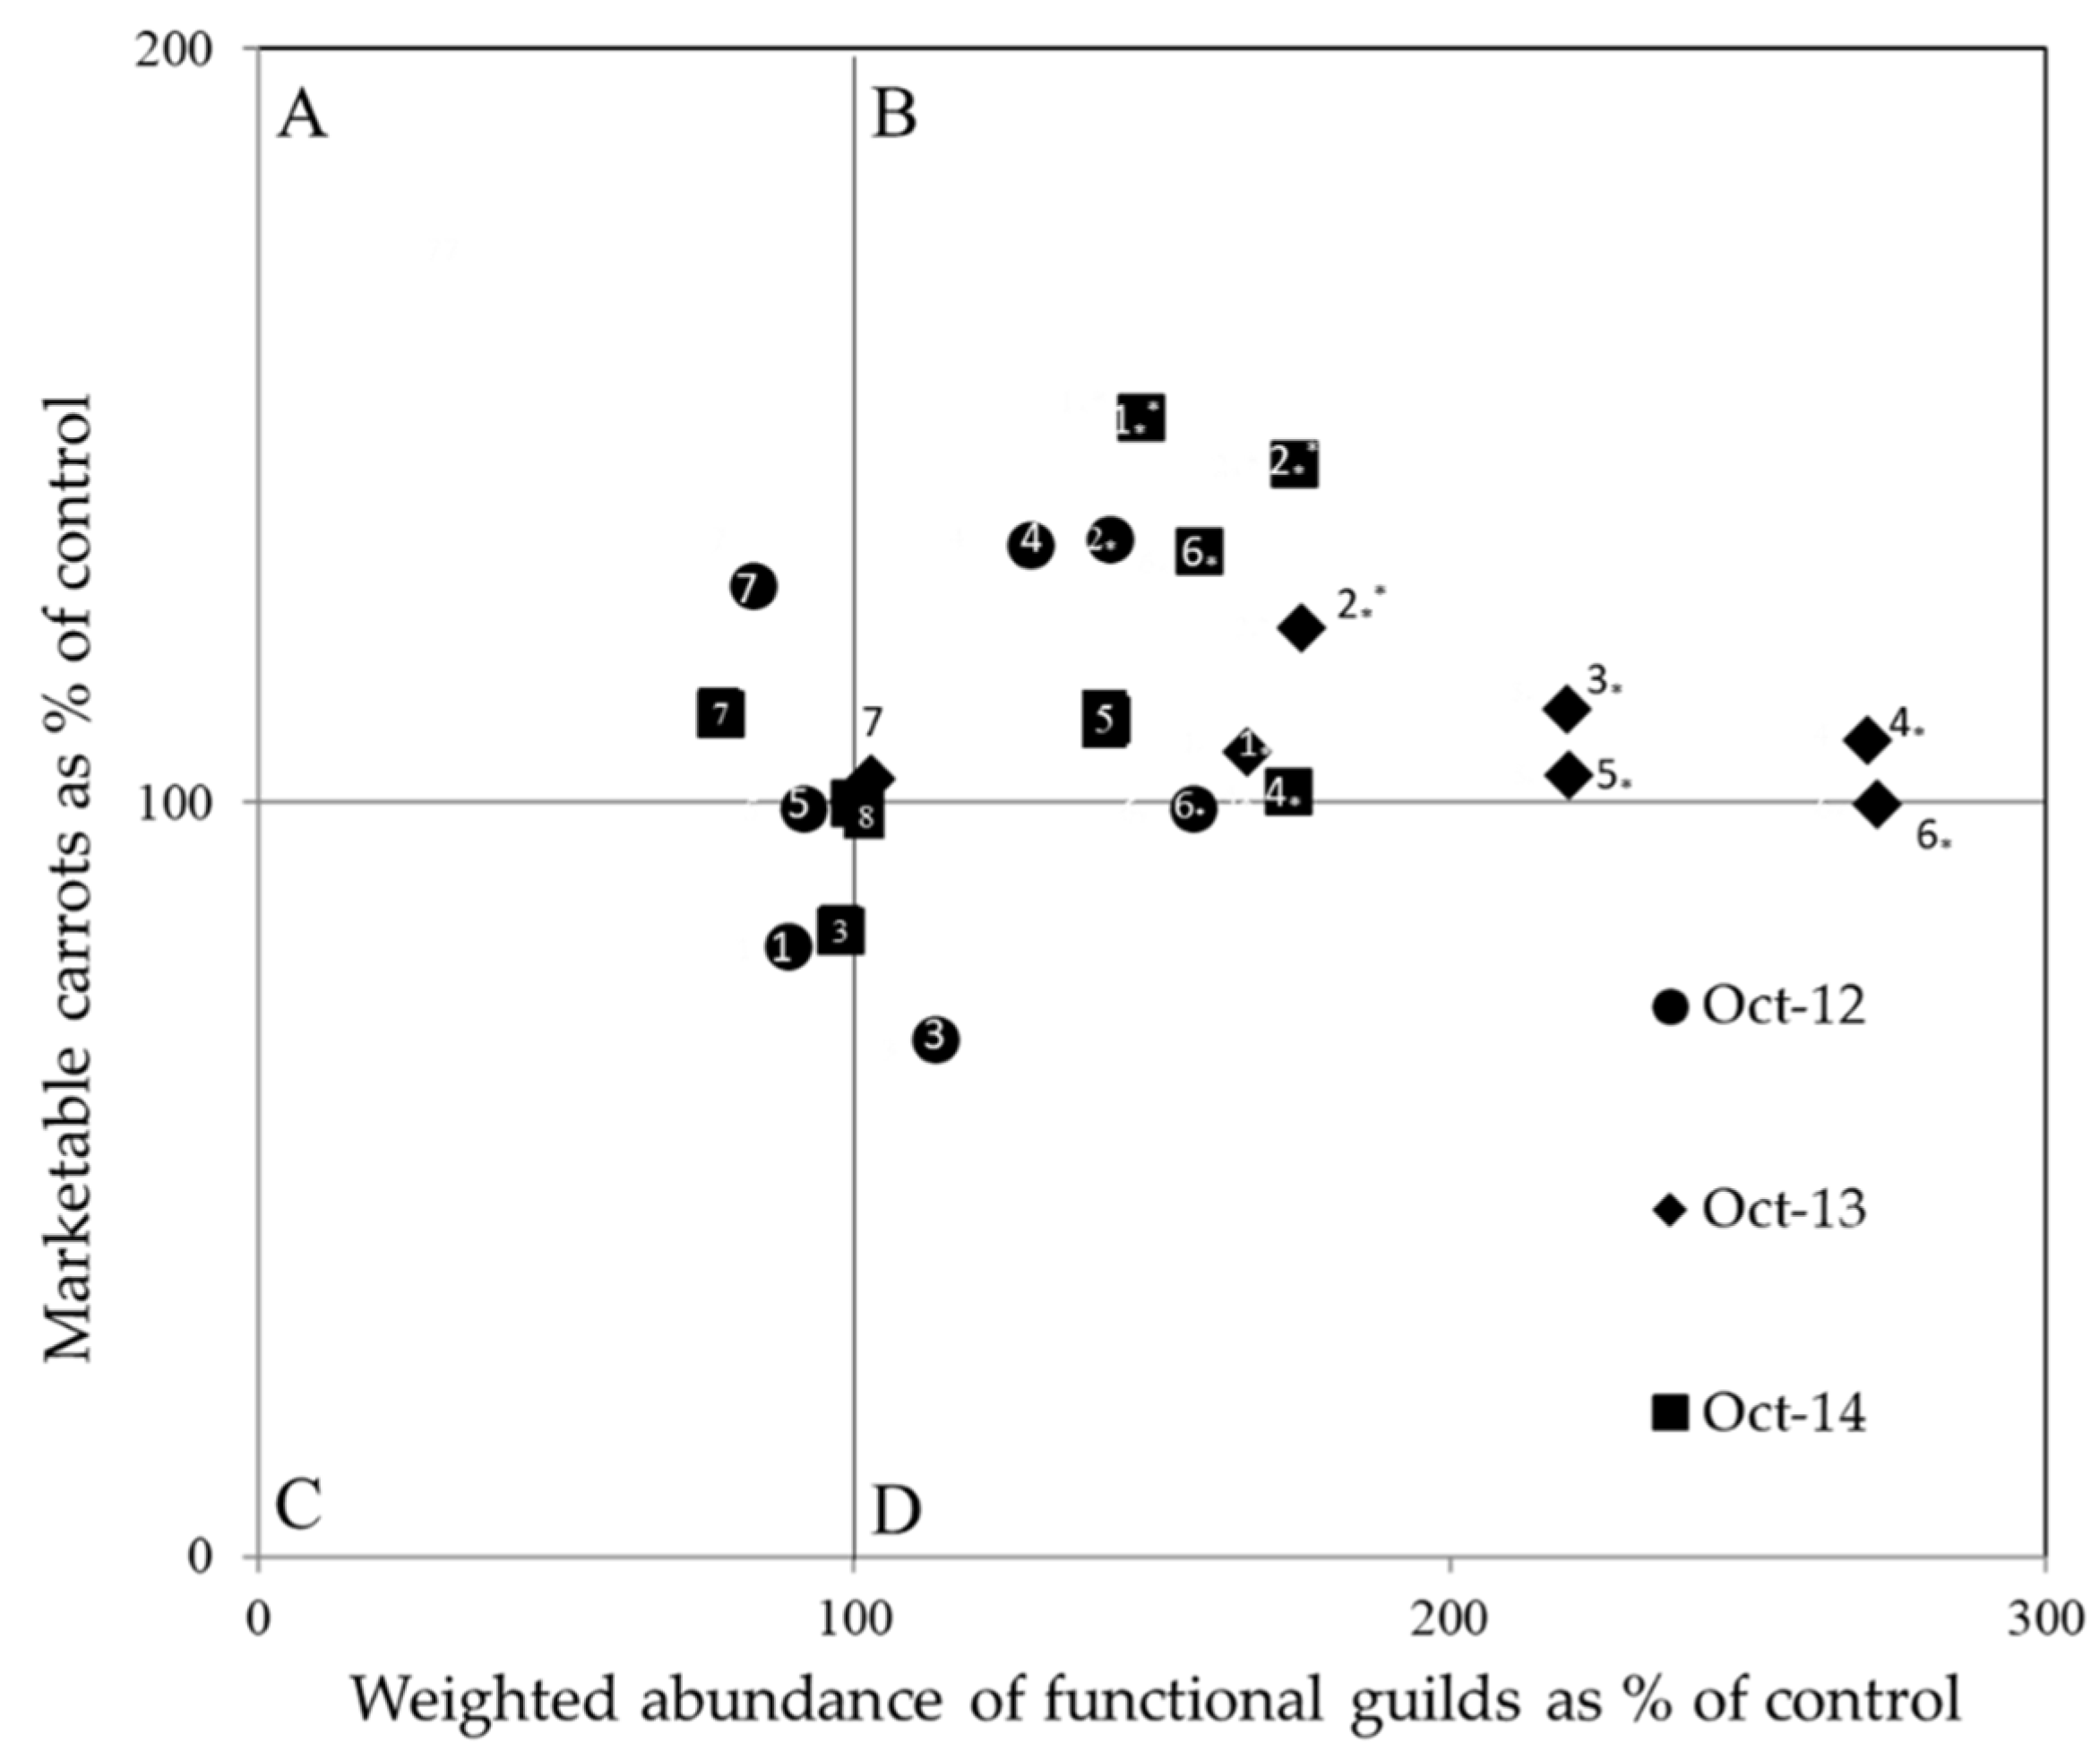
3.5. Effect of Compost Treatments on Marketable Yield Expressed as a Percent of Control

The PC treatment at 135 kg N/ha significantly increased marketable carrot yield overtime. There was no significant difference in marketable carrot yield among the treatments across the years (Table S3). Fitting the data to IPE model showed the majority of the data points for marketable yield and WAFG in Quadrant B and improved over time (Figure 5). Almost all of the compost treatments significantly increased both parameters from the controls (Figure 5).

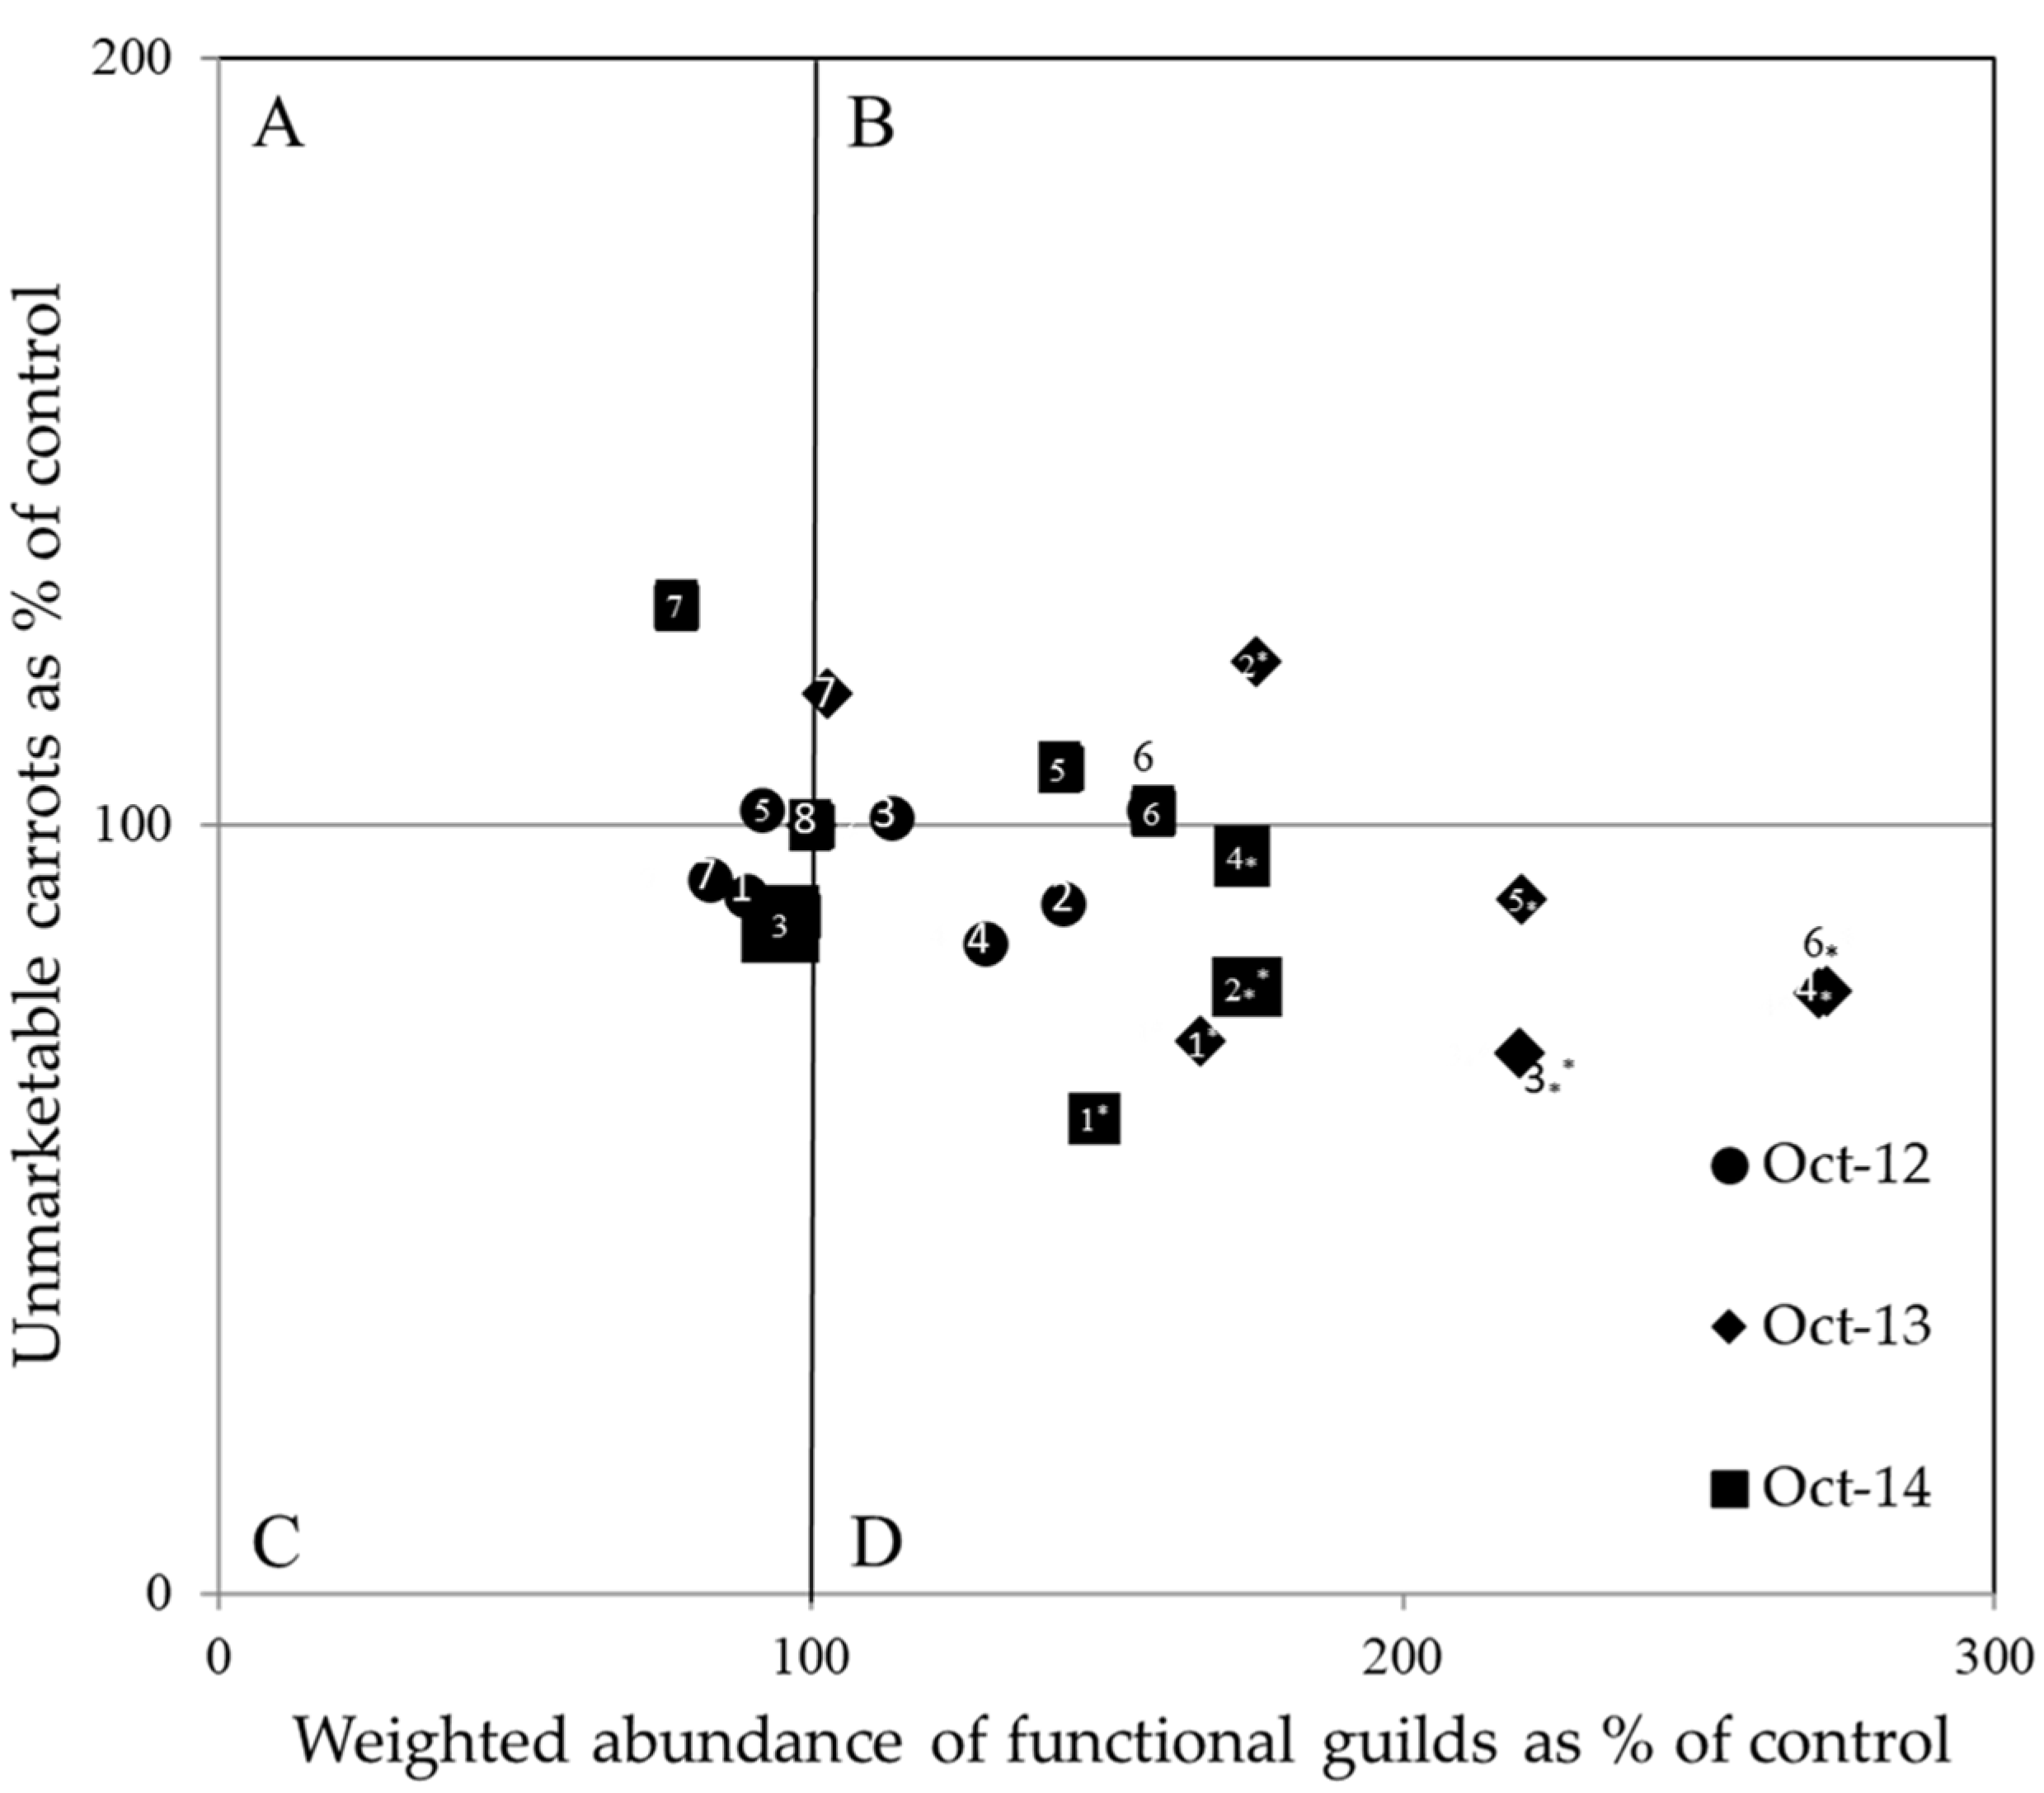
3.6. Effect of Compost Treatments on Unmarketable Yield Expressed as a Percent of Control

Unmarketable yield was significantly higher in urea compared with PC and AC treatments at 135 and 270 kg N/ha in 2013 (Table S4). In 2014, urea significantly increased unmarketable carrot yield compared with all PC treatments and AC at 135 kg N/ha. In the IPE model, the majority of the data points fell in Quadrant D where WAFG increased and unmarketable yield decreased with time and more so in higher AC and PC amendments (Figure 6).

4. Discussion

4.1. Significance of the WAFG to the IPE Model

Bacterivore, fungivore, omnivore and predator nematodes are key drivers of the soil nutrient cycling process and excellent indicators of ecosystem changes in the soil environment [5,16,17,25,26]. However, the lack of specific and quantitative soil health values associated with either nematode c-p and/or trophic group abundance and function has been a major limitation in identifying and developing sustainable soil health outcomes. The WAFG that we have described herein bridges the gap by introducing a weighting system that accounts for abundance and function of bacterivore, fungivore, omnivore and predator nematodes at the trophic and c-p group levels. It does so with the assumption that a common thread of the same c-p groups of bacterivore, fungivore, omnivore and predator nematodes that inhabit the same environment are affected similarly by the conditions in that environment. Our WAFG weighting system introduces a new guild weight of 0.2 for c-p 1 nematodes and integrates the established values of 0.8, 1.8, 3.2 and 5 for c-p 2, c-p 3, c-p 4, and c-p 5 nematodes, respectively [17]. The fact that the new value for the c-p 1 nematodes is within the established trajectory for c-p 2 to c-p 5 nematodes shows that our assumption was reasonable.
The new guild weight for c-p 1 nematodes is significant when accounting for the role of the different c-p groups within a trophic group and across trophic groups in identifying and developing sustainable soil health outcomes. For example, c-p 1, c-p 2, c-p 3, and c-p 4 bacterivore nematodes feed on bacteria, but each group has significant roles in their niche and environmental tolerance [15]. The c-p 1 and c-p 2 nematodes (r-selected) indicate stressed environments while c-p 3 and c-p 4 nematodes (k-selected) indicate relatively stable environments [44]. The k-selected nematodes are likely to indicate that the SFW is at or moving towards stable and desirable soil health conditions-Quadrant B (Figure 2). There are several scenarios where the value for c-p 1 nematodes could influence soil health management decision-making. For example, the outcome could be low c-p 1 to c-p 5 groups, an indication of a highly disturbed system negatively affecting all c-p groups (Quadrant C), and the 0.2 weight for c-p 1 may not affect WAFG values. On the other hand, an outcome of high c-p 1 to c-p 5 groups would indicate an enriched (Quadrant A) and healthy system (Quadrant B). In this case, the weight of c-p 1 nematodes might affect the WAFG values. There could be outcomes that favors c-p 1 (Quadrants A and C), but not higher c-p groups (Quadrants B and D), or vice versa. In each of these scenarios, c-p 1 nematodes will be an indicator of changes in nematode community structure in response to an AP and developing IPE footprints.
It is well documented that a healthy soil should have a balance of biological, physicochemical, nutritional, structural and water holding integrity [7,8,9]. However, the biophysicochemical process-driven SHIs such as soil pH, SOM, yield and nematode population dynamics are difficult to integrate [1,5,6,35,44,45,46,47,48,49,50,51,52,53]. There are no specific and quantitative values or framework to integrate the indicators in ways that will lead to identifying and developing sustainable soil health. By generating a value for the total of bacterivore, fungivore, omnivore and predator nematode assemblage with the WAFG, this study makes it possible to relate nematode numbers and functions to soil health conditions. Concurrent analyses of relative changes in WAFG and in SHI (SOM, pH or yield) into IPE model has led to a framework where best-to-worst case outcomes for sustainable soil health can be identified (Figure 2).

4.2. The Advantages of the IPE Concept in Assessing Soil Health Indicators

Discipline-centered analysis of efficiency (Section 1.2) and variable outcomes are among the major challenges to integrating different SHIs and creating a framework towards identifying soil health from a single core of soil [3,29,30,31,44]. This proposed IPE model bridges the challenges by simultaneous analysis of WAFG profile (x-axis) and SHIs (y-axis) and identifying if an outcome is hazardous and wasteful that should be discarded (Quadrant C), requires specific complementary actions (Quadrants A and D), or it is sustainable (Quadrant B, Figure 3, Figure 4, Figure 5 and Figure 6). This is different from identifying whether or not there was a treatment effect or if any given treatments were positively or inversely correlated in matrix tests [1,5,6,35,41,45,46,47,48,49,50,51,52,53].
An AP resulting in variable soil health outcomes is a common challenge [1,5,6,35,45,46,47,48,49,50,51,52,53]. The IPE model has unique attributes in sorting out of variable outcomes. For example, data points falling in all four quadrants of the SHIs (Figure 3, Figure 4, Figure 5 and Figure 6) is similar to what is known about variable outcomes when the SHIs are measured separately. The IPE separates the variabilities into categories that lead to solutions. For example, most of the compost amendments resulting SOM, pH and marketable yield data in Quadrant B (Figure 3, Figure 4 and Figure 5) and unmarketable yield in Quadrant D (Figure 6) shows potentially sustainable conditions. Knowing that SOM, pH and marketable yield data points from the untreated control and urea mostly falling the in either Quadrants A, C or D and unmarketable yield in Quadrants A, B or C shows what will be needed to get to sustainable outcomes.
All data points within a quadrant do not have the same value and their positions in that quadrant may change over time. For example, the improved performance of the 1.5× and 2× AC and PC amendments over time suggests that either repeated applications and/or longer time for decomposition may be needed to see significant changes in the outcomes (Figure 3, Figure 4, Figure 5 and Figure 6). Another unique attribute of the IPE model is identifying maximum outcome possible within the best-case scenario Quadrant. Depending on how the data points align relative to the WAFG profile (x-axis) and SHI parameters (y-axis), the outcomes could be widely separated (Figure 3, Figure 4, Figure 5 and Figure 6). i.e., the further away from either axis’s center data point (100%), the more efficient the outcome is. In this study, all of the AC treatments and PC at 270 kg N/ha treatments had statistically significant integrated efficiency outcomes across the SHIs. Thus, enabling a selection of the best treatments within the best outcome category.

4.3. Comparison between Mean Separation and the IPE Model

While it is difficult to make comparison of outcomes from different experimental conditions, many studies have shown variable effects of compost or other soil amendments on nematodes, yield and soil conditions [3,29,30,31,44,45,46]. The same data sets in Figure 3, Figure 4, Figure 5 and Figure 6 analyzed using mean separation showed similar variable outcomes by treatment, time and/or both (Tables S1–S4). This makes it difficult to draw conclusions on sustainable outcomes. When treatment outcomes are not statistically different, the likely conclusion is to change treatments. Where the results show significant improvement in SOM, pH and/or carrot yield, the likely conclusion is to keep using the specific AC and PC treatments. There will be circumstances where such positive results will be obtained for some time for one or more of the SHIs, but it is unknown if the outcomes will meet agrobiological, economic and environmental expectations of sustainability. Where the results vary by treatment and/or SHI parameter in time and space as shown in Tables S1–S4, sorting out the variable results to determine which interactions should be discarded and/or adopted, and which meet the sustainability expectations is difficult. The IPE model is a decision-making tool with unique features of sorting out variable outcomes.
A comparison of the same data sets analyzed using mean separation (Tables S1–S4) and IPE analysis (Figure 3, Figure 4, Figure 5 and Figure 6) shows the simplicity of the latter in drawing definitive conclusions. For example, IPE model was able to identify all of the AC treatments and PC at 2× treatments had the best integrated efficiency outcomes for sustainability across the SHIs out of the variable data in Tables S1–S4. Without the IPE model, the best-case scenarios of results in the tables presented herein could have not been detected and the practices that would lead to further soil degradations would continue.

4.4. Similarities and Differences between the IPE Model and FUE and SFW Models

The use of nematodes as indicators of sustainable soil health is likely to increase with time. Thus, it is important to recognize how the SFW, FUE and IPE models are used to understand physicochemical process-based outcomes and management decisions that the models elicit. These models use beneficial nematode community analyses-based quadrants drawn from different concepts to sort out complex biophysicochemical process-based outcomes into practical application. The FUE model quantifies nematodes at trophic level only [33] while the SFW [17] and the IPE models include c-p groups. The SFW model has a 0 to 100 scale and FUE and IPE models start at 0, but they have no upper limit. The 50% on the SFW and 100% on the FUE and IPE models are the cut off boundaries of the four quadrants. The SFW uses the relationship between structure (x-axis) and enrichment (y-axis) to describe outcomes of a treatment or an AP from best-to-worst-case scenarios for agroecosystem fitness and nutrient cycling [17]. The SFW model’s attributes have been related to soil health conditions [9,27]. The FUE model relates changes in nematode community (x-axis) and ecosystem service (y-axis) expressed as a percent of control to identify soil health outcomes from best-to-worst-case scenarios for sustainability [33]. The FUE model enables soil health management decisions without understanding the processes that led to the outcomes. The FUE model requires basic identification of nematodes at the trophic group level that most diagnostic laboratories use to make management recommendations. The IPE model applies the same concepts as the FUE mode to identify soil health outcomes from best-to-worst-case scenarios for sustainability, but at a much deeper level that accounts for nematode functions. The IPE model advances our knowledge base towards the long-term goal of developing footprints for sustainable soil health management from a single core of soil. While the IPE model may be nematode community analysis based and used a small number of biophysicochemical process-driven SHIs (SOM, pH and crop yield) that the USDA/NRCS maintains an up-to-date list [https://www.nrcs.usda.gov/wps/portal/nrcs/detail/soils/health/assessment/?cid=stelprdb1237387, accessed on 11 February 2022], it has broad disciplinary- and cross-disciplinary applications.

4.5. Potential of the IPE Model as an Integration Platform for More Soil Health Indicators

With global fertilizer use expected to exceed 200 million metric tons per year in 2022 [54], agriculture’s large footprint on nitrous oxide (N2O) and other greenhouse gas (GHG) emissions, eutrophication of waterways and harmful algal blooms [55] and soil health degradation [9] is unlikely to decline. For example, and despite the advances in the 4R principles based nutrient management [56], overfertilization in low- and variable-yielding corn and soybean production areas of the US Midwest result in ~$485 loss to growers and 6.8 MMT carbon dioxide equivalent in GHG emissions to the environment [57]. Soil health degradation continues because of lack of integrated (a) understanding of the biophysicochemical process-driven SHIs and (b) decision-making tools that separate the outcomes into sustainable, unsustainable and what needs to be added to be sustainable bottlenecks [9]. This WAFG-based IPE model creates a framework for incorporating different biophysicochemical process-driven SHIs in ways that will lead to identifying soil health conditions from a single core of soil.
By identifying soil amendment treatments with the best integrated efficiency outcomes for sustainability across the SHIs, the IPE model creates a framework where other SHIs could be integrated. For example, nematodes contribute to the outcomes of biophysicochemical process-driven SHIs by feeding on or being food for other organisms within the SFW. In this regard, it will be possible to identify the micro- and macro-biomes associated with treatment outcomes falling or lacking within the sustainable (Quadrant B, best-case), unsustainable (Quadrant C, worst-case), or requiring specific modification to achieve sustainable (Quadrants A and D) soil health (Figure 2). Since there are well-developed genetic markers for many soil microbiomes that are part of the biophysicochemical process [58,59,60,61], knowing where the SHIs fall within the sustainability quadrants could lead towards identifying soil health outcomes from a single core of soil. This, in turn, could accelerate the development of the highly needed micro to global scale of soil health assessment practices [9,47,48,49,50,51,52,53].

5. Conclusions

This study introduces a new IPE model that considers the relationship between WAFG of all beneficial nematodes (x-axis) and SOM, pH and crop yield (y-axis) as SHIs simultaneously and identifies outcomes from best-to-worst case scenarios for soil health conditions and overall sustainability. Data from the effects of AC and PC based compost applied at 1× (standard), 1.5× and 2× rates of N/ha and on beneficial nematodes, SOM and pH, and yield of a processing carrot cultivar planted in a field with sandy clay loam soil over three growing seasons were used to test the IPE model. Results that were mostly not statistically significant or varied by time using mean separation analysis and difficult to make sense of were separated by the IPE model into clusters of either sustainable, unsustainable, or requiring specific actions to get to a sustainable condition. Within the compost treatments that resulted in the quadrant of sustainable soil health outcome, the IPE model identified all of the AC treatments and PC at 2× had the best integrated efficiency outcomes across the SHIs. Thus, clearly delineating soil health conditions into sustainable, unsustainable, or requiring specific actions to get to a sustainable state. In addition, the IPE model provides a platform where other biophysicochemical process-driven SHIs could be integrated.

Supplementary Materials

The following are available online at https://www.mdpi.com/article/10.3390/soilsystems6020035/s1, Table S1: Effects of amending sandy clay loam soil with either animal (AC) and plant (PC) based compost applied at 135, 203 or 270 kg N/ha planted with processing cultivar on soil organic matter as percent of control at planting (0) and at harvest during 2012–2013 growing seasons. Untreated check and urea containing standard N rate of 135 kg N/ha served as controls. The harvest dates were 132 in 2012 and 133 DAP in 2013. Table S2: Effects of amending sandy clay loam soil with either animal (AC) and plant (PC) based compost applied at 135, 203 or 270 kg N/ha planted with processing cultivar on soil pH as percent of control at planting (0) and at harvest during 2012–2013 growing seasons. Untreated check and urea containing standard N rate of 135 kg N/ha served as controls. The harvest dates were 132 in 2012 and 133 DAP in 2013. Table S3: Effects of amending sandy clay loam soil with either animal (AC) and plant (PC) based compost applied at 135, 203 or 270 kg N/ha planted with processing cultivar on marketable carrot yield as percent of control at harvest during 2012–2014 growing seasons. Untreated check and urea containing standard N rates of 135 kg N/ha served as controls. The harvest dates were 132 in 2012 and 133 DAP in 2013 and 2014. Table S4: Effects of amending sandy clay loam soil with either animal (AC) and plant (PC) based compost applied at 135, 203 or 270 kg N/ha planted with processing cultivar on unmarketable carrot yield as percent of control at harvest during 2012–2014 growing seasons. Untreated check and urea containing standard N rate of 135 kg N/ha served as controls. The harvest dates were 132 in 2012 and 133 DAP in 2013 and 2014.

Author Contributions

Conceptualization, A.H.; data collection and analysis, A.H.; writing—original draft preparation, A.H.; writing—review and editing, H.M, A.N.K. and P.S.G.; project administration, H.M.; funding acquisition, H.M. All authors reviewed the manuscript. All authors have read and agreed to the published version of the manuscript.

Funding

The project was funded by NIFA through Hatch Project #1792 and grants from the Project GREEEN (state initiative), Michigan Carrot Commission and Michigan Vegetable Council to the last author.

Institutional Review Board Statement

Not applicable.

Informed Consent Statement

Not applicable.

Data Availability Statement

Data will be made available on request.

Acknowledgments

The authors thank three anonymous reviewers for their highly critical, but very objective reviews of the manuscript.

Conflicts of Interest

The authors declare no conflict of interest. The funders had no role in the design of the study; in the collection, analyses, or interpretation of data; in the writing of the manuscript, or in the decision to publish the results.

References

  1. Bulluck, L.R., III; Barker, K.R.; Ristaino, J.B. Influences of organic and synthetic soil fertility amendments on nematode trophic groups and community dynamics under tomatoes. Appl. Soil Ecol. 2002, 21, 233–250. [Google Scholar] [CrossRef]
  2. Doran, J.W.; Zeiss, M.R. Soil health and sustainability: Managing the biotic component of soil quality. Appl. Soil Ecol. 2000, 15, 3–11. [Google Scholar] [CrossRef] [Green Version]
  3. Melakeberhan, H. Effect of starter nitrogen on soybeans under Heterodera glycines infestation. Plant Soil 2007, 301, 111–121. [Google Scholar] [CrossRef]
  4. Neher, D. Ecology of plant and free-living nematodes in natural and Agricultural soil. Annu. Rev. Phytopathol. 2010, 48, 371–394. [Google Scholar] [CrossRef] [Green Version]
  5. Wang, K.H.; McSorley, R.; Kokalis-Burelle, N. Effects of cover cropping, solarization, and soil fumigation on nematode communities. Plant Soil 2006, 286, 229–241. [Google Scholar] [CrossRef]
  6. Habteweld, A.; Brainard, D.; Kravchenko, A.; Grewal, P.S.; Melakeberhan, H. Effects of integrated application of plant-based compost and urea on soil food web, soil properties, and yield and quality of a processing carrot cultivar. J. Nematol. 2020, 52, e2020-111. [Google Scholar] [CrossRef]
  7. United Sates Department of Agriculture, Natural Resource Conservation Service/Soil Health. 2018. Available online: https://www.nrcs.usda.gov/wps/portal/nrcs/main/soils/health/ (accessed on 11 February 2022).
  8. Lal, R. Soil Health and Climate Change: An Overview. In Soil Health and Climate Change; Singh, B.P., Cowie, A.L., Chan, K.Y., Eds.; Springer: Berlin/Heidelberg, Germany; Dordrech, The Netherlands; London, UK; New York, NY, USA, 2011; pp. 3–24. [Google Scholar]
  9. Melakeberhan, H.; Bonito, G.; Kravchenko, A.N. Application of nematode community analyses-based models towards identifying sustainable soil health management outcomes: A Review of the concepts. Soil Syst. 2021, 5, 32. [Google Scholar] [CrossRef]
  10. Carrera, L.M.; Buyer, J.S.; Vinyard, B.; Abdul-Baki, A.A.; Sikora, L.J.; Teasdale, J.R. Effects of cover crops, compost and manure amendments on soil microbial community structure in tomato production systems. Appl. Soil Ecol. 2007, 37, 247–255. [Google Scholar] [CrossRef]
  11. Collins, H.P.; Alva, A.; Bydston, R.A.; Cochran, R.L.; Hamm, P.B.; McGuire, A.; Riga, E. Soil microbial, fungal, and nematode responses to soil fumigation and cover crops under potato production. Biol. Fertil. Soils 2006, 42, 247–257. [Google Scholar] [CrossRef]
  12. García-Orenes, F.; Morugán-Coronado, A.; Zornoza, R.; Scow, K. Changes in soil microbial community structure influenced by agricultural management practices in a Mediterranean agro-ecosystem. PLoS ONE 2013, 8, e80522. [Google Scholar] [CrossRef]
  13. Kovacs-Hostyanszki, A.; Elek, Z.; Balazs, K.; Centeri, C.; Falusi, E.; Jeanneret, P.; Penksza, K.; Podmaniczky, L.; Szalkovszki, O.; Baldi, A. Earthworms, spiders and bees as indicators of habitat quality and management in low-input farming region—A whole farm approach. Ecol. Indic. 2013, 33, 111–120. [Google Scholar] [CrossRef] [Green Version]
  14. Melakeberhan, H. Fertiliser use efficiency of soybean cultivars infected with Meloidogyne incognita and Pratylenchus penetrans. Nematology 2006, 8, 129–137. [Google Scholar] [CrossRef]
  15. Melakeberhan, H. Assessing cross-disciplinary efficiency of soil amendment for agro-biologically, economically, and ecologically integrated soil health management. J. Nematol. 2010, 42, 73–77. [Google Scholar] [PubMed]
  16. Bongers, T.; Bongers, M. Functional diversity of nematodes. Appl. Soil Ecol. 1998, 10, 239–251. [Google Scholar] [CrossRef]
  17. Ferris, H.; Bongers, T.; De Goede, R.G.M. A framework for soil food web diagnostics: Extension of the nematode faunal analysis concept. Appl. Soil Ecol. 2001, 18, 13–29. [Google Scholar] [CrossRef]
  18. Melakeberhan, H.; Maung, Z.Z.; Lartey, I.; Yildiz, S.; Gronseth, J.; Qi, J.; Karuku, G.N.; Kimenju, J.W.; Kwoseh, C.; Adjei-Gyapong, T. Nematode Community-Based Soil Food Web Analysis of Ferralsol, Lithosol and Nitosol Soil Groups in Ghana, Kenya and Malawi Reveals Distinct Soil Health Degradations. Diversity 2021, 13, 101. [Google Scholar] [CrossRef]
  19. Habteweld, A.; Brainard, D.; Kravchenko, A.; Grewal, P.S.; Melakeberhan, H. Characterization of nematode communities in carrot fields and their bioindicator role for soil health. Nematropica 2020, 50, 200–210. [Google Scholar]
  20. Yeates, G.W.; Ferris, H.; Moens, T.; Van Der Putten, W. The role of nematodes in ecosystems. In Nematodes as Environmental Bioindicators; Wilson, M.J., Kakouli-Duate, T., Eds.; CABI: Wallingford, UK, 2009; pp. 1–44. [Google Scholar]
  21. Glavatska, O.; Muller, K.; Boutenschoen, O.; Schmalwasser, A.; Kandeler, E.; Scheu, S.; Totsche, K.U.; Ruess, L. Disentangling the root- and detritus-based food chain in the micro-food webs of an arable soil by plant removal. PLoS ONE 2017, 13, e0180264. [Google Scholar] [CrossRef] [Green Version]
  22. Hunt, H.W.; Coleman, D.C.; Ingham, E.R.; Ingham, R.E.; Elliott, E.T.; Moore, J.C.; Rose, S.L.; Reid, C.P.P.; Morley, C.R. The detrital food web in a shortgrass prairie. Biol. Fertil. Soils 1987, 3, 57–68. [Google Scholar] [CrossRef]
  23. Jangid, K.; Williams, M.A.; Franzluebbers, A.J.; Sanderlin, J.S.; Reeves, J.H.; Endale, M.B.; Coleman, D.C.; Whitman, W.B. Relative impacts of land-use, management intensity and fertilization upon soil microbial community structure in agricultural systems. Soil Biol. Biochem. 2008, 40, 2843–2853. [Google Scholar] [CrossRef]
  24. Ferris, H.; Tuomisto, H. Unearthing the role of biological diversity in soil health. Soil Biol. Biochem. 2015, 85, 101–109. [Google Scholar] [CrossRef]
  25. Ingham, R.E.; Trofymow, J.A.; Ingham, E.R.; Coleman, D.C. Interactions of bacteria, fungi, and their nematode grazers: Effects on nutrient cycling and plant growth. Ecol. Monogr. 1985, 55, 119–140. [Google Scholar] [CrossRef]
  26. Sánchez-Moreno, S. Biodiversity and soil health: The role of the soil food web in soil fertility and suppressiveness to soil-borne diseases. Acta Hortic. 2018, 1196, 95–104. [Google Scholar] [CrossRef]
  27. Domene, X.; Mattana, S.; Sanchez-Moreno, S. Biochar addition rate determines contrasting shifts in soil nematode trophic groups in outdoor mesocosms: An appraisal of underlying mechanisms. Appl. Soil Ecol. 2021, 158, 103788. [Google Scholar] [CrossRef]
  28. Adesemoye, A.O.; Kloepper, J.W. Plant-microbe interactions in enhanced fertilizer-use efficiency-Mini-review. Appl. Microbiol. Biotechnol. 2009, 85, 1–12. [Google Scholar]
  29. Baligar, V.C.; Fageria, N.K.; He, Z.L. Nutrient use efficiency in plants. Comm. Soil Sci. Plant Anal. 2001, 32, 921–950. [Google Scholar] [CrossRef]
  30. Fixen, P.; Brentrup, F.; Bruulsema, T.W.; Garcia, F.; Norton, R.; Zingore, S. Nutrient/fertilizer use efficiency: Measurements, current situation and trends. In Managing Water and Fertilizer for Sustainable Agricultural Intensification, 1st ed.; Drechsel, P., Heffer, P., Magen, H., Mikkelsen, R., Wichelns, D., Eds.; International Fertilizer Industry Association (IFA); International Water Management Institute (IWMI); International Plant Nutrition Institute (IPNI); International Potash Institute (IPI): Paris, France, 2015; pp. 8–38. [Google Scholar]
  31. Olk, D.C.; Cassman, K.G.; Simbaha, G.; Sta Cruz, P.C.; Abdulrachman, S.; Nagarajan, R.; Tan, P.S.; Satawathananon, S. Interpreting fertilizer-use efficiency in relation to soil nutrient-supplying capacity, factor productivity, and agronomic efficiency. Nutr. Cycl. Agroecosyst. 1999, 53, 35–41. [Google Scholar] [CrossRef]
  32. Ferguson, R.B. Groundwater quality and nitrogen use efficiency in Nebraska’s central platte river valley. J. Environ. Qual. 2015, 44, 449–459. [Google Scholar] [CrossRef] [Green Version]
  33. Melakeberhan, H.; Avendaño, M.F. Spatio-temporal consideration of soil conditions and site-specific management of nematodes. Precis. Agric. 2008, 9, 341–354. [Google Scholar] [CrossRef]
  34. Habteweld, A.W. Assessing the Impact of Compost Amendment for Managing Nematodes and the Health of Mineral Soil under carrot Production. Ph.D. Thesis, Michigan State University, East Lansing, MI, USA, 2015. Available online: http://search.proquest.com.proxy1.cl.msu.edu/docview/1728124437?pq-origsite=summon (accessed on 20 March 2022).
  35. Habteweld, A.W.; Brainard, D.C.; Kravchenko, A.N.; Grewal, P.S.; Melakeberhan, H. Effects of plant and animal waste-based compost amendments on soil food web, soil properties, and yield and quality of fresh market and processing carrot cultivars. Nematology 2018, 20, 147–168. [Google Scholar] [CrossRef]
  36. Anon, Soil Survey of Ingham County, Michigan. United State Department of Agriculture Soil Conservation Service in Cooperation with Michigan Agricultural Experimental Station, East Lansing, MI, USA, 1977. Available online: https://www.nrcs.usda.gov/Internet/FSE_MANUSCRIPTS/michigan/inghamMI1979/inghamME1979.pdf (accessed on 20 March 2022).
  37. Anon, United States Standards for Grade of Topped Carrots. United State Department of Agriculture, Washington, DC, USA, 1965. Available online: http://www.ipt.us.com/wp-content/uploads/2009/02/carrots-topped.pdf (accessed on 20 March 2022).
  38. Nelson, E.W.; Sommers, L.E. Total carbon, organic carbon, and organic matter. In Methods of Soil Analysis Part III; Sparks, D.L., Ed.; Soil Science Society of America: Madison, WI, USA, 1996; pp. 961–1010. [Google Scholar]
  39. Nelson, D. Determination of Ammonium in KCl Extracts of Soils by the Salicylate Method. Commun. Soil Sci. Plant Anal. 1983, 14, 1051–1062. [Google Scholar] [CrossRef]
  40. Avendaño, F.; Schabenberger, O.; Pierce, F.J.; Melakeberhan, H. Geostatistical analysis of field spatial distribution patterns of soybean cyst nematode. J. Agron. 2003, 95, 936–948. [Google Scholar] [CrossRef]
  41. Melakeberhan, H.; Maung, Z.T.Z.; Lee, C.-L.; Poindexter, S.; Stewart, J. Soil type-driven variable effects on cover- and rotation crops, nematodes and soil food web in sugar beet fields reveal a roadmap for developing healthy soils. Eur. J. Soil Biol. 2018, 85, 53–63. [Google Scholar] [CrossRef]
  42. Bongers, T. De Nematoden van Nederland. KNNV-bibliotheekuitgave 46; Pirola: Schoorl, The Netherlands, 1994. [Google Scholar]
  43. SAS Institute Inc. SAS OnlineDoc 9.3; SAS Institute Inc.: Cary, NC, USA, 2012. [Google Scholar]
  44. Li, X.; Lewis, E.E.; Liu, Q.; Li, H.; Bai, C.; Wang, Y. Effects of long-term continuous cropping on soil nematode community and soil condition associated with replant problem in strawberry habitat. Sci. Rep. 2016, 6, 30466. [Google Scholar] [CrossRef] [PubMed] [Green Version]
  45. Melakeberhan, H. Effects of nutrient source on the physiological mechanisms of Heterodera glycines and soybean genotypes interactions. Nematology 1999, 1, 113–120. [Google Scholar] [CrossRef]
  46. Walker, G.E. Association between carrot defects and nematodes in South Australia. Aust. Plant Pathol. 2004, 33, 579–584. [Google Scholar] [CrossRef]
  47. Emery, S.M.; Reid, M.L.; Bell-Dereske, L.; Gross, K.L. Soil mycorrhizal and nematode diversity vary in response to bioenergy crop identity and fertilization. Glob. Chang. Biol. Bioenergy 2017, 9, 1644–1656. [Google Scholar] [CrossRef] [Green Version]
  48. Fine, A.K.; van Es, H.M.; Schindelbeck, R.R. Statistics, Scoring Functions, and Regional Analysis of a Comprehensive Soil Health Database. Soil Sci. Soc. Am. J. 2017, 81, 589. [Google Scholar] [CrossRef]
  49. Jian, J.; Du, X.; Stewart, R.D. A database for global soil health assessment. Nat. Sci. Data 2020, 7, 16. [Google Scholar] [CrossRef] [PubMed] [Green Version]
  50. Kihara, J.; Bolo, P.; Kinyua, M.; Nyawira, S.S.; Sommer, R. Soil health and ecosystem services: Lessons from sub-Saharan Africa. Geoderma 2019, 370, 141342. [Google Scholar] [CrossRef]
  51. Liu, T.; Hu, F.; Li, H. Spatial ecology of soil nematodes: Perspectives from global to micro scales. Soil Biol. Biochem. 2019, 137, 107565. [Google Scholar] [CrossRef]
  52. Moore-Kucera, J.; Azarenko, A.N.; Brutcher, L.; Chozinski, A.; Myrold, D.D.; Ingham, R. In search of key soil functions to assess soil community management for sustainable sweet cherry orchards. HortScience 2008, 43, 38–44. [Google Scholar] [CrossRef] [Green Version]
  53. Wander, M.M.; Cihacek, L.J.; Coyne, M.; Drijber, R.A.; Grossman, J.M.; Gutknecht, J.L.M.; Horwath, W.R.; Jagandamma, S.; Olk, D.C.; Ruark, M.; et al. Developments in agricultural soil quality and health: Reflections by the research committee on soil organic matter management. Front. Environ. Sci. 2019, 7, 1–9. [Google Scholar] [CrossRef] [Green Version]
  54. World Fertilizer Trends and Outlook to 2022. FAO: Rome, Italy, 2018. Available online: File:///E:/MSIKAProjectPublications/Manuscripts/Review/Reading/FAO%20World%20Fertilizer%20Data%20CA6746EN.pdf (accessed on 11 February 2022).
  55. IPCC. Climate Change 2013: The Physical Science Basis. Contribution of Working Group I to the Fifth Assessment Report of the Intergovernmental Panel on Climate Change; Stocker, T.F., Qin, D., Plattner, G.-K., Tignor, M., Allen, S.K., Boschung, J., Nauels, A., Xia, Y., Bex, V., Midgley, P.M., Eds.; Cambridge University Press: Cambridge, UK; New York, NY, USA, 2013; p. 1535. [Google Scholar]
  56. The 4R Principles of Nutrient Management—Do You Really Know Them? Meister Media Worldwide, Willoughby, OH, USA, 2021. Available online: https://www.croplife.com/special-reports/crop-nutrition/4r-principles-nutrient-management-really-know/ (accessed on 11 February 2022).
  57. Basso, B.G.; Zhang, S.J.; Robertson, G.P. Yield stability analysis reveals sources of large-scale nitrogen loss from the US Midwest. Nat. Sci. Rep. 2019, 10, 5774. [Google Scholar] [CrossRef] [PubMed]
  58. Kravchenko, A.N.; Guber, A.K.; Rasavi, B.S.; Koestel, J.; Quigley, M.Y.; Robertson, G.P.; Kuzyakov, Y. Microbial spatial footprint as a driver of soil carbon stabilization. Nat. Commun. 2019, 10, 3121. [Google Scholar] [CrossRef] [Green Version]
  59. Takahashi, S.; Omita, J.; Nishioka, K.; Hisada, T.; Nishijima, M. Development of a prokaryotic universal primer for simultaneous analysis of bacteria and archaea using next-generation sequencing. PLoS ONE 2014, 9, e105592. [Google Scholar] [CrossRef] [Green Version]
  60. Bonito, G.; Hameed, K.; Krishnan, J.; Ventura, R.; Vilgalys, R. Isolating a functionally relevant guild of fungi from the root microbiome of Populus. Fungal Ecol. 2016, 22, 35–42. [Google Scholar] [CrossRef] [Green Version]
  61. Longley, R.; Noel, Z.A.; Benucci, G.M.N.; Chilvers, M.I.; Trail, F.; Bonito, G. Crop management impacts the soybean (Glycine max) microbiome. Front. Microbiol. 2020, 11, 1116. [Google Scholar] [CrossRef]
Figure 1. Modified fertilizer use efficiency (FUE) model analysis quadrants separating best (green), worst (red) and variable (olive green) outcomes of ecosystem service (ES) and beneficial nematodes (BN; [9]) as indicators of the biological component of the SFW. Increased (▲) and decreased (▼) responses and what they mean (=) are indicated. 100% on either axis is a control.
Soilsystems 06 00035 g001
Figure 2. A conceptual illustration of the Integrated Production Efficiency (IPE) model that uses the relationship between changes in Weighted abundance of functional guilds (WAFG, x-axis) of nematodes and soil health indicators (SHI, y-axis) expressed as a percent of control to identify outcomes from best-to-worst cases for integrated efficiency for WAFG, SHI, and soil health and overall sustainability of the outcomes. Increases (▲) and decreases (▼) in the SHI and WAFG are indicated. Data points that fall above the controls (100%) will show an increase/improvement in tested SHIs (A and B) and WAFG (B and D). Data points in Quadrant B where a desired SHI and WAFG increase would be best-case scenario for soil health and sustainability of the outcome. Data points in Quadrant C where SHI and WAFG decrease would be worst-case scenario for soil health, environmental and economic outcomes and unsustainable. Data points in Quadrants A and D provide a choice of improving WAFG and SHI, respectively, to achieve soil health.
Soilsystems 06 00035 g002
Figure 3. Integrated Production Efficiency (IPE) of amending sandy clay loam soil with either animal (AC) or plant (PC) based compost applied at 135, 203 or 270 kg N/ha planted with processing cultivar on organic matter (y-axis) and weighted abundance of functional guilds (WAFG, x-axis) of nematodes at planting in May 2012 (May 12) and harvest in October 2012 (Oct 12) and 2013 (Oct 13) growing seasons fitted to the IPE model. Numbers 1–3 refer PC at a rate of 135, 203 and 270 kg N/ha, respectively and 4–6 refer AC at a rate of 135, 203 and 270 kg N/ha, respectively, 7 and 8 refer urea and non-amended check, respectively. * Treatments with subscripts and superscripts asterisks (*) indicate significantly different from 100% for WAFG and soil organic matter, respectively, using one-tailed t-test at α = 0.05. The soil amendment rates and the organic matter data presented here are the same as those in Table S1. The WAFG data presented here are the same as those in Table 1.
Soilsystems 06 00035 g003
Figure 4. Integrated Production Efficiency (IPE) of amending sandy clay loam soil with either animal (AC) or plant (PC) based compost applied at 135, 203 or 270 kg N/ha planted with processing cultivar on soil pH (y-axis) and weighted abundance of functional guilds (WAFG, x-axis) of nematodes at planting in May 2012 (May-12) and harvest in October 2012 (Oct-12) and 2013 (Oct-13) growing seasons fitted the IPE model. Numbers 1–3 refer PC at a rate of 135, 203 and 270 kg N/ha, respectively and 4–6 refer AC at a rate 135, 203 and 270 kg N/ha, respectively, 7 and 8 refer urea and non-amended check, respectively. * Treatments with subscripts and superscripts asterisks (*) indicate significantly different form 100% for WAFG and soil pH, respectively, using one-tailed t-test at α = 0.05. The soil amendment rates and the soil pH data presented here are the same as those in Table S2. The WAFG data presented here are the same as those in Table 1.
Soilsystems 06 00035 g004
Figure 5. Integrated Production Efficiency (IPE) of amending sandy clay loam soil with either animal (AC) or plant (PC) based compost applied at 135, 203 or 270 kg N/ha on marketable carrot (y-axis) and weighted abundance of functional guilds (WAFG, x-axis) of nematodes at harvest in October 2012 (Oct-12), 2013 (Oct-13) and 2014 (Oct-14) growing seasons fitted to the IPE model. Numbers 1–3 refer PC at a rate of 135, 203 and 270 kg N/ha, respectively and 4–6 refer AC at a rate 135, 203 and 270 kg N/ha, respectively, 7 and 8 refer urea and non-amended check, respectively. * Treatments with subscripts and superscripts asterisks (*) indicate significantly different form 100% for WAFG and marketable carrots, respectively, using one-tailed t-test at α = 0.05. The soil amendment rates and the marketable carrot data presented here are the same as those in Table S3. The WAFG data presented here are the same as those in Table 1.
Soilsystems 06 00035 g005
Figure 6. Integrated Production Efficiency (IPE) of amending sandy clay loam soil with either animal (AC) or plant (PC) based compost applied at 135, 203 or 270 kg N/ha on unmarketable carrot (y-axis) and weighted abundance of functional guilds (WAFG, x-axis) of nematodes at harvest in October 2012 (Oct-12), 2013 (Oct-13) and 2014 (Oct-14) growing seasons fitted to the IPE model. Numbers 1–3 refer PC at a rate of 135, 203 and 270 kg N/ha, respectively and 4–6 refer AC at a rate 135, 203 and 270 kg N/ha, respectively, 7 and 8 refer urea and non-amended check, respectively. * Treatments with subscripts and superscripts asterisks (*) indicate significantly different form 100% for WAFG and unmarketable carrots, respectively, using one-tailed t-test at α = 0.05. The soil amendment rates and the unmarketable carrot data presented here are the same as those in Table S4. The WAFG data presented here are the same as those in Table 1.
Soilsystems 06 00035 g006
Table 1. Effects of amending sandy clay loam soil with either animal (AC) or plant (PC) based compost applied at 135, 203 or 270 kg N/ha planted with processing cultivar on weighted abundance of functional guilds (WAFG) as percent of untreated control at planting (0) and at harvest during 2012–2014 growing seasons. Untreated check and urea containing standard N rate of 135 kg N/ha served as controls. The harvest dates were 132 in 2012 and 133 DAP in 2013 and 2104.
AmendmentYears and Days after Planting (DAP)
SourceN201220132014
rateDAP DAP DAP
kg/ha013201330133
PC135179 aA *89 abAB51 bB166 aAB87 abA148 abAB
20383 bB143 aAB119 aA175 aAB111 aA174 aA
27093 bB114 abAB44 cB220 aAB26 dB98 bcB
AC135139 abAB129 abcAB95 bcAB270 aA70 cA173 abA
20378 bB92 bAB90 bAB220 aAB82 bA142 aAB
270103 bcB157 abA60 cB272 aA102 bcA158 aA
Urea13587 aB83 aB85 aAB103 aB116 aA77 aB
Check0NANANANANANA
* Means with different lower case letters in rows and different upper case letters within columns indicate significant difference at p < 0.05 using Fisher’s LSD. Data in this table are the independent variable (x-axis) shown on Figure 3, Figure 4, Figure 5 and Figure 6. NA = Not available because data are expressed as percent of the respective controls.
Publisher’s Note: MDPI stays neutral with regard to jurisdictional claims in published maps and institutional affiliations.

